Embed Size (px)
Citation preview

PAPER IDENTIFICATION NUMBER: TBME-00375-2005 1
Utility of Approximate Entropy from Overnight
Pulse Oximetry Data in the Diagnosis of the
Obstructive Sleep Apnea Syndrome
Roberto Hornero1, Member, IEEE, Daniel Álvarez1, Daniel Abásolo1, Member, IEEE, Félix del
Campo2, and Carlos Zamarrón3
1E.T.S. Ingenieros de Telecomunicación, University of Valladolid, Spain
2Hospital del Río Hortega, Valladolid, Spain
3Hospital Clínico Universitario, Santiago de Compostela, Spain.
AUTHOR’S ADDRESS: Roberto Hornero
E.T.S. Ingenieros de Telecomunicación
University of Valladolid
Camino del Cementerio s/nº
47011 - Valladolid (Spain)
Phone: +34 983 185570
Fax: +34 983 423667

PAPER IDENTIFICATION NUMBER: TBME-00375-2005 2
E-mail: [email protected]
Abstract— Approximate Entropy (ApEn) is a family of statistics introduced as a
quantification of regularity in time series without any a priori knowledge about the system
generating them. The aim of this preliminary study was to assess whether a time series
analysis of arterial oxygen saturation (SaO2) signals from overnight pulse oximetry by
means of ApEn could yield essential information on the diagnosis of obstructive sleep apnea
(OSA) syndrome. We analyzed SaO2 signals from 187 subjects: 111 with a positive
diagnosis of OSA and 76 with a negative diagnosis of OSA. We divided our data in a
training set (44 patients with OSA Positive and 30 patients with OSA Negative) and a test
set (67 patients with OSA Positive and 46 patients with OSA Negative). The training set
was used for algorithm development and optimum threshold selection. Results showed that
recurrence of apnea events in patients with OSA determined a significant increase in ApEn
values. This method was assessed prospectively using the test dataset, where we obtained
82.09% sensitivity and 86.96% specificity. We conclude that ApEn analysis of arterial
oxygen saturation from pulse oximetric recording could be useful in the study of OSA.
Index Terms— Apnea, approximate entropy, arterial oxygen saturation, overnight pulse
oximetry, regularity,

PAPER IDENTIFICATION NUMBER: TBME-00375-2005 3
I. INTRODUCTION
bstructive Sleep Apnea (OSA) syndrome is a respiratory disorder characterized by recurrent
airflow obstruction caused by total or partial collapse on the upper airway [1]. Epidemiological
studies in middle-aged populations have shown an OSA prevalence of 4% in males and 2% in
females [2]. OSA has major health implications ranging from traffic accident to serious cardiac
arrhythmias [3]. OSA is associated with increased risks of hypertension, myocardial infarction,
and with increased mortality rates [4], [5].
At present, the most widely accepted diagnostic test for OSA syndrome is overnight
polysomnography (PSG) [6]. PSG consists in the measurement and recording of several signals
used to analyze sleep and breathing. The expensive and time-consuming nature of PSG prompts
many sleep centers to perform an initial screening test in order to reduce the number of PSGs
needed. Therefore, several strategies have been developed to reduce the number of sleep
recordings, including sleep questionnaires, ambulatory recordings and simplified multi-channel
systems. In sleep medicine, pulse oximetry is an essential tool for tracking the fluctuation in the
arterial oxygen saturation (SaO2) signals, which are characteristics for unstable ventilation in
patients with sleep apnea. Pulse oximetry has provided early insights into sleep related breathing
disturbances [7], and it has opened the way for subsequent systematic investigations of sleep
apnea [8]. Thus, overnight pulse oximetry has been proposed as a simpler alternative to PSG in
the diagnosis of OSA because it is readily available, it is relatively inexpensive and could
potentially meet the large demand for diagnostic testing [9-12]. It can be easily done at home and
repeated, which is not the case with PSG.
There are many quantitative indexes derived from overnight pulse oximetry in the diagnosis of
O

PAPER IDENTIFICATION NUMBER: TBME-00375-2005 4
OSA. The most widely used include the number of oxyhemoglobin desaturations below a certain
threshold, usually 3 or 4 % decline from baseline [13-16], or the cumulative time spent below a
SaO2 of 90 % [17, 18]. In this study, we estimated the entropy of SaO2 to predict the OSA
syndrome.
Entropy is a concept addressing randomness and predictability, with greater entropy often
associated with more randomness and less system order. Kolmogorov-Sinai entropy (K-S
entropy), developed by Kolmogorov and expanded upon by Sinai, allows classifying
deterministic dynamical systems by rate of information generation [19]. Unfortunately, K-S
entropy was not developed for statistical applications and diverges to a value of infinity when the
signal is contaminated by the slightest noise. A practical solution to this problem has been put
forward using a recently developed family of statistics named Approximate Entropy (ApEn) [20].
Although there are many other entropy estimators, several properties of ApEn facilitate its utility
for empirical time series analysis: it is nearly unaffected by noise below a de facto specified filter
level; it can be applied to short time series and it is finite for stochastic, noisy deterministic and
composite processes [21].
The goal of this study was to assess whether a time series analysis of arterial oxygen saturation
(SaO2) signals by means of ApEn could yield essential information on the diagnosis of OSA
syndrome.
II. SUBJECTS
One hundred and eighty seven subjects took part in this prospective study. Patients were
recruited from the outpatient clinic. There were 147 males (78.61%) and 40 females (21.39%)
with a mean ± standard deviation (SD) age of 57.97 ± 12.84 years and mean body mass index

PAPER IDENTIFICATION NUMBER: TBME-00375-2005 5
(BMI) of 29.54 ± 5.51. All subjects were suspected of having OSA because of daytime
hypersomnolence, loud snoring, nocturnal choking and awakenings, or apneic events (or all four
symptoms) reported by the subject or a bedmate.
Sleep studies were carried out usually from midnight to 08:00 AM in the Sleep Unit of
Hospital Clínico Universitario in Santiago de Compostela, Spain. The Review Board on Human
Studies at this institution approved the protocol, and all subjects gave their informed consent to
participate in the study. Patients were evaluated by an overnight pulse oximetry test in
conjunction with a simultaneous conventional polysomnographic (PSG) study. This technique
consisted in continuous monitoring using a polygraph (Ultrasom Network, Nicolet, Madison, WI,
U.S.A.) and included EEG, electro-oculogram, chin electromyogram, air flow (three-port
thermistor), ECG and measurement of chest wall movement. The PSG register was analyzed over
periods of 30 s and during sleep phases I, II, III, IV and rapid eye movement, according to the
system of Rechtschaffen and Kales [22]. Apnea was defined as the absence of air flow for more
than 10 s, and hypopnea as a decrease in respiratory flow of at least 50%, accompanied by a
decrease of more than 4% in the saturation of hemoglobin. The average apnea-hypopnea index
(AHI) was calculated for hourly periods of sleep. In this study, an AHI ≥ 10 events per hour was
considered as diagnostic of OSA. If the subject had less than 3 hours of total sleep, the sleep
study was repeated.
Recording of the arterial oxygen saturation (SaO2) was carried out using a Criticare 504
oximeter (CSI, Waukeska, WI, U.S.A.) with a finger probe, with sampling frequency of 0.2 Hz
(one sample every 5 s). The SaO2 signals were saved to separate files and processed off-line by
means of ApEn.
A positive diagnosis of OSA was confirmed in 111 (59.36%) out of 187 subjects using PSG

PAPER IDENTIFICATION NUMBER: TBME-00375-2005 6
recordings. Table I summarizes the demographic data and clinical features for all subjects under
study divided into patients with a positive diagnosis of OSA (OSA Positive group) and patients
with a negative diagnosis of OSA (OSA Negative group). There were 94 males (84.68%) and 17
females (15.32%) in the OSA Positive group, with a mean ± SD age of 58.30 ± 12.88 years and
mean body mass index (BMI) of 30.45 ± 4.92 kg/m2. The mean age in the OSA Negative group
was 57.57 ± 12.87 with a mean BMI of 28.42 ± 6.02 kg/m2. In this OSA negative group, there
were 53 males (69.74%) and 23 females (30.26%) There were no significant differences between
OSA Positive and Negative groups in mean age, mean body mass index and time recordings.
However, the OSA Positive group presented a significant increase in the number of males
(84.68% vs. 69.74%).
We divided our population randomly into a training set (74 subjects, 39.57%) and a test set
(113 subjects, 60.43%). The training set was used to develop the algorithm and to select the
optimum threshold for ApEn method. The final algorithm was then applied without further
alteration to the data from the test set. In the training set, we included 74 subjects (44 patients
with a positive diagnosis of OSA and 30 with a negative diagnosis of OSA) with a mean age of
58.25 + 12.14 years. In the test set there were 113 subjects (67 patients with a positive diagnosis of
OSA and 46 with a negative diagnosis of OSA) with a mean age of 57.91 + 13.39 years. The
demographic data and clinical features of training set and test are summarized in Table I. Fig.1
shows SaO2 data plots from nocturnal oximetry for an OSA negative subject, an apparent OSA
positive subject and an uncertain OSA positive subject.
III. METHODS
Approximate Entropy (ApEn) is a family of statistics introduced as a quantification of

PAPER IDENTIFICATION NUMBER: TBME-00375-2005 7
regularity in the data without any a priori knowledge about the system generating them [23]. It
was constructed by Pincus [20], motivated by applications to short and noisy data sets, along
thematically similar lines to K-S entropy. However, the focus was different: to provide a widely
applicable, statistically valid formula that will distinguish data sets by a measure of regularity
[20]. The observation motivating ApEn is that if joint probability measures for reconstructed
dynamics that describe each of two systems are different, then their marginal probability
distributions on a fixed partition, given by conditional probabilities, are likely different. We
typically need orders of magnitude fewer points to accurately estimate these marginal
probabilities than to accurately reconstruct the attractor measure defining the process [21].
Several properties of ApEn facilitate its utility for empirical biomedical time series analysis.
ApEn is nearly unaffected by noise below a de facto specified filter level (r), it is scale invariant
and model independent, it evaluates both dominant and subordinated patterns in data, and it
discriminates series for which clear feature recognition is difficult [21]. Moreover, it can be
applied to time series of 50 or more points with good reproducibility; it is finite for stochastic,
noisy deterministic and composite processes; and increasing values of ApEn correspond to more
irregularity in the time series [21].
Based on numerous studies, ApEn correlates with “occult” or subclinical changes often
undetected by other more classical time series means, including both moments statistics, and
spectral and correlation analyses [21]. Moreover, ApEn changes have often been seen to be
predictive of subsequent clinical changes. This has facilitated the application of ApEn to
numerous settings. Within biology and medicine, it has been used to discriminate atypical EEGs
[24] and respiratory patterns [25] from normative counterparts. Furthermore, it has been applied
to quantify the differences in apparent regularity between the heart rate interval time series of
PAPER IDENTIFICATION NUMBER: TBME-00375-2005 8
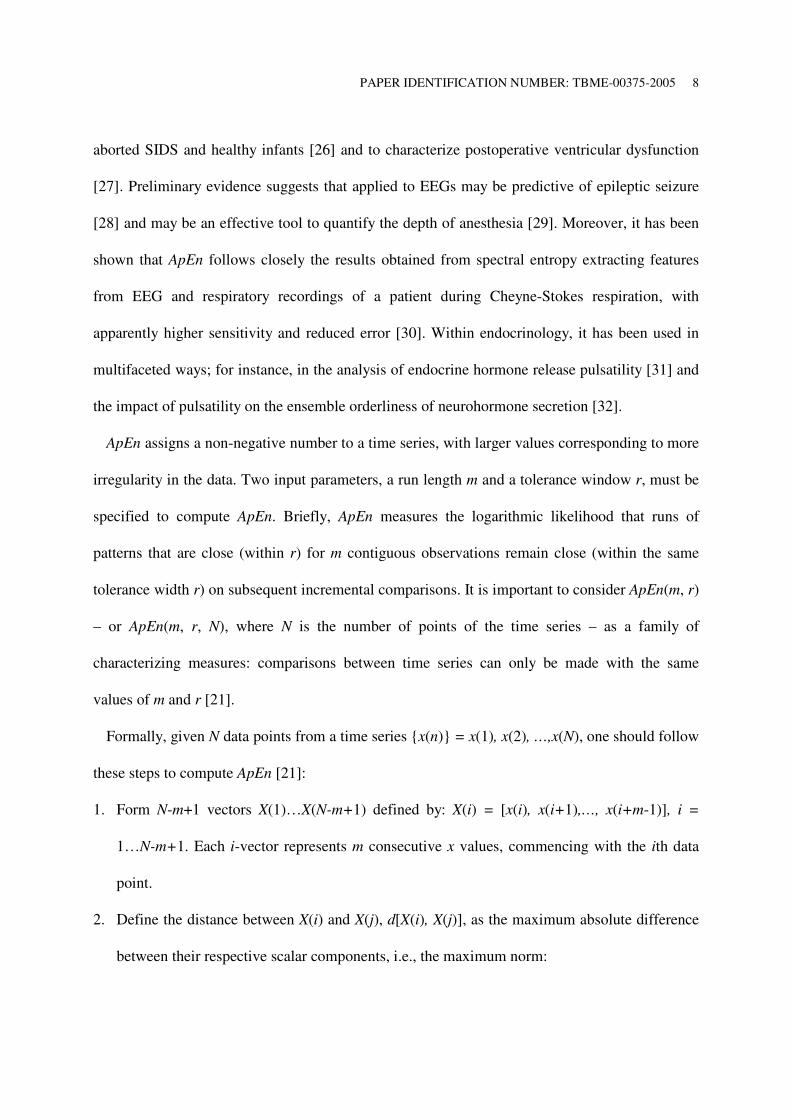
aborted SIDS and healthy infants [26] and to characterize postoperative ventricular dysfunction
[27]. Preliminary evidence suggests that applied to EEGs may be predictive of epileptic seizure
[28] and may be an effective tool to quantify the depth of anesthesia [29]. Moreover, it has been
shown that ApEn follows closely the results obtained from spectral entropy extracting features
from EEG and respiratory recordings of a patient during Cheyne-Stokes respiration, with
apparently higher sensitivity and reduced error [30]. Within endocrinology, it has been used in
multifaceted ways; for instance, in the analysis of endocrine hormone release pulsatility [31] and
the impact of pulsatility on the ensemble orderliness of neurohormone secretion [32].
ApEn assigns a non-negative number to a time series, with larger values corresponding to more
irregularity in the data. Two input parameters, a run length m and a tolerance window r, must be
specified to compute ApEn. Briefly, ApEn measures the logarithmic likelihood that runs of
patterns that are close (within r) for m contiguous observations remain close (within the same
tolerance width r) on subsequent incremental comparisons. It is important to consider ApEn(m, r)
– or ApEn(m, r, N), where N is the number of points of the time series – as a family of
characterizing measures: comparisons between time series can only be made with the same
values of m and r [21].
Formally, given N data points from a time series {x(n)} = x(1), x(2), …,x(N), one should follow
these steps to compute ApEn [21]:
1. Form N-m+1 vectors X(1)…X(N-m+1) defined by: X(i) = [x(i), x(i+1),…, x(i+m-1)], i =
1…N-m+1. Each i-vector represents m consecutive x values, commencing with the ith data
point.
2. Define the distance between X(i) and X(j), d[X(i), X(j)], as the maximum absolute difference
between their respective scalar components, i.e., the maximum norm:

PAPER IDENTIFICATION NUMBER: TBME-00375-2005 9
[ ] |)1()1(|max)(),(,...,2,1
−+−−+==
kjxkixjXiXdmk
(1)
3. For a given X(i), count the number of j (j = 1…N-m+1, j≠i) so that d[X(i), X(j)] ≤ r, denoted
as Nm(i). Then, for i=1…N-m+1,
)1/()()( +−= mNiNiC mm
r (2)
)(iCm
r measures, within a tolerance r, the frequency of patterns similar to a given one of
window length m.
4. Compute the natural logarithm of each )(iCm
r, and average it over i,
∑+−
=+−=
1
1
)(ln1
1)(
mN
i
m
r
m iCmN
rφ (3)
5. Increase the dimension to m+1. Repeat steps 1) to 4) and find )(1iC
m
r
+ and )(1 rm+φ .
6. We define Approximate Entropy by:
)()(),,( 1 rrNrmApEn mm +−= φφ (4)
The accuracy and confidence of the entropy estimate improve as the number of matches of
length m and m + 1 increase. The number of matches can be increased by choosing small m
PAPER IDENTIFICATION NUMBER: TBME-00375-2005 10
(short templates) and large r (wide tolerance). However, there are penalties for criteria that are
too relaxed [20]. For small r values, one usually achieves poor conditional probability estimates,
while for large r values, too much detailed system information is lost. To avoid a significant
contribution of noise in an ApEn calculation, one must choose r larger than most of the noise
[20].
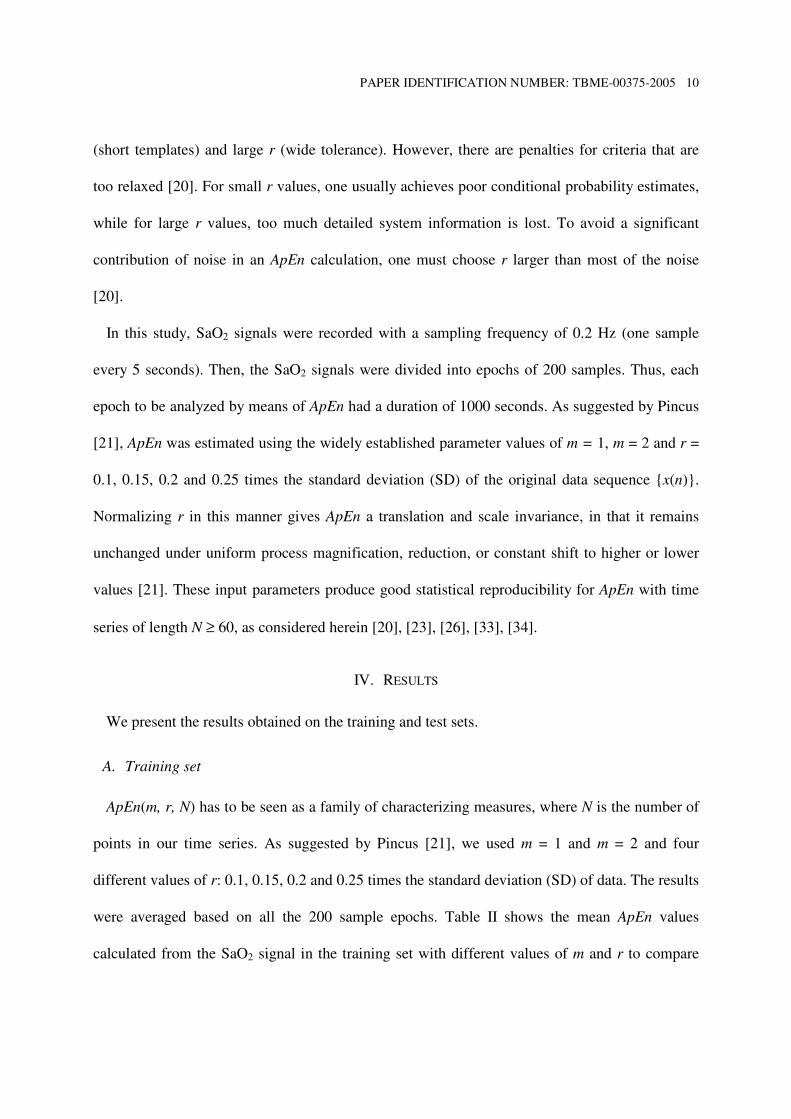
In this study, SaO2 signals were recorded with a sampling frequency of 0.2 Hz (one sample
every 5 seconds). Then, the SaO2 signals were divided into epochs of 200 samples. Thus, each
epoch to be analyzed by means of ApEn had a duration of 1000 seconds. As suggested by Pincus
[21], ApEn was estimated using the widely established parameter values of m = 1, m = 2 and r =
0.1, 0.15, 0.2 and 0.25 times the standard deviation (SD) of the original data sequence {x(n)}.
Normalizing r in this manner gives ApEn a translation and scale invariance, in that it remains
unchanged under uniform process magnification, reduction, or constant shift to higher or lower
values [21]. These input parameters produce good statistical reproducibility for ApEn with time
series of length N ≥ 60, as considered herein [20], [23], [26], [33], [34].
IV. RESULTS
We present the results obtained on the training and test sets.
A. Training set
ApEn(m, r, N) has to be seen as a family of characterizing measures, where N is the number of
points in our time series. As suggested by Pincus [21], we used m = 1 and m = 2 and four
different values of r: 0.1, 0.15, 0.2 and 0.25 times the standard deviation (SD) of data. The results
were averaged based on all the 200 sample epochs. Table II shows the mean ApEn values
calculated from the SaO2 signal in the training set with different values of m and r to compare

PAPER IDENTIFICATION NUMBER: TBME-00375-2005 11
SaO2 signals from subjects in OSA Positive and Negative groups. We obtained significant
differences (p < 0.01) with the Student’s t-test with all the chosen values of m and r. The best
results (lowest p-value) were obtained with m = 1 and r = 0.25 times the SD of the data. Larger
values of ApEn imply substantial fluctuation, or irregularity, in the time series [21]. Thus, the
smaller ApEn values in the SaO2 signals from OSA Negative group imply stronger regularity, or
persistence, than in the SaO2 signals from OSA Positive group.
We selected the optimum threshold from the training set to improve the sensitivity/specificity
pair according to the receiver operating characteristic (ROC) plots [35]. We used a computer
program developed with Matlab® that automatically selected different thresholds or cut-off points
(ApEn values) and calculated the sensitivity/specificity pair for each one of them. Sensitivity –
the true positive rate – is the proportion of patients with a positive diagnosis of OSA who test
positive (ApEn value higher than the cut-off point), whereas specificity – the true negative rate –
represents the percentage of patients with a negative diagnosis of OSA correctly recognized
(ApEn value lower than the cut-off point). The program selected the optimal threshold as the cut-
off point determined graphically from the ROC curve as the point closest to the left top point
(100% sensitivity, 100% specificity).
Fig. 2 shows this ROC curve from the training set for ApEn(m=1, r=0.25SD). We obtained an
optimum threshold l=0.77 and an area under the ROC curve of 0.94, close to the ideal setting of
a perfect diagnostic test (area under the ROC curve of 1). Moreover, we achieved 81.82%
sensitivity and 90% specificity in the training set with this optimum threshold (l = 0.77).
Therefore, we selected m = 1 and r = 0.25 times the SD of the original data sequence in the
ApEn estimation from SaO2 signals. ApEn values for OSA Positive and OSA Negative groups in
the training set are shown in Fig. 3 with the optimum threshold at l = 0.77. It can be seen that

PAPER IDENTIFICATION NUMBER: TBME-00375-2005 12
patients in OSA Negative group had lower ApEn values (0.46 ± 0.23) than patients in OSA
Positive group (1.01 ± 0.26).
B. Test set
We used the parameters chosen from the study of the training set time series: m = 1 and r =
0.25 times the SD of the time series in the ApEn estimation of SaO2 signals from the test set. Fig.
4 represents the mean ApEn values for OSA Positive and OSA Negative groups in the test set.
ApEn values were higher in the OSA Positive group (1.04 ± 0.29) than in the OSA Negative
group (0.48 ± 0.26). These results confirmed that the degree of irregularity of SaO2 signals was
higher in the OSA Positive group. Applying the t-Student test, we verified that there was a
significant difference (p < 0.01).
Moreover, we computed sensitivity and specificity in the test set with the previously selected
threshold. We achieved 82.09 % sensitivity and 86.96 % specificity with this test set.
V. DISCUSSION AND CONCLUSIONS
In this study, we analyzed the arterial oxygen saturation (SaO2) signals of 187 patients (111
with a positive diagnosis of OSA and 76 with a negative diagnosis of OSA) by means of ApEn, a
non-linear method that quantifies the regularity of time series. To avoid the optimization of all
parameters involved (method/measure parameters and threshold) on the whole data record, we
divided our data into a training set (44 patients with OSA Positive and 30 patients with OSA
Negative) and a test set (67 patients with OSA Positive and 46 patients with OSA Negative). The
training set was used for algorithm development and optimum threshold selection. The final
algorithm was then applied to the test set, where we obtained 82.09 % sensitivity and 86.96 %
specificity.

PAPER IDENTIFICATION NUMBER: TBME-00375-2005 13
Results showed that the recurrence of apnea events in patients with OSA determined a
significant increase in the ApEn values of SaO2 signals. ApEn(m=1, r=0.25SD) reflects the rate
of new pattern generation when the dimension m decreases from 2 to 1 [36]. A larger value of
ApEn means that the chance of new pattern generation is greater, so the sequence is more
irregular or complex, and vice versa. In OSA, oxygen desaturations associated with apnea events
cause fluctuations in SaO2 signal leading to high ApEn values.
Several quantitative indexes estimated from overnight pulse oximetry have been used to
predict the presence of OSA. These indexes include the number of oxyhemoglobin desaturations
below a certain threshold, usually 3 or 4 % decline from baseline [13-16], the cumulative time
spent below a SaO2 of 90 % [17,18], saturation impairment time index that integrates severity
and duration of oxygen desaturation [37], spectral analysis of SaO2 and pulse rate applied to
evaluate the presence or absence of a peak in the periodogram [38], or a measure of the
variability of the SaO2 (∆ index) [8, 18]. In these studies, the sensitivity of pulse oximetry ranged
from 88 to 98%, and the specificity from 40 to 88% if an apnea-hipopnea index (AHI) of 10 or
15 events per hour measured during polysomnography was defined as the upper limit of
normalcy. However, there are some methodological differences that do not allow comparing all
these results with our study. At present, there is not a definite standard AHI criterion for the
diagnosis of OSA with the threshold varying from 5 to 20 events per hour. Thus, there is not an
agreement on the standard threshold to diagnose OSA [18]. Some works use conservative values
and employ an AHI ≥ 15 events per hour to determine OSA, whereas other researchers diagnose
mild OSA with an AHI ≥ 5. The study by Vazquez et al. [13] reported the highest sensitivity
(98%) and specificity (88%). However, they used a definition of arousal that differs substantially
from the criteria proposed by the Atlas Task Force [39]. As a result of their definition of

PAPER IDENTIFICATION NUMBER: TBME-00375-2005 14
hypopnea, results will differ substantially from estimated in conventional studies, as it is
indicated in [18]. Other works [16-18, 37-38] achieved better sensitivity values, ranging from 88
to 98 %, than our study, but failed in specificity (from 40 to 75%). We used a training set to
develop the algorithm and to select the optimum threshold (ApEn value) to improve the
sensitivity/specificity pair according to ROC curve. With a test set, we obtained a higher
specificity (86.96%) but a lower sensitivity (82.09%) than other studies. Moreover, when
comparing our results with these previous studies on oximetry, we can confirm several aspects
about reduction of variability in the oxygen saturation signals in non-OSA subjects [8, 18]
Certain limitations that could influence our results need to be considered. Firstly, there are
some technical problems associated with oximetry for recognizing OSA [38]. For example, there
may be poor contact between the probe and the finger due to body movements, and bad regional
circulation occasionally produces signals resembling multiple falls in oxygen saturation. Mindful
of this, we examined our recordings before the analysis to see if they evidenced technical
problems. For example, we eliminated all data that registered drops to zero. From our experience,
we know these falls are generally due to finger–probe disconnections. Secondly, patients with
positive OSA were predominantly studied. Therefore, the sample may not fully represent the
population of patients referred to clinicians, and those having snoring or upper airway resistance.
A third limitation to the applicability of our method should be mentioned. We used overnight
pulse oximetry obtained simultaneously with PSG data in the sleep laboratory. This has the
advantage of eliminating such potential confounders as night to night variability of AHI, as well
as ensuring that oximetry data were collected in exactly the same environment as the PSG data.
Further analyses using overnight oximetry done in the home settings unattended by technicians
are necessary.

PAPER IDENTIFICATION NUMBER: TBME-00375-2005 15
In summary, we found that the recurrence of apnea events in patients with OSA determined a
significant increase in the ApEn values of the arterial oxygen saturation (SaO2) signals. This
method was assessed prospectively using the test dataset, where we obtained 82.09% sensitivity
and 86.96% specificity To our knowledge, this is the first study that uses ApEn to verify the
diagnostic value of oximetry recordings in OSA syndrome. We think that ApEn analysis of
nocturnal pulse oximetry recording could be a supplementary method to the conventional indexes
for diagnosis of OSA on an ambulatory basis. However, further work is now required to test the
potential value of our methodology with a larger data set.

PAPER IDENTIFICATION NUMBER: TBME-00375-2005 16
TABLE I
DEMOGRAPHIC AND CLINICAL FEATURES FOR ALL SUBJECTS UNDER STUDY, AND THE TRAINING AND TEST SETS
ALL SUBJECTS
All OSA Positive OSA Negative
Subjects (n) 187 111 76 Age (years) 57.97 ± 12.84 58.30 ± 12.88 57.57 ± 12.87 Males (%) 78.61 84.68 69.74 BMI (kg/m
2) 29.54 ± 5.51 30.45 ± 4.92 28.42 ± 6.02 Recording Time(h) 8.19 ± 0.62 8.17 ± 0.75 8.22 ± 0.33 AHI (n/h) 40.07 ± 19.64 2.04 ± 2.36
TRAINING SET
All OSA Positive OSA Negative
Subjects (n) 74 44 30 Age (years) 58.25 ± 12.14 56.73 ± 13.61 59.59 ± 10.19 Males (%) 75.68 79.55 70.00 BMI (kg/m
2) 29.62 ± 5.71 30.19 ± 5.09 28.93 ± 6.40 Recording Time(h) 8.22 ± 0.41 8.20 ± 0.49 8.25 ± 0.27 AHI (n/h) 38.11 ± 18.18 2.60 ± 2.51
TEST SET
All OSA Positive OSA Negative
Subjects (n) 113 67 46 Age (years) 57.91 ± 13.39 59.37 ± 12.38 56.03 ± 14.54 Males (%) 80.53 88.06 69.57 BMI (kg/m
2) 29.49 ± 5.41 30.63 ± 4.84 28.07 ± 5.80
Recording Time(h) 8.17 ± 0.72 8.14 ± 0.88 8.20 ± 0.37 AHI (n/h) 41.36 ± 20.58 1.67 ± 2.21
Data are presented as mean ± SD or n (%). OSA Positive: patients with a positive diagnosis of obstructive sleep apnea syndrome; OSA Negative: subjects with a negative diagnosis of obstructive sleep apnea syndrome; BMI: body mass index; AHI (n/h): apnea/hypopnea index calculated for hourly periods.

PAPER IDENTIFICATION NUMBER: TBME-00375-2005 17
TABLE II
AVERAGE ApEn(m,r) VALUES ESTIMATED FROM OXYGEN SATURATION (SAO2) SIGNALS OF
SUBJECTS IN THE TRAINING SET USING m = 1 AND m = 2, AND r = 0.1, 0.15, 0.2, 0.25 TIMES THE
STANDARD DEVIATION (SD) OF THE ORIGINAL DATA SEQUENCE
m r ApEn(m,r)
OSA POSITIVE
ApEn(m,r)
OSA NEGATIVE
t-test
p-value
1 0.1SD 1.13 ± 0.34 0.48 ± 0.27 p < 0.01 1 0.15SD 1.11 ± 0.32 0.48 ± 0.25 p < 0.01 1 0.2SD 1.07 ± 0.30 0.47 ± 0.25 p < 0.01 1 0.25SD 1.01 ± 0.26 0.46 ± 0.23 p < 0.01 2 0.1SD 0.62 ± 0.09 0.39 ± 0.17 p < 0.01 2 0.15SD 0.64 ± 0.09 0.39 ± 0.17 p < 0.01 2 0.2SD 0.66 ± 0.09 0.39 ± 0.17 p < 0.01 2 0.25SD 0.67 ± 0.11 0.39 ± 0.17 p < 0.01

PAPER IDENTIFICATION NUMBER: TBME-00375-2005 18
FIGURE LEGENDS
Fig. 1. SaO2 records from nocturnal oximetry for (a) a common OSA negative subject, (b) an
apparent OSA positive patient and (c) an uncertain OSA positive subject.
Fig. 2. ROC curve for the ApEn(m=1,r=0.25SD) values from oxygen saturation (SaO2) signal in
the diagnosis of the obstructive sleep apnea syndrome in the training set. We selected different
thresholds or cut-off points (ApEn values) and calculated the sensitivity/specificity pair for each
one of them. The symbol ♦ indicates the optimum threshold.
Fig. 3. Mean ApEn values of oxygen saturation (SaO2) signal for patients in the OSA Positive
group and OSA Negative group in the training set. The optimum threshold, set at 0.77, is
represented with a dashed line.
Fig. 4. Mean ApEn values of oxygen saturation (SaO2) signal for patients in the OSA Positive
group and OSA Negative group in the test set. The optimum threshold, set at 0.77, is represented
with a dashed line.

PAPER IDENTIFICATION NUMBER: TBME-00375-2005 19
Fig. 1. SaO2 records from nocturnal oximetry for (a) a common OSA negative subject, (b) an
apparent OSA positive patient and (c) an uncertain OSA positive subject.

PAPER IDENTIFICATION NUMBER: TBME-00375-2005 20
Fig. 2. ROC curve for the ApEn(m=1,r=0.25SD) values from oxygen saturation (SaO2) signal in
the diagnosis of the obstructive sleep apnea syndrome in the training set. We selected different
thresholds or cut-off points (ApEn values) and calculated the sensitivity/specificity pair for each
one of them. The symbol ♦ indicates the optimum threshold.

PAPER IDENTIFICATION NUMBER: TBME-00375-2005 21
Fig. 3. Mean ApEn values of oxygen saturation (SaO2) signal for patients in the OSA Positive
group and OSA Negative group in the training set. The optimum threshold, set at 0.77, is
represented with a dashed line.

PAPER IDENTIFICATION NUMBER: TBME-00375-2005 22
Fig. 4. Mean ApEn values of oxygen saturation (SaO2) signal for patients in the OSA Positive
group and OSA Negative group in the test set. The optimum threshold, set at 0.77, is represented
with a dashed line.

PAPER IDENTIFICATION NUMBER: TBME-00375-2005 23
REFERENCES
[1] J. E. Remmers, W. J. DeGroot, E. K. Saurland, and A. M. Anch, “Pathogenesis of upper
airway occlusion during sleep,” J. Appl. Physiol., vol. 44, pp. 931–938, Jun. 1978.
[2] T. Young, M. Palta, J. Dempsey. S. Skatrud. S. Weber, and S. Badr, “The occurrence of
sleep-disordered breathing among middle-aged adults,” N. Engl. J. Med., vol. 328, pp. 1230–
1235, Apr. 1993.
[3] F. Barbé, J. Pericas, A. Muñoz, L. Findley, J.M. Anto, and A. Agustí, “Automobile accidents
in patients with sleep apnea syndrome. An epidemiological study,” Am. J. Respir. Crit. Care
Med., vol. 158, pp. 18–22, Jul. 1998.
[4] P. Lavie, R. Peled, I. Berger, N. Yoff, J. Zomer, and A. H. Rubin, “Mortality in sleep apnea
patients: a multivariate analysis of risk factors,” Sleep, vol. 18, pp. 149–157, Apr. 1995.
[5] J. He, M. H. Kryger, F. J. Zorick, W. Conway, and T. Roth, “Mortality and apnea index in
obstructive sleep apnea: experience in 385 male patients,” Chest, vol. 94, pp. 9–14, Jul. 1988.
[6] Agency for Health Care Policy and Research (AHCPR), “Systematic review of the literature
regarding the diagnosis of sleep apnea: summary, evidence report/technology assessment
number 1,” Department of Health and Human Services, U.S. Public Health Service, vol.
E002, Feb. 1999.
[7] A. J. Block, P. G. Boysen, J. W. Wynne, and L. A. Hunt, “Sleep apnea, hypopnea and oxygen
desaturation in normal subjects,” N. Engl. J. Med., vol. 300, pp. 513–517, Mar. 1979.
[8] A. J. Block, “Getting the most out of nocturnal pulse oximetry,” Chest, vol. 125, pp. 1628–
1630, Nov. 2003.

PAPER IDENTIFICATION NUMBER: TBME-00375-2005 24
[9] F. Series, I. Marc, and Y. Cormier, “Utility of nocturnal home oximetry for case finding in
patients with suspected sleep apnea hypopnea syndrome,” Ann. Intern. Med., vol. 119, pp.
449–453, Sep. 1993.
[10] P. Levy, J. L. Pepin, C. Deschaux-Blanc, B. Paramelle, and C. Brambilla, “Accuracy of
oximetry for detection of respiratory disturbances in sleep apnea syndrome,” Chest, vol. 109,
pp. 395–399, Feb. 1996.
[11] L. J. Epstein and G. R. Dorlac, “Cost-effectiveness analysis of nocturnal oximetry as a
method of screening for sleep apnea-hypopnea syndrome,” Chest, vol 113, pp. 97–103, Jan.
1998.
[12] E. Chiner, J. Signes-Costa, J. M. Arriero, J. Marco, I. Fuentes and A. Sergado, “A Nocturnal
oximetry for the diagnosis of the sleep apnea hypopnea syndrome: a method to reduce the
number of polysomnographies?,” Thorax, vol. 54, pp. 968–971, Nov. 1999.
[13] J. Vazquez, W. H. Tsai, W. W. Flemons, A. Masuda, R. Brant, E. Hajduk, W. A. Whitelaw,
and J. E. Remmers, “Automated analysis of digital oximetry in the diagnosis of obstructive
sleep apnea”, Thorax, vol. 55, pp. 302–307, Apr. 2000.
[14] B. H. Taha, J. A. Dempsey, and S. M. Weber, “Automated detection and classification of
sleep-disorders breathing from conventional polysomnography data,” Sleep, vol. 20, pp. 991–
1001, Nov. 1997.
[15] H. Rauscher, W. Popp, and H. Zwick, “Computerized detection of respiratory events during
sleep from rapid increase in oxyhemoglobin saturation,” Lung, vol. 169, pp. 335–342, 1991.
[16] Y. Yamashiro and M. H. Kryger, “Nocturnal oximetry: is it a screening tool for sleep
disorders?,” Sleep, vol. 18, pp. 167–171, Apr. 1995.

PAPER IDENTIFICATION NUMBER: TBME-00375-2005 25
[17] S. Gyulay, L. G. Olson, M. J. Hensley, M. T. King, K. M. Allen and N. A. Saunders, “A
comparison of clinical assessment and home oximetry in the diagnosis of obstructive sleep
apnea,” Am. Rev. Respir. Di., vol 147, pp. 50–53, Jan. 1993.
[18] U. J. Magalang, J. Dmochowski, S. Veeramachaneni, A. Draw, M. J. Mador, A. El-Solh and
B. J. Grant, “Prediction of the apnea-hypopnea index from overnight pulse oximetry,” Chest,
vol. 124, pp. 1694–1701, Nov. 2003.
[19] A. N. Kolmogorov, “A new metric invariant of transient dynamical systems and
automorphisms in Lebesgue spaces,” Dokl Akad Nauk SSSR, vol. 119, pp.861–864, 1958.
[20] S. M. Pincus, “Approximate entropy as a measure of system complexity,” Proc. Natl. Acad.
Sci. USA, vol. 88, pp. 2297–2301, Mar. 1991.
[21] S. M. Pincus, “Assessing serial irregularity and its implications for health,” Ann. NY Acad.
Sci., vol. 954, pp. 245–267, Dec. 2001.
[22] A. Rechtschaffen and A. Kales, “A Manual of Standardized Terminology, Techniques and
Scoring System for Sleep Stages of Human Subjects,” Brain Information Services, Brain
Research Institute, University of California, Los Angeles , 1968.
[23] S. M. Pincus and A. L. Goldberger, “Physiological time series analysis: what does regularity
quantify?,” Am. J. Physiol. (Heart Circ. Physiol.), vol. 266, pp. H1643–H1656, Apr. 1994.
[24] J. Bruhn, H. Röpcke, B. Rehberg, T. Bouillon, and A. Hoeft, “Electroencephalogram
approximate entropy correctly classifies the occurrence of burst suppression pattern as
increasing anesthetic drug effect,” Anesthesiology, vol. 93, pp. 981–985, Oct. 2000.
[25] M. Engoren, “Approximate entropy of respiratory rate and tidal volume during weaning
from mechanical ventillation,” Crit. Care Med., vol. 26, pp. 1817–1823, Nov. 1998.

PAPER IDENTIFICATION NUMBER: TBME-00375-2005 26
[26] S. M. Pincus, T. R. Cummings, and G. G. Haddad, “Heart rate control in normal and aborted
SIDS infants,” Am. J. Physiol. (Regulatory Integrative Comp. Physiol.), vol. 264, pp. R638–
R646, Mar. 1993.
[27] L. A. Fleisher, S. M. Pincus, and S. H. Rosenbaum, “Approximate entropy of heart rate as a
correlate of postoperative ventricular dysfunction,” Anesthesiology, vol. 78, pp. 683–692,
1993.
[28] N. Radhakrishnan and B. N. Gangadhar, “Estimating regularity in epileptic seizure time-
series data. A complexity-measure approach,” IEEE Eng. Med. Biol. Mag., vol. 17, pp. 89–
94, May-Jun. 1998.
[29] X.-S. Zhang and R. J. Roy, “Derived fuzzy knowledge model for estimating the depth of
anesthesia,” IEEE Trans. Biomed. Eng., vol. 48, pp. 312–323, Mar. 2001.
[30] I. A. Rezek and S. J. Roberts, “Stochastic Complexity Measures for Physiological Signal
Analysis,” IEEE Trans. Biomed. Eng., vol. 45, pp. 1186–1191, Sep. 1998.
[31] S. M. Pincus, “Older males secrete luteinizing hormone and testosterone more irregularly
and joint more asynchronously, than younger males,” Proc. Natl. Acad. Sci. USA, vol. 93, pp.
14100–14105, Nov. 1996.
[32] J. D. Veldhuis, M. L. Johnson, O. L. Veldhuis, M. Straume, and S. M. Pincus, “Impact of
pulsatility on the ensemble orderliness (approximate entropy) of neurohormone secretion,”
Am. J. Physiol. (Regulatory Integrative Comp. Physiol.), vol. 281, pp. 1975–1985, Dec. 2001.
[33] S. M. Pincus and D. L. Keefe, “Quantification of hormone pulsatility via an approximate
entropy algorithm,” Am. J. Physiol. (Endocrinol. Metab.), vol. 262, pp. E741–E754, May
1992.

PAPER IDENTIFICATION NUMBER: TBME-00375-2005 27
[34] D. T. Kaplan, M. I. Furman, S. M. Pincus, S. M. Ryan, L. A. Lipsitz, and A. L. Goldberger,
“Aging and the complexity of cardiovascular dynamics,” Byophys. J., vol. 59, pp. 945–949,
Apr. 1991.
[35] M. H. Zweig and G. Campbell, “Receiver-Operating Characteristic (ROC) plots: a
fundamental evaluation tool in clinical medicine,” Clin. Chem., vol. 39, pp. 561–577, Apr.
1993.
[36] Y. Fusheng, H. Bo, and T. Qingyu, “Approximate entropy and its application in biosignal
analysis”. In Nonlinear Biomedical Signal Processing Volume II: Dynamic Analysis and
Modeling, M. Akay. New York: IEEE Press Series on Biomedical Engineering, 2001, pp. 72–
91
[37] A. L. Chesson, W.M. Anderson, R.C. Walls, and L.E. Bairnsfather, “Assessment of
hypoxemia in patients with sleep disorders using saturation impairment time,” Am. Rev.
Respir. Dis., vol. 148, pp. 1592–1598, Dec. 1993.
[38] C. Zamarrón, P. V. Romero, J. R. Rodríguez, and F. Gude, “Oximetry spectral analysis in
the diagnosis of obstructive sleep apnoea,” Clinical Science, vol. 97, pp. 467– 473, Oct.
1999.
[39] The Atlas Task Force, “EEG arousals: scoring rules and examples. A preliminary report
from the Sleep Disorder Task Force of the American Sleep Disorders Association,” Sleep,
vol. 20, pp. 991–1001, Jun. 1997.


![Entropy stable ENO scheme … · The ENO reconstruction procedure has been very successfully em-ployed to approximate systems of hyperbolic conservation laws, [8, 15, 17]. Extensions](https://img.pdfslide.us/doc/110x75/6117dbe98dfbd9699074d53f/entropy-stable-eno-the-eno-reconstruction-procedure-has-been-very-successfully.jpg)