Embed Size (px)
Citation preview
UTILITY MACT WORKING GROUP
STATE AND LOCAL STAKEHOLDER RECOMMENDATIONS
AUTHORS PRAVEEN AMAR BILL O’SULLIVAN JOHN PAUL
THANKS TO EPA FOR PROVIDING THE
OPPORTUNITY TO MEET AND DISCUSS THE ISSUES
TO OTHER STAKEHOLDERS FOR THEIR PARTICIPATION; ESPECIALLY THOSE THAT PARTICIPATED IN THE “MINI” WORK-GROUPS
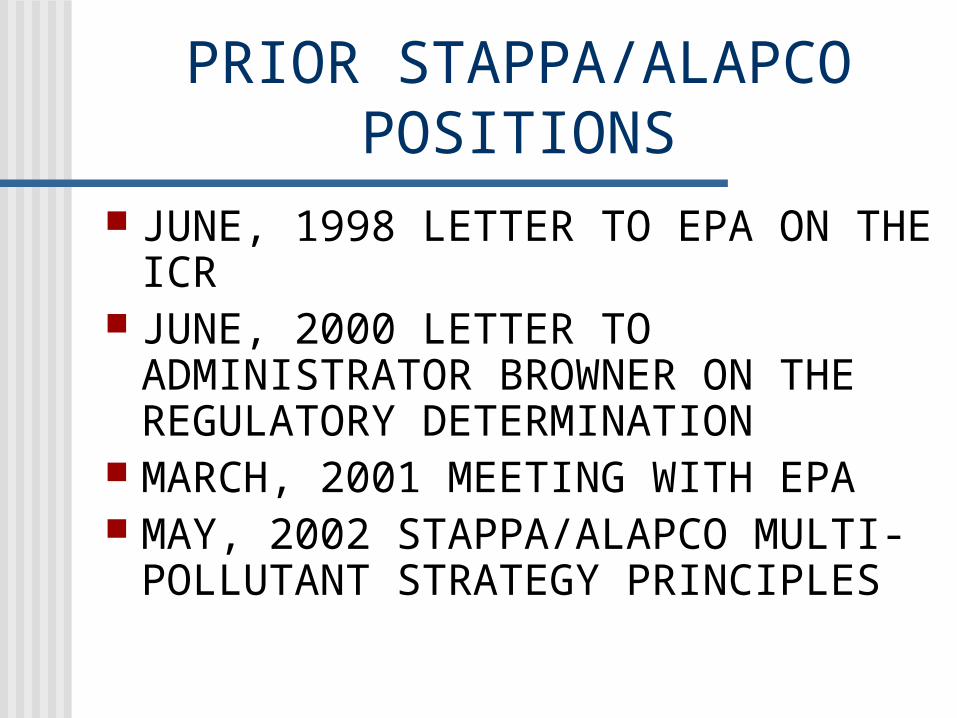
PRIOR STAPPA/ALAPCO POSITIONS
JUNE, 1998 LETTER TO EPA ON THE ICR
JUNE, 2000 LETTER TO ADMINISTRATOR BROWNER ON THE REGULATORY DETERMINATION
MARCH, 2001 MEETING WITH EPA MAY, 2002 STAPPA/ALAPCO MULTI-
POLLUTANT STRATEGY PRINCIPLES
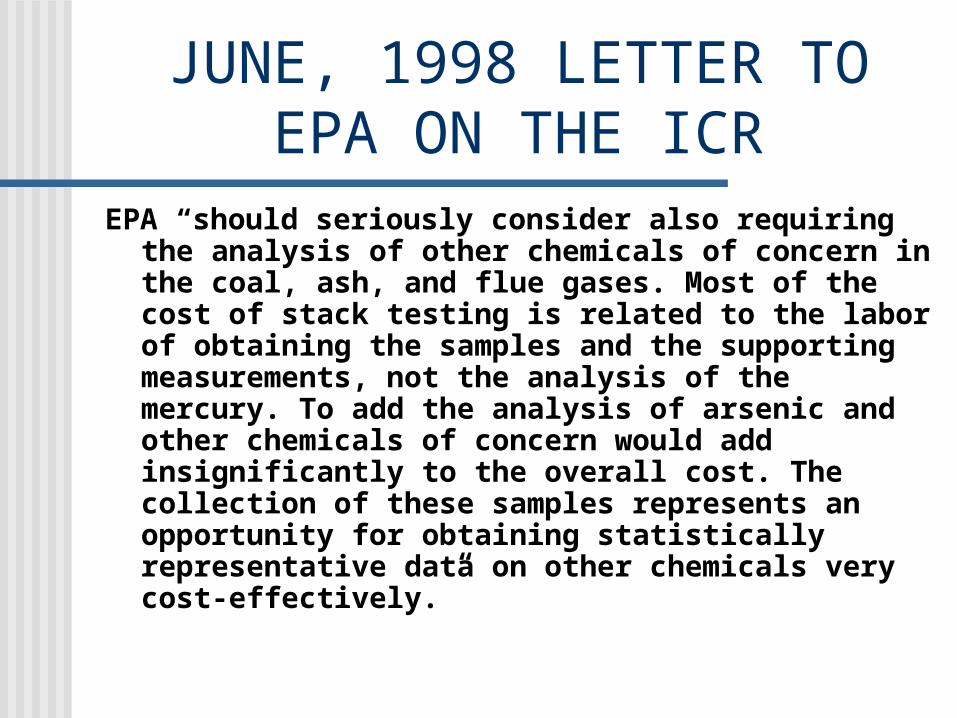
JUNE, 1998 LETTER TO EPA ON THE ICR
EPA “should seriously consider also requiring the analysis of other chemicals of concern in the coal, ash, and flue gases. Most of the cost of stack testing is related to the labor of obtaining the samples and the supporting measurements, not the analysis of the mercury. To add the analysis of arsenic and other chemicals of concern would add insignificantly to the overall cost. The collection of these samples represents an opportunity for obtaining statistically representative data on other chemicals very cost-effectively.”
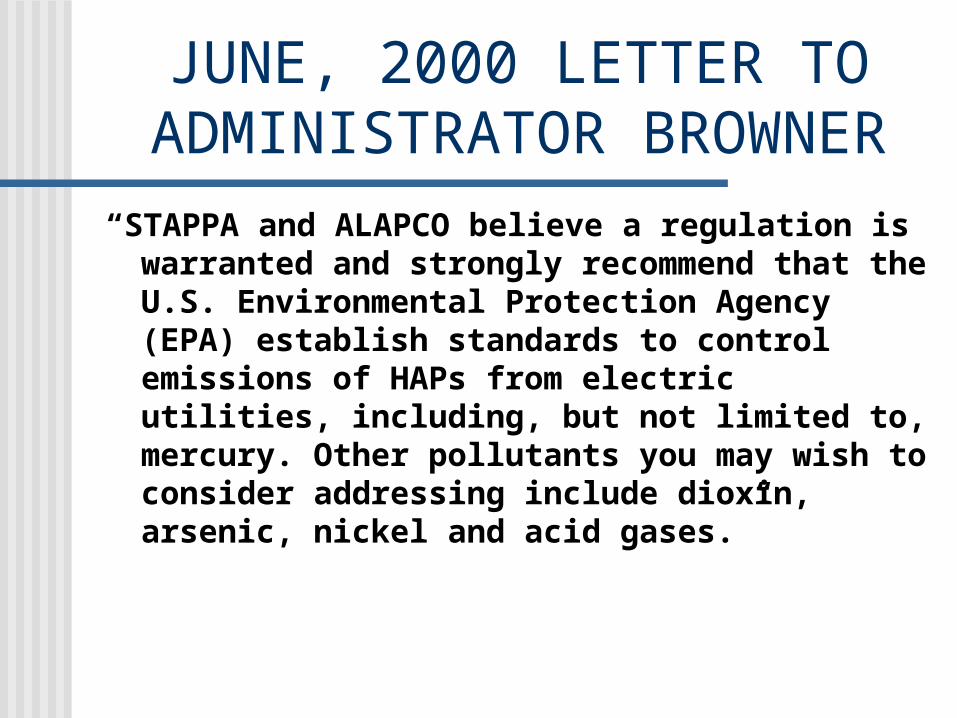
JUNE, 2000 LETTER TO ADMINISTRATOR BROWNER“STAPPA and ALAPCO believe a regulation is warranted and strongly recommend that the U.S. Environmental Protection Agency (EPA) establish standards to control emissions of HAPs from electric utilities, including, but not limited to, mercury. Other pollutants you may wish to consider addressing include dioxin, arsenic, nickel and acid gases.”
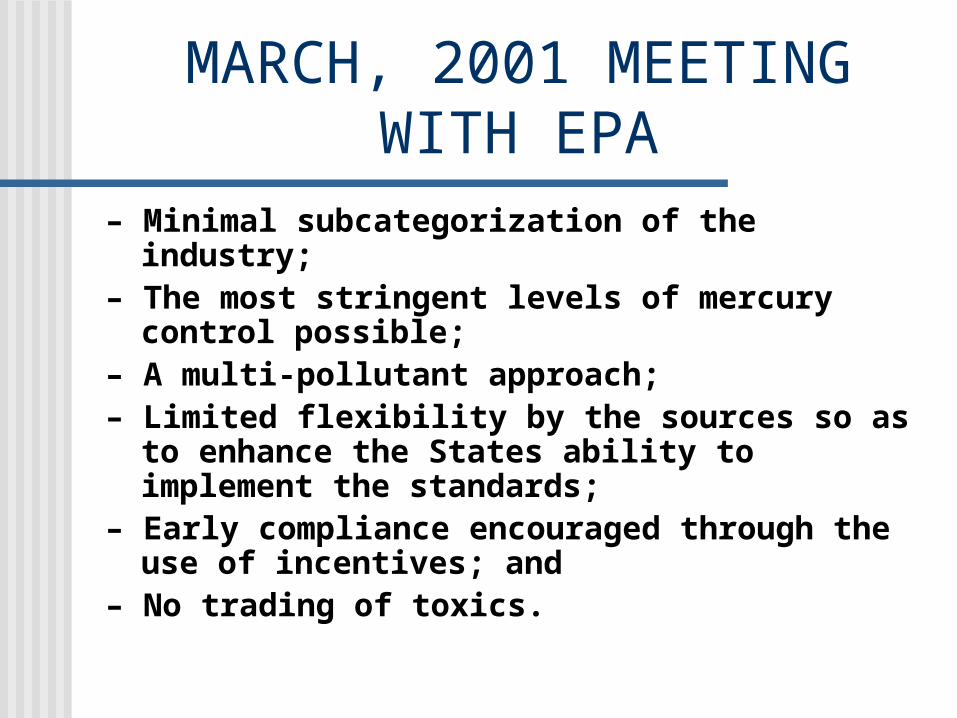
MARCH, 2001 MEETING WITH EPA
– Minimal subcategorization of the industry;
– The most stringent levels of mercury control possible;
– A multi-pollutant approach; – Limited flexibility by the sources so as to enhance the States ability to implement the standards;
– Early compliance encouraged through the use of incentives; and
– No trading of toxics.
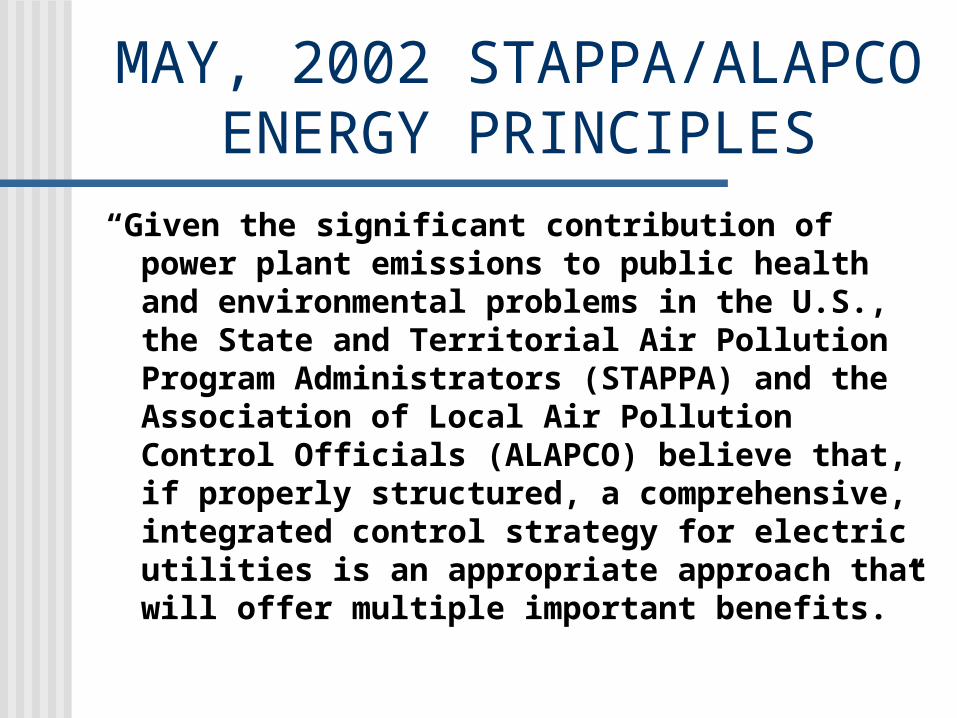
MAY, 2002 STAPPA/ALAPCO ENERGY PRINCIPLES
“Given the significant contribution of power plant emissions to public health and environmental problems in the U.S., the State and Territorial Air Pollution Program Administrators (STAPPA) and the Association of Local Air Pollution Control Officials (ALAPCO) believe that, if properly structured, a comprehensive, integrated control strategy for electric utilities is an appropriate approach that will offer multiple important benefits.”
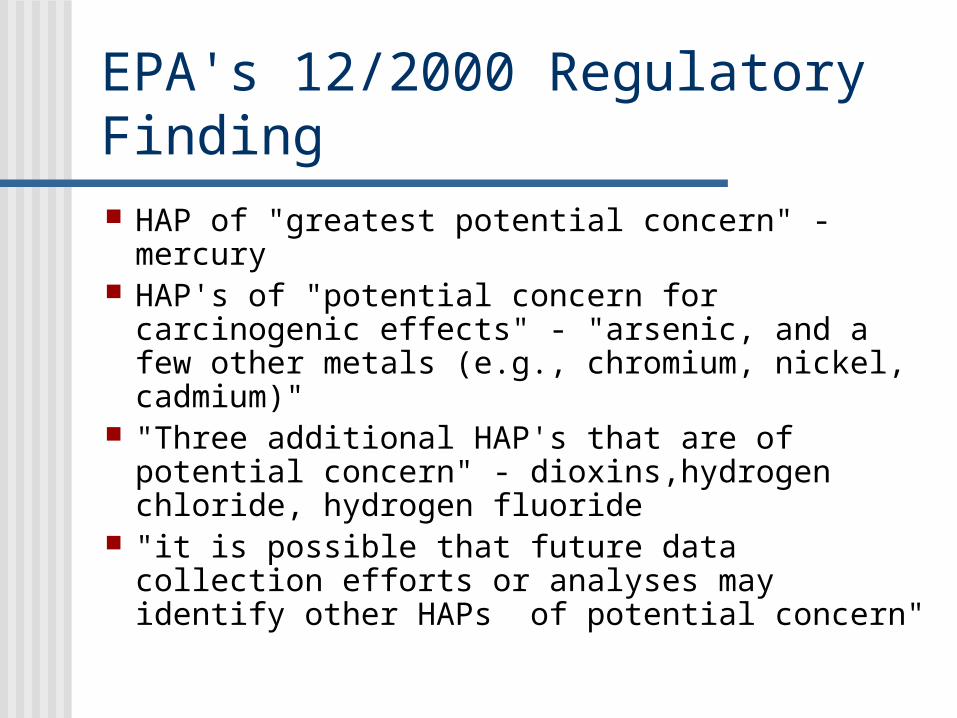
EPA's 12/2000 Regulatory Finding HAP of "greatest potential concern" -
mercury HAP's of "potential concern for carcinogenic
effects" - "arsenic, and a few other metals (e.g., chromium, nickel, cadmium)"
"Three additional HAP's that are of potential concern" - dioxins,hydrogen chloride, hydrogen fluoride
"it is possible that future data collection efforts or analyses may identify other HAPs of potential concern"
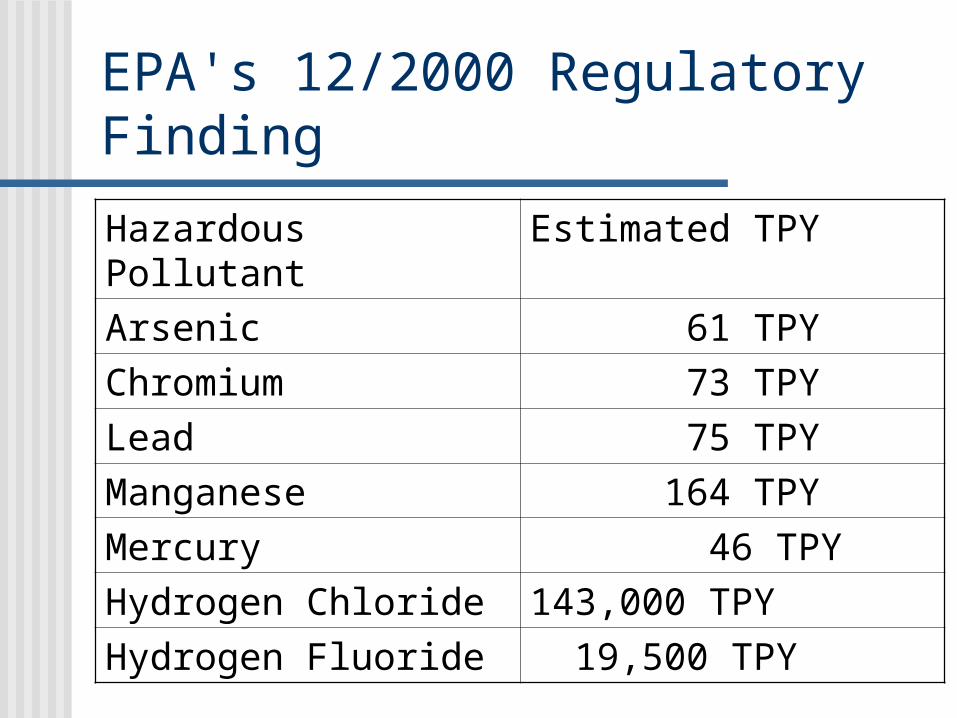
EPA's 12/2000 Regulatory Finding
Hazardous Pollutant Estimated TPY
Arsenic 61 TPY
Chromium 73 TPY
Lead 75 TPY
Manganese 164 TPY
Mercury 46 TPY
Hydrogen Chloride 143,000 TPY
Hydrogen Fluoride 19,500 TPY
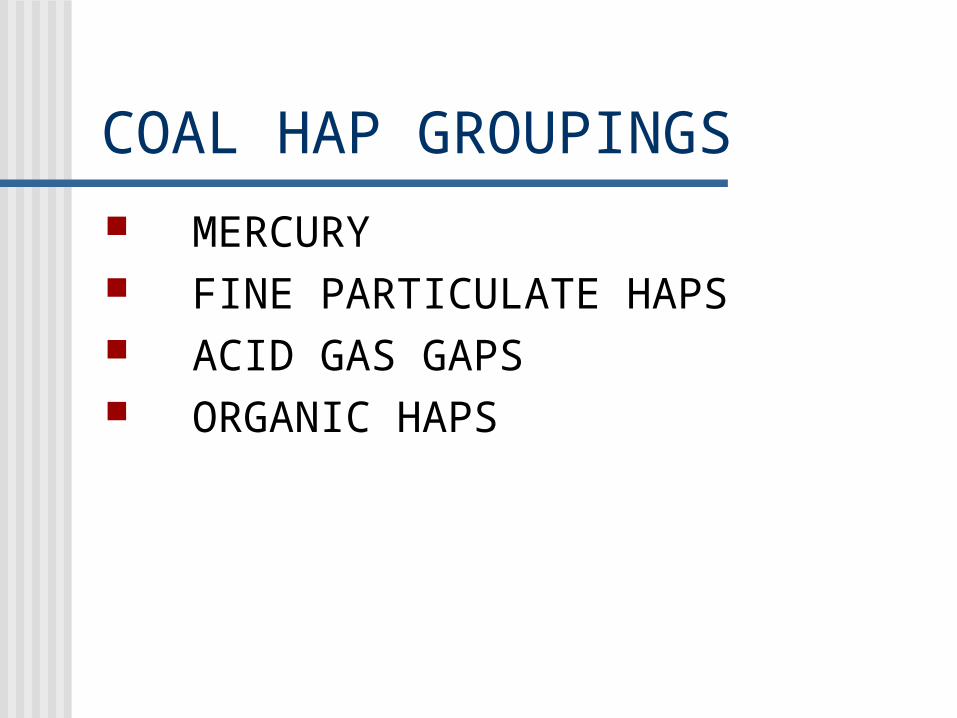
COAL HAP GROUPINGS MERCURY FINE PARTICULATE HAPS ACID GAS GAPS ORGANIC HAPS
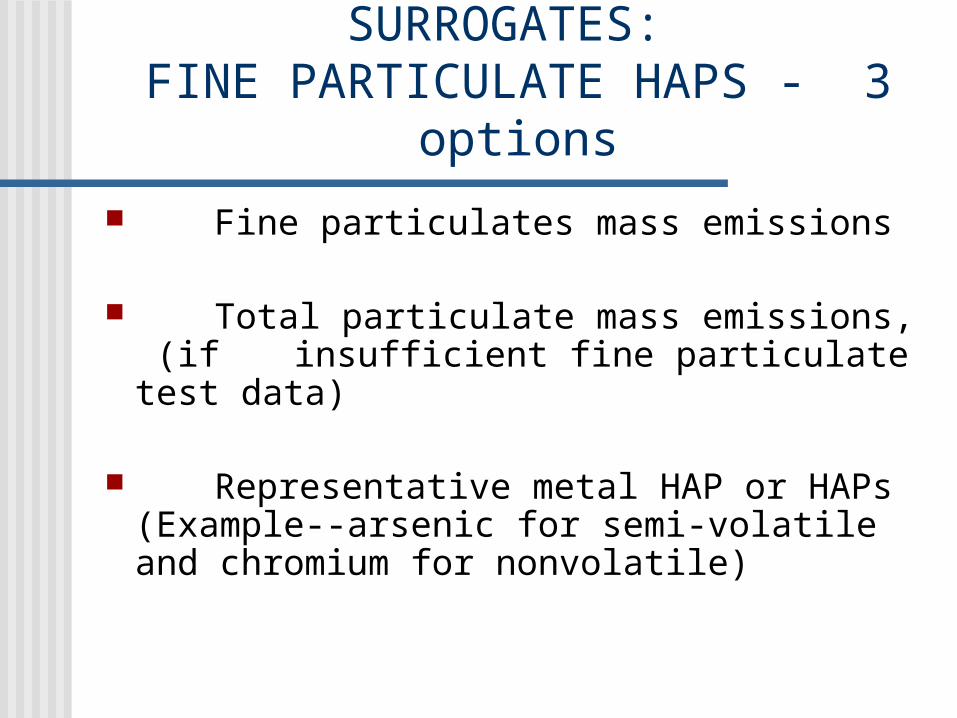
SURROGATES: FINE PARTICULATE HAPS - 3
options
Fine particulates mass emissions
Total particulate mass emissions, (if insufficient fine particulate test data)
Representative metal HAP or HAPs (Example--arsenic for semi-volatile and chromium for nonvolatile)
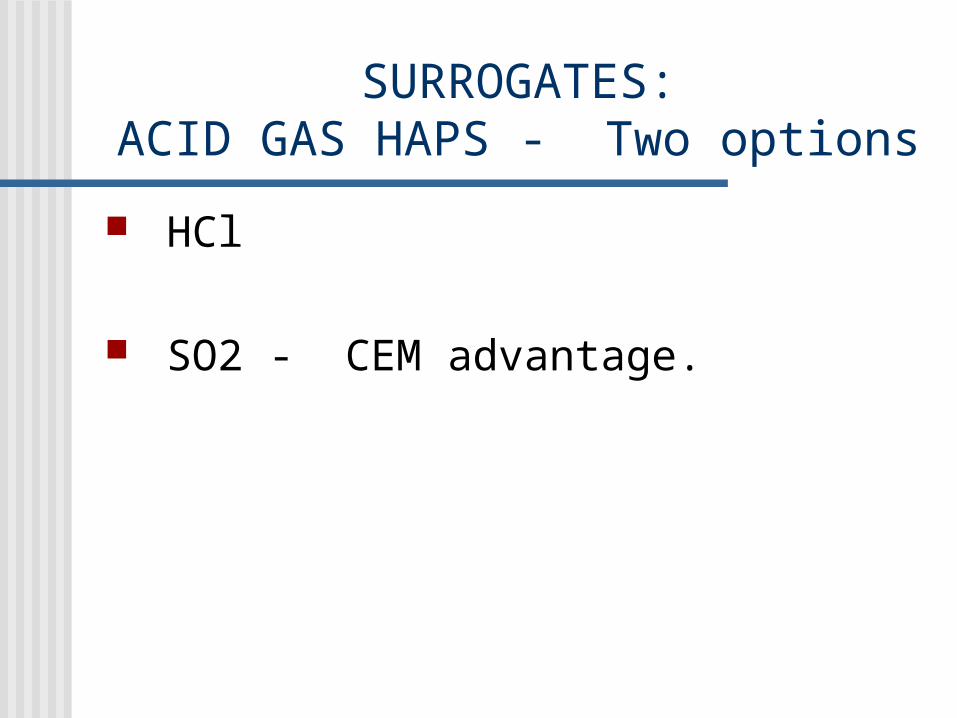
SURROGATES:ACID GAS HAPS - Two options
HCl
SO2 - CEM advantage.
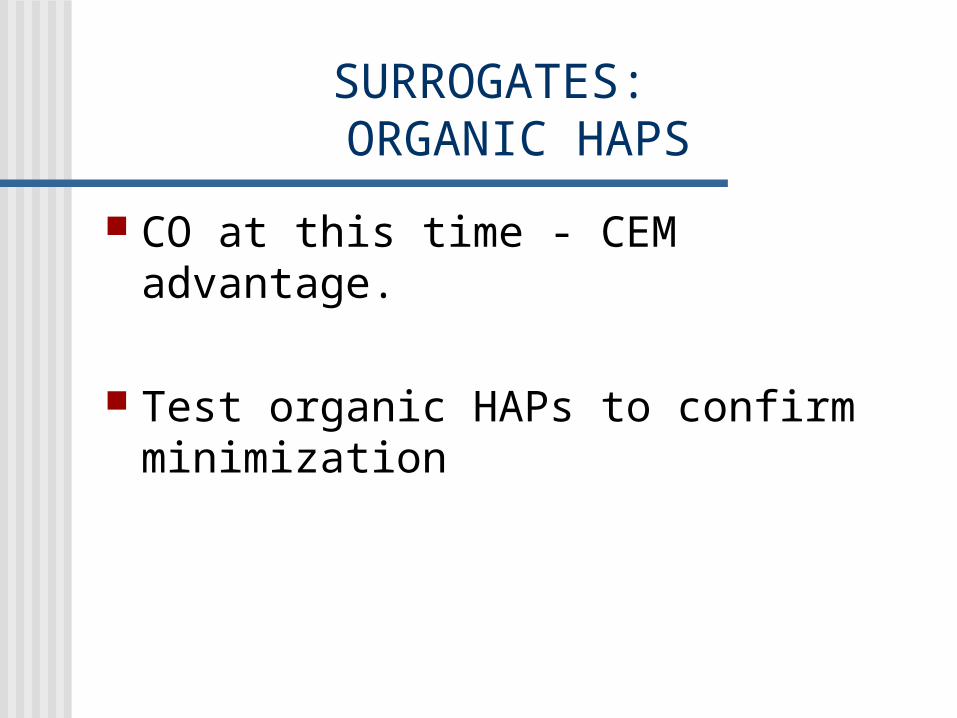
SURROGATES: ORGANIC HAPS
CO at this time - CEM advantage.
Test organic HAPs to confirm minimization
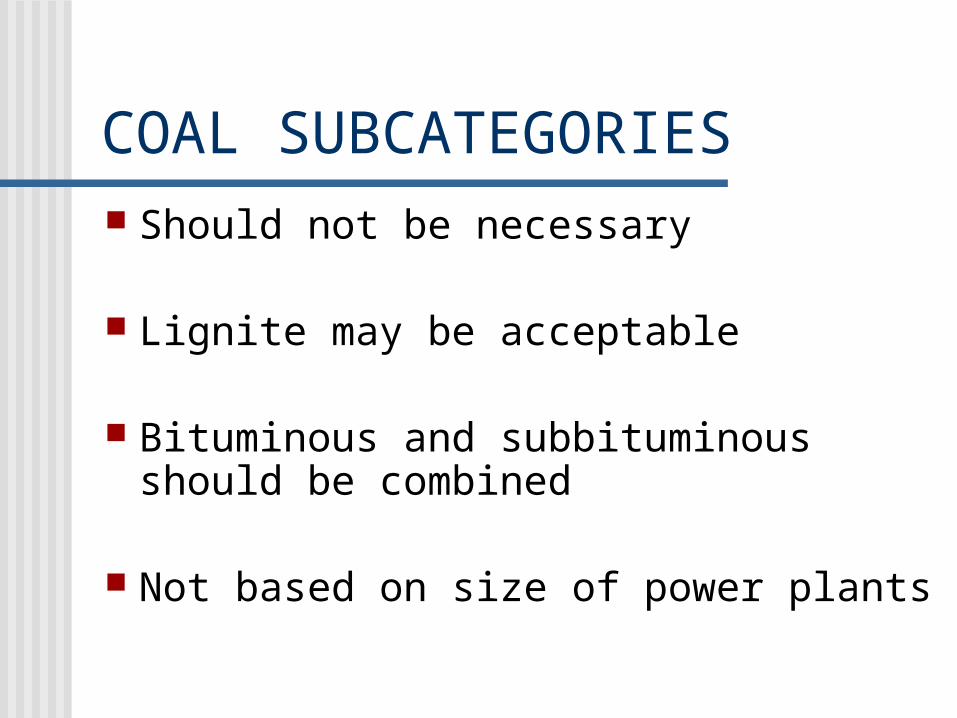
COAL SUBCATEGORIES Should not be necessary
Lignite may be acceptable
Bituminous and subbituminous should be combined
Not based on size of power plants
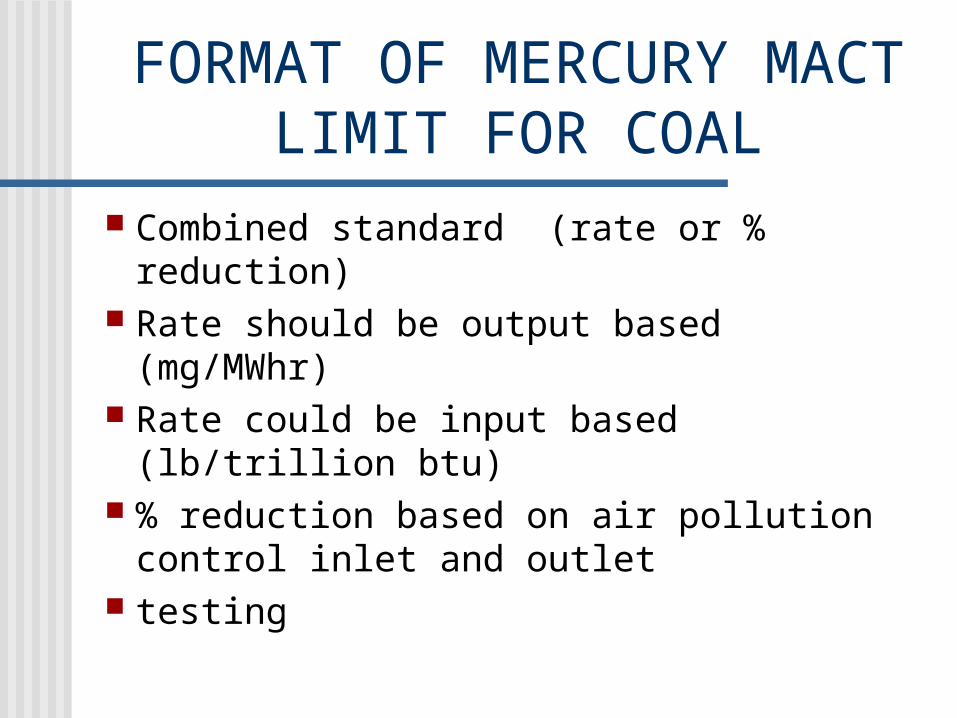
FORMAT OF MERCURY MACT LIMIT FOR COAL
Combined standard (rate or % reduction) Rate should be output based (mg/MWhr) Rate could be input based (lb/trillion btu) % reduction based on air pollution control
inlet and outlet testing
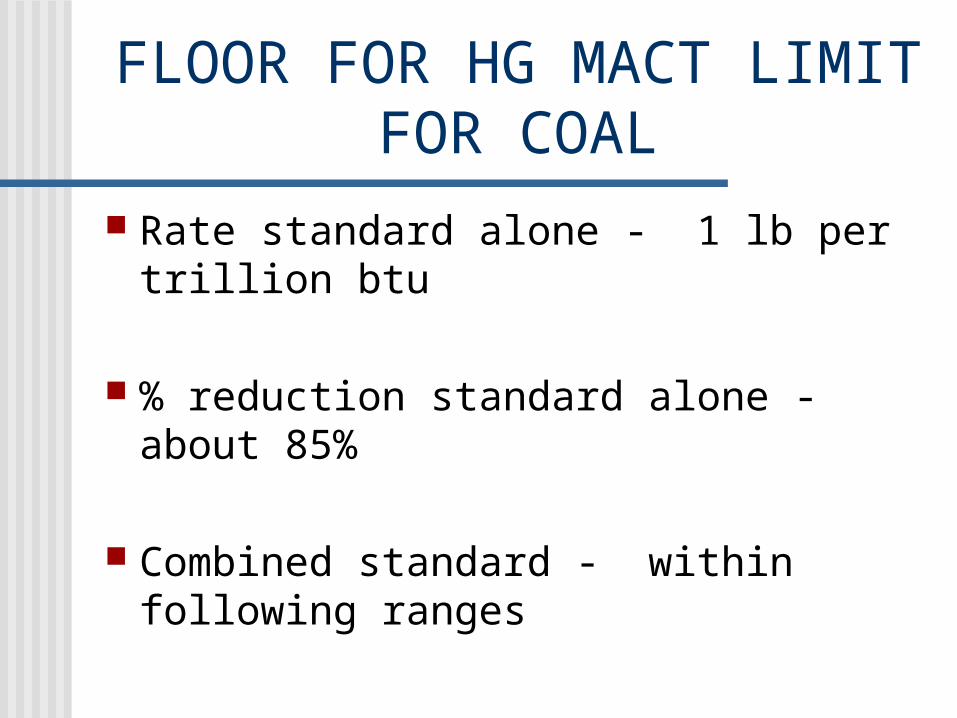
FLOOR FOR HG MACT LIMIT FOR COAL
Rate standard alone - 1 lb per trillion btu
% reduction standard alone - about 85%
Combined standard - within following ranges
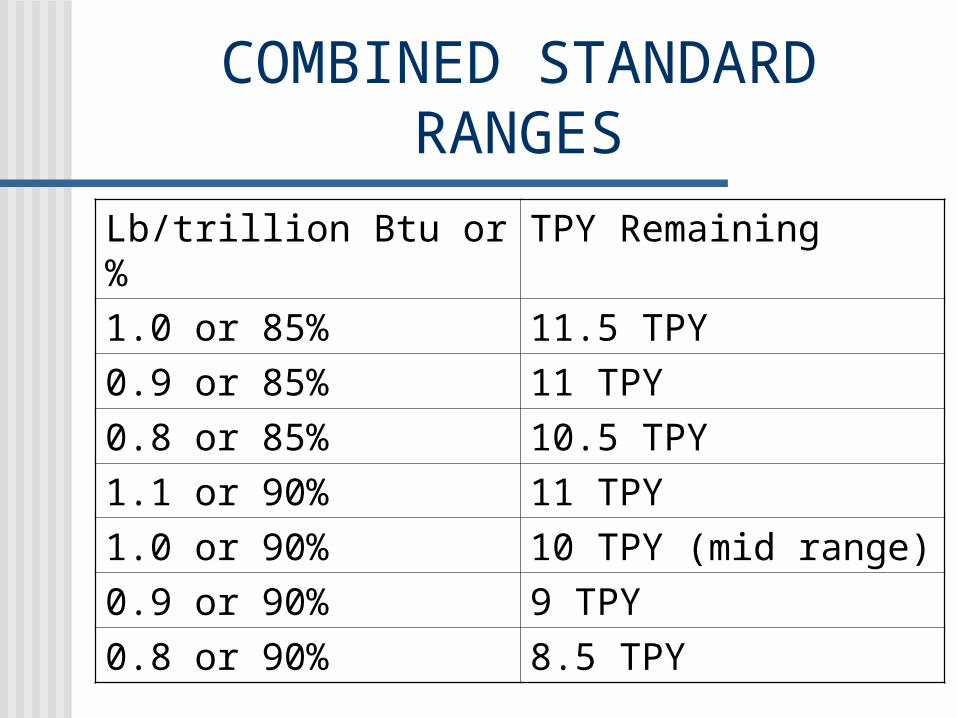
COMBINED STANDARD RANGES
Lb/trillion Btu or % TPY Remaining
1.0 or 85% 11.5 TPY
0.9 or 85% 11 TPY
0.8 or 85% 10.5 TPY
1.1 or 90% 11 TPY
1.0 or 90% 10 TPY (mid range)
0.9 or 90% 9 TPY
0.8 or 90% 8.5 TPY
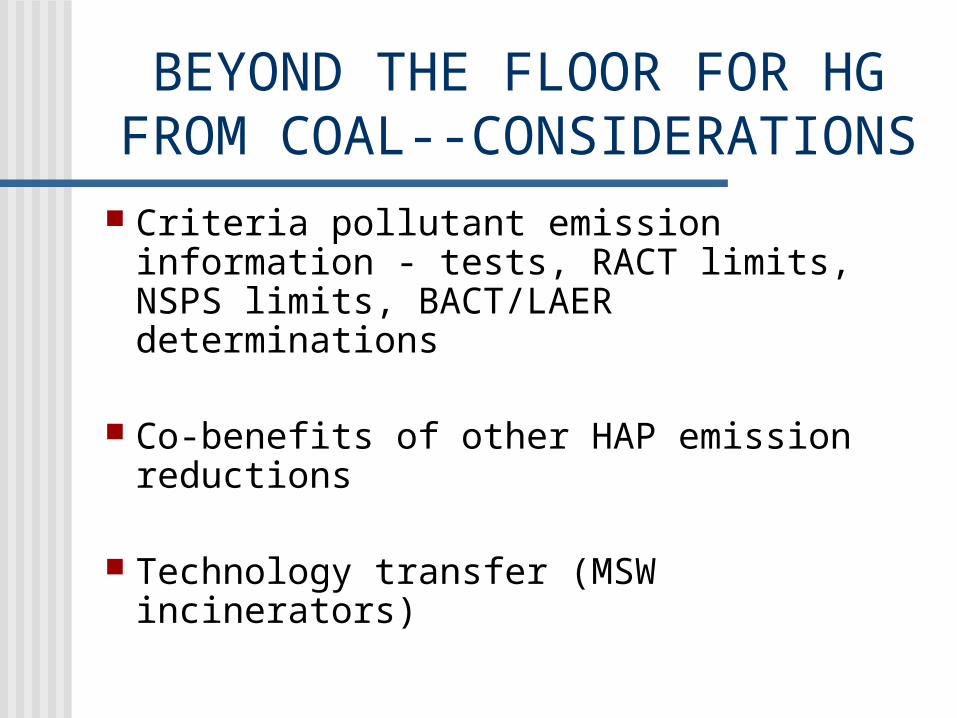
BEYOND THE FLOOR FOR HG FROM COAL--CONSIDERATIONS Criteria pollutant emission information
- tests, RACT limits, NSPS limits, BACT/LAER determinations
Co-benefits of other HAP emission reductions
Technology transfer (MSW incinerators)
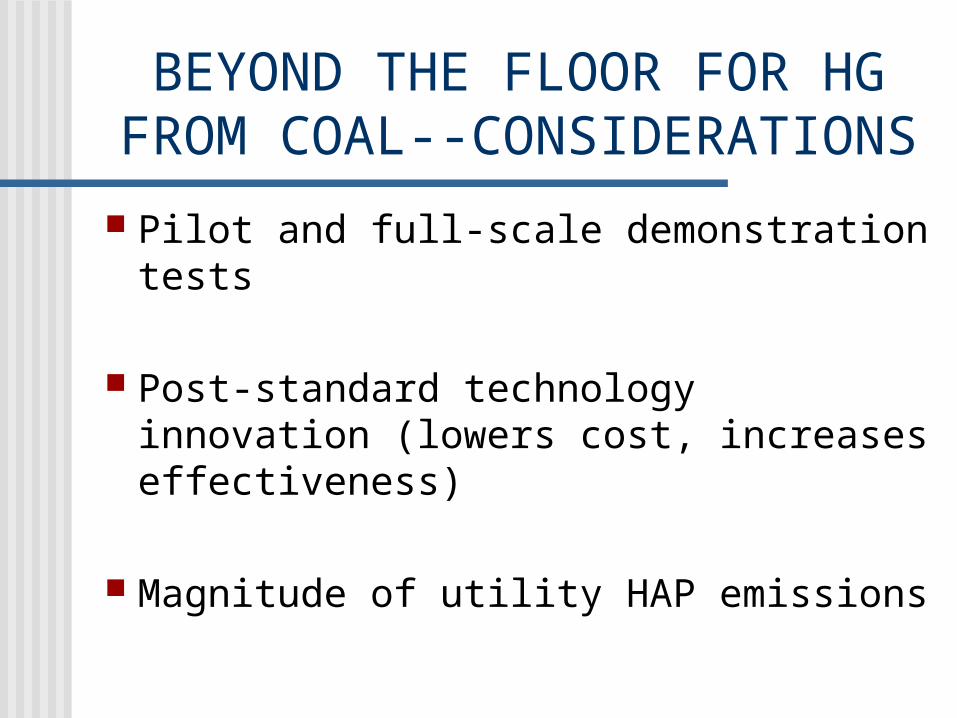
BEYOND THE FLOOR FOR HG FROM COAL--CONSIDERATIONS
Pilot and full-scale demonstration tests
Post-standard technology innovation (lowers cost, increases effectiveness)
Magnitude of utility HAP emissions
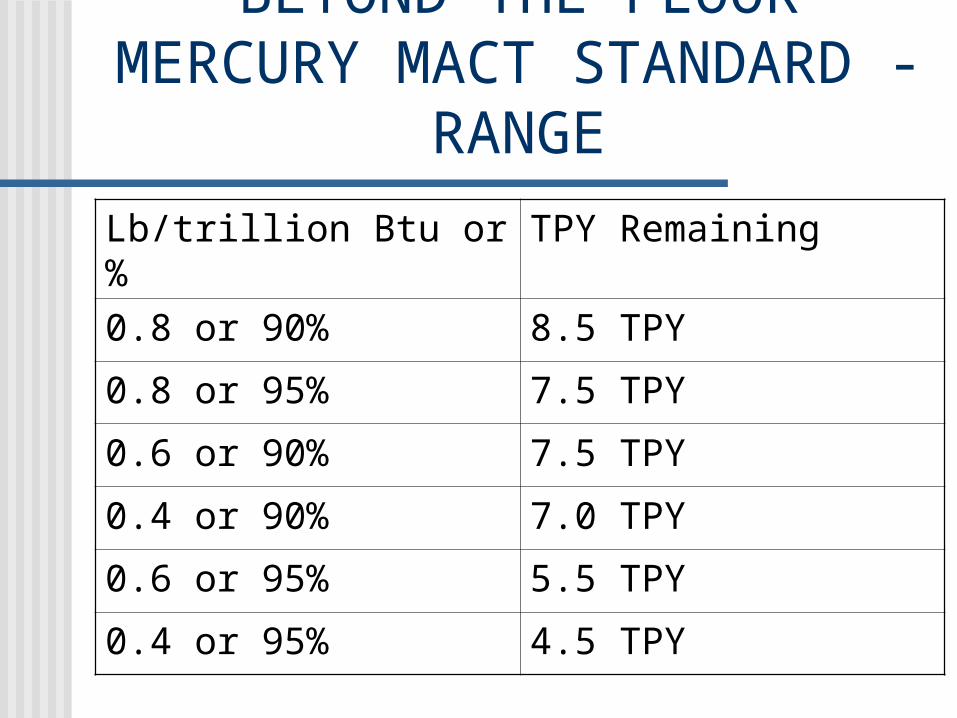
BEYOND THE FLOOR MERCURY MACT STANDARD
- RANGE
Lb/trillion Btu or % TPY Remaining
0.8 or 90% 8.5 TPY
0.8 or 95% 7.5 TPY
0.6 or 90% 7.5 TPY
0.4 or 90% 7.0 TPY
0.6 or 95% 5.5 TPY
0.4 or 95% 4.5 TPY
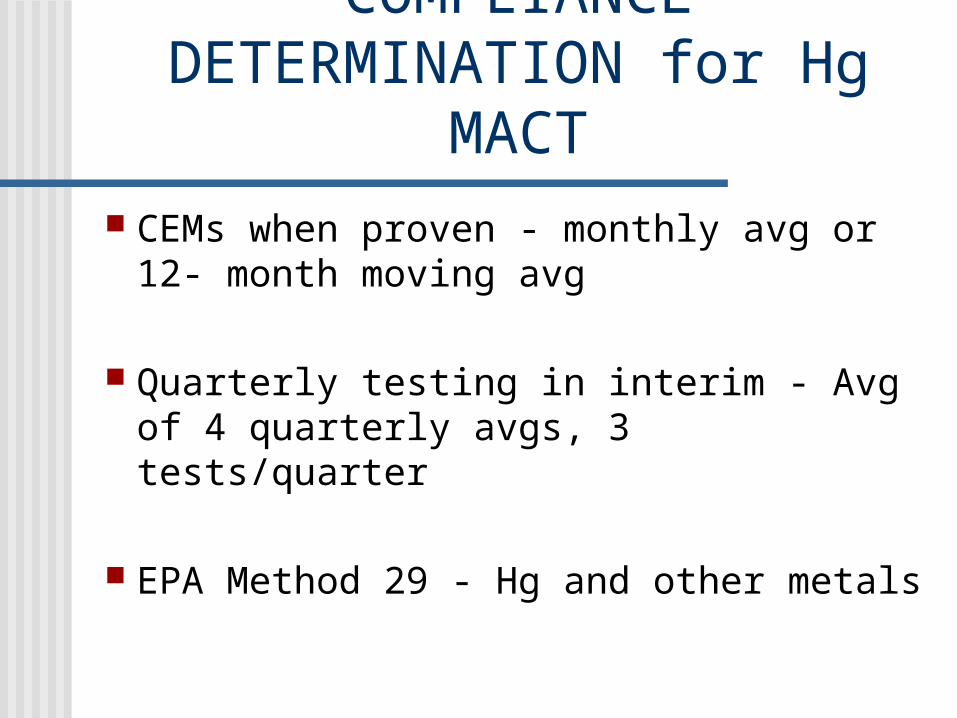
COMPLIANCE DETERMINATION for Hg
MACT CEMs when proven - monthly avg or
12- month moving avg
Quarterly testing in interim - Avg of 4 quarterly avgs, 3 tests/quarter
EPA Method 29 - Hg and other metals
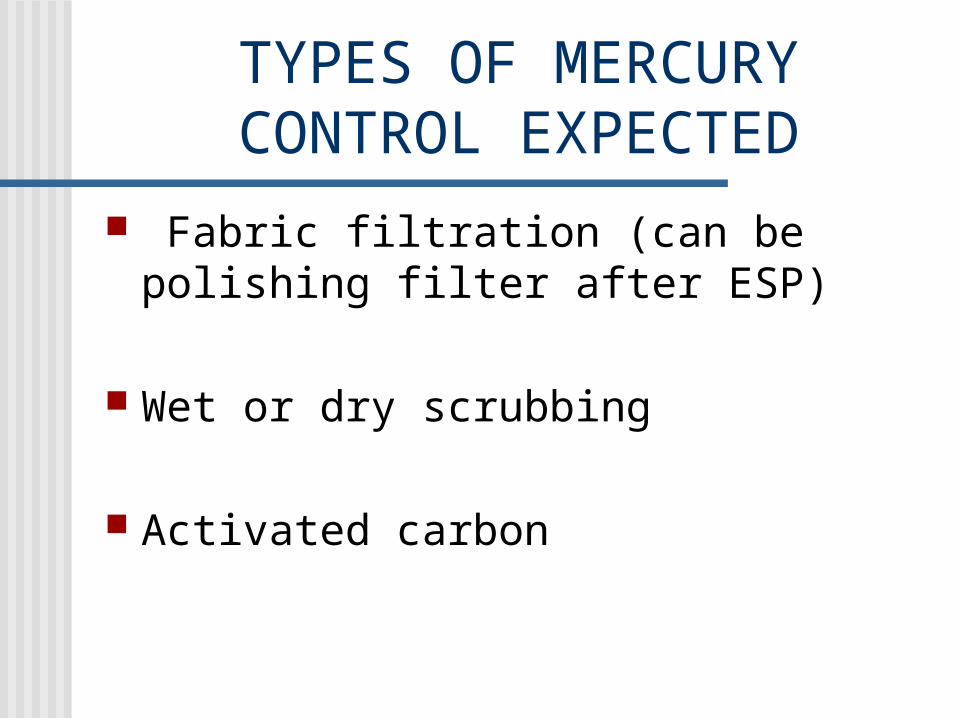
TYPES OF MERCURY CONTROL EXPECTED
Fabric filtration (can be polishing filter after ESP)
Wet or dry scrubbing
Activated carbon
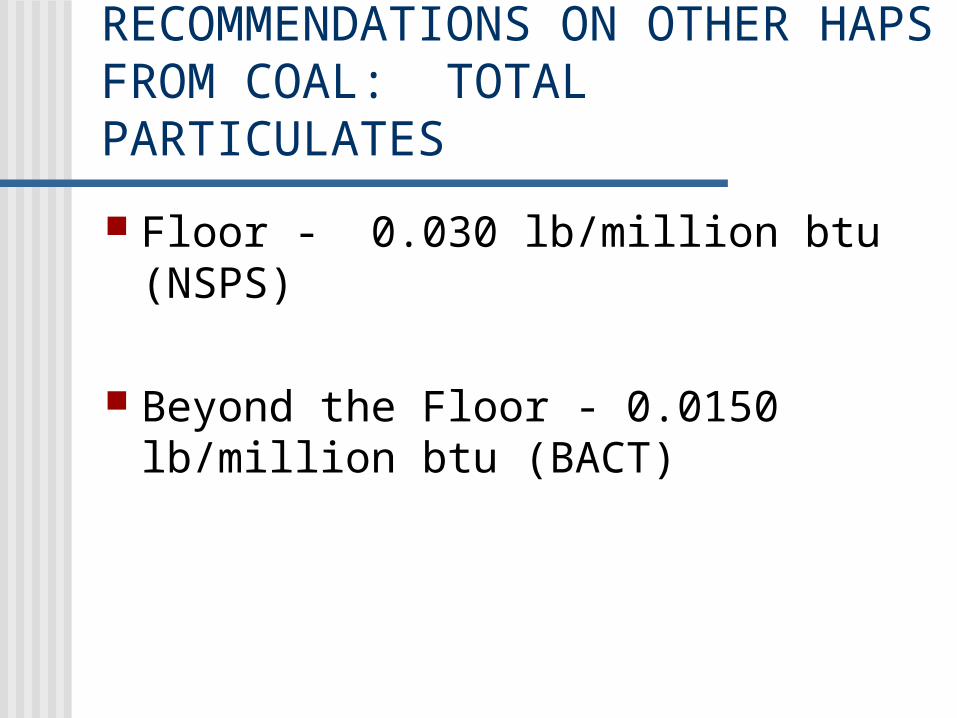
RECOMMENDATIONS ON OTHER HAPS FROM COAL: TOTAL PARTICULATES
Floor - 0.030 lb/million btu (NSPS)
Beyond the Floor - 0.0150 lb/million btu (BACT)

RECOMMENDATIONS ON OTHER HAPS FROM COAL: ACID GASES
(SO2)
Floor - 90 % SO2 (NSPS)
Beyond the floor - 95% SO2 (BACT)
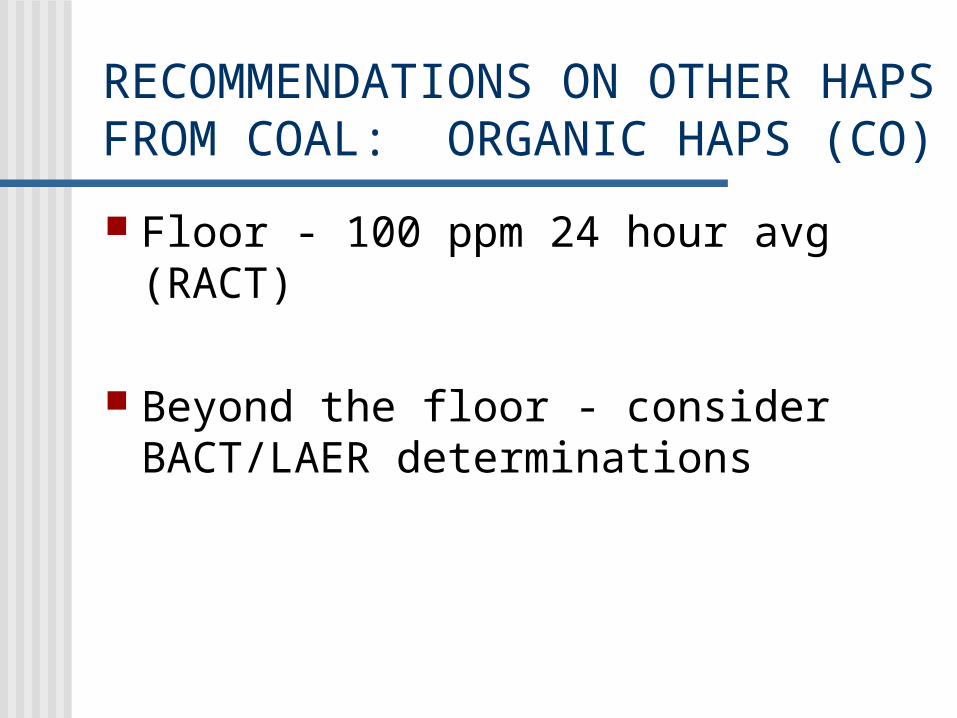
RECOMMENDATIONS ON OTHER HAPS FROM COAL: ORGANIC
HAPS (CO)
Floor - 100 ppm 24 hour avg (RACT)
Beyond the floor - consider BACT/LAER determinations
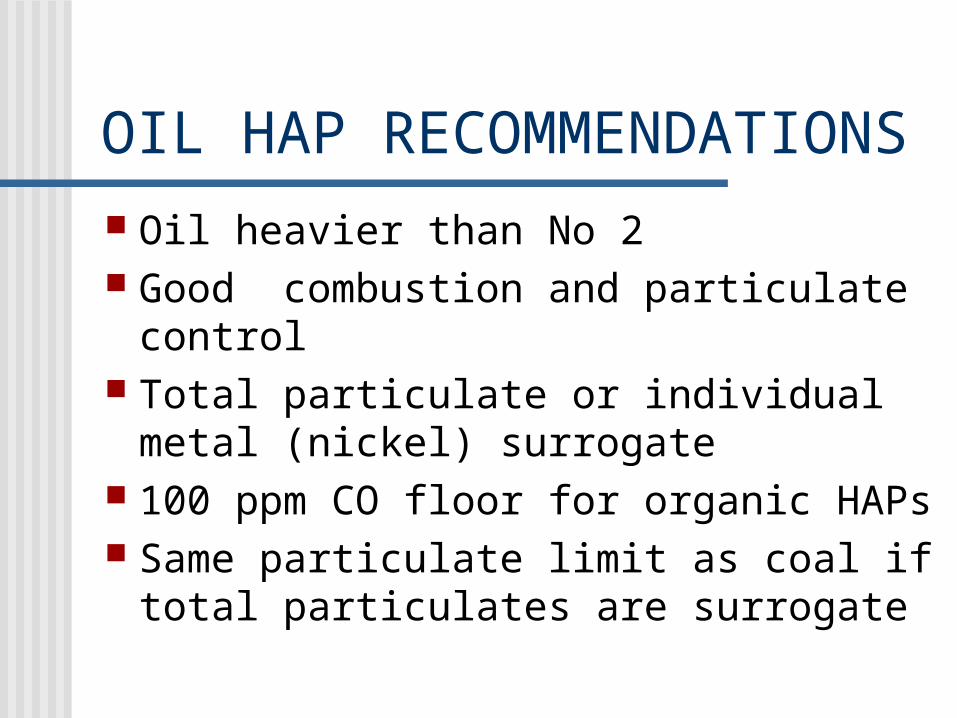
OIL HAP RECOMMENDATIONS Oil heavier than No 2 Good combustion and particulate
control Total particulate or individual metal
(nickel) surrogate 100 ppm CO floor for organic HAPs Same particulate limit as coal if total
particulates are surrogate
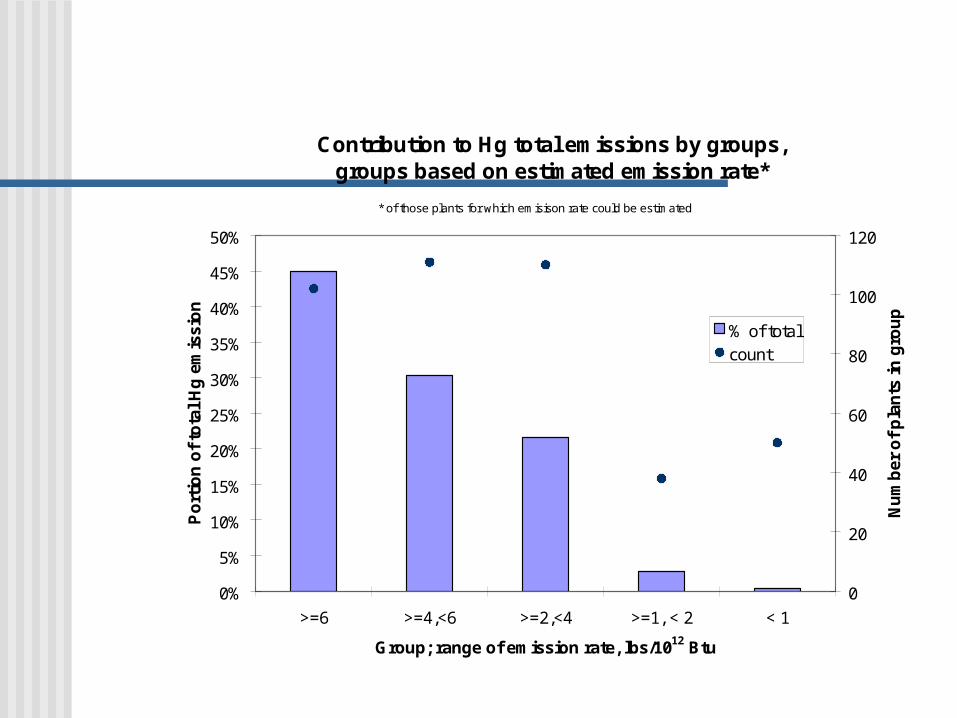
Contribution to Hg total emissions by groups, groups based on estimated emission rate*
0%
5%
10%
15%
20%
25%
30%
35%
40%
45%
50%
>=6 >=4,<6 >=2,<4 >=1, < 2 < 1
Group; range of emission rate, lbs/1012 Btu
Po
rtio
n o
f to
tal
Hg
em
issi
on
0
20
40
60
80
100
120
Nu
mb
er o
f p
lan
ts i
n g
rou
p
% of totalcount
* of those plants for which emisison rate could be estimated
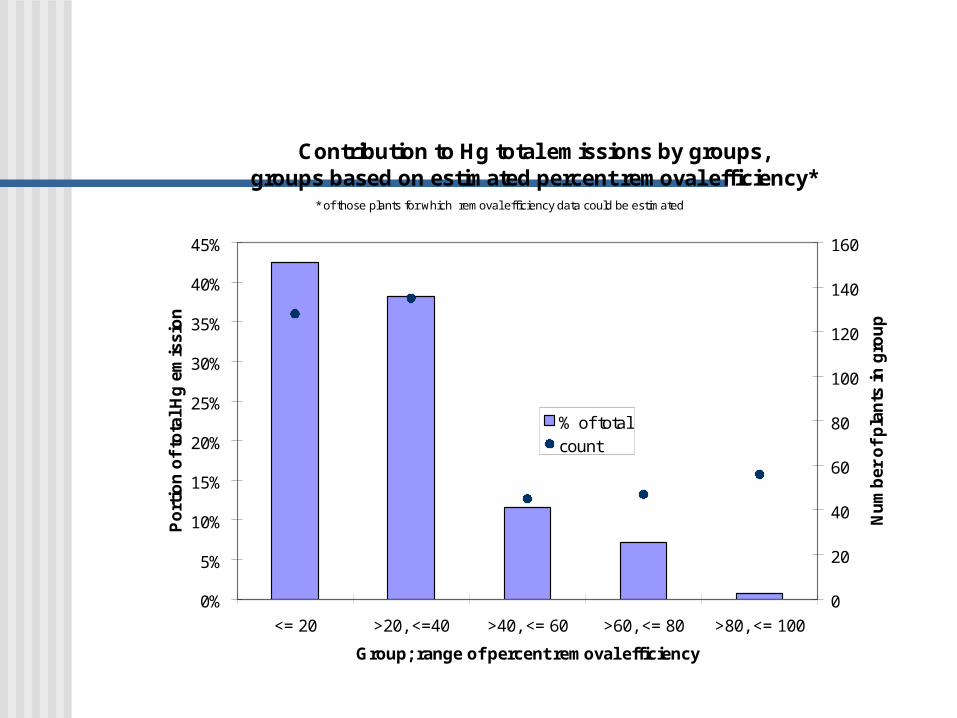
Contribution to Hg total emissions by groups, groups based on estimated percent removal efficiency*
0%
5%
10%
15%
20%
25%
30%
35%
40%
45%
<= 20 >20, <=40 >40, <= 60 >60, <= 80 >80, <= 100
Group; range of percent removal efficiency
Po
rtio
n o
f to
tal
Hg
em
issi
on
0
20
40
60
80
100
120
140
160
Nu
mb
er o
f p
lan
ts i
n g
rou
p
% of total
count
* of those plants for which removal efficiency data could be estimated
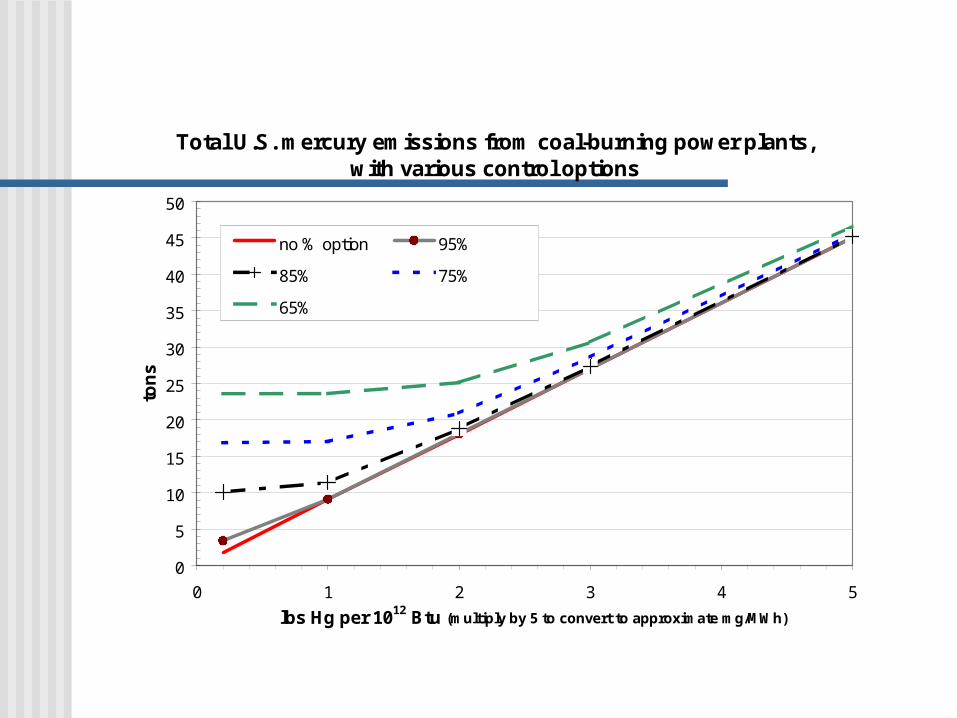
Total U.S. mercury emissions from coal-burning power plants, with various control options
0
5
10
15
20
25
30
35
40
45
50
0 1 2 3 4 5
lbs Hg per 1012 Btu (multiply by 5 to convert to approximate mg/MWh)
ton
s
no % option 95%
85% 75%
65%
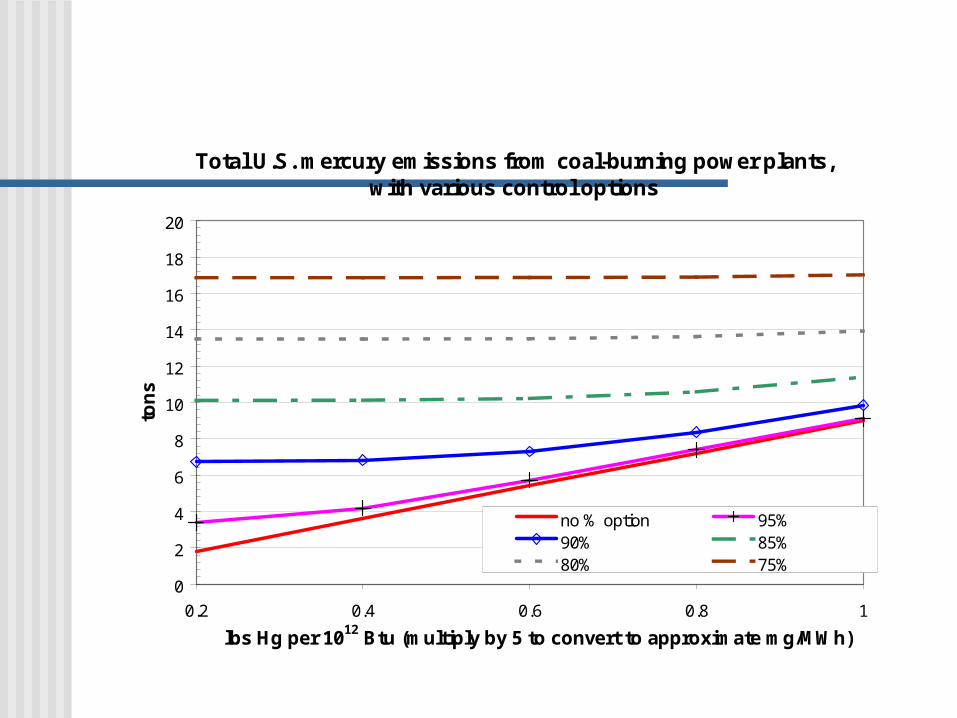
Total U.S. mercury emissions from coal-burning power plants, with various control options
0
2
4
6
8
10
12
14
16
18
20
0.2 0.4 0.6 0.8 1
lbs Hg per 1012 Btu (multiply by 5 to convert to approximate mg/MWh)
ton
s
no % option 95%90% 85%80% 75%
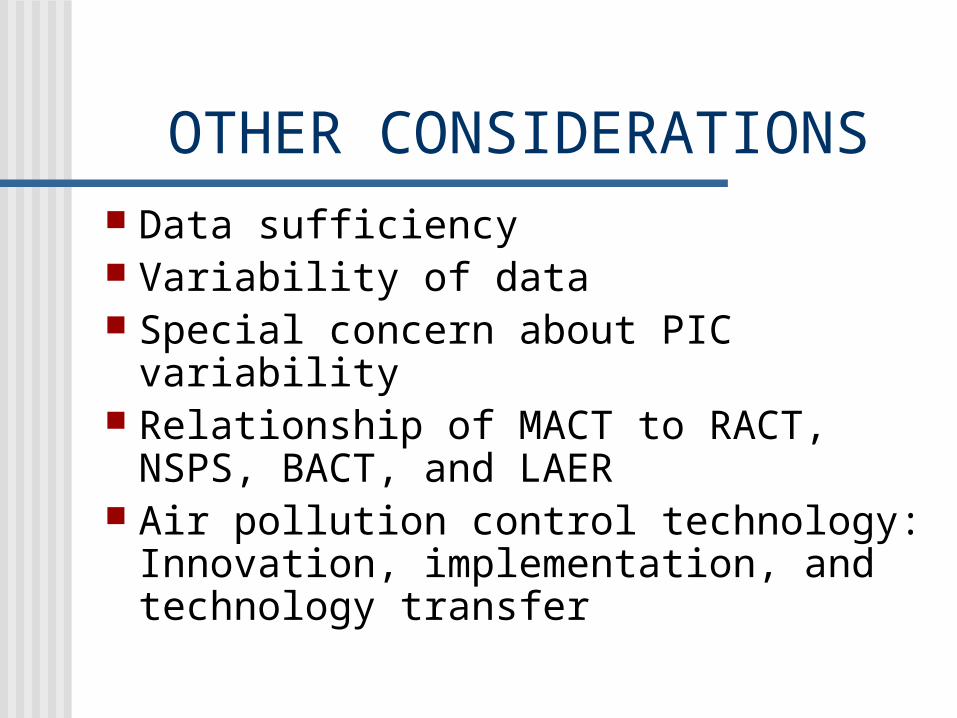
OTHER CONSIDERATIONS Data sufficiency Variability of data Special concern about PIC variability Relationship of MACT to RACT, NSPS,
BACT, and LAER Air pollution control technology:
Innovation, implementation, and technology transfer
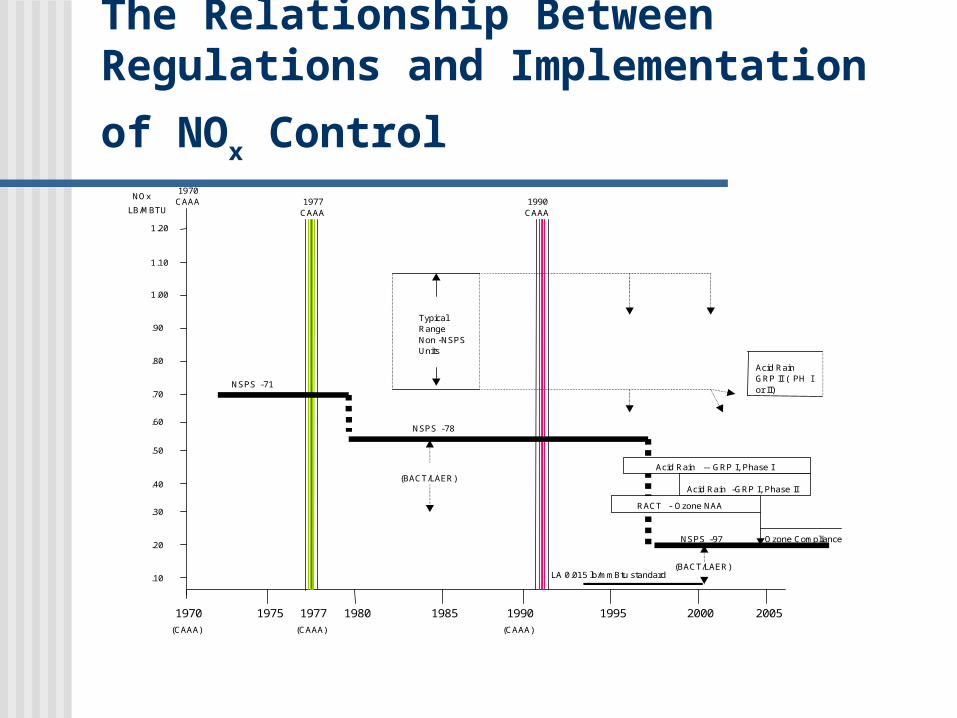
The Relationship Between Regulations and Implementation
of NOx Control
1970
(CAAA)
1990
(CAAA)
1995 20001975 1980 19851977
(CAAA)
2005
.10
.30
.20
.50
.40
.80
.70
.60
1.20
1.10
1.00
.90TypicalRangeNon -NSPSUnits
NOx
LB/MBTU
Acid RainGRP II ( PH Ior II)
Acid Rain -- GRP I, Phase I
Acid Rain -GRP I, Phase II
RACT - Ozone NAA
Ozone Compliance
(BACT/LAER)
NSPS -97
(BACT/LAER)
NSPS -78
NSPS -71
1990CAAA
1977CAAA
1970CAAA
LA 0.015 lb/mmBtu standard
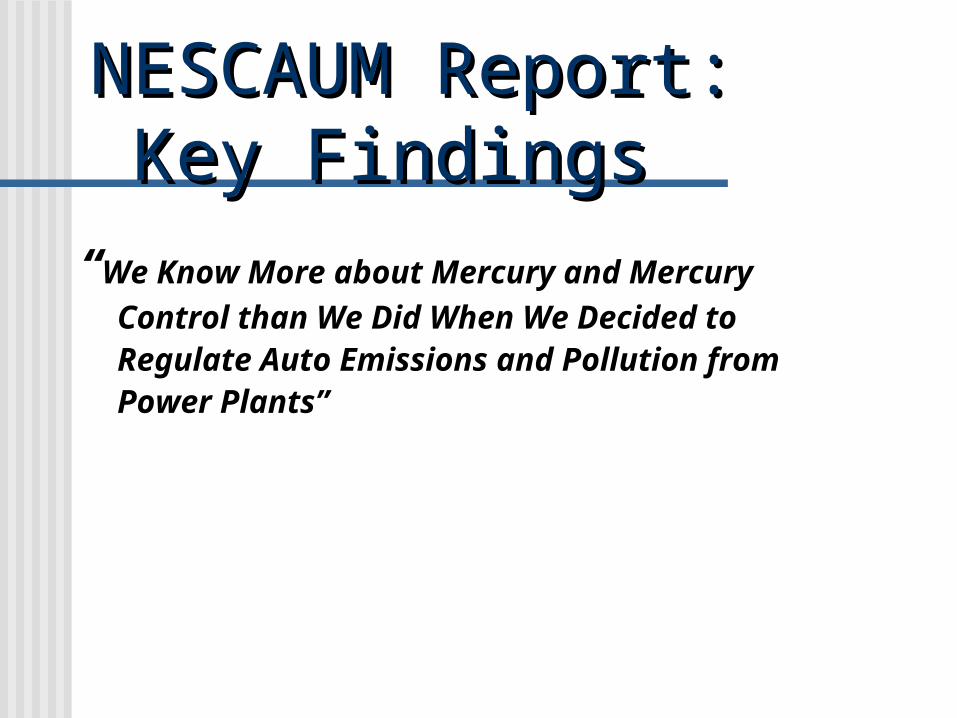
NESCAUM Report:NESCAUM Report: Key Findings Key Findings“We Know More about Mercury and
Mercury Control than We Did When We Decided to Regulate Auto Emissions and Pollution from Power Plants”