Embed Size (px)
Citation preview

Utilities’ Update on Energy Savings Assistance Program
Studies Ordered in D.12-08-044
LIOB Meeting
February 26, 2014San Francisco, California

2
Studies Ordered in D.12-08-044Studies Ordered in D.12-08-044CPUC Decision (D.)12-08-044 directed IOUs to conduct four Energy Savings Assistance (ESA) Program Studies during the 2012-2014 program cycle.
• Proposals were solicited in October 2012 through a public bidding process. • Research plans and Draft Reports were posted at www.energydataweb.com for review and
comment prior to public meetings for each study.• Final Reports are posted at www.energydataweb.com .
* With the support of Energy Division, the IOUs submitted requests to the ALJ and Assigned Commissioner to extend the final report delivery for the Multifamily, Energy Education, and Needs Assessment Studies. Extensions were approved. **This date applies to Phase 1 of the study.
Study ConsultantManaging
IOUProject
InitiationPublic
MeetingsFinal Report
ESA Multifamily Segment Study
Cadmus PG&E 1/18/20133/5/2013
9/25/201311/13/2013
12/4/2013
ESA Energy Education Study
Hiner / KEMA
SCE 1/24/20133/7/2013
10/17/201310/31/2013
Low Income Needs Assessment Study
Evergreen Economics
SCE 2/22/20133/19/201312/3/2013
12/16/2013
ESA PY2011 Impact Evaluation
Evergreen Economics
SDG&E 1/23/20132/20/20138/7/2013
8/31/2013

Low Income Studies OverviewLow Income Studies Overview
• Multifamily SegmentMultifamily Segment
• Energy Education
• Needs AssessmentNeeds Assessment
• Impact Evaluation
Understanding of market; esp various submarkets
Improvements to Energy Ed – materials and training,
Rationale to offer
Info on customer needs, penetration, opportunities,
Savings Estimates for existing measures
3
All research plans, workshop presentations, draft and final reports are available on CPUC’s www.energydataweb.com. Search on “ESA“

ESA Multifamily Segment Study - OVERVIEWESA Multifamily Segment Study - OVERVIEW• Study goals:
– Develop market segment profile information– Use the information to investigate promising comprehensive multifamily segment
strategies for the ESA Program
• Areas of Focus:1. Gather CA MF housing data relevant for low income customer programs
2. Catalog existing MF energy efficiency programs relevant for low income customers
3. Review and evaluate MF programs and research relevant for low income customers
4. Identify and assess alternative program designs and delivery strategies
5. Identify financing and funding options
6. Solicit public comment at key decision points
• Data Sources: – IOU program manager interviews– Stakeholder Interviews – Phone surveys with property owners and operators – Literature Review of low income MF programs – Review of Financing opportunities – Analyses of census data
4

ESA Multifamily Segment Study - OVERVIEWESA Multifamily Segment Study - OVERVIEWChief Areas of Learning / Insights
• General Market characterization• Understanding of some key property owner barriers, issues and needs• Understanding of other program design options from other jurisdictions• Understanding of measure gaps and potential opportunities
Limitations / Gaps• Mostly secondary research• Emphasis on property owner needs / issues; Little on tenant needs/issues• Difficulty getting property owners to participate in survey• Less information on needs of Market Rate property owners relative to
property owners serving Affordable Market• Limited comparison to non-low income• Not able to get property size distributions and locations from MF
characterization• Nothing on “savings potential” for the market• Different definitions of MF for EE and Low Income Programs
5

ESA Multifamily Segment Study - KEY FINDINGSESA Multifamily Segment Study - KEY FINDINGS
• Roughly 1/3 of CA residential market is LI• CA LI MF HHs are ~9% of Total CA residential HHs• Roughly 2/3 of the LI market are renters• Of those renters, 1/3 of those are MF the remaining 2/3 are SF renters.• Roughly 4/5 of the LI MF households will have moved at least once by 2020• More than 2/3 LI MF HHs are living in pre-1980 buildings• Older shells and equipment are more common in market rate properties.
6

ESA Multifamily Segment Study - KEY FINDINGSESA Multifamily Segment Study - KEY FINDINGSOverall Low Income Market Characterization
7
Affordable/Subsidized LI MF –6% of total LI market–20% of LI MF market
Market Rate LI MF Market Rate LI MF –25% of total LI market–75% of LI MF market
For ESA all of these For ESA all of these sectors are treated as sectors are treated as Single FamilySingle Family
Key StatsKey Stats::
•30% of CA res market is LI•Roughly 2/3 are renters•Of those renters, 1/3 of those are MF the remaining 2/3 are SF renters.•In Low Income MF sector, Affordable Market is much smaller market

ESA / CARE Needs Assessment - OVERVIEWESA / CARE Needs Assessment - OVERVIEW
• Overall Study Goal: • Identify and understand key issues regarding customer participation and needs
relevant to the CARE and ESA programs.
• Areas of Focus:• Identify and understand relevant characteristics and energy efficiency related
needs of the low income customers• Identify and understand factors related to program participation, including
willingness and barriers to participate.• Examine marketing, outreach and delivery practices to facilitate reaching and
enrolling eligible customers
• Data Sources: • Literature Review • Program Staff and Contractor In-Depth Interviews• Secondary Data Analyses• Customer Telephone Survey• Multivariate Analyses• In-Home Visits• Low Income Program Review
8

ESA / CARE Needs Assessment - OVERVIEWESA / CARE Needs Assessment - OVERVIEW
Chief Areas of Learning / Insights• General Market characterization• General Needs and Relative comparison of needs to 2005 LI pop
statistics• Measure needs & benefits• Barriers• Willingness to participate• Penetration• Energy Burden/Insecurity
• ESA/CARE Program Service areas of “success” and “gaps”
Limitations / Gaps• MANY objectives... As such, more cursory information/data on some. • “Savings potential”• Detailed needs of some submarkets (e.g., other language speakers,
rural markets, etc)• Field staff feedback (assessor & installer contractors)• Comparisons to general population• Energy Burden & Energy Insecurity
9
ESA Needs Assessment - KEY FINDINGSESA Needs Assessment - KEY FINDINGS
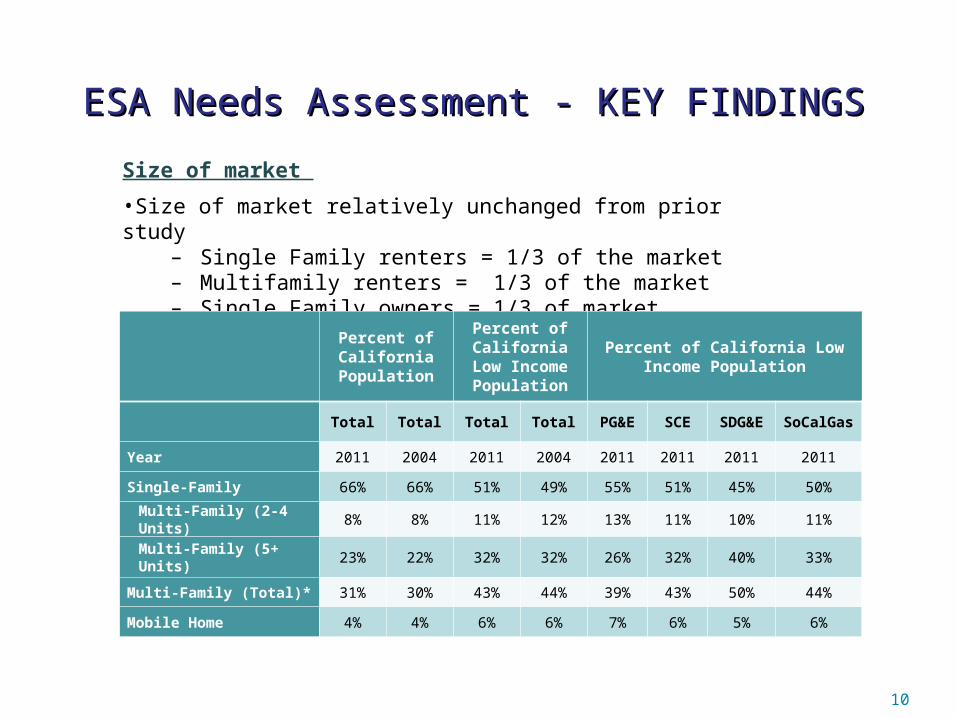
Size of market
•Size of market relatively unchanged from prior study– Single Family renters = 1/3 of the market– Multifamily renters = 1/3 of the market– Single Family owners = 1/3 of market
10
Percent of California Population
Percent of California Low
Income Population
Percent of California Low Income Population
Total Total Total Total PG&E SCE SDG&E SoCalGas
Year 2011 2004 2011 2004 2011 2011 2011 2011
Single-Family 66% 66% 51% 49% 55% 51% 45% 50%
Multi-Family (2-4 Units) 8% 8% 11% 12% 13% 11% 10% 11%
Multi-Family (5+ Units) 23% 22% 32% 32% 26% 32% 40% 33%
Multi-Family (Total)* 31% 30% 43% 44% 39% 43% 50% 44%
Mobile Home 4% 4% 6% 6% 7% 6% 5% 6%
ESA Needs Assessment - KEY FINDINGSESA Needs Assessment - KEY FINDINGS
Eligibility & Penetration
•Roughly 1/3 of California’s residential population is eligible for CARE & ESA
•Over 90% of the eligible households enrolled on CARE as of 12/31/2012*
•Almost 60% of the eligible households have been treated by ESA 2002-2012
•Both the CARE and ESA have been effectively reaching households in areas with higher rates of key eligible (sub) markets in need (e.g., single parent HH, HH with seniors, larger households, Hispanic & African American HH, etc)
•Households with single-source IOU fuel are less likely to be treated by ESA
•The ESA program has been less successful reaching areas with more renters, extreme poverty and higher energy usage.
Willingness to participate
•Just over half of the non-participants are willing to participate in ESA.
•This is significantly fewer than was estimated by the previous Needs Assessment (95%).
11

ESA Needs Assessment - KEY FINDINGSESA Needs Assessment - KEY FINDINGS
Program Benefits
•The average CARE customer saves $29/mo (33% savings) on electric bill and $6/mo (18% savings) on gas bill.
•Most ESA participants notice a reduction in their energy bills. The energy savings results are consistent with actual changes in bills.
•Roughly 2/3 of the participants report noticing improvements in health, comfort and safety
•Self-report data suggests that HVAC and weatherization measures are more likely to generate savings and improvements in health, comfort and safety.
•The next most beneficial measure was a refrigerator.
Key Barriers
•Consistent with previous Needs Assessment, key barriers to ESA participation include trusting a contractor; getting the landlord’s approval; Being home for appointments; and needing something the program offers.
•Providing income documents was not found to be a barrier.
•Single-family renters have greater energy-related needs and more barriers to participation relative to single-family homeowners and multi-family dwellers. 12

ESA Needs Assessment - OVERALL FINDINGSESA Needs Assessment - OVERALL FINDINGS
Energy Burden & Insecurity
• The mean energy burden (the ratio of actual energy expenditures to total self-reported income) is estimated at 8.0 percent.
• This is statistically unchanged from 2005 data collected for the prior Needs Assessment study.
13
• Multifamily households have relatively fewer energy needs & lowest burden.
• Central Valley reports greatest burden;
• South inland the least.
• Among IOU territories, PG&E most burden.
• Multifamily households have relatively fewer energy needs & lowest burden.
• Central Valley reports greatest burden;
• South inland the least.
• Among IOU territories, PG&E most burden.