Embed Size (px)
Citation preview

Utilities | Stock Recommendation
Nihar ShahMichael Song
03.09.2010

Recommendation
• Decrease weight in SIM portfolio by 73 bps
• Final: Underweight 151 bps
• Total weight of SIM: 200 bps
Introduction
• Utilities Sector– Size: 1721.2B– Industries
Industry Market Cap P/E ROE % Div. Yield % Price to Book
Diversified Utilities 135.0B 11.5 13.00% 4.69% 1.84
Electric Utilities 301.6B 15.1 10.00% 3.95% 1.81
Foreign Utilities 1170.9B 86.0 1.60% 1.58% 1.98
Gas Utilities 104.3B 15.7 13.80% 3.99% 3.31
Water Utilities 9.5B 0.0 -5.20% 3.47% 1.75
Source: Yahoo Finance as of 2/23/10

S&P/SIM Weight
(.78)%
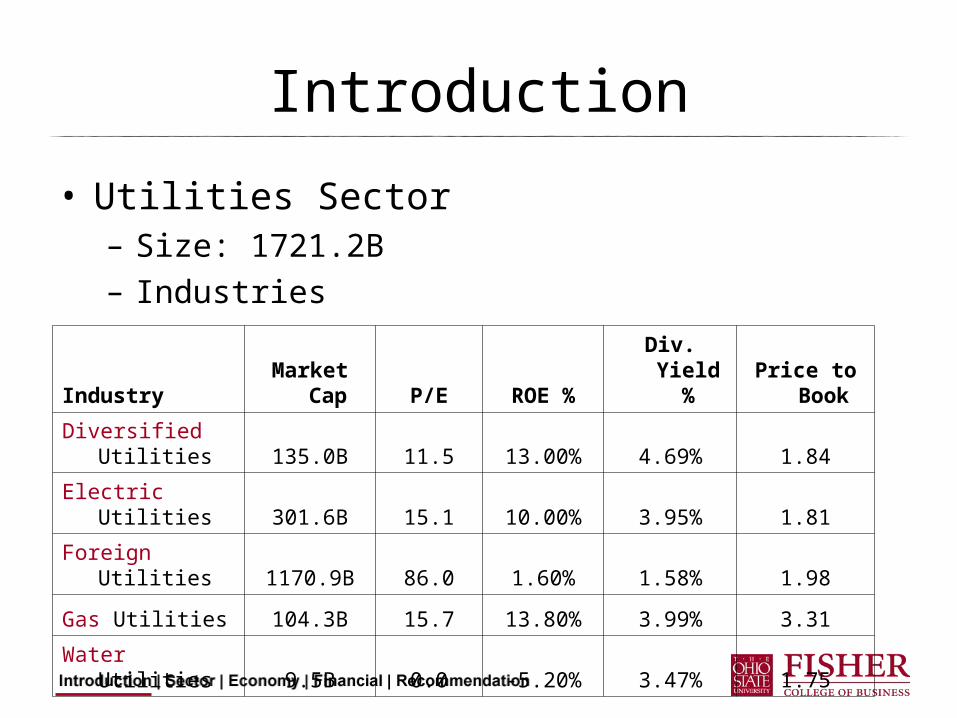
S&P/Sector Performance (YTD)
Outperform

Exelon Corp (EXC)
• Exelon is a diversified utility company which operates through three subsidiaries: Generation, PECO, and ComEd• Generation consists of owned and
contracted electric generating facilities with 24,850 MW of capacity, of which 17,009 MW (68.5%) is nuclear
• ComEd delivers energy to retail customers in northern Illinois

Exelon Corp (EXC)
Absolute Valuation High Low Median Current Target
MultipleTarget
E,S,B/ShareTarget Price
P/Forward E 20.8 9.3 13.0 12.1 12.1 3.77 45.6
P/S 3.3 1.0 1.8 1.7 1.8 26.26 47.3
P/B 6.8 1.8 3.1 2.4 2.5 18.96 47.4
P/EBITDA 9.5 2.8 5.8 3.9 5.8 11.76 68.1
P/CF 13.6 4.5 8.2 5.6 7.5 8.05 60.4
Multiples Valuation:

Exelon Corp (EXC)Year 2010E 2011E 2012E 2013E 2014E 2015E 2016E 2017E 2018E 2019E 2020E
Revenue 17,664 18,548 19,475 20,449 21,471 22,545 23,672 24,856 26,098 27,403 28,773 % Growth 5.0% 5.0% 5.0% 5.0% 5.0% 5.0% 5.0% 5.0% 5.0% 5.0%
Operating Income 5,028 5,343 5,649 5,930 6,227 6,538 6,865 7,208 7,569 7,947 8,344 Operating Margin 28.5% 28.8% 29.0% 29.0% 29.0% 29.0% 29.0% 29.0% 29.0% 29.0% 29.0%
Interest Income (768) (807) (847) (890) (934) (981) (1,030) (1,081) (1,135) (1,192) (1,252) Interest % of Sales -4.4% -4.4% -4.4% -4.4% -4.4% -4.4% -4.4% -4.4% -4.4% -4.4% -4.4%
Taxes 1,651 1,758 1,861 1,953 2,051 2,153 2,261 2,374 2,493 2,618 2,748 Tax Rate 38.8% 38.8% 38.8% 38.8% 38.8% 38.8% 38.8% 38.8% 38.8% 38.8% 38.8%
Net Income 2,609 2,778 2,941 3,087 3,242 3,404 3,574 3,753 3,940 4,137 4,344 % Growth 6.5% 5.9% 5.0% 5.0% 5.0% 5.0% 5.0% 5.0% 5.0% 5.0%
Add Depreciation/Amort 1,811 1,855 1,947 2,045 2,147 2,254 2,367 2,486 2,610 2,740 2,877 % of Sales 10.3% 10.0% 10.0% 10.0% 10.0% 10.0% 10.0% 10.0% 10.0% 10.0% 10.0%Plus/(minus) Changes WC 65 211 221 225 236 248 260 273 287 301 317 % of Sales 0.4% 1.1% 1.1% 1.1% 1.1% 1.1% 1.1% 1.1% 1.1% 1.1% 1.1%Subtract Cap Ex 3,356 3,431 3,505 3,579 3,650 3,720 3,788 3,853 3,915 3,973 4,028 Capex % of sales 19.0% 18.5% 18.0% 17.5% 17.0% 16.5% 16.0% 15.5% 15.0% 14.5% 14.0% Free Cash Flow 998 991 1,162 1,329 1,503 1,690 1,893 2,112 2,348 2,603 2,877 % Growth -0.7% 17.2% 14.4% 13.1% 12.5% 12.0% 11.6% 11.2% 10.8% 10.5%
NPV of Cash Flows 10,952 34%
NPV of terminal value 20,861 66%
Terminal EV/EBIT
DA 5.4 Terminal
Value 49,385 Projected Equity Value 31,813 100%
Free Cash Flow Yield 3.31%Terminal
P/E 11.4
Free Cash Yield 5.83%
Shares Outstanding 662
Current Price $ 45.50 Implied equity value/share $ 48.06 Upside/(Downside) to DCF 5.6%
Terminal Discount Rate: 9.0%
Terminal FCF Growth: 3.0%

Exelon Corp (EXC)
• Valuation• Current Price:
$45.50• Target Price: $48.06• Upside: 5.6%• Dividend Yield:
$2.10 / 4.6%• $30.1 Billion• Recommendation:
Sell 100%
Sensitivity Analysis:

Public Service Enterprise Group (PEG)
• PEG is a diversified utility company with operations primarily in the Northeastern and Mid-Atlantic United States
• 3 Primary Businesses (% of total revenue):• Power (74.7%) - Selling electricity, natural gas,
capacity, and emissions credits under contract or on spot market
• PSE&G (20.4%) - Provides electric transmission and electric and gas distribution to residential, commercial and industrial customers in New Jersey. Currently increasing level of renewable generation
• Energy Holdings (4.5%) - Manages leveraged lease investments and operates domestic generation projects. Also pursuing solar and other renewable generation projects.

PEG/S&P Performance (5 year)

Relative Multiple ValuationRelative to Industry
High Low Median Current
P/Trailing E 2.6 .12 .95 .81P/Forward E 1.5 .44 .91 .83P/B 3.4 .3 1.4 1.2P/S 19.4 .6 1.6 1.2P/CF 1.7 .2 1.2 1.0P/EBITDA 1.58 .92 1.32 .94
Relative to S&P 500
High Low Median Current
P/Trailing E 1.4 .31 .66 .57P/Forward E 1.3 .32 .67 .67P/B 1.5 .3 .8 .8P/S 1.6 .4 .9 1.1P/CF 1.2 .3 .7 .6P/EBITDA 1.24 .54 .93 .59

Absolute ValuationAbsolute Valuation
High Low Median
Current #Your Target Multiple
*Your Target E, S, B, etc/Share
Your Target Price (F x G)
A. B. C. D. E. F. G. H.
P/Forward E 19.0 6.8 11.5 9.9 11.5 3.16 36.34
P/S 2.0 .6 1.2 1.3 1.3 30.09 39.12
P/B 3.6 1.4 2.3 1.8 2.2 17.33 38.13
P/EBITDA 8.13 2.41 4.40 3.85 4.5 8.10 36.45
P/CF 12.9 4.3 7.1 6.2 7.0 5.03 35.23

Public Service Enterprise Group Inc. (PEG)
Analyst: Nihar Shah Terminal Discount Rate = 9.0%
3/6/2010 Terminal FCF Growth = 5.0%
(Millions)
Year 2010E 2011E 2012E 2013E 2014E 2015E 2016E 2017E 2018E 2019E 2020E
Revenue 15,259 15,717 16,346 17,000 17,680 18,387 19,122 19,887 20,683 21,510 22,370
% Growth 3.0% 4.0% 4.0% 4.0% 4.0% 4.0% 4.0% 4.0% 4.0% 4.0%
Operating Income 3,392 3,285 3,463 3,655 3,819 3,990 4,169 4,355 4,530 4,711 4,899
Operating Margin 22.2% 20.9% 21.2% 21.5% 21.6% 21.7% 21.8% 21.9% 21.9% 21.9% 21.9%
Interest Income (641) (644) (654) (680) (707) (735) (765) (795) (827) (860) (895)
Interest % of Sales -4.2% -4.1% -4.0% -4.0% -4.0% -4.0% -4.0% -4.0% -4.0% -4.0% -4.0%
Taxes 1,149 1,103 1,173 1,242 1,299 1,359 1,421 1,486 1,546 1,607 1,672
Tax Rate 41.8% 41.8% 41.8% 41.8% 41.8% 41.8% 41.8% 41.8% 41.8% 41.8% 41.8%
Net Income 1,602 1,538 1,636 1,733 1,813 1,896 1,983 2,074 2,157 2,243 2,333
% Growth -4.0% 6.4% 5.9% 4.6% 4.6% 4.6% 4.6% 4.0% 4.0% 4.0%
Add Depreciation/Amort 992 982 981 1,020 1,061 1,103 1,147 1,193 1,241 1,291 1,342
% of Sales 6.5% 6.3% 6.0% 6.0% 6.0% 6.0% 6.0% 6.0% 6.0% 6.0% 6.0%
Plus/(minus) Changes WC 737 116 159 170 177 184 191 199 207 215 224
% of Sales 4.8% 0.7% 1.0% 1.0% 1.0% 1.0% 1.0% 1.0% 1.0% 1.0% 1.0%
Subtract Cap Ex 1,940 1,680 1,645 1,711 1,779 1,850 1,924 2,001 2,081 2,164 2,251
Capex % of sales 12.7% 10.7% 10.1% 10.1% 10.1% 10.1% 10.1% 10.1% 10.1% 10.1% 10.1%
Free Cash Flow (83) 725 814 872 918 965 1,015 1,067 1,110 1,154 1,200
% Growth -977.1% 12.2% 7.2% 5.2% 5.2% 5.2% 5.1% 4.0% 4.0% 4.0%
NPV of Cash Flows 6,085 31%
NPV of terminal value 13,307 69% Terminal Value 31,503
Projected Equity Value 19,392 100%
Free Cash Flow Yield -0.52% Free Cash Yield 3.81%
Current P/E 9.9 10.3 9.7 Terminal P/E 13.5
Projected P/E 12.1 12.6 11.9
Current EV/EBITDA 5.3 5.5 5.2 Terminal EV/EBITDA 6.2
Projected EV/EBITDA 6.1 6.3 6.0
Shares Outstanding 507
Current Price $ 31.20
Implied equity value/share $ 38.25
Upside/(Downside) to DCF 22.6%
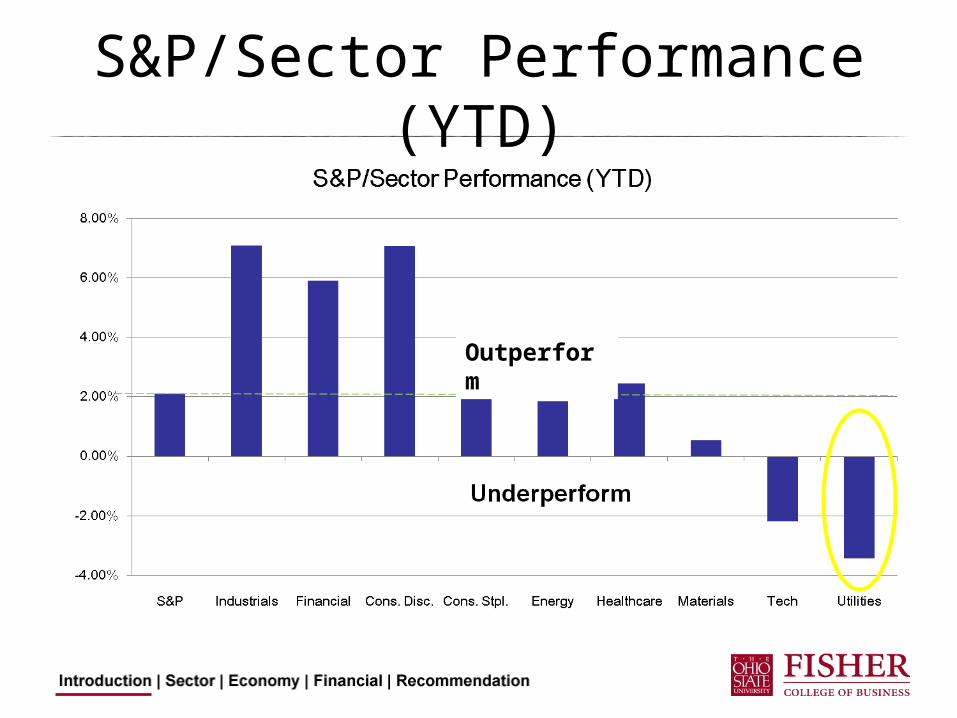
PEG
• Current Price: $31.2• Upside: 19.5%• Yield: 4.4%• $15.5 Billion• DCF: Discount Rate = 9%, Pgrowth = 5%• Recommendation:
Buy 200 BPS
• Valuation (Weighted): $37.27.3 DCF + .3 P/FE + .1 P/B + .1 P/S +.1 P/CF + .1 P/EBITDA
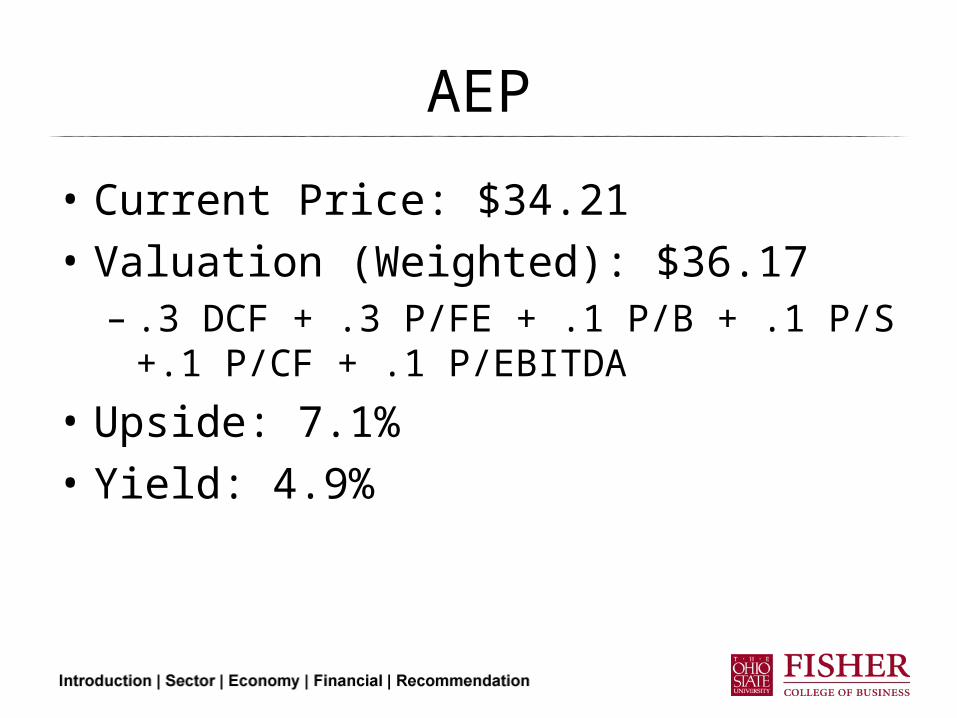
AEP
• Current Price: $34.21• Valuation (Weighted): $36.17
– .3 DCF + .3 P/FE + .1 P/B + .1 P/S +.1 P/CF + .1 P/EBITDA
• Upside: 7.1%• Yield: 4.9%

Questions?

Old Slides

Utilities – Catalysts/Risks
• Catalysts– Rate Regulation Increase– Weather Patterns– Improvement in Economy– Green Policy (Nuclear/Water)
• Risks– Rate Regulation Neutral/Decrease– Inconsistent or over-demand– Commodity Prices– Green Policy (Electric/Diversified/Gas)

Largest Companies in (SPUT)
Company Market Cap Sales (in M) EPS 5 Yr Growth LT Growth ROE Yield ROE + Yield
SPUT 355.0 B N/A N/A 8.00% 5.00% 12.30% 4.60% 16.90%
EXC 29.5 B 17.32 B 4.09 10.00% 0.00% 22.90% 4.70% 27.60%
SO 25.9 B 15.74 B 2.07 3.00% 4.00% 13.00% 5.40% 18.40%
NGG 24.7 B 24.13 B 3.85 2.00% 7.00% 25.20% 4.60% 32.90%
DUK 21.40 B 12.73 B .83 -8.00% 4.00% 7.40% 5.80% 13.20%
FPL 19.40 B 15.65 B 3.97 12.00% 7.00% 13.60% 4.30% 17.90%
AEP 16.10 B 13.44 B 2.88 5.00% 4.00% 12.00% 4.90% 16.90%
FE 12.10 B 12.97 B 3.29 11.00% 3.00% 13.60% 5.50% 19.10%
EIX 11.00 B 12.54 B 2.59 10.00% 3.00% 11.30% 3.70% 15.00%
OKE 4.60 B 10.23 B 2.65 3.00% 10.00% 14.40% 4.00% 18.40%
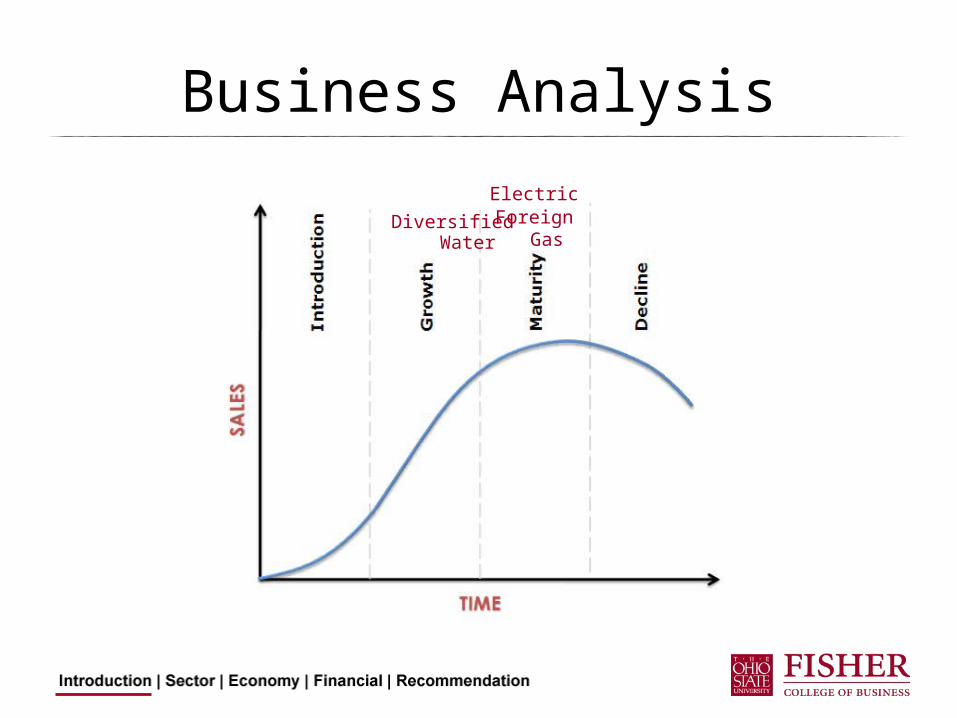
Business Analysis
Electric
Water GasForeignDiversified

Industry vs Sector Performance

Sector vs S&P Performance
Historical Prices
0
50
100
150
200
250
Jan-00
May-00
Sep-00
Jan-01
May-01
Sep-01
Jan-02
May-02
Sep-02
Jan-03
May-03
Sep-03
Jan-04
May-04
Sep-04
Jan-05
May-05
Sep-05
Jan-06
May-06
Sep-06
Jan-07
May-07
Sep-07
Jan-08
May-08
Sep-08
Jan-09
May-09
Sep-09
Jan-10
Sector S&P
Correlation: 80.93%
Outperform Outperform

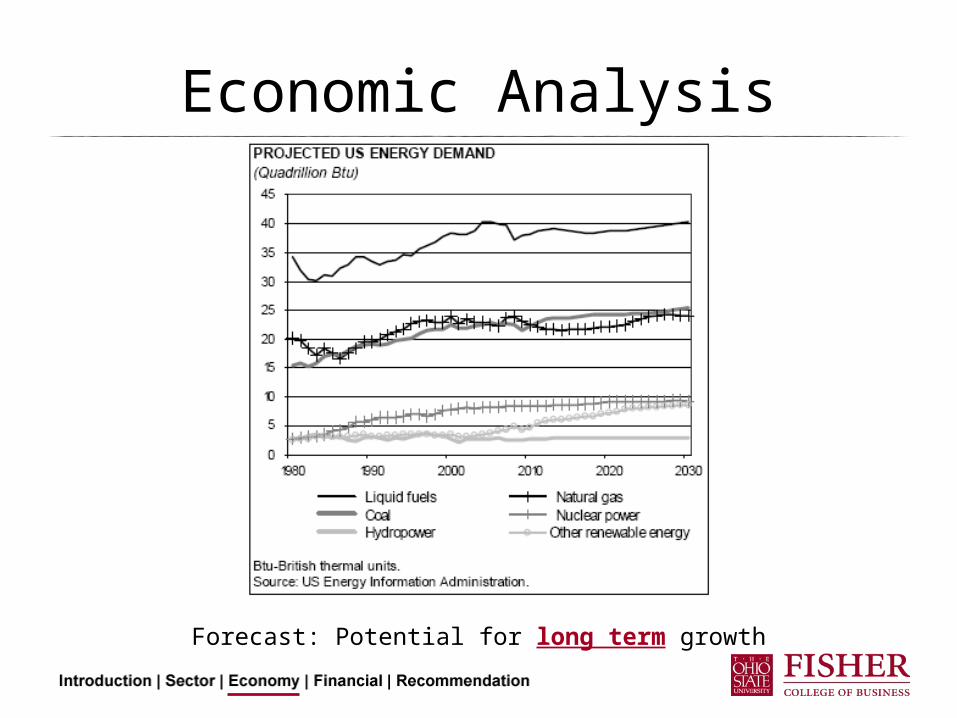
Economic Analysis

Economic AnalysisUnemployment vs GDP
12,200
12,400
12,600
12,800
13,000
13,200
13,400
13,600
Jan-04 May-05 Oct-06 Feb-08 Jul-09 Nov-10
GD
P
0.0
2.0
4.0
6.0
8.0
10.0
12.0
Une
mpl
oym
ent
Real Gross Domestic Product Unemployment Rate

Economic Analysis
Change in GDP vs Sector Price
-8.00
-6.00
-4.00
-2.00
0.00
2.00
4.00
6.00
8.00
10.00
Aug-87 May-90 Jan-93 Oct-95 Jul-98 Apr-01 Jan-04 Oct-06 Jul-09 Apr-12
% C
hang
e in
GD
P
-30
-20
-10
0
10
20
30
40
% C
hang
e in
Sec
tor
Real Gross Domestic Product EXC.S
Forecast: GDP will very slowly increase over the short term

Economic AnalysisRelative Strength of Utility Sector vs S&P 500
0.0
0.5
1.0
1.5
2.0
2.5
3.0
Aug-87 May-90 Jan-93 Oct-95 Jul-98 Apr-01 Jan-04 Oct-06 Jul-09 Apr-12
S&P 500 Rel Str

Economic Analysis
Forecast: Interest Rate will increase in the short term

Economic Analysis
EXC.S vs OIL (USO)
R2 = 0.4733
0
20
40
60
80
100
120
100 120 140 160 180 200 220 240
Utility Sector Price (EXC.S)
Oil
ETF
Pric
e (U
SO)

Economic Analysis

Economic Analysis
EXC.S vs Natural Gas (UNG)
R2 = 0.7701
010203040506070
100 120 140 160 180 200 220 240
Utility Sector Price (EXC.S)
Nat
ural
Gas
ETF
Pri
ce
(UN
G)
Forecast: Natural Gas Price will stay relatively constant in the short term

Economic Analysis
EXC.S vs Coal (KOL)
R2 = 0.7565
010203040506070
100 120 140 160 180 200 220
Utility Sector Price (EXC.S)
Coal
EFT
Pri
ce (K
OL)
Economic Analysis
Forecast: Potential for long term growth

Regulation• State commissions are responsible for determining utilities’ proper rate bases and allowable
operating expenses. Individual states’ rulings often differ with regard to these determinations. They also differ in allowed accounting treatments for depreciation accruals and investment tax credits. Although rulings are often presumed to be based solely on the public interest, commissions actually seek to provide a balance between investor and consumer interests.

Green Policy (Update)• On June 26, 2009, the House of Representatives passed, by a
narrow 217–205 margin, its version of a new energy bill, H.R. 2454. Included in the bill, called the American Clean Energy and Security Act, 2005–2050, were provisions for a cap-and-trade system that would incrementally reduce GHG emissions, beginning with a cap on 2012 emissions that is 3% below 2005 levels. The bill, whose principal sponsor was Henry Waxman (D.–California), also included a requirement that utilities get 15% of their electricity from renewable energy sources and, through increasing their energy efficiencies, reduce their electricity use 5% by 2020. Individual states, however, would be allowed to vary these two percentages as long as the total came to 20%.

Financial Analysis
Sector

Financial Analysis

Margins
Net ProfitN/A

Summary
Analysis Conclusions View
Business Mature industry, cyclical in nature Neutral
Economic Expect slow growth Slightly Negative
Financial Declining Revenue, stable profit margin stable ROE, and declining Net Profit Margin.
Negative
Valuation Sector seems to be trading at a slight discount.
Slightly positive
Overall: Slightly negative for short term

Recommendation
• Decrease weight in SIM portfolio by 72 bps
• Final: Underweight 150 bps

Questions