Embed Size (px)
Citation preview

Utah Department of HealthCenter for Health Data
Utah Vital Statistics
Abortions
2014

Blank

Utah Vital Statistics
Abortions
2014 August 2015Technical Report No. 290

Mission Statement
The Office of Vital Records and Statistics administers thestatewide system of Vital Records and Statistics bydocumenting and certifying the facts of births, deaths, and family formation for the legal purposes of the citizens of Utah, participates in the National Vital Statistics System, and responds to the needs of health programs, health care providers, businesses, researchers, educational institutions and the Utah public for data and statistical information.

This publication was produced by the
Statistical Products Section
in the
Office of Vital Records and Statistics
Richard J. Oborn, MPA, Director
Staff Contributors
Marie Aschlimann Mylitta Barrett
Cynthia Robison
Utah Department of Health
Center for Health Data and Informatics
OFFICE OF VITAL RECORDS AND STATISTICS PO BOX 141012
SALT LAKE CITY UT 84114-1012
Located in the Cannon Health Building 288 North 1460 West
Salt Lake City UT
vitalrecords.health.utah.gov [email protected]”
Phone: (801) 538-6843 Fax: (801) 323-1570
This information can be made available in alternative formats upon request.

Blank

PREFACE
This 2014 report is the 37th in a series on legally induced abortions in Utah. Previous reports were for the combined years 1974-1975, 1975-1977, 1978-1980, each year from 1981-1998, combined years 1999-2000, 2001-2002 and each year from 2003-2013. These tabulations are published annually to make commonly used vital records data available to health programs, health care providers, businesses, researchers, educational institutions, and the Utah public. Data are presented for the state overall, local health districts, and Utah counties. The Utah Vital Statistics report series no longer includes abortion data for the United States. The most recent abortion data for the United States is published by the U.S. Centers for Disease Control and Prevention in the Morbidity and Mortality Weekly Report, "Abortion Surveillance - United States, 2011," Vol. 63(SS11);1-41; Atlanta, Georgia, November 28, 2014. The website for this report is http://www.cdc.gov. Searchers should use the keyword “abortion surveillance” to find the most current report.

TABLE OF CONTENTS
Page ix List of Summary Tables xi List of Reference Tables xiii List of Appendices S-1 Summary Tables R-1 Reference Tables T-1 Technical Appendix


List of Summary Tables
Page S-3 Table 1. Estimated population, females ages 15-44, resident
live births, abortions, and abortion rates and ratios: Utah, 1980 and 1990-2014
S-3 Table 2. Abortions occurring in Utah by state of residence:
2014 S-4 Table 3. Abortions, live births, and abortion ratios by health
district and county of residence: Utah, 1990, 1995 and 2000-2014
S-5 Table 4. Abortions, live births, and ratios by marital status,
residents: Utah, 1980, 1990, 1995-2014 S-6 Table 5. Population for females ages 15 to 44, residents:
Utah, 1990, 1995 and 2000-2014 S-6 Table 6. Age-specific abortion rates, residents: Utah, 1990,
1995 and 2000-2014 Figure S-7 Figure 1. Abortions per 1,000 live births, residents: Utah,
2000-2014
ix

Blank

List of Reference Tables
Page R-3 Table R1. Abortions by health district, county of residence,
and age of woman: Utah, 2014 R-4 Table R2. Abortions by health district, county of residence,
and month of occurrence: Utah, 2014 R-5 Table R3. Abortions by age and marital status of woman,
residents: Utah, 2014 R-5 Table R4. Abortions by weeks gestation and marital status of
woman, residents: Utah, 2014 R-5 Table R5. Abortions by age and education of woman,
residents: Utah, 2014 R-6 Table R6. Abortions by age and race of woman, residents:
Utah, 2014 R-6 Table R7. Abortions by weeks gestation and race of woman,
residents: Utah, 2014 R-7 Table R8. Abortions by age of woman and number of prior
live births, residents: Utah, 2014 R-7 Table R9. Abortions by age of woman and number of prior
abortions, residents: Utah, 2014 R-7 Table R10. Abortions by weeks gestation and number of
prior abortions, residents: Utah, 2014
xi
(List of Reference Tables continued) R-8 Table R11. Abortions by age of woman and reason for
termination, residents: Utah, 2014 R-8 Table R12. Abortions by weeks gestation and reason for
termination, residents: Utah, 2014 R-9 Table R13. Abortions by age of woman and weeks gestation,
residents: Utah, 2014 R-10 Table R14. Abortions by age of woman and method of
termination, residents: Utah, 2014 R-10 Table R15. Abortions by weeks gestation and method of
termination, residents: Utah, 2014 R-11 Table R16. Abortions by age of woman and mention of any
complications, residents: Utah, 2014 R-11 Table R17. Abortions by age of woman and history of
contraceptive use in past year, residents: Utah, 2014 R-11 Table R18. Abortions by age of woman, pregnancy due to
omission of contraceptive, residents: Utah, 2014 R-12 Table R19. Abortions by age of woman and method of
contraceptive in past year, residents: Utah, 2014 R-12 Table R20. Abortions by marital status of woman and
method of contraceptive in past year, residents: Utah, 2014
xii

(List of Reference Tables continued) R-13 Table R21. Abortions by number of prior live births, prior
abortions, and method of contraceptive in past year, residents: Utah, 2014
R-13 Table R22. Abortions by education of woman and method of
contraceptive in past year, residents: Utah, 2014 Technical Appendix
T-4 Figure 1. State of Utah -- Department of Health report of
induced termination of pregnancy
xiii

Blank

2014 Summary Tables:
Abortions

Blank

Abortions
Estimated population Resident Occurrence Residents
Year females ages 15-44 1 Live Births Number Number Rate2 Ratio3
1980 342,817 41,786 4,086 3,821 11.1 91.4
1990 395,807 36,253 4,796 4,159 10.5 114.71991 411,839 36,019 4,213 3,759 9.1 104.41992 428,353 37,198 3,941 3,525 8.2 94.81993 443,618 37,048 3,945 3,615 8.1 97.61994 460,914 38,271 3,610 3,304 7.2 86.31995 475,165 39,554 3,705 3,292 6.9 83.21996 488,404 42,056 3,639 3,293 6.7 78.31997 502,401 43,009 3,408 3,140 6.2 73.01998 510,715 45,128 3,487 3,237 6.3 71.71999 520,259 46,243 3,381 3,160 6.1 68.3
2000 528,769 47,331 3,509 3,279 6.2 69.32001 534,884 47,915 3,594 3,372 6.3 70.42002 540,124 49,140 3,524 3,300 6.1 67.22003 543,155 49,834 3,576 3,338 6.1 67.02004 547,780 50,653 3,665 3,379 6.2 66.72005 555,517 51,517 3,556 3,279 5.9 63.62006 564,615 53,475 3,753 3,444 6.1 64.42007 576,269 55,063 3,932 3,516 6.1 63.92008 586,879 55,605 3,911 3,510 6.0 63.12009 596,032 53,849 3,665 3,270 5.5 60.72010 604,078 52,164 3,779 3,446 5.7 66.1
2011 612,145 51,144 3,386 3,081 5.0 60.22012 620,369 51,439 3,273 3,018 4.9 58.72013 631,084 50,913 3,102 2,893 4.6 56.82014 639,388 51,165 2,948 2,767 4.3 54.1
State of
Residence Frequency Percent
Total 2,948 100.0
Idaho 85 2.9Nevada 19 0.6Utah 2,767 93.9Wyoming 56 1.9Other states 18 0.6Other countries 3 0.1
Other states include: Arizona, California, Colorado, Florida, Hawaii, Illinois, Indiana, Montana, Nebraska, New York, North Carolina, Tennessee, Texas, Washington, and Wisconsin.
3Ratios are per 1,000 live births.
Table 1. Estimated population, females ages 15-44, resident live births, abortions, and abortion rates and ratios: Utah, 1980 and 1990-2014
Table 2. Abortions occurring in Utah by state of residence: 2014
2Rates are per 1,000 females 15 to 44 years of age.
1Population projections/estimates are revised as historical data becomes available, and rates may not agree with previous reports.
Female population for the State of Utah: U.S. Census Bureau, Population Division; PEPSYASEX-Geography-Utah: Annual Estimates of the Resident Population by Single Year of Age and Sex for the United States, States, and Puerto Rico Commonwealth: April 1, 2010 to July 1, 2014; Release date: June 2015.
Utah Vital Statistics: Abortions, 2014 S-3

District and Abortion Abortion ratios by year
county of Live Abor- Ratio
residence births tions 2014 1990 1995 2000 2001 2002 2003 2004 2005 2006 2007 2008 2009 2010 2011 2012 2013
Total 51,165 2,767 54.1 114.7 83.2 69.3 70.4 67.2 67.0 66.7 63.6 64.4 63.9 63.1 60.7 66.1 60.2 58.7 56.8
Bear River 3,261 127 38.9 60.9 37.3 32.6 29.6 32.0 32.3 24.3 27.9 27.2 31.7 29.9 30.7 40.8 31.6 28.7 33.4Box Elder 885 32 36.2 29.4 21.5 27.1 34.0 39.8 29.4 23.2 25.1 22.9 27.4 30.2 30.2 41.4 35.9 30.5 39.7Cache 2,337 92 39.4 74.7 43.3 35.0 28.3 29.6 33.4 25.0 29.3 29.2 33.3 30.2 31.4 40.4 30.6 27.6 31.0Rich 39 3 - - - - - - - - - - - - - - - - - - - - - - - - - - - - - - - - - -
Central Utah 1,136 21 18.5 36.7 29.5 23.2 21.2 26.1 23.1 17.5 27.3 17.3 17.3 24.2 20.4 24.1 29.5 21.8 22.4Juab 171 2 - - - - - - - - - - - - - - - - - - - - - - - - 38.1 - - - - - - - -Millard 191 5 - - 30.4 51.0 38.3 40.8 - - - - - - - - - - - - - - - - - - - - - - - -Piute 16 0 - - - - - - - - - - - - - - - - - - - - - - - - - - - - - - - - - -Sanpete 386 3 - - 26.9 21.9 19.1 - - 37.9 35.5 - - 23.3 16.9 17.2 27.1 17.8 28.4 37.1 18.9 18.8Sevier 341 11 32.3 44.0 33.7 24.0 - - - - - - - - 36.2 21.4 22.3 35.7 - - 23.0 28.1 38.5 30.7Wayne 31 0 - - - - - - - - - - - - - - - - - - - - - - - - - - - - - - - - - -
Davis 5,783 213 36.8 85.5 62.9 58.1 52.4 47.5 57.1 51.5 45.5 48.2 46.3 38.7 44.6 47.9 41.9 39.1 35.7
Salt Lake 17,886 1,689 94.4 181.0 139.9 117.2 126.4 116.5 117.5 119.1 112.6 113.5 114.2 115.5 109.7 119.0 106.4 107.7 100.6
San Juan 236 0 - - - - - - - - - - - - - - - - - - - - - - - - - - - - - - - - - -
Southeastern 504 21 41.7 87.6 44.4 25.7 14.7 32.3 41.9 35.6 31.6 39.7 35.0 31.2 28.1 43.1 33.4 26.9 22.2Carbon 265 17 64.2 128.0 77.7 46.5 30.5 63.3 82.8 56.1 82.2 81.4 73.4 52.5 49.7 85.4 63.1 56.6 45.6Emery 129 2 - - - - - - - - - - - - - - - - - - - - - - - - - - - - - - - - - -Grand 110 2 - - 183.5 70.7 - - - - - - - - - - - - - - - - - - - - - - - - - - - -
Southwest 3,314 10 3.0 12.7 5.1 3.9 - - - - - - 3.8 3.6 2.0 2.0 2.5 4.1 4.4 3.6 3.9 2.2Beaver 96 0 - - - - - - - - - - - - - - - - - - - - - - - - - - - - - - - - - -Garfield 61 1 - - - - - - - - - - - - - - - - - - - - - - - - - - - - - - - - - -Iron 828 3 - - - - - - - - - - - - - - - - - - - - - - - - - - - - - - - - - -Kane 75 0 - - - - - - - - - - - - - - - - - - - - - - - - - - - - - - - - - -Washington 2,254 6 - - - - - - - - - - - - - - - - 3.3 - - - - - - - - 2.8 3.7 4.1 - -
Summit 420 72 171.4 349.4 282.7 190.3 165.4 173.1 150.0 163.0 166.3 181.7 164.7 179.8 160.1 179.4 152.7 175.5 143.5
Tooele 993 49 49.3 94.9 94.6 49.2 58.2 73.1 66.4 63.5 85.1 52.8 50.7 53.7 41.9 57.6 66.7 52.5 51.6
TriCounty 1,220 23 18.9 72.5 29.1 33.2 22.8 30.0 27.1 34.1 33.8 43.7 35.5 39.0 36.0 44.2 20.7 32.5 29.7Daggett 12 0 - - - - - - - - - - - - - - - - - - - - - - - - - - - - - - - - - -Duchesne 451 10 22.2 35.3 - - 24.8 29.2 34.5 - - 29.2 26.8 32.3 33.8 19.0 - - 44.1 28.6 22.7 28.5Uintah 757 13 17.2 92.4 38.8 39.6 19.8 25.7 36.7 35.5 36.1 47.7 37.0 52.7 49.9 45.4 16.2 39.1 28.2
Utah County 11,952 271 22.7 32.4 23.6 23.7 20.3 22.7 22.6 22.5 22.5 23.5 24.0 24.7 26.0 24.9 25.0 21.9 22.9
Wasatch 474 25 52.7 105.0 41.5 71.0 66.2 68.7 35.9 70.1 52.1 61.1 80.9 76.2 48.8 55.3 92.4 57.9 55.7
Weber-Morgan 3,986 246 61.7 129.6 86.2 68.4 72.0 69.8 68.0 72.0 66.9 78.3 71.0 66.1 59.4 65.9 66.2 61.5 69.4Morgan 159 1 - - - - 96.8 - - - - - - - - - - - - - - - - - - - - - - - - - - - -Weber 3,827 245 64.0 132.5 85.9 69.3 73.2 70.9 69.1 73.3 68.1 80.8 72.9 67.8 61.6 66.9 67.1 63.4 71.7
Table 3. Abortions, live births, and abortion ratios by health district and county of residence: Utah, 1990, 1995 and 2000-2014
Ratios are per 1,000 live births and are not computed for fewer than seven events or when the number of births is less than 30.
S-4 Utah Vital Records: Abortions, 2014

Year
Marital status 1980 1990 1995 1996 1997 1998 1999 2000 2001 2002 2003
Total*Induced abortions 3,821 4,159 3,292 3,293 3,140 3,237 3,160 3,279 3,372 3,300 3,338Live births 41,786 36,253 39,554 42,056 43,009 45,128 46,243 47,331 47,915 49,140 49,834Ratio per 1,000 live births 91.4 114.7 83.2 78.3 73.0 71.7 68.3 69.3 70.4 67.2 67.0
Married**Induced abortions 975 774 786 754 794 860 858 809 844 756 771Live births 39,181 31,343 33,338 35,231 35,864 37,388 38,543 39,135 39,593 40,671 41,254Ratio per 1,000 live births 24.9 24.7 23.6 21.4 22.1 23.0 22.3 20.7 21.3 18.6 18.7
Unmarried***Induced abortions 2,820 3,351 2,494 2,515 2,329 2,357 2,284 2,455 2,348 2,268 2,143Live births 2,605 4,886 6,215 6,798 7,121 7,722 7,699 8,175 8,322 8,469 8,580Ratio per 1,000 live births 1,082.5 685.8 401.3 370.0 327.1 305.2 296.7 300.3 282.1 267.8 249.8
Year
Marital status 2004 2005 2006 2007 2008 2009 2010 2011 2012 2013 2014
Total*Induced abortions 3,379 3,279 3,444 3,516 3,510 3,270 3,446 3,081 3,018 2,893 2,767Live births 50,653 51,517 53,475 55,063 55,605 53,849 52,164 51,144 51,439 50,913 51,165Ratio per 1,000 live births 66.7 63.6 64.4 63.9 63.1 60.7 66.1 60.2 58.7 56.8 54.1
Married**Induced abortions 795 760 830 880 762 773 944 987 916 705 697Live births 41,822 42,416 43,412 44,254 44,281 43,358 42,273 41,561 41,822 41,107 41,441Ratio per 1,000 live births 19.0 17.9 19.1 19.9 17.2 17.8 22.3 23.7 21.9 17.2 16.8
Unmarried***Induced abortions 2,270 2,230 2,187 2,371 2,390 2,252 2,251 1,821 1,819 1,838 1,951Live births 8,831 9,101 10,063 10,809 11,324 10,486 9,891 9,583 9,596 9,784 9,690Ratio per 1,000 live births 257.0 245.0 217.3 219.4 211.1 214.8 227.6 190.0 189.6 187.9 201.3
Table 4. Abortions, live births, and ratios by marital status, residents: Utah, 1980, 1990, 1995-2014
Table 4 continued. Abortions, live births, and ratios by marital status, residents: Utah, 1980, 1990, 1995-2014
Abortion ratios for data year 1995 are slightly different from the original published data in this series because birth data for these years are updated.
*Women with marital status unknown are included in the annual totals but are not distributed.
**The sum of women who are married plus women who are separated.
***The sum of women who are widowed, divorced, and those who have never married.
Utah Vital Statistics: Abortions, 2014 S-5
Five-year age groupsTotal (15 to 44 years of age)
Year 15-44 15-19 20-24 25-29 30-34 35-39 40-44
1990 395,807 76,809 69,527 68,108 69,165 61,719 50,479
1995 475,165 96,751 87,652 73,818 75,510 75,365 66,069
2000 528,769 109,105 113,713 85,514 72,066 74,162 74,209
2001 534,884 107,507 117,893 86,501 75,196 72,433 75,3542002 540,124 105,723 120,489 89,315 77,867 71,166 75,5642003 543,155 104,124 120,293 92,863 80,187 69,995 75,6932004 547,780 103,674 119,184 96,309 82,628 70,378 75,6072005 555,517 104,382 117,683 99,886 85,921 72,990 74,6552006 564,615 105,061 115,729 105,473 88,019 76,585 73,7482007 576,269 106,726 113,820 109,680 92,611 80,095 73,3372008 586,879 108,218 113,211 111,343 98,229 82,830 73,0482009 596,032 108,952 113,133 111,907 102,736 85,505 73,7992010 604,078 108,834 113,584 110,908 106,384 88,189 76,179
2011 612,145 107,418 116,448 109,117 109,269 90,514 79,3792012 620,369 107,481 118,958 106,751 110,884 94,543 81,7522013 631,084 109,575 120,980 105,594 111,777 98,944 84,2142014 639,388 111,233 121,791 105,769 111,345 102,990 86,260
Total Age of woman
Year 15-44 15-19 20-24 25-29 30-34 35-39 40-44
1990 10.5 12.7 19.8 13.2 7.8 4.1 1.5
1995 6.9 6.3 12.3 11.0 6.6 3.7 1.2
2000 6.2 5.3 10.3 8.4 6.0 3.4 1.1
2001 6.3 5.1 9.8 8.4 6.5 3.9 1.22002 6.1 4.8 9.5 8.6 5.9 3.9 1.22003 6.1 5.1 9.3 8.2 6.2 4.1 1.22004 6.2 4.9 10.0 7.8 6.0 4.0 1.32005 5.9 4.9 8.8 7.9 5.4 4.3 1.22006 6.1 5.3 9.7 8.0 5.5 3.8 1.22007 6.1 5.4 9.9 7.6 5.4 3.8 1.52008 6.0 5.2 9.1 7.9 5.2 3.9 1.72009 5.5 4.2 8.9 6.9 5.1 3.9 1.42010 5.7 4.0 9.3 7.7 5.2 3.8 1.8
2011 5.0 3.8 8.3 7.0 4.6 3.0 1.52012 4.9 3.3 8.0 6.5 4.6 3.5 1.52013 4.6 3.1 7.7 6.3 4.8 2.9 1.22014 4.3 2.9 7.2 6.1 4.3 3.1 1.1
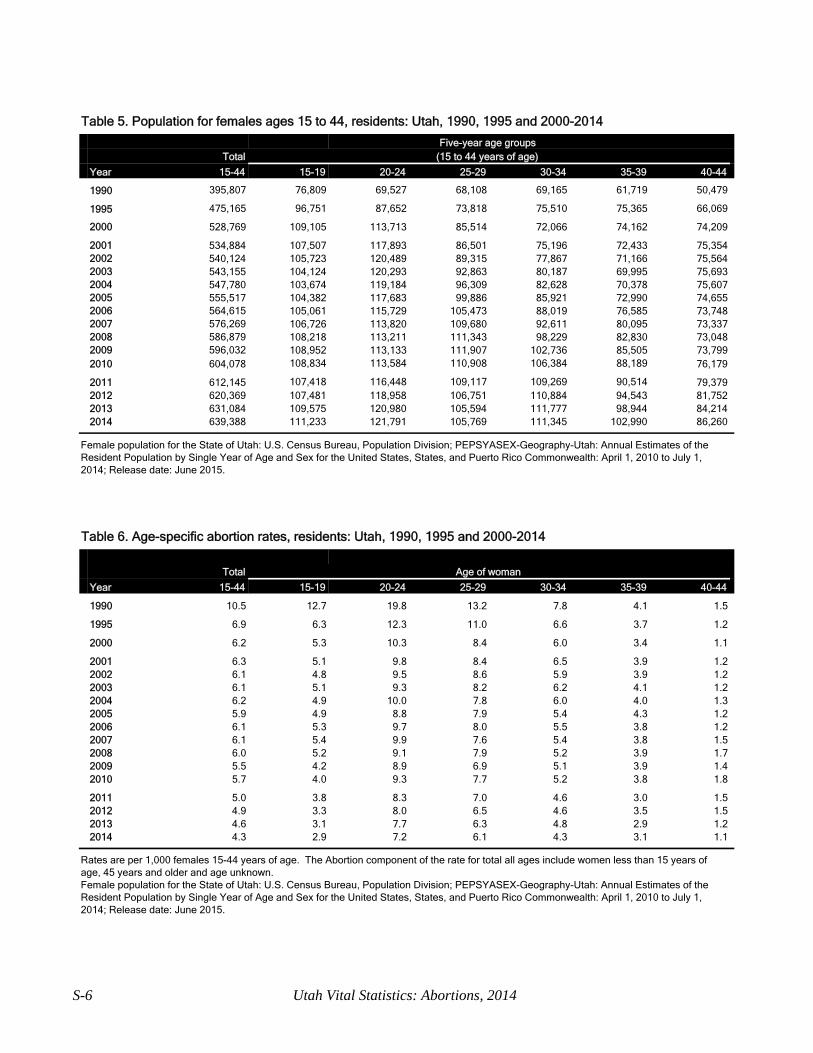
Table 5. Population for females ages 15 to 44, residents: Utah, 1990, 1995 and 2000-2014
Table 6. Age-specific abortion rates, residents: Utah, 1990, 1995 and 2000-2014
Female population for the State of Utah: U.S. Census Bureau, Population Division; PEPSYASEX-Geography-Utah: Annual Estimates of the Resident Population by Single Year of Age and Sex for the United States, States, and Puerto Rico Commonwealth: April 1, 2010 to July 1, 2014; Release date: June 2015.
Female population for the State of Utah: U.S. Census Bureau, Population Division; PEPSYASEX-Geography-Utah: Annual Estimates of the Resident Population by Single Year of Age and Sex for the United States, States, and Puerto Rico Commonwealth: April 1, 2010 to July 1, 2014; Release date: June 2015.
Rates are per 1,000 females 15-44 years of age. The Abortion component of the rate for total all ages include women less than 15 years of age, 45 years and older and age unknown.
S-6 Utah Vital Statistics: Abortions, 2014

Figure 1
0.0
1.0
2.0
3.0
4.0
5.0
6.0
7.0
8.0
200
0
200
1
200
2
200
3
200
4
200
5
200
6
200
7
200
8
200
9
201
0
201
1
201
2
201
3
201
4
Ab
ort
ion
s p
er 1
000
bir
ths
Year
Abortions per 1,000 live births, residents: Utah, 2000-2014
Utah Vital Statistics: Abortions, 2014 S-7

Blank

2014 Reference Tables:
Abortions

Blank

Age of WomanDistrict and Under 15 to 19 45 and Un-County Total 15 Total 15 to 17 18 to 19 20 to 24 25 to 29 30 to 34 35 to 39 40 to 44 over known
Total 2,767 9 325 86 239 874 641 475 324 94 8 17
Bear River 127 0 28 9 19 45 23 13 16 2 0 0Box Elder 32 0 6 2 4 13 4 4 5 0 0 0Cache 92 0 20 6 14 32 19 9 10 2 0 0Rich 3 0 2 1 1 0 0 0 1 0 0 0
Central Utah 21 0 3 1 2 6 5 3 3 1 0 0Juab 2 0 0 0 0 2 0 0 0 0 0 0
Millard 5 0 0 0 0 1 1 2 1 0 0 0Piute 0 0 0 0 0 0 0 0 0 0 0 0Sanpete 3 0 0 0 0 0 2 0 1 0 0 0Sevier 11 0 3 1 2 3 2 1 1 1 0 0Wayne 0 0 0 0 0 0 0 0 0 0 0 0
Davis 213 0 25 8 17 67 44 45 25 6 0 1
Salt Lake 1,689 5 172 45 127 536 408 298 192 61 6 11
San Juan 0 0 0 0 0 0 0 0 0 0 0 0
Southeastern 21 0 2 2 0 8 6 3 1 1 0 0Carbon 17 0 2 2 0 7 4 2 1 1 0 0Emery 2 0 0 0 0 0 1 1 0 0 0 0Grand 2 0 0 0 0 1 1 0 0 0 0 0
Southwest 10 0 4 0 4 2 3 1 0 0 0 0Beaver 0 0 0 0 0 0 0 0 0 0 0 0Garfield 1 0 0 0 0 0 0 1 0 0 0 0Iron 3 0 1 0 1 1 1 0 0 0 0 0Kane 0 0 0 0 0 0 0 0 0 0 0 0Washington 6 0 3 0 3 1 2 0 0 0 0 0
Summit 72 0 4 2 2 21 20 15 6 6 0 0
Tooele 49 1 5 0 5 12 13 11 6 0 1 0
TriCounty 23 1 3 0 3 7 4 4 3 0 0 1Daggett 0 0 0 0 0 0 0 0 0 0 0 0Duchesne 10 1 2 0 2 4 1 2 0 0 0 0Uintah 13 0 1 0 1 3 3 2 3 0 0 1
Utah County 271 2 39 6 33 89 56 30 39 11 1 4
Wasatch 25 0 1 0 1 6 5 5 7 1 0 0
Weber-Morgan 246 0 39 13 26 75 54 47 26 5 0 0Morgan 1 0 1 1 0 0 0 0 0 0 0 0Weber 245 0 38 12 26 75 54 47 26 5 0 0
Table R1. Abortions by health district, county of residence, and age of woman: Utah, 2014
Utah Vital Statistics: Abortions, 2014 R-3
District and Month of OccurrenceCounty Total Jan Feb Mar Apr May Jun Jul Aug Sep Oct Nov Dec
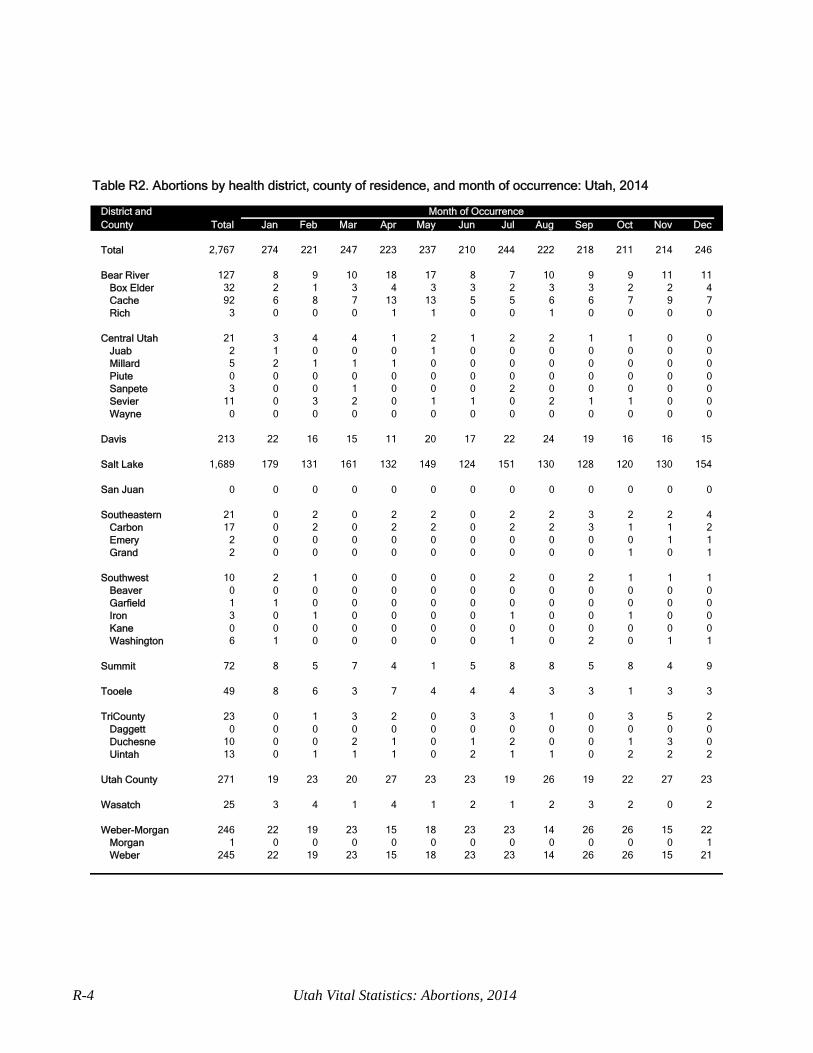
Total 2,767 274 221 247 223 237 210 244 222 218 211 214 246
Bear River 127 8 9 10 18 17 8 7 10 9 9 11 11Box Elder 32 2 1 3 4 3 3 2 3 3 2 2 4Cache 92 6 8 7 13 13 5 5 6 6 7 9 7Rich 3 0 0 0 1 1 0 0 1 0 0 0 0
Central Utah 21 3 4 4 1 2 1 2 2 1 1 0 0Juab 2 1 0 0 0 1 0 0 0 0 0 0 0Millard 5 2 1 1 1 0 0 0 0 0 0 0 0Piute 0 0 0 0 0 0 0 0 0 0 0 0 0Sanpete 3 0 0 1 0 0 0 2 0 0 0 0 0Sevier 11 0 3 2 0 1 1 0 2 1 1 0 0Wayne 0 0 0 0 0 0 0 0 0 0 0 0 0
Davis 213 22 16 15 11 20 17 22 24 19 16 16 15
Salt Lake 1,689 179 131 161 132 149 124 151 130 128 120 130 154
San Juan 0 0 0 0 0 0 0 0 0 0 0 0 0
Southeastern 21 0 2 0 2 2 0 2 2 3 2 2 4Carbon 17 0 2 0 2 2 0 2 2 3 1 1 2Emery 2 0 0 0 0 0 0 0 0 0 0 1 1Grand 2 0 0 0 0 0 0 0 0 0 1 0 1
Southwest 10 2 1 0 0 0 0 2 0 2 1 1 1Beaver 0 0 0 0 0 0 0 0 0 0 0 0 0Garfield 1 1 0 0 0 0 0 0 0 0 0 0 0Iron 3 0 1 0 0 0 0 1 0 0 1 0 0Kane 0 0 0 0 0 0 0 0 0 0 0 0 0Washington 6 1 0 0 0 0 0 1 0 2 0 1 1
Summit 72 8 5 7 4 1 5 8 8 5 8 4 9
Tooele 49 8 6 3 7 4 4 4 3 3 1 3 3
TriCounty 23 0 1 3 2 0 3 3 1 0 3 5 2Daggett 0 0 0 0 0 0 0 0 0 0 0 0 0Duchesne 10 0 0 2 1 0 1 2 0 0 1 3 0Uintah 13 0 1 1 1 0 2 1 1 0 2 2 2
Utah County 271 19 23 20 27 23 23 19 26 19 22 27 23
Wasatch 25 3 4 1 4 1 2 1 2 3 2 0 2
Weber-Morgan 246 22 19 23 15 18 23 23 14 26 26 15 22Morgan 1 0 0 0 0 0 0 0 0 0 0 0 1Weber 245 22 19 23 15 18 23 23 14 26 26 15 21
Table R2. Abortions by health district, county of residence, and month of occurrence: Utah, 2014
R-4 Utah Vital Statistics: Abortions, 2014
Marital Status of WomanNever Un-
Age Total Married Married Widowed Divorced Separated known
Total 2,767 1,680 587 11 260 110 119
Under 15 9 9 0 0 0 0 0Total 15 to 19 325 296 9 0 2 3 15
15-17 86 83 1 0 0 0 218-19 239 213 8 0 2 3 13
20-24 874 709 72 3 13 23 5425-29 641 376 154 3 59 32 1730-34 475 188 168 1 78 26 1435-39 324 69 135 3 83 20 1440-44 94 19 42 1 23 5 445 and over 8 1 5 0 1 1 0Unknown 17 13 2 0 1 0 1
Marital Status of WomanWeeks Never Un-gestation Total Married Married Widowed Divorced Separated known
Total 2,767 1,680 587 11 260 110 119
Under 5 23 16 4 0 1 2 05-6 942 543 217 3 104 49 267-8 947 585 187 4 99 35 379-10 354 239 58 1 22 16 1811-12 160 105 29 1 17 3 513-14 171 110 38 1 11 2 915-20 133 72 37 1 2 2 1921 and over 17 2 11 0 1 0 3Unknown 20 8 6 0 3 1 2
Education of Woman Under High Over
Age Total 12 Years School 12 Years Unknown
Total 2,767 191 1,263 1,180 133
Under 15 9 7 2 0 0Total 15 to 19 325 86 171 53 15
15-17 86 67 12 5 218-19 239 19 159 48 13
20-24 874 31 454 334 5525-29 641 30 284 304 2330-34 475 13 184 265 1335-39 324 15 128 162 1940-44 94 3 33 51 745 and over 8 0 3 5 0Unknown 17 6 4 6 1
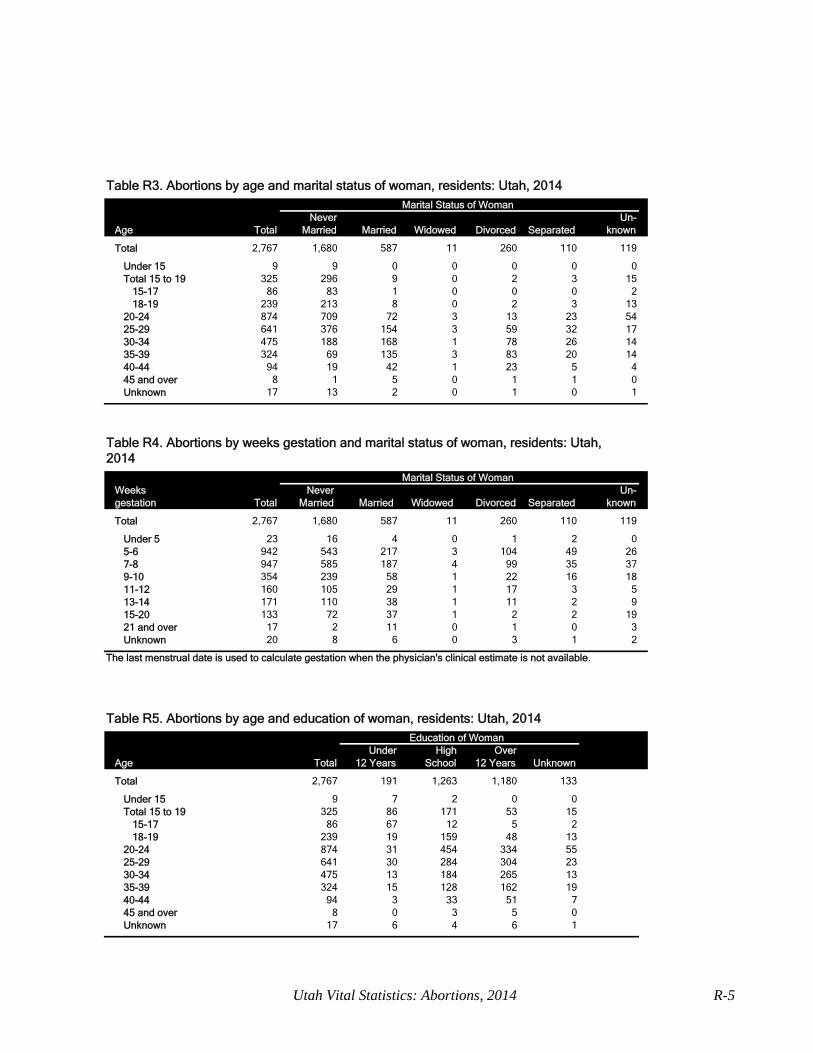
Table R3. Abortions by age and marital status of woman, residents: Utah, 2014
Table R4. Abortions by weeks gestation and marital status of woman, residents: Utah, 2014
Table R5. Abortions by age and education of woman, residents: Utah, 2014
The last menstrual date is used to calculate gestation when the physician's clinical estimate is not available.
Utah Vital Statistics: Abortions, 2014 R-5

Race of Woman
Asian and
Pacific Native Un-
Age Total White Black Hispanic Islander American Other known
Total 2,767 1,813 100 528 111 17 122 76
Under 15 9 5 0 3 0 0 1 0Total 15 to 19 325 210 10 64 16 3 16 6
15-17 86 56 3 19 2 0 4 218-19 239 154 7 45 14 3 12 4
20-24 874 566 38 171 35 4 38 2225-29 641 449 24 110 19 4 20 1530-34 475 306 12 85 25 3 30 1435-39 324 210 10 67 11 2 10 1440-44 94 56 2 23 4 1 3 545 and over 8 4 0 1 1 0 2 0Unknown 17 7 4 4 0 0 2 0
Race of WomanAsian and
Weeks Pacific Native Un-gestation Total White Black Islander American Other known
Total 2,767 1,813 100 528 111 17 122 76
Under 5 23 11 0 7 3 0 1 15-6 942 598 37 175 38 6 57 317-8 947 621 34 187 39 3 38 259-10 354 243 14 65 11 2 12 711-12 160 109 4 32 5 3 4 313-14 171 119 6 28 7 2 5 415-20 133 90 5 24 7 1 4 221 and over 17 10 0 4 1 0 1 1Unknown 20 12 0 6 0 0 0 2
The last menstrual date is used to calculate gestation when the physician's clinical estimate is not available.
Table R6. Abortions by age and race of woman, residents: Utah, 2014
Table R7. Abortions by weeks gestation and race of woman, residents: Utah, 2014
R-6 Utah Vital Statistcs: Abortions, 2014

Prior Live Births
Five or Un-
Age Total None One Two Three Four More known
Total 2,767 1,323 578 461 215 100 60 30
Under 15 9 8 1 0 0 0 0 0Total 15 to 19 325 275 41 5 0 0 0 4
15-17 86 82 2 2 0 0 0 018-19 239 193 39 3 0 0 0 4
20-24 874 550 204 85 21 8 0 625-29 641 292 159 118 42 16 6 830-34 475 121 96 135 65 34 18 635-39 324 54 55 91 66 28 24 640-44 94 13 18 24 17 13 9 045 and over 8 0 2 1 2 1 2 0Unknown 17 10 2 2 2 0 1 0
Prior AbortionsFive or Un-
Age Total None One Two Three Four More known
Total 2,767 2,048 515 128 37 8 7 24
Under 15 9 8 1 0 0 0 0 0Total 15 to 19 325 302 19 0 1 0 0 3
15-17 86 82 4 0 0 0 0 018-19 239 220 15 0 1 0 0 3
20-24 874 704 129 31 2 2 0 625-29 641 434 155 35 9 2 1 530-34 475 301 112 37 16 1 3 535-39 324 218 74 16 6 2 3 540-44 94 59 24 8 2 1 0 045 and over 8 6 1 1 0 0 0 0Unknown 17 16 0 0 1 0 0 0
Prior AbortionsWeeks Five or Un-gestation Total None One Two Three Four More known
Total 2,767 2,048 515 128 37 8 7 24
Under 5 23 20 2 1 0 0 0 05-6 942 684 179 53 15 4 1 67-8 947 706 173 39 16 1 4 89-10 354 252 74 19 0 2 2 511-12 160 122 27 8 2 0 0 113-14 171 126 31 7 4 1 0 215-20 133 107 23 1 0 0 0 221 and over 17 16 1 0 0 0 0 0Unknown 20 15 5 0 0 0 0 0
Table R8. Abortions by age of woman and number of prior live births, residents: Utah, 2014
Table R9. Abortions by age of woman and number of prior abortions, residents: Utah, 2014
Table R10. Abortions by weeks gestation and number of prior abortions, residents: Utah, 2014
The last menstrual date is used to calculate gestation when the physician's clinical estimate is not available.
Utah Vital Statistics: Abortions, 2014 R-7
Reason for TerminationMaternal Fetal
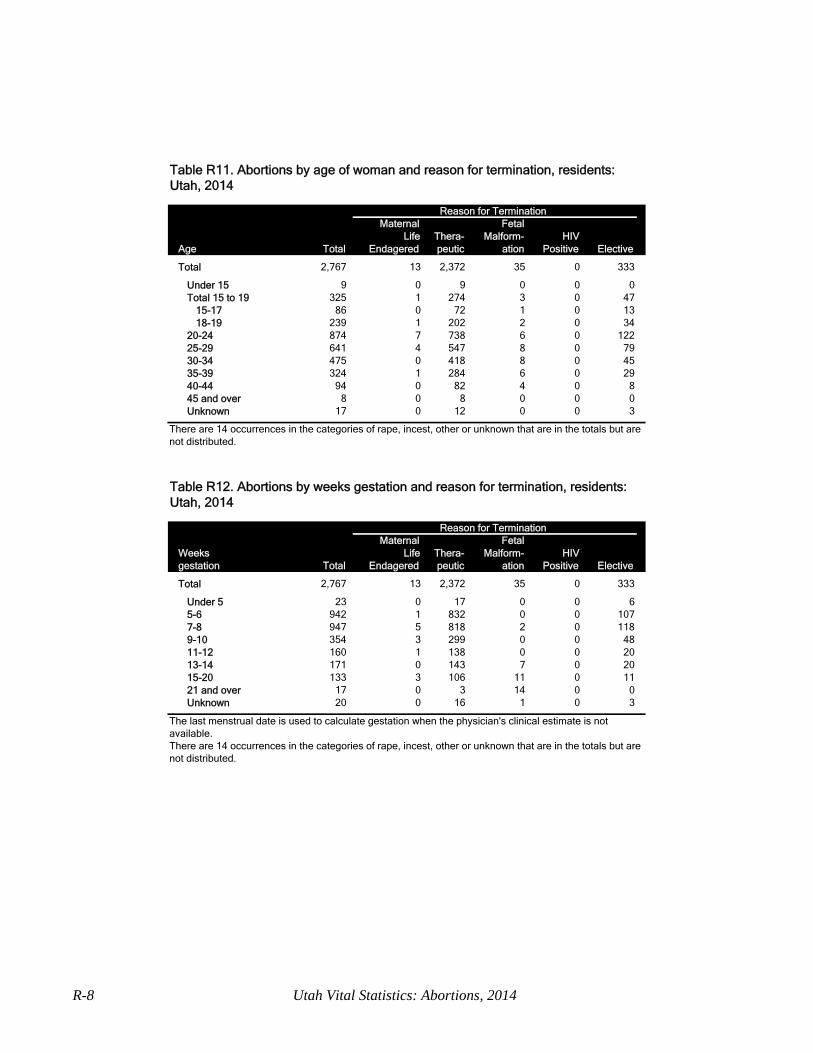
Life Thera- Malform- HIVAge Total Endagered peutic ation Positive Elective
Total 2,767 13 2,372 35 0 333
Under 15 9 0 9 0 0 0Total 15 to 19 325 1 274 3 0 47
15-17 86 0 72 1 0 1318-19 239 1 202 2 0 34
20-24 874 7 738 6 0 12225-29 641 4 547 8 0 7930-34 475 0 418 8 0 4535-39 324 1 284 6 0 2940-44 94 0 82 4 0 845 and over 8 0 8 0 0 0Unknown 17 0 12 0 0 3
Reason for TerminationMaternal Fetal
Weeks Life Thera- Malform- HIVgestation Total Endagered peutic ation Positive Elective
Total 2,767 13 2,372 35 0 333
Under 5 23 0 17 0 0 65-6 942 1 832 0 0 1077-8 947 5 818 2 0 1189-10 354 3 299 0 0 4811-12 160 1 138 0 0 2013-14 171 0 143 7 0 2015-20 133 3 106 11 0 1121 and over 17 0 3 14 0 0Unknown 20 0 16 1 0 3
Table R11. Abortions by age of woman and reason for termination, residents: Utah, 2014
Table R12. Abortions by weeks gestation and reason for termination, residents: Utah, 2014
There are 14 occurrences in the categories of rape, incest, other or unknown that are in the totals but are not distributed.
There are 14 occurrences in the categories of rape, incest, other or unknown that are in the totals but are not distributed.
The last menstrual date is used to calculate gestation when the physician's clinical estimate is not available.
R-8 Utah Vital Statistics: Abortions, 2014
Weeks Gestation21 and
Age Total Under 5 5-6 7-8 9-10 11-12 13-14 15-20 over Unknown
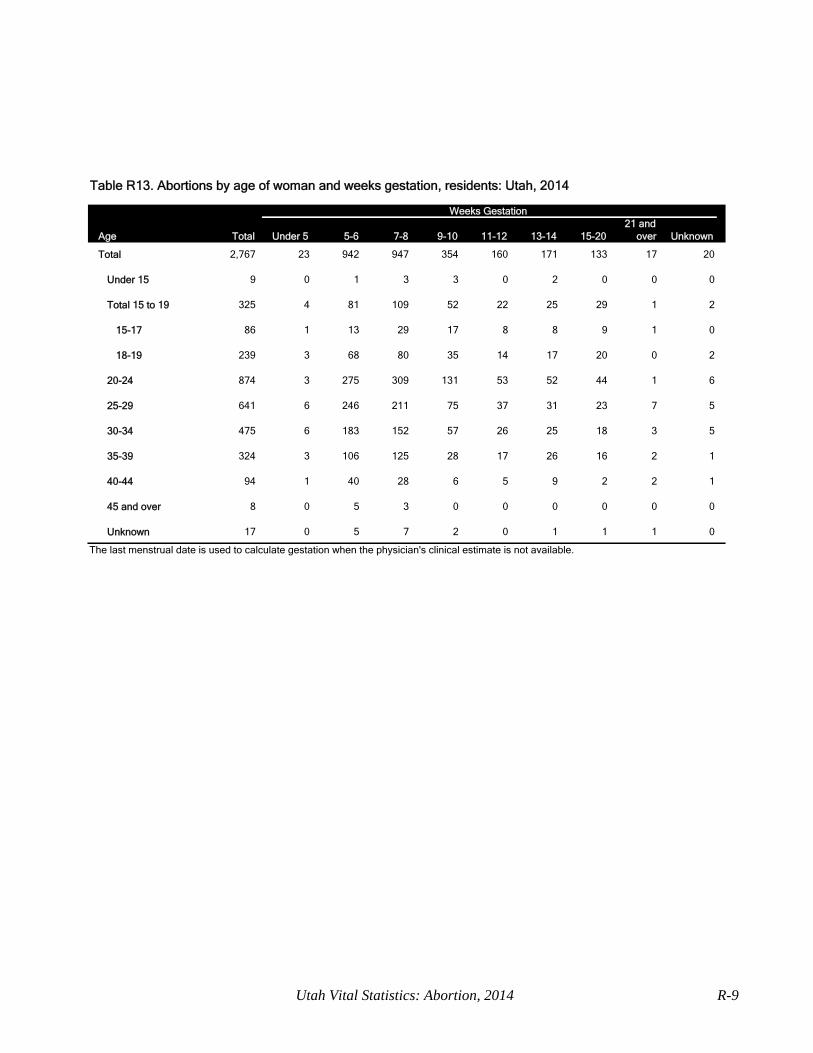
Total 2,767 23 942 947 354 160 171 133 17 20
Under 15 9 0 1 3 3 0 2 0 0 0
Total 15 to 19 325 4 81 109 52 22 25 29 1 2
15-17 86 1 13 29 17 8 8 9 1 0
18-19 239 3 68 80 35 14 17 20 0 2
20-24 874 3 275 309 131 53 52 44 1 6
25-29 641 6 246 211 75 37 31 23 7 5
30-34 475 6 183 152 57 26 25 18 3 5
35-39 324 3 106 125 28 17 26 16 2 1
40-44 94 1 40 28 6 5 9 2 2 1
45 and over 8 0 5 3 0 0 0 0 0 0
Unknown 17 0 5 7 2 0 1 1 1 0
The last menstrual date is used to calculate gestation when the physician's clinical estimate is not available.
Table R13. Abortions by age of woman and weeks gestation, residents: Utah, 2014
Utah Vital Statistics: Abortion, 2014 R-9
Method of TerminationDilation Intra-
and Suction Sharp Medica- Uterine Hyster- Un-Age Total Evacuation Curettage Curettage tion Instillation ectomy Other known
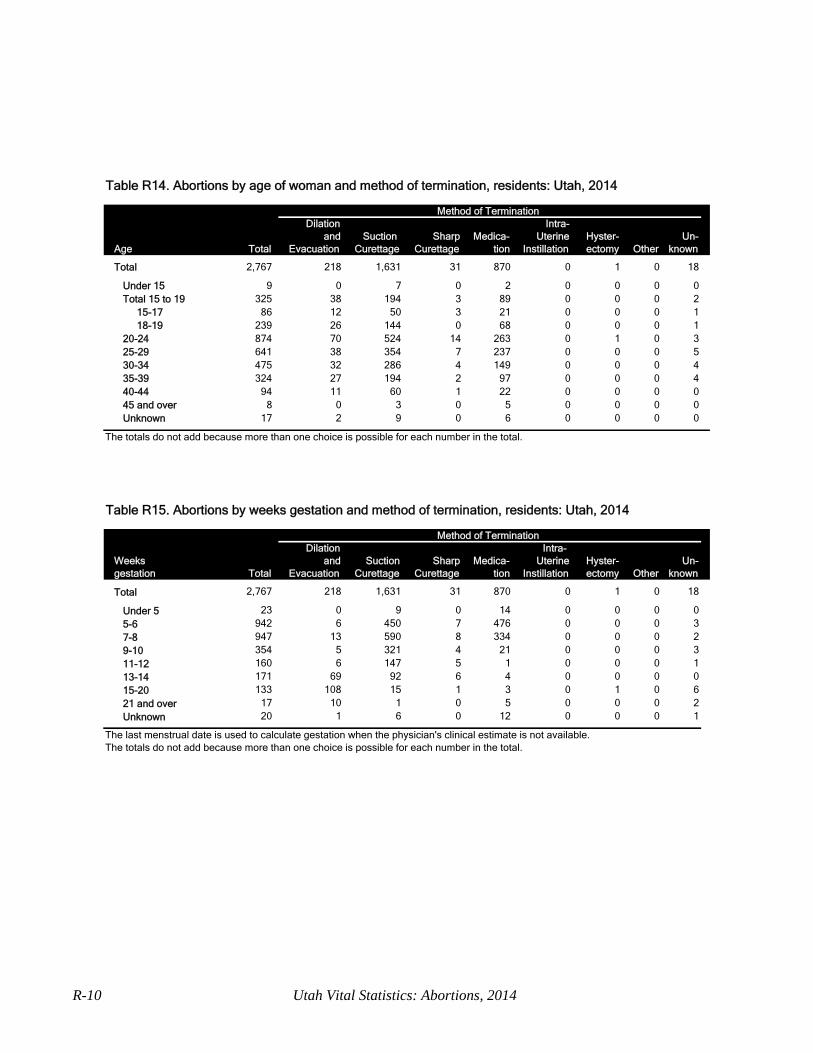
Total 2,767 218 1,631 31 870 0 1 0 18
Under 15 9 0 7 0 2 0 0 0 0Total 15 to 19 325 38 194 3 89 0 0 0 2
15-17 86 12 50 3 21 0 0 0 118-19 239 26 144 0 68 0 0 0 1
20-24 874 70 524 14 263 0 1 0 325-29 641 38 354 7 237 0 0 0 530-34 475 32 286 4 149 0 0 0 435-39 324 27 194 2 97 0 0 0 440-44 94 11 60 1 22 0 0 0 045 and over 8 0 3 0 5 0 0 0 0Unknown 17 2 9 0 6 0 0 0 0
The totals do not add because more than one choice is possible for each number in the total.
Method of TerminationDilation Intra-
Weeks and Suction Sharp Medica- Uterine Hyster- Un-gestation Total Evacuation Curettage Curettage tion Instillation ectomy Other known
Total 2,767 218 1,631 31 870 0 1 0 18
Under 5 23 0 9 0 14 0 0 0 05-6 942 6 450 7 476 0 0 0 37-8 947 13 590 8 334 0 0 0 29-10 354 5 321 4 21 0 0 0 311-12 160 6 147 5 1 0 0 0 113-14 171 69 92 6 4 0 0 0 015-20 133 108 15 1 3 0 1 0 621 and over 17 10 1 0 5 0 0 0 2Unknown 20 1 6 0 12 0 0 0 1
The last menstrual date is used to calculate gestation when the physician's clinical estimate is not available.The totals do not add because more than one choice is possible for each number in the total.
Table R15. Abortions by weeks gestation and method of termination, residents: Utah, 2014
Table R14. Abortions by age of woman and method of termination, residents: Utah, 2014
R-10 Utah Vital Statistics: Abortions, 2014

Mention of any ComplicationAge of Woman Total Yes No Unknown
Total 2,767 6 2,760 1
Under 15 9 0 9 0Total 15 to 19 325 0 325 0
15-17 86 0 86 018-19 239 0 239 0
20-24 874 2 871 125-29 641 1 640 030-34 475 2 473 035-39 324 0 324 040-44 94 0 94 045 and over 8 0 8 0Unknown 17 1 16 0
History of Contraceptive Use in Past YearAge of Woman Total Yes No Unknown
Total 2,767 452 937 1,378
Under 15 9 1 5 3Total 15 to 19 325 25 98 202
15-17 86 7 29 5018-19 239 18 69 152
20-24 874 122 269 48325-29 641 108 217 31630-34 475 106 183 18635-39 324 70 115 13940-44 94 14 39 4145 and over 8 3 4 1Unknown 17 3 7 7
Omission of Contraceptive
Age of Woman Total Yes No Unknown
Total 2,767 29 470 2,268
Under 15 9 0 2 7Total 15 to 19 325 3 26 296
15-17 86 2 4 8018-19 239 1 22 216
20-24 874 11 132 73125-29 641 7 110 52430-34 475 4 109 36235-39 324 4 68 25240-44 94 0 16 7845 and over 8 0 3 5Unknown 17 0 4 13
Table R16. Abortions by age of woman and mention of any complications, residents: Utah, 2014
Table R17. Abortions by age of woman and history of contraceptive use in past year, residents: Utah, 2014
Table R18. Abortions by age of woman and pregnancy due to omission of contraceptive, residents: Utah, 2014
Utah Vital Statistics: Abortions, 2014 R-11
Methods of contraceptive used in past yearOral Foam Surgical Depo- Un- Not
Age of Woman Total (pill) Diaphram Jelly Condom I U D Sterilization Rhythm Coitus provera Other known Applicable
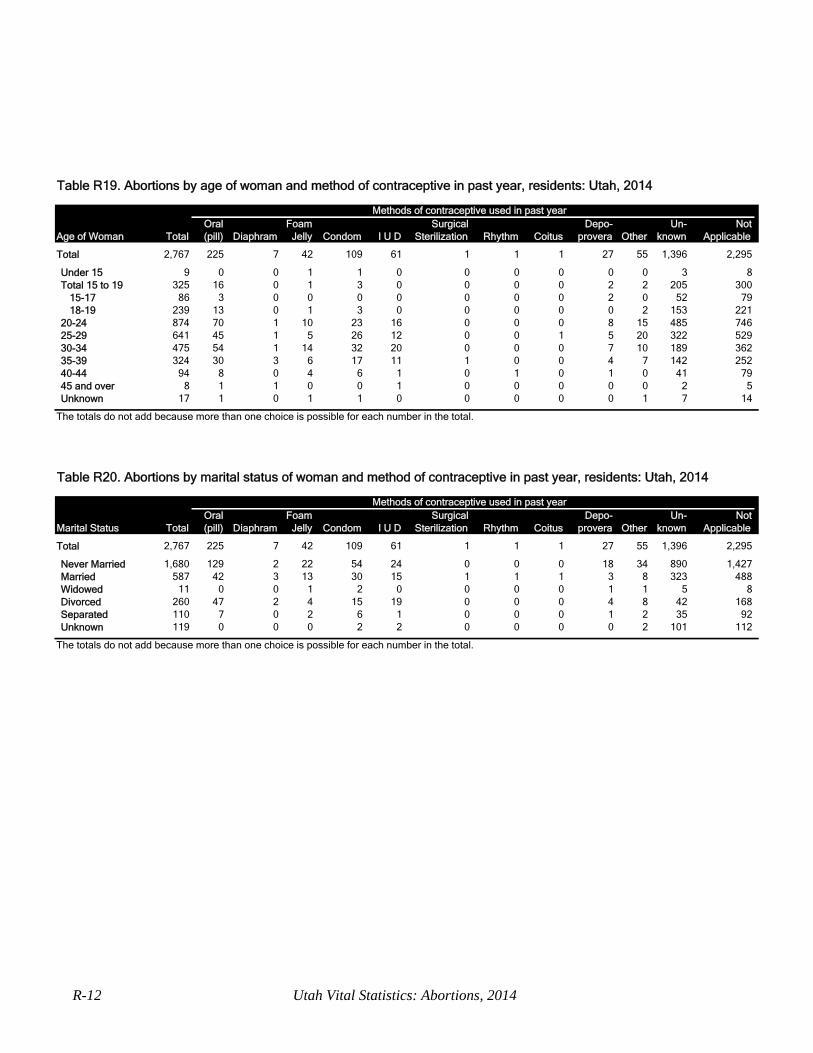
Total 2,767 225 7 42 109 61 1 1 1 27 55 1,396 2,295
Under 15 9 0 0 1 1 0 0 0 0 0 0 3 8Total 15 to 19 325 16 0 1 3 0 0 0 0 2 2 205 300
15-17 86 3 0 0 0 0 0 0 0 2 0 52 7918-19 239 13 0 1 3 0 0 0 0 0 2 153 221
20-24 874 70 1 10 23 16 0 0 0 8 15 485 74625-29 641 45 1 5 26 12 0 0 1 5 20 322 52930-34 475 54 1 14 32 20 0 0 0 7 10 189 36235-39 324 30 3 6 17 11 1 0 0 4 7 142 25240-44 94 8 0 4 6 1 0 1 0 1 0 41 7945 and over 8 1 1 0 0 1 0 0 0 0 0 2 5Unknown 17 1 0 1 1 0 0 0 0 0 1 7 14
The totals do not add because more than one choice is possible for each number in the total.
Methods of contraceptive used in past yearOral Foam Surgical Depo- Un- Not
Marital Status Total (pill) Diaphram Jelly Condom I U D Sterilization Rhythm Coitus provera Other known Applicable
Total 2,767 225 7 42 109 61 1 1 1 27 55 1,396 2,295
Never Married 1,680 129 2 22 54 24 0 0 0 18 34 890 1,427Married 587 42 3 13 30 15 1 1 1 3 8 323 488Widowed 11 0 0 1 2 0 0 0 0 1 1 5 8Divorced 260 47 2 4 15 19 0 0 0 4 8 42 168Separated 110 7 0 2 6 1 0 0 0 1 2 35 92Unknown 119 0 0 0 2 2 0 0 0 0 2 101 112
The totals do not add because more than one choice is possible for each number in the total.
Table R20. Abortions by marital status of woman and method of contraceptive in past year, residents: Utah, 2014
Table R19. Abortions by age of woman and method of contraceptive in past year, residents: Utah, 2014
R-12 Utah Vital Statistics: Abortions, 2014
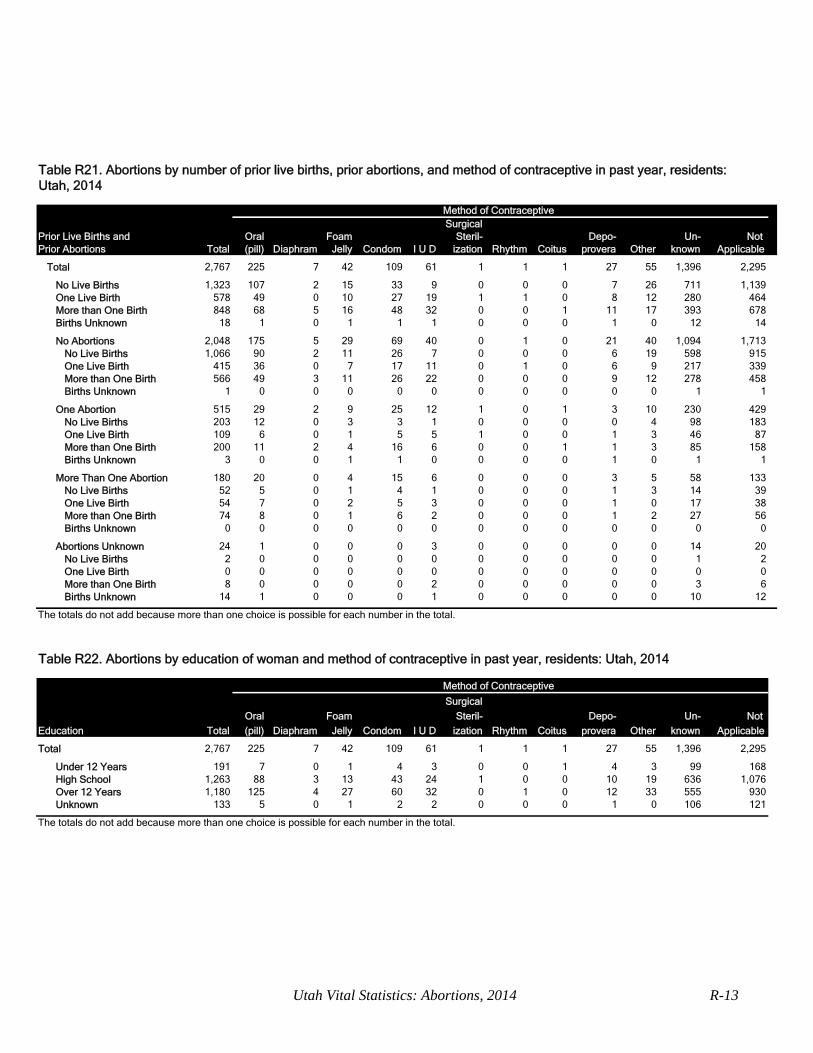
Method of ContraceptiveSurgical
Prior Live Births and Oral Foam Steril- Depo- Un- Not Prior Abortions Total (pill) Diaphram Jelly Condom I U D ization Rhythm Coitus provera Other known Applicable
Total 2,767 225 7 42 109 61 1 1 1 27 55 1,396 2,295
No Live Births 1,323 107 2 15 33 9 0 0 0 7 26 711 1,139One Live Birth 578 49 0 10 27 19 1 1 0 8 12 280 464More than One Birth 848 68 5 16 48 32 0 0 1 11 17 393 678Births Unknown 18 1 0 1 1 1 0 0 0 1 0 12 14
No Abortions 2,048 175 5 29 69 40 0 1 0 21 40 1,094 1,713No Live Births 1,066 90 2 11 26 7 0 0 0 6 19 598 915One Live Birth 415 36 0 7 17 11 0 1 0 6 9 217 339More than One Birth 566 49 3 11 26 22 0 0 0 9 12 278 458Births Unknown 1 0 0 0 0 0 0 0 0 0 0 1 1
One Abortion 515 29 2 9 25 12 1 0 1 3 10 230 429No Live Births 203 12 0 3 3 1 0 0 0 0 4 98 183One Live Birth 109 6 0 1 5 5 1 0 0 1 3 46 87More than One Birth 200 11 2 4 16 6 0 0 1 1 3 85 158Births Unknown 3 0 0 1 1 0 0 0 0 1 0 1 1
More Than One Abortion 180 20 0 4 15 6 0 0 0 3 5 58 133No Live Births 52 5 0 1 4 1 0 0 0 1 3 14 39One Live Birth 54 7 0 2 5 3 0 0 0 1 0 17 38More than One Birth 74 8 0 1 6 2 0 0 0 1 2 27 56Births Unknown 0 0 0 0 0 0 0 0 0 0 0 0 0
Abortions Unknown 24 1 0 0 0 3 0 0 0 0 0 14 20No Live Births 2 0 0 0 0 0 0 0 0 0 0 1 2One Live Birth 0 0 0 0 0 0 0 0 0 0 0 0 0More than One Birth 8 0 0 0 0 2 0 0 0 0 0 3 6Births Unknown 14 1 0 0 0 1 0 0 0 0 0 10 12
The totals do not add because more than one choice is possible for each number in the total.
Method of Contraceptive
Surgical
Oral Foam Steril- Depo- Un- Not
Education Total (pill) Diaphram Jelly Condom I U D ization Rhythm Coitus provera Other known Applicable
Total 2,767 225 7 42 109 61 1 1 1 27 55 1,396 2,295
Under 12 Years 191 7 0 1 4 3 0 0 1 4 3 99 168High School 1,263 88 3 13 43 24 1 0 0 10 19 636 1,076Over 12 Years 1,180 125 4 27 60 32 0 1 0 12 33 555 930Unknown 133 5 0 1 2 2 0 0 0 1 0 106 121
The totals do not add because more than one choice is possible for each number in the total.
Table R22. Abortions by education of woman and method of contraceptive in past year, residents: Utah, 2014
Table R21. Abortions by number of prior live births, prior abortions, and method of contraceptive in past year, residents: Utah, 2014
Utah Vital Statistics: Abortions, 2014 R-13

Blank
2014 Appendix:
Abortions

Blank

Technical Appendix Section 76-7-313, Utah Code Annotated 1953 as amended requires that the report of induced termination of pregnancy (Figure A) be filed with the State of Utah's Department of Health within ten days after the abortion. The reported number of abortions to Utah residents that are performed out of state is small and suggests an undercount. This small number of reported abortions that occur in other states are not shown by county of residence in this report. For both the summary and reference tables in this report, data are tabulated by health district as well as county of residence to meet the needs of local health departments. The population data are from Utah’s Public Health Data Resource (IBIS-PH). The estimates for 2010 and later have been updated to the new IBIS Version 2013 population estimates on September 14, 2014. For more information, go to http://ibis.health.utah.gov/query/PopEst.html. Formulas used to compute rates and ratios used in this report are defined as follows: Abortion Rate = Total Number of Induced Abortions to Resident Females (1,000)
Total Number of Resident Females 15-44 Years of Age
Abortion Ratio = Total Number of Induced Abortions to Resident Females (1,000) Total Number of Live Births to Resident Females


Blank