Embed Size (px)
Citation preview
www.camsys.com
Utah Inland Port - Feasibility Analysis
prepared for
World Trade Center - Utah
Utah Governor's Office of Economic Development
prepared by
Cambridge Systematics, Inc
Global Logistics Development Partners, Inc

report
Utah Inland Port - Feasibility Analysis
prepared for
World Trade Center - Utah & Utah Governor's Office of Economic Development
prepared by
Cambridge Systematics, Inc. 115 South LaSalle Street, Suite 2200 Chicago, IL 60603 Global Logistics Development Partners 14362 N. Frank Lloyd Wright Blvd. Suite 1000 Scottsdale, AZ 85260 USA
date
December 29, 2017

Utah Inland Port - Feasibility Analysis
Cambridge Systematics, Inc. i
Table of Contents
Executive Summary ..................................................................................................... 2-7
Summary of Recommendations: .............................................................. 2-8
1.0 Introduction ....................................................................................................... 2-14
2.0 Inland Port Typology ....................................................................................... 2-17
2.1 What is an Inland Port?............................................................................ 2-17
2.2 Where are Existing Inland Ports? ........................................................... 2-17
Inland Port Types ..................................................................................... 2-17
Port Profile: DuisburgPort ....................................................................... 2-19
Port Profile: CentrePort Canada ............................................................. 2-20
3.0 Logistics Environment ..................................................................................... 2-22
3.1 Existing Infrastructure ............................................................................. 2-23
3.2 Interstate Markets ..................................................................................... 2-24
Seaport Connectivity ................................................................................ 2-27
3.4 Railroad Markets ...................................................................................... 2-29
3.5 Air Cargo Connectivity ............................................................................ 2-34
3.6 Freight Flow Summary ............................................................................ 2-35
3.7 State of Utah Freight Flows ..................................................................... 2-35
Freight Measured by Tonnage ................................................................ 2-35
Freight Measured by Value ..................................................................... 2-38
Foreign Trade ............................................................................................ 2-40
3.8 Salt Lake County Freight Flow Summary ............................................. 2-42
3.9 Inbound to Salt Lake County .................................................................. 2-42
3.10 Inbound to Salt Lake City via Rail Intermodal ..................................... 2-43
3.11 Outbound from Salt Lake County .......................................................... 2-44
4.0 Competitiveness ................................................................................................ 4-46
4.1 Methodology ............................................................................................... 4-48
How to Interpret the Results Table ........................................................ 4-49
4.2 Aerospace Component Manufacturing Facility ................................... 4-50
Results ........................................................................................................ 4-51
4.3 Corporate Headquarters and Manufacturing Facility......................... 4-51
Results ........................................................................................................ 4-52
4.4 E-Commerce Facility for a National Department Store Chain ........... 4-53
Table of Contents, continued
ii Cambridge Systematics, Inc.
Results ........................................................................................................ 4-54
4.5 Regional Food Distribution Center ........................................................ 4-55
Results ........................................................................................................ 4-56
5.0 Market Demand ................................................................................................ 5-57
5.1 Key Markets ............................................................................................... 5-57
5.3 Freight Dependent Markets .................................................................... 5-61
6.0 Environment ...................................................................................................... 6-67
6.1 Best Practices: Port of Los Angeles ......................................................... 6-69
6.2 Best Practices: World London Gateway ................................................ 6-70
7.0 Site Requirements ............................................................................................ 7-72
Infrastructure Estimates ........................................................................... 7-73
8.0 Recommended Next Steps ................................................................................ 8-1
8.1 The Need for a Governance Model and Options ................................... 8-1
Development Options ................................................................................ 8-3
8.2 Funding Strategy Recommendations ....................................................... 8-6
8.3 Development Process Overview .............................................................. 8-8
A. 2016 Salt Lake Inland Port Market Assessment ............................................ 8-2
Summary of findings .................................................................................. 8-2
B. Commodity Flow Charts ................................................................................... 8-7
C. Competitiveness References ........................................................................... 8-14
D. Additional Rail Service Information ............................................................ 8-18
E. Infrastructure Cost Breakdowns .................................................................... 8-19
E.1 Cost Estimates – Rail Served Inland Port .............................................. 8-19
E.2 Rail Served with Intermodal Rail Yard ................................................. 8-21
E.3 Cost Estimates – Area South of I-80 ....................................................... 8-23
Cambridge Systematics, Inc. iii
List of Tables
Table 3.1 Top Salt Lake County Trading Partners – Inbound ........................... 2-42
Table 3.2 Top Salt Lake County Trading Partners – Outbound ........................ 2-44
Table 4.1 Competitiveness Review Factors ......................................................... 4-48
Table 4.2 Aerospace Component Manufacturing Overview ............................ 4-50
Table 4.3 Corporate Headquarters and Manufacturing Overview ................. 4-51
Table 4.4 E-Commerce Facility Overview ........................................................... 4-53
Table 4.5 Regional Food Distribution Center Overview ................................... 4-55
Table 5.1 Key Market Representation in Salt Lake City .................................... 5-59
Table 7.1 Development Phases.............................................................................. 7-73
Table 7.2 Overall Infrastructure Cost Summary (With Rail Service) .............. 7-74
Table 7.3 Overall Infrastructure Cost – South of I-80 .......................................... 7-1
Table C.1 Competitiveness References ................................................................. 8-15

Cambridge Systematics, Inc. v
List of Figures
Figure 1.1 Overview of Approach .......................................................................... 2-16
Figure 2.1 Duisport Aerial ....................................................................................... 2-20
Figure 2.2 CentrePort Trade Gateways ................................................................. 2-21
Figure 3.1 Relative Distance between Salt Lake City and Major U.S. Cities .... 2-22
Figure 3.2 Utah Shipping Channels – Western U.S. ............................................ 2-23
Figure 3.3 Utah Shipping Channels – Eastern U.S. .............................................. 2-24
Figure 3.4 Federal Hours-of-Service Summary .................................................... 2-25
Figure 3.5 Truck Travel Sheds from Salt Lake City ............................................. 2-26
Figure 3.6 Salt Lake Area Interstate Highways .................................................... 2-28
Figure 3.7 Rail System and Salt Lake City ............................................................ 2-29
Figure 3.8 Rail Ownership from Utah ................................................................... 2-31
Figure 3.9 Railroad Service – Salt Lake Area ....................................................... 2-32
Figure 3.10 2016 Outbound Air Cargo .................................................................. 2-34
Figure 3.11 Inbound Air Cargo .............................................................................. 2-35
Figure 3.12 Top Utah Counties, by Total Tons .................................................... 2-36
Figure 3.13 Outbound from Utah, by Tons .......................................................... 2-37
Figure 3.14 Inbound Tons to Utah, by Origin ...................................................... 2-37
Figure 3.15 Top Utah Counties, by Total Value ................................................... 2-38
Figure 3.16 Outbound Value from Utah, by Destination ................................... 2-39
Figure 3.17 Inbound Value to Utah, by Origination ........................................... 2-39
Figure 3.18 Export Tonnage through Utah Gateways, by Destination Country .................................................................................................... 2-40
Figure 3.19 Import Tonnage through Utah Gateways, by Origin Country ..... 2-40
Figure 3.20 Export Value through Utah Gateways, by Destination Country .................................................................................................... 2-41
Figure 3.21 Import Value through Utah Gateways, by Origination Country .................................................................................................... 2-41
Figure 3.22 Top Salt Lake County Trading Partners – Inbound ....................... 2-43
Figure 3.23 Top Salt Lake County Trading Partners – Outbound .................... 2-45
vi Cambridge Systematics, Inc.
Figure 4.1 Aerospace Component Manufacturing Competitiveness ................ 4-50
Figure 4.2 Corporate Headquarters and Manufacturing Competitiveness ..... 4-52
Figure 4.3 E-Commerce/Distribution Competitiveness ..................................... 4-54
Figure 4.4 Regional Food Distribution Competitiveness .................................... 4-56
Figure 5.1 Metropolitan Industrial Markets: US (millions sf) ............................ 5-57
Figure 5.2 Salt Lake Region Industrial Market ..................................................... 5-58
Figure 5.3 Salt Lake County Manufacturing Firms, by Type ............................. 5-61
Figure 5.4 Salt Lake County Manufacturing Businesses ..................................... 5-62
Figure 5.5 Salt Lake County Transportation and Warehousing Firms, by Type.......................................................................................................... 5-63
Figure 5.6 Salt Lake County Transportation and Warehousing Firms ............. 5-64
Figure 5.7 Salt Lake County Wholesale Firms, by Type ..................................... 5-65
Figure 5.8 Salt Lake County Wholesale Trade Firms .......................................... 5-66
Figure 8.1 Development Objectives ......................................................................... 8-1
Figure B.2 2015 Total Utah Freight Tons ................................................................. 8-7
Figure B.3 2015 Total Utah Freight Value ................................................................ 8-8
Figure B.4 2045 Projected Total Utah Freight Tonnage ......................................... 8-8
Figure B.5 2045 Projected Total Utah Freight Value .............................................. 8-9
Figure B.6 2015 Total Utah Freight Tons, by Mode .............................................. 8-10
Figure B.7 2015 Total Utah Freight Value, by Mode ............................................ 8-11
Figure B.8 2045 Total Utah Freight Tons, by Mode .............................................. 8-12
Figure B.9 2045 Total Utah Freight Value, by Mode ............................................ 8-13
Cambridge Systematics, Inc. 2-7
Executive Summary
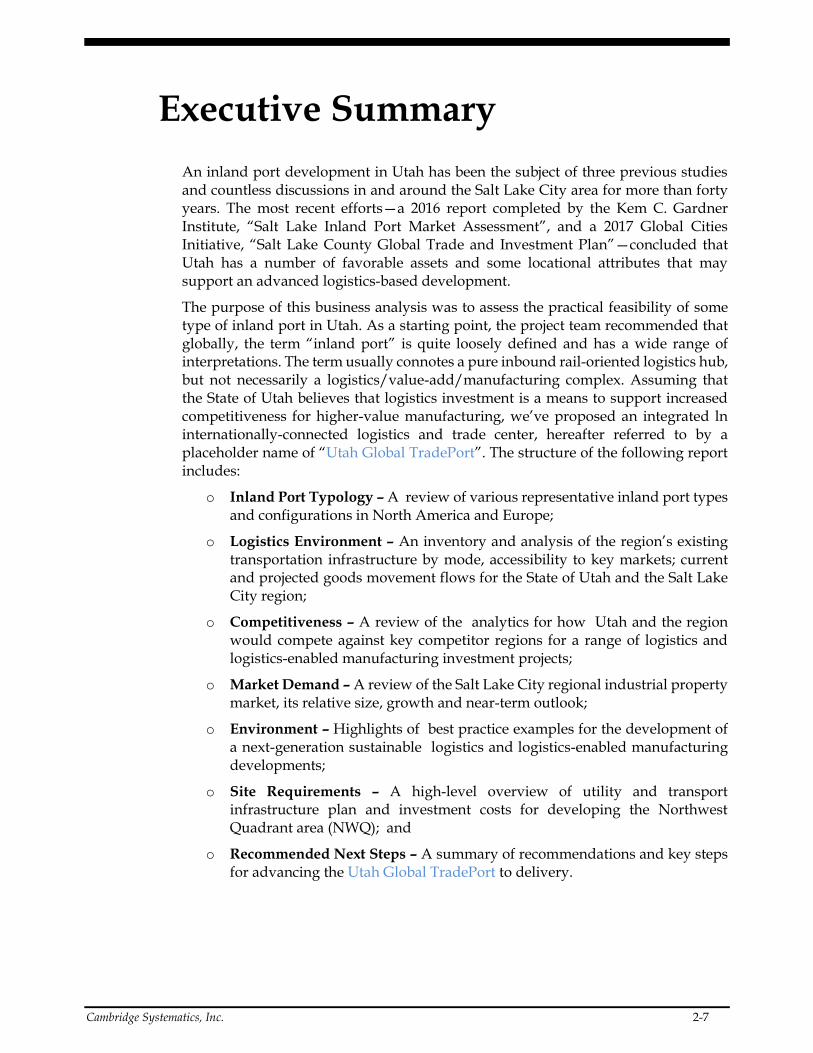
An inland port development in Utah has been the subject of three previous studies and countless discussions in and around the Salt Lake City area for more than forty years. The most recent efforts—a 2016 report completed by the Kem C. Gardner Institute, “Salt Lake Inland Port Market Assessment”, and a 2017 Global Cities Initiative, “Salt Lake County Global Trade and Investment Plan”—concluded that Utah has a number of favorable assets and some locational attributes that may support an advanced logistics-based development.
The purpose of this business analysis was to assess the practical feasibility of some type of inland port in Utah. As a starting point, the project team recommended that globally, the term “inland port” is quite loosely defined and has a wide range of interpretations. The term usually connotes a pure inbound rail-oriented logistics hub, but not necessarily a logistics/value-add/manufacturing complex. Assuming that the State of Utah believes that logistics investment is a means to support increased competitiveness for higher-value manufacturing, we’ve proposed an integrated ln internationally-connected logistics and trade center, hereafter referred to by a placeholder name of “Utah Global TradePort”. The structure of the following report includes:
o Inland Port Typology – A review of various representative inland port types and configurations in North America and Europe;
o Logistics Environment – An inventory and analysis of the region’s existing transportation infrastructure by mode, accessibility to key markets; current and projected goods movement flows for the State of Utah and the Salt Lake City region;
o Competitiveness – A review of the analytics for how Utah and the region would compete against key competitor regions for a range of logistics and logistics-enabled manufacturing investment projects;
o Market Demand – A review of the Salt Lake City regional industrial property market, its relative size, growth and near-term outlook;
o Environment – Highlights of best practice examples for the development of a next-generation sustainable logistics and logistics-enabled manufacturing developments;
o Site Requirements – A high-level overview of utility and transport infrastructure plan and investment costs for developing the Northwest Quadrant area (NWQ); and
o Recommended Next Steps – A summary of recommendations and key steps for advancing the Utah Global TradePort to delivery.
2-8 Cambridge Systematics, Inc.
Summary of Recommendations:
Overall Opportunity
Utah has many compelling business investment attraction attributes and over recent years the State and region has fared well as a regional logistics market and as a burgeoning technology hub. Though for Utah to establish itself as a larger, more compelling investment offer to global logistics and product manufacturing supporting global supply chains, it will need to harness its connectivity and underlying competitiveness by developing a global-scale investment product. Because of State’s business friendly orientation, underlying competitiveness, and its logistics connectivity; we believe that a well-executed and well-structured logistics and logistics-enabled manufacturing project of scale would be quite successful in Utah. With that said, without a purpose-built and integrated investment product, we feel that the NWQ: 1) will not nearly yield the potential benefits that would be possible with a “Utah Global TradePort Active Development Plan” strategy, and 2) would not justify significant public resource investments requiring a meaningful return on investment. A fundamental element of the project business strategy should that the project is designed and developed as a quadrimodal asset.
Site and Opportunity
The NWQ has unique potential due to the scale of undeveloped land in a location situated adjacent to important transcontinental cargo transport infrastructure. This location presents a cohesive opportunity for a comprehensive industrial and multimodal logistics product, supported by: 1) strong existing transcontinental rail and intermodal rail connectivity, 2) immediate access to an important east-west interstate highway corridor, 3) adjacency to a growing, modern airport asset and 4) one or two day ground transportation access to the West Coasts seaports of Oakland, Los Angeles, and Long Beach. This is not something that is typical and available to most regions and due to a series of market and logistics circumstances, there is a window of opportunity to get this right. The proper development of this site will require substantial infrastructure investment commensurate to building a new trade/logistics city that could be seen as quite unique in the marketplace.
Overall Industrial Market
The industrial asset investment market in the United States has been growing quickly, and has been shaped by a period of high economic growth, restructuring supply
UTAH GLOBAL
TRADEPORT GOALS o BALANCED INBOUND &
OUTBOUND o BALANCED DISTRIBUTION &
MANUFACTURING o MUST BE QUADRIMODAL
o PROXIMITY TO SEAPORT HUBS o STRATEGIC ASSET MIX
o SITE SIZES AND
CONFIGURATIONS o INDUSTRY DIVERSITY
o MUST BE A MANAGED PRODUCT –
OTHERWISE IT’S JUST AN
INDUSTRIALLY ZONED AREA
Cambridge Systematics, Inc. 2-9
chains, ongoing adjustments to multilateral trade relationships, huge levels of ecommerce growth and a small but growing level of investment reshoring. There has been a lot of positive force has been creating growth, but there have been some significant forces that have created concern in the logistics space such as plateauing growth in China. Combined with increasing vessel sizes and the expectation of fewer port calls, concerns about overall trade growth and new competing seaport/maritime route options infrastructure, there is a new and increasing interest by major West Coast deepwater seaports to position themselves to gain competitive advantage by an affiliation or partner relationship with inland logistics and manufacturing hubs. This has been recently evidenced by the partnership that GLDPartners assembled between the Port of Los Angeles and new multimodal trade hub in the Central Valley of California which is four hours from the Port. In the face of rather substantial port-to-port competitiveness dynamics, it is important to recognize that these seaports are seeking to position themselves for both increased inbound and outbound cargo. As it relates to Utah’s project opportunity, there are really no competitor markets that have an ability to offer a comprehensive large-scale and property, infrastructure, logistics and business attraction plan. In our opinion, due to some fundamental logistics and supply chain trend dynamics, there is a window of opportunity to capture market share during this still robust period of growth.
Utah and Salt Lake City Region Market
Regarding Utah and Salt Lake City markets, GLDPartners’ competitiveness analytics demonstrate that in an underlying way, the State competes well for investments in a range of sectors. The analytical model shows that:
Utah can compete well as a strong business friendly state
The State enjoys a strong workforce and education system which distinguish it, especially in some tech-manufacturing sectors
The Salt Lake City region enjoys strategic location for some supply chains; including through a range of distribution and manufacturing that depend on access to the Intermountain West region, the West Coast and the California’s major seaports
Rail freight connectivity is strong with service by two Class One railroads, but lower levels of competition than preferred exists into the NWQ; and the UP intermodal facility is in-place and has existing capacity
Property and overall running costs are very competitive, especially versus the region’s major urban competitor regions
A major airport asset expansion under-construction which is expected to lead to more and more competitive passenger service. Salt Lake City International (SLC) is supported by a Delta Airlines hub, relatively uncongested skies, and offers substantial aeronautical and non-aeronautical land assets
Target Sectors/Project Types and Competitiveness
The project included an array of market analysis to identify how competitiveness for the region across multiple sectors. The analytics explain the region competes well for a range of project types and sectors, and after a thorough review of four key sectors,
2-10 Cambridge Systematics, Inc.
their supply chains, and Salt Lake City region’s competitiveness, the region shows as very competitive:
o The Utah Global TradePort will compete well for technology and non-technology manufacturing that is not primarily dependent upon low logistics costs
Distribution targets included:
o Consumer goods regional and super-regional
o Agriculture processing and logistics
Manufacturing targets included:
o Aerospace
o Advanced materials
o Food production
o Medical products
o Pharma
o Electronics
o Auto technology
o Industrial machinery
However, to successfully compete it’s imperative that the Utah Global TradePort demonstrate that it can provide an overall supply chain management advantage including: a better overall total landed cost, higher/competitive levels of reliability and at least competitive delivery times.
Additional findings include:
The TradePort Utah Global TradePort should be integral in growing the State’s natural resource/extraction industries
Project business objective must be a balanced level of inbound and outbound cargo, including a mixture of distribution and manufacturing
Fundamental business strategy designed and developed as a quadrimodal asset (air, highway, railroad, seaport)
Cambridge Systematics, Inc. 2-11
Delivery Options
We do not believe that the generic mostly logistics “inland port” as conceived would yield near the public and private value in terms of maximum jobs, quality of jobs, public revenues and private property values as could be achieved by a larger, more thoughtful project district development approach.
In the body of our report and at the November meeting of the Governor’s Exploratory Committee, we strongly made the point that for the Utah Global TradePort to reach the level of success that we believe possible, it will be fully necessary to harmonize the original inland port concept into a project-specific Utah Global TradePort Active Development Plan. We see little pathway to reach that goal without some level of government involvement and probably substantial investment. To maximize the public benefit, we believe that the Development Plan should be a premised on the public sector’s required return on investment and importantly, its specific overarching economic development objectives. It would make little sense for the State or local government to invest significant resources unless there was a demonstrated payback. Though we see an important coordinating role for government, we do not believe that all of the traditional infrastructure costs need be borne by the public. From our current and recent experience, we believe that the potential of this project could attract risk capital investors of national or international scale and we see the potential for a large-scale public-private partnership.
We have referred to the need to establish a “Utah Global TradePort Active Development Plan”, which if followed, would elevate the market opportunity and the NWQ area from loosely-knit industrial park to a world-class logistics and value-add manufacturing complex of scale. We believe that with public sector leadership that this can occur, but without leadership the results will be modest and public participation will be a poor investment of resources. Unless the Utah Global TradePort is packaged and delivered as a cohesive and strategically phased project, the net result will be an under-developed and potential-limited area of Salt Lake City that creates modest value due to proximate access to good logistics assets.
Instead of following the path of most industrial economic development strategies in the US which are built mostly around an available property offer, public infrastructure investment with a loose government land-use framework and business strategy, the Utah Global TradePort would far more focused on creating a product that produces long-term structural value for target markets and its asset/investment partners. The Utah Global TradePort would join public and private resources to create a truly world-class business product including:
a long-term brand and allied marketing strategy designed to elevate Utah to an investment-grade product
a purpose-specific strategy for comprehensive and integrated infrastructure, designed to satisfy various business audience markets project types, project sizes and labor force requirements including a logical phasing plan which leads the market
a business development marketing, investment audience focus
2-12 Cambridge Systematics, Inc.
In the end, it will become extremely critical hat a good plan will accomplish little without an effective delivery structure. Some important features of an effective delivery structure are:
Establishing that a core business objective is to minimize early investment and for the public sector, to minimize overall investment
The development strategy must take maximum advantage of existing infrastructure and connectivity. Due to existing infrastructure, potential early priority areas include: 1) access to I-80 and UP intermodal, and 2) NWQ near to the airport
The State should consider delivery structure variations including the establishment of port authority-like entity that can:
o Own/dispose assets, issue debt, enter into joint ventures, take risks, dedicated professional team
o Develop and maintain seaport, logistics partner partnerships
o Promote Utah Global TradePort along with trade missions
o Serve as day-to-day champion
o Manage and advance environmental stewardship
o Leverage risk capital and limit public risk
o Coordinate with economic development and oversee incentives
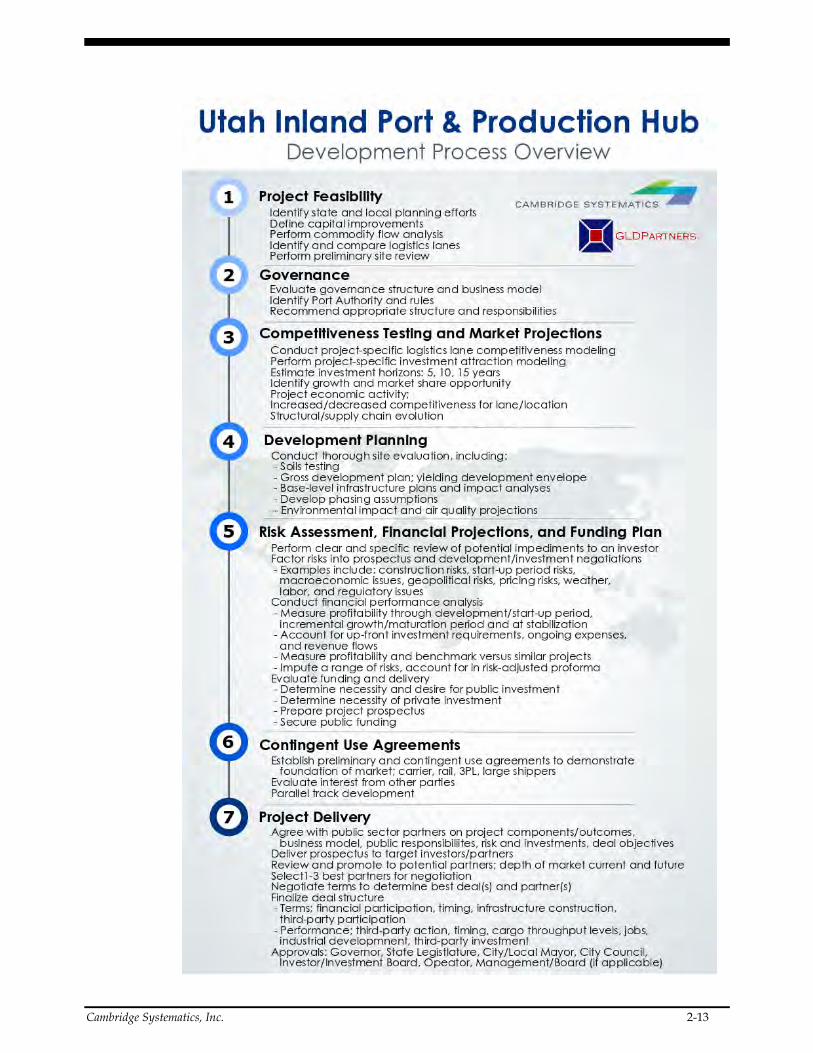
Delivery Steps: Development Process Overview
The infographic on the following page lays out the specific steps necessary for advancing a project of this scale from feasibility through delivery. We have distilled it into seven major steps with a number of accompanying milestones.
Cambridge Systematics, Inc. 2-13
2-14 Cambridge Systematics, Inc.
1.0 Introduction
The 2016 report completed by the Kem C. Gardner Institute, “Salt Lake Inland Port Market Assessment”, performed a preliminary assessment of the practicality and market context for the development of an inland port in Salt Lake County.1 While the research report confirmed that Salt Lake County is an attractive location for an inland port, that there are numerous other issues that require further investigation. A summary of the findings are shown below2:
Salt Lake City is favorably positioned geographically and economically to support an inland port. It has direct rail connection to all major west coast terminals and access to major interstate highways (i.e. I-70, I-80, and I-84).
Transportation infrastructure investments are supportive of an inland port, though additional investment is needed. The Salt Lake City International Airport and the Union Pacific Intermodal Terminal are vital assets to establishing an inland port. However, roadways accessing these facilities, particularly the intermodal terminal, are in need of improvement.
Salt Lake City’s northwest quadrant is an existing regional supply chain hub. In addition to the airport and intermodal terminal, this area is home to a large manufacturing base. It is also accessible to several potential markets within hours-of-service limitations for truck drivers.
An inland port would be advantaged by a set aside of land for a new warehousing district with accompanying infrastructure investments to support such a district.
The analysis conducted in this report complements and in many cases expounds these transportation-related findings. Specifically, the analysis of commodity flows provides further insight into the advantages of Salt Lake City’s geographic position and role as a regional supply chain in supporting an inland port. The commodity flow analysis also helps to identify existing and future modal trade lanes which supports the 2016 report’s analysis of transportation infrastructure investments. The analysis of the locations of freight-intensive industries shows where clusters of these industries already exist which supports the co-location of a formal warehouse district surrounding the inland port. In addition the 2016 report addresses issues of governance, funding, and environmental considerations.
A more recent effort, “Salt Lake County Global Trade and Investment Plan”, was completed as part of the Global Cities Initiative, in coordination with JPMorgan Chase and the Brookings Institute.3 Key findings for this study were as follows:
1 Available at: http://gardner.utah.edu/wp-content/uploads/2016/10/IP-Brief-PRESS2.pdf
2 A full list of the 17 findings is shown in Appendix A.
3 Available at: http://slco.org/uploadedFiles/depot/fRD/fEconDev/global-trade-investment-plan.pdf
Cambridge Systematics, Inc. 2-15
1) Primary Metal Manufacturing accounts for 63 percent of Salt Lake County goods exports;
2) Little overlap exists between countries that invest in the region and countries to which regional businesses export;
3) The region has multiple hard and soft assets to support export-related activities;
4) Over half of all Foreign-Owned Enterprises in Salt Lake County originate from four countries (Germany, Canada, England, and Japan);
5) Medical manufacturing is a key industry for attracting Foreign Direct Investment;
6) In Salt Lake County, Foreign-Owned Enterprises pay 32 percent higher wages than domestic-owned companies; and
7) Out-of-state perceptions of Utah are one of the biggest challenges to recruiting new talent;
8) Local talent is able to meet many business needs, but high-level talent is in short supply; and
9) Outdoor recreation is a major selling point for talent recruitment, but marketing efforts are targeted toward tourism, not business growth.
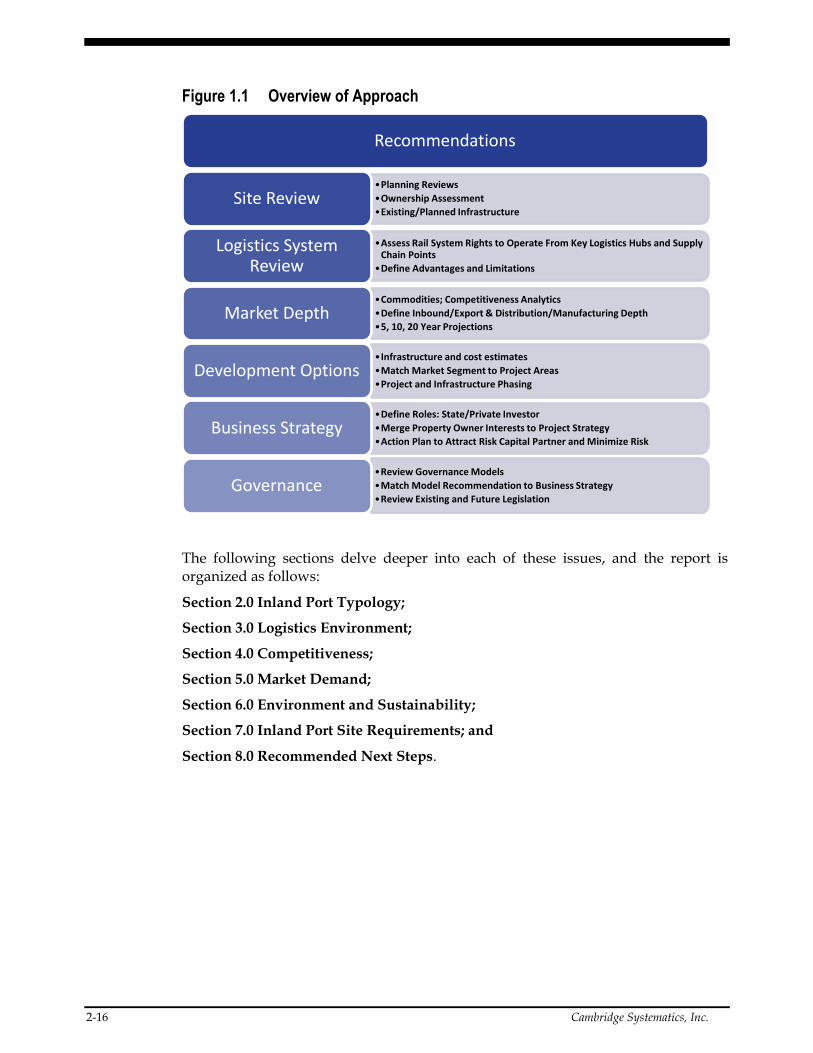
The following study encompasses many of the elements and findings in both of the aforementioned studies, and builds upon several key aspects. The approach involved a number of related elements to determine practical feasibility as well as inform a suite of recommendations (Figure 1.1).
2-16 Cambridge Systematics, Inc.
Figure 1.1 Overview of Approach
The following sections delve deeper into each of these issues, and the report is organized as follows:
Section 2.0 Inland Port Typology;
Section 3.0 Logistics Environment;
Section 4.0 Competitiveness;
Section 5.0 Market Demand;
Section 6.0 Environment and Sustainability;
Section 7.0 Inland Port Site Requirements; and
Section 8.0 Recommended Next Steps.
Recommendations
•Planning Reviews
•Ownership Assessment
•Existing/Planned InfrastructureSite Review
•Assess Rail System Rights to Operate From Key Logistics Hubs and Supply Chain Points
•Define Advantages and Limitations
Logistics System Review
•Commodities; Competitiveness Analytics
•Define Inbound/Export & Distribution/Manufacturing Depth
•5, 10, 20 Year ProjectionsMarket Depth
•Infrastructure and cost estimates
•Match Market Segment to Project Areas
•Project and Infrastructure PhasingDevelopment Options
•Define Roles: State/Private Investor
•Merge Property Owner Interests to Project Strategy
•Action Plan to Attract Risk Capital Partner and Minimize RiskBusiness Strategy
•Review Governance Models
•Match Model Recommendation to Business Strategy
•Review Existing and Future LegislationGovernance
Cambridge Systematics, Inc. 2-17
2.0 Inland Port Typology
2.1 WHAT IS AN INLAND PORT? There is not a consistent or formal global definition of the term “inland port”. In some parts of the world a term of art used to describe inland logistics hubs is “dry port”. Particularly in the United States, the term “inland port” is typically used to describe a (typically maritime-connected) logistics market that is located at a non-maritime inland location. Inland ports are typically planned around rail intermodal facilities, but not all intermodal locations are inland ports. Though there isn’t a common definition of the term, the key shared points of meaning to the term are4:
Having a direct connection to major seaport via Class I railroad
Access to major transportation infrastructure usually, rail, but also interstate highway or inland waterway
Access to large consumption market; 10M+ people within 300 miles
Including significant industrial property with abundance of Class A warehouse and distribution space
Including a large, affordable and trained labor pool
Local or state economic development policies providing Free Trade Zone (FTZ) and tax incentives
2.2 WHERE ARE EXISTING INLAND PORTS? There are not many examples of inland ports in the US, and those that do exist are generally facilities whose primary purpose is to provide logistics support to inbound containerized cargo moving inland from a load-center seaport. In these examples, principle partners are seaports, railroad companies and in some cases, property development partners. The first objectives of these investment hubs are to manage inbound movements of consumer goods and the repositioning of equipment, meaning directing empty containers back to costal seaports for return to overseas markets. A corollary objective of the inland port will be to support retail distribution and at the inland port complex there will be substantial warehouse or distribution centers.
Inland Port Types
When referring to inland ports in the US, there are generally two types:
1. Seaport Owned or Seaport as a Partner
Virginia; Port of Virginia VIP
South Carolina; Greer
4 Source: GLDPartners, CBRE Inland Port Logistics Annual Report 2016
2-18 Cambridge Systematics, Inc.
Georgia; Cordelle
As products designed to be extensions of their seaport parent, these inland ports have intermodal rail cargo movement and streamlining as a core objective. Cordelle and Greer have no corresponding property investment attraction strategy associated with their operations. Economic development is a light byproduct from the logistics efforts of their port developers, mostly in the form of inbound distribution investment. All of these facilities are located on the East Coast.
2. Inbound Distribution – Property/Railroad Interests
Illinois; Joliet Intermodal Centers
Kansas; Logistics Park Kansas City
Texas; Alliance Global Logistics Hub
These projects are the result of railroad companies and property developers joining to share business interests. These facilities are strategically located in center of the US with access to large nearby markets and in the vicinity of other larger markets. These facilities are largely for inbound distribution and equipment redeployment. There is some but limited economic development beyond distribution investment, but these investments are substantial.
The examples listed above are the largest inland logistics hubs and as noted all are on the East Coast or in the center of the country. In the case of the East Coast, these inland ports represent the work of aggressive State port authorities that are operating in a very competitive environment. The distance from Norfolk, VA to Savannah/Brunswick, GA is only about 450 miles and there are six deep-water ports in that area. As State port authorities (Virginia, North Carolina, South Carolina and Georgia), a main mission of the ports is to facilitate economic development. As such, the leadership of the ports (executive and Board) are tightly wound into political and economic development projects and strategies.
By comparison, on the West Coast, over roughly the same distance the main load center deep-water ports are fewer and larger (Oakland, Los Angeles and Long Beach). That none of the West Coast ports are governed as statewide entities is important – all are governed by local authorities and each has historically had little connection to supporting an overall economic development mission. Generally speaking, none of the West Coast ports has had interest to develop assets or to collaborate substantially with investment attraction strategies. This makes sense when you consider that for example, the massive volume of cargo transiting through the Port of Los Angeles is either destined for the massive Southern California consumer market, or shipped onward to distant markets across the US. In fact, the Port of Los Angeles transfers cargo to every US Congressional District.
Due to a variety of factors this dynamic is changing. Seaports on the West Coast are becoming more competitive with each other and are increasingly worried because of: 1) expanding use of alternative maritime routes through the Panama or Suez Canals or through British Columbia, 2) the increased use of larger vessels is causing ocean carriers to make fewer port calls – which means that some ports will lose business and other will gain, 3) the ocean carrier business is inherently changing - the consolidation of and cooperation between ocean carriers means the potential for few
Cambridge Systematics, Inc. 2-19
port calls, 4) an expectation of severe pressures on global trade, especially between Asia and the US (over the past 20 years, US container seaports have programmed for 5-8% growth annually and this pattern is not expected to continue), and 5) the combined effect of practically no maritime-business land for facility development and severe environmental and traffic congestion in the Bay Area and Los Angeles. Taken together, these factors are causing concern for seaports on the West Coast and are fueling some change of strategy.
Though there are not good West Coast examples of inland port projects, this may be changing. Driven by the factors above, all the West Coast ports are more focused developing competitive advantage than before, and this includes:
Attempts to adjust the rail-port relationship, whereby the balance of truck-rail is adjusted in favor of rail due to the positive impact on road congestion and environmental impact
The main container seaports in the Pacific Northwest (Seattle and Tacoma) have combined much of their business and operational strategy – mostly to form a more credible foil to the powerful Southern California ports, and a similar strategy has been employed in British Columbia where the Port of Vancouver merged with the Frasier River Port Authority to create Port Metro Vancouver
On the site of a former military installation, the Port of Oakland is developing onsite warehouse and cold storage project with CenterPoint Properties
The Port of Los Angeles recently announced joint venture participation to develop a 2,000-acre multimodal complex four hours north of the Port, the Mid California International Trade District is focused on both inbound distribution and outbound manufactured export products. This project could be the model for other offsite projects, including a massive inland cargo hub in the Inland Empire area. Beyond increased business, another objective for the Port is an attempt to support shorter-haul rail service to and from the Port.
Port Profile: DuisburgPort
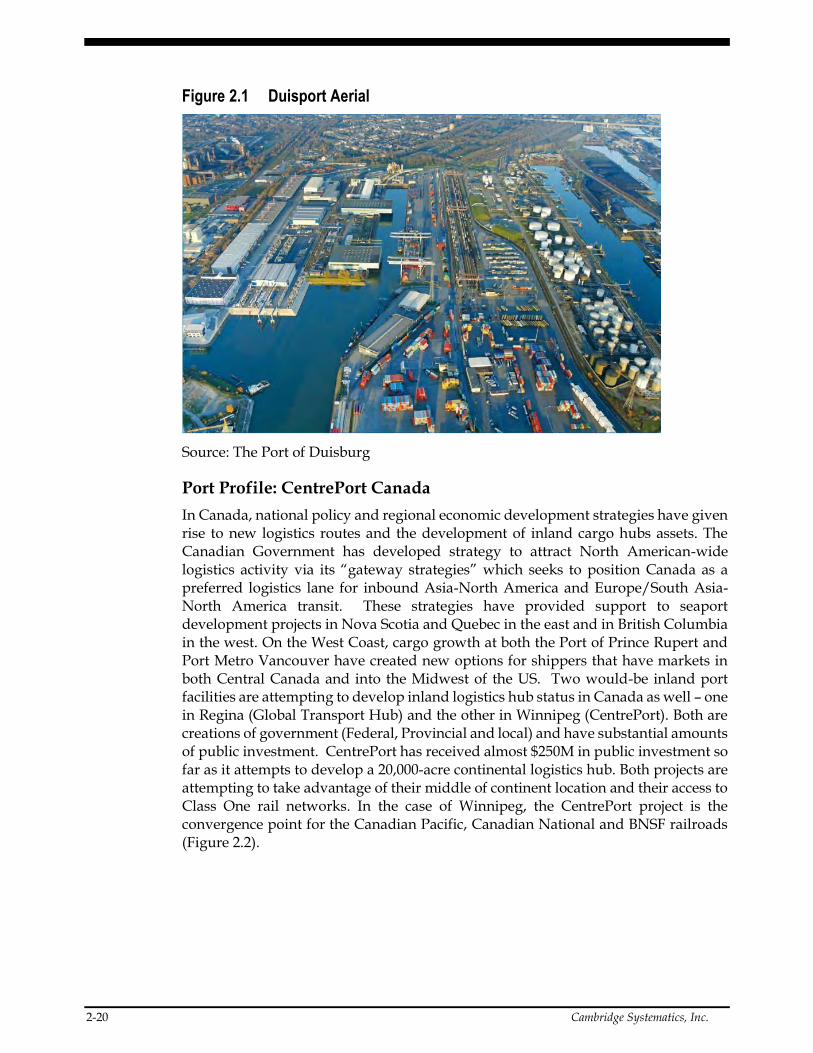
DuisburgPort—the largest inland port in the world—is located at the confluence of the Rhine and Ruhr rivers. Duisburg is a tri-modal logistics hub and the largest inland hub in Europe and the world. The Port promotes an optimal combination of advantageous geographical location and favorable location conditions with extensive logistics expertise. With a total handling of 3.7 million TEU’s (20-foot standard container), Duisburg Port has direct water, road and rail links to load-center seaports in Amsterdam, Rotterdam and Antwerp. A multimodal complex Duisburg has 25 miles of cargo handling docks handling more than 40M tons of cargo. A number of companies operate their own private docks and transit 114M tons of commodity goods annually. The Port hosts more than 20,000 annual ship calls. DuisburgPort is organized as a share capital company, with two-thirds of the shares controlled by the state of North Rhine-Westphalia and one-third the city of Duisburg (Figure 2.1).
2-20 Cambridge Systematics, Inc.
Figure 2.1 Duisport Aerial
Source: The Port of Duisburg
Port Profile: CentrePort Canada
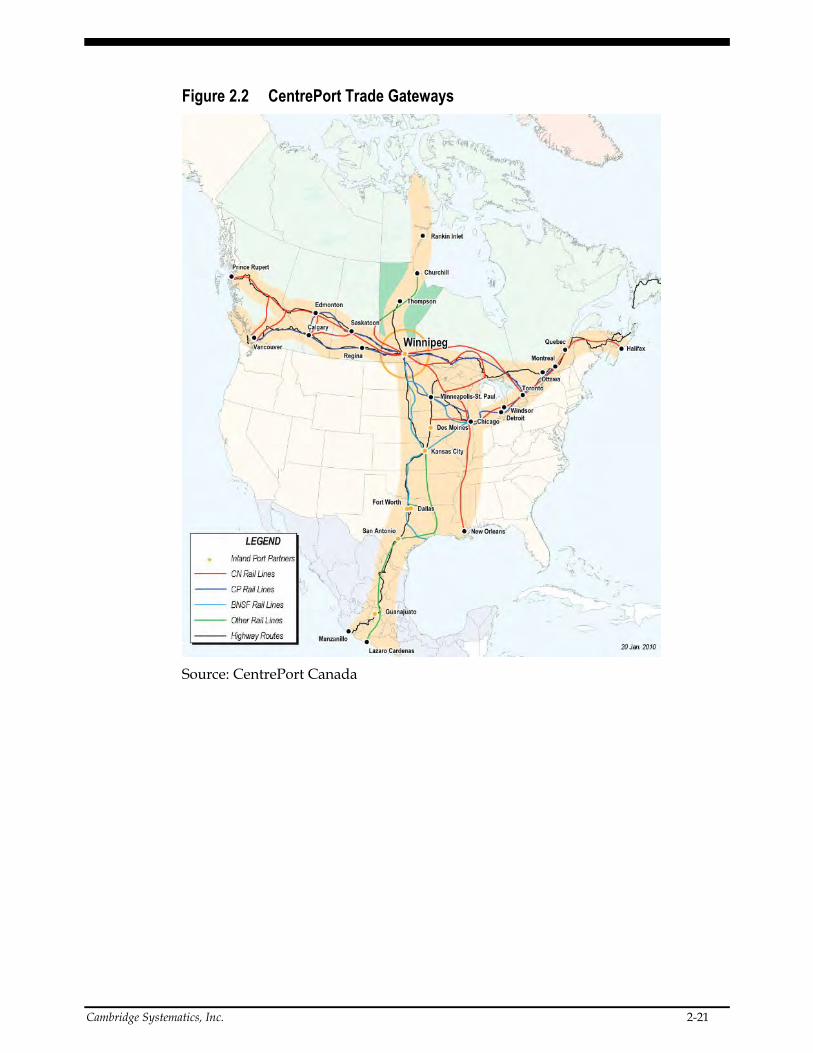
In Canada, national policy and regional economic development strategies have given rise to new logistics routes and the development of inland cargo hubs assets. The Canadian Government has developed strategy to attract North American-wide logistics activity via its “gateway strategies” which seeks to position Canada as a preferred logistics lane for inbound Asia-North America and Europe/South Asia-North America transit. These strategies have provided support to seaport development projects in Nova Scotia and Quebec in the east and in British Columbia in the west. On the West Coast, cargo growth at both the Port of Prince Rupert and Port Metro Vancouver have created new options for shippers that have markets in both Central Canada and into the Midwest of the US. Two would-be inland port facilities are attempting to develop inland logistics hub status in Canada as well – one in Regina (Global Transport Hub) and the other in Winnipeg (CentrePort). Both are creations of government (Federal, Provincial and local) and have substantial amounts of public investment. CentrePort has received almost $250M in public investment so far as it attempts to develop a 20,000-acre continental logistics hub. Both projects are attempting to take advantage of their middle of continent location and their access to Class One rail networks. In the case of Winnipeg, the CentrePort project is the convergence point for the Canadian Pacific, Canadian National and BNSF railroads (Figure 2.2).
Cambridge Systematics, Inc. 2-21
Figure 2.2 CentrePort Trade Gateways
Source: CentrePort Canada
2-22 Cambridge Systematics, Inc.
3.0 Logistics Environment
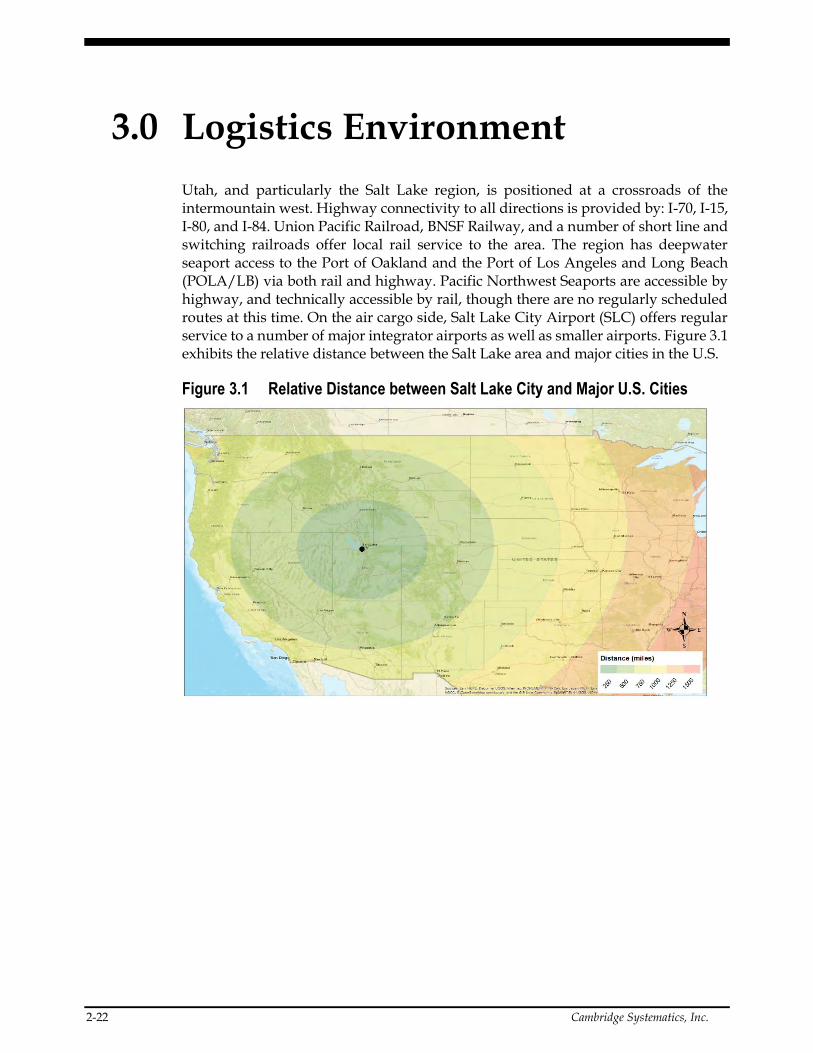
Utah, and particularly the Salt Lake region, is positioned at a crossroads of the intermountain west. Highway connectivity to all directions is provided by: I-70, I-15, I-80, and I-84. Union Pacific Railroad, BNSF Railway, and a number of short line and switching railroads offer local rail service to the area. The region has deepwater seaport access to the Port of Oakland and the Port of Los Angeles and Long Beach (POLA/LB) via both rail and highway. Pacific Northwest Seaports are accessible by highway, and technically accessible by rail, though there are no regularly scheduled routes at this time. On the air cargo side, Salt Lake City Airport (SLC) offers regular service to a number of major integrator airports as well as smaller airports. Figure 3.1 exhibits the relative distance between the Salt Lake area and major cities in the U.S.
Figure 3.1 Relative Distance between Salt Lake City and Major U.S. Cities
Cambridge Systematics, Inc. 2-23
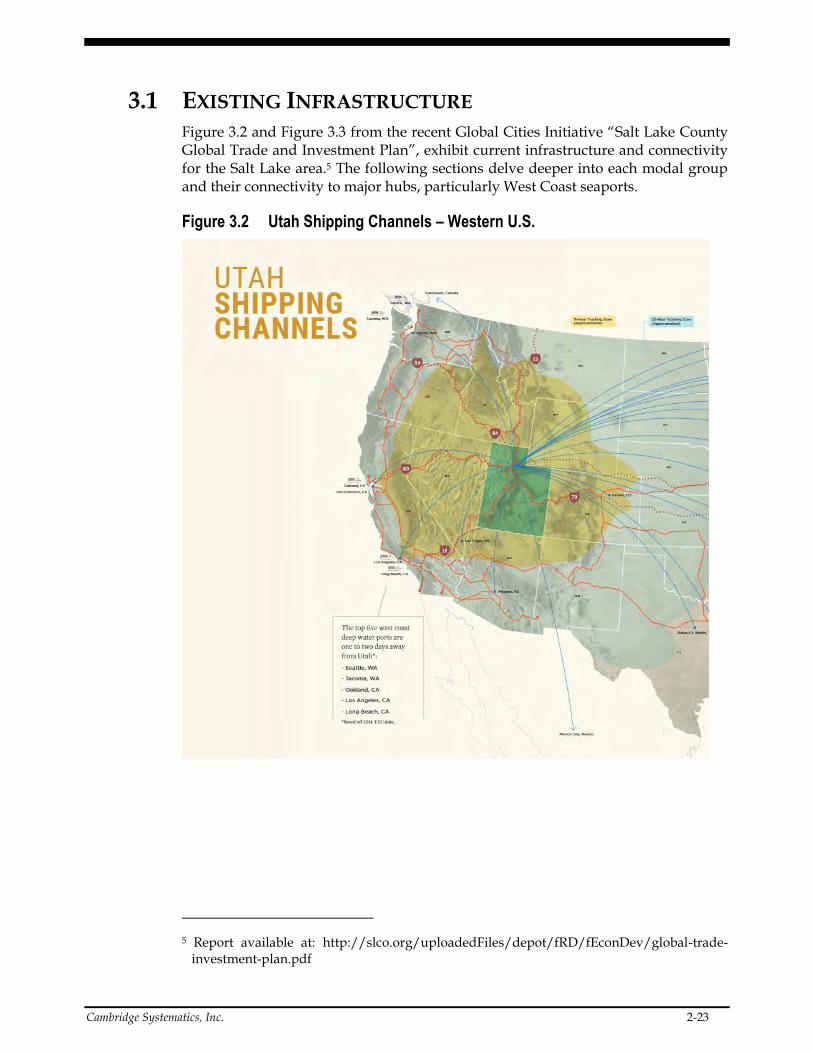
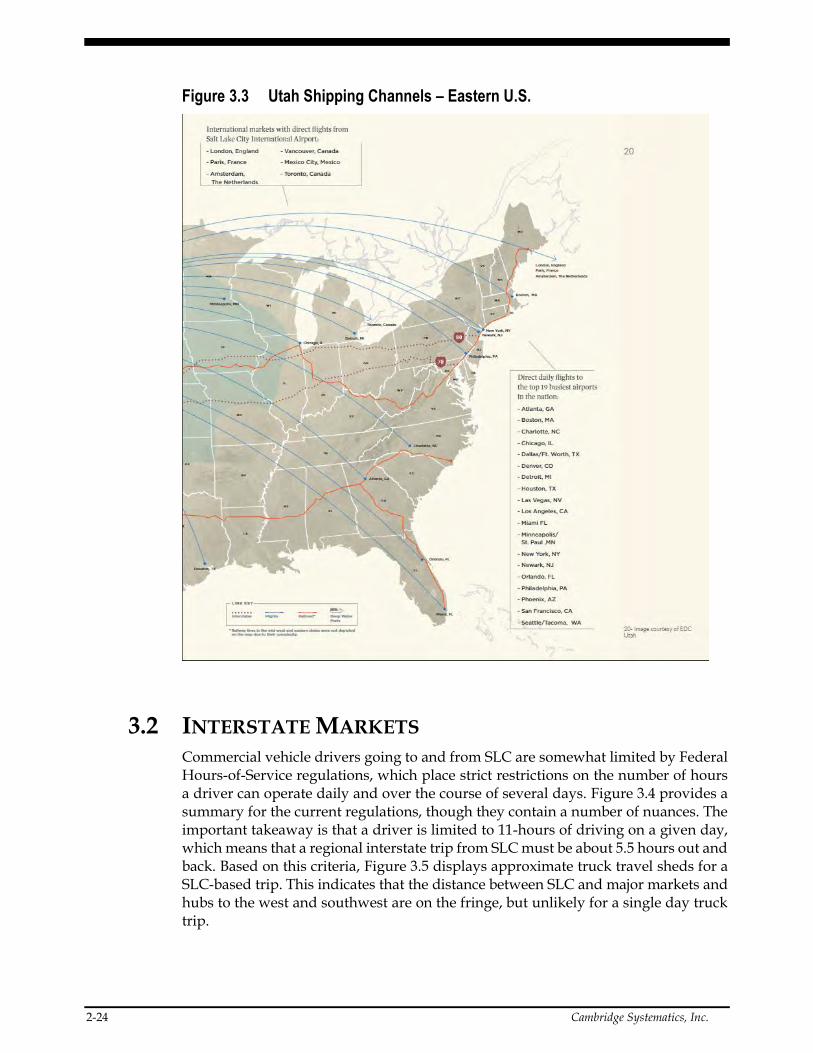
3.1 EXISTING INFRASTRUCTURE Figure 3.2 and Figure 3.3 from the recent Global Cities Initiative “Salt Lake County Global Trade and Investment Plan”, exhibit current infrastructure and connectivity for the Salt Lake area.5 The following sections delve deeper into each modal group and their connectivity to major hubs, particularly West Coast seaports.
Figure 3.2 Utah Shipping Channels – Western U.S.
5 Report available at: http://slco.org/uploadedFiles/depot/fRD/fEconDev/global-trade-investment-plan.pdf
2-24 Cambridge Systematics, Inc.
Figure 3.3 Utah Shipping Channels – Eastern U.S.
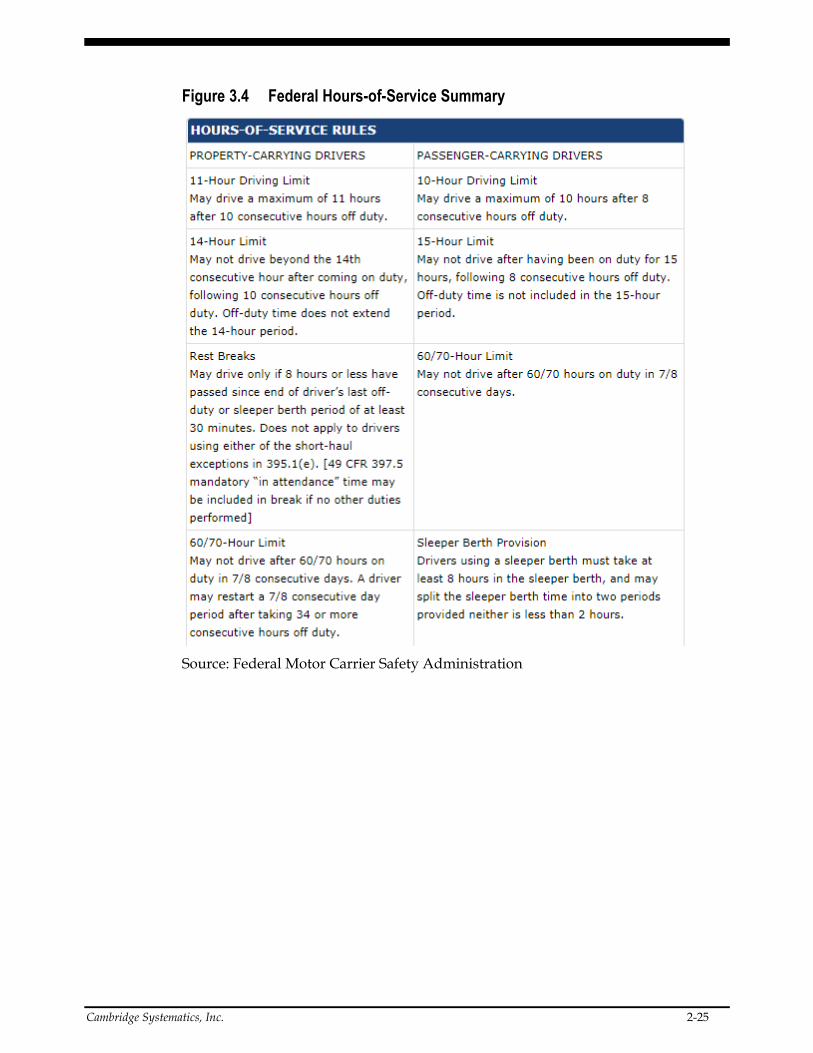
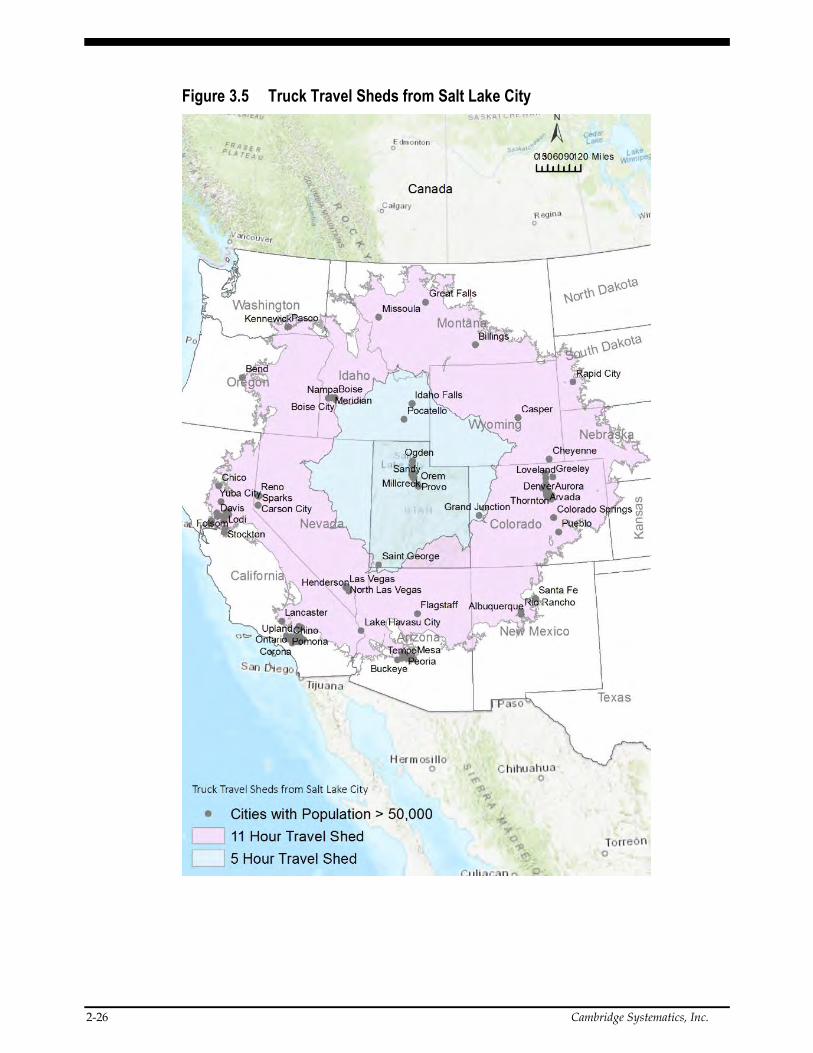
3.2 INTERSTATE MARKETS Commercial vehicle drivers going to and from SLC are somewhat limited by Federal Hours-of-Service regulations, which place strict restrictions on the number of hours a driver can operate daily and over the course of several days. Figure 3.4 provides a summary for the current regulations, though they contain a number of nuances. The important takeaway is that a driver is limited to 11-hours of driving on a given day, which means that a regional interstate trip from SLC must be about 5.5 hours out and back. Based on this criteria, Figure 3.5 displays approximate truck travel sheds for a SLC-based trip. This indicates that the distance between SLC and major markets and hubs to the west and southwest are on the fringe, but unlikely for a single day truck trip.
Cambridge Systematics, Inc. 2-25
Figure 3.4 Federal Hours-of-Service Summary
Source: Federal Motor Carrier Safety Administration
2-26 Cambridge Systematics, Inc.
Figure 3.5 Truck Travel Sheds from Salt Lake City
Cambridge Systematics, Inc. 2-27
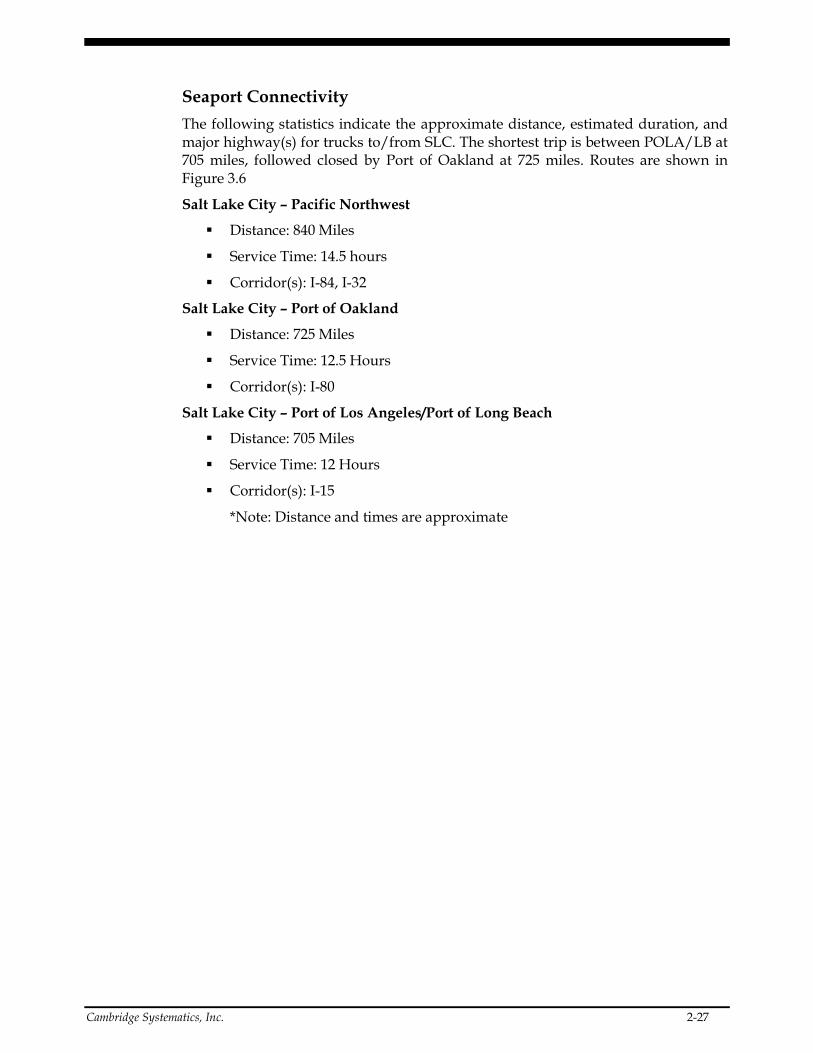
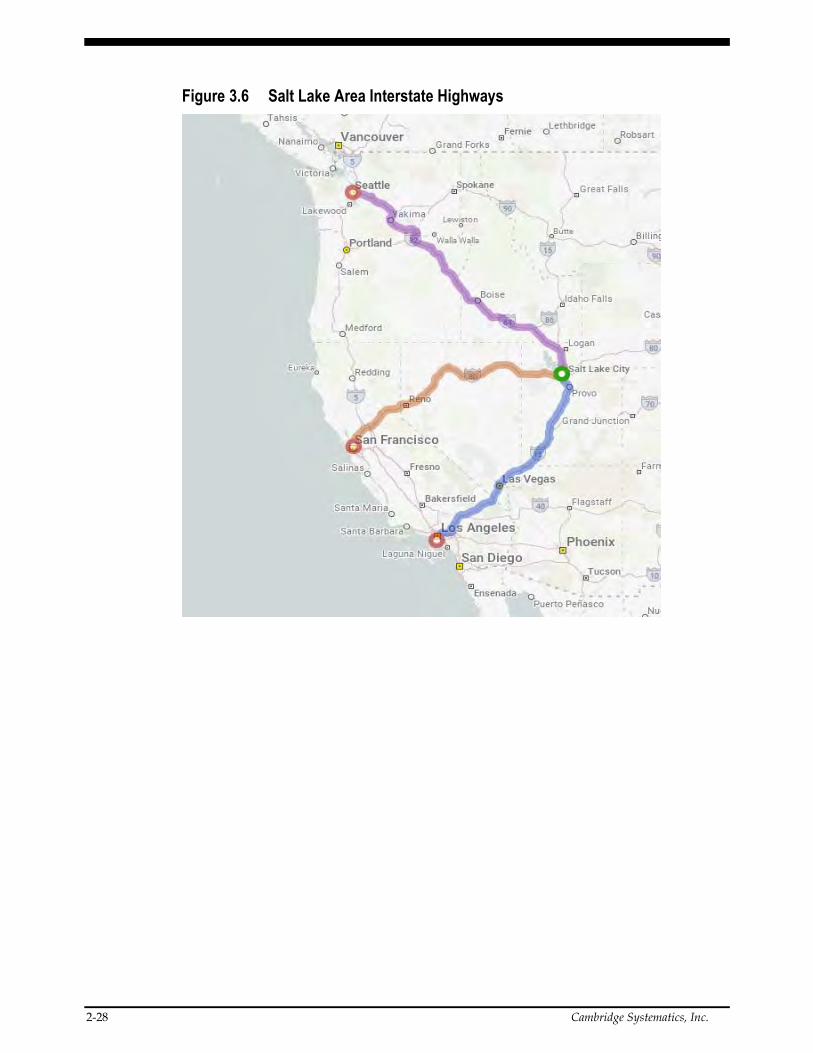
Seaport Connectivity
The following statistics indicate the approximate distance, estimated duration, and major highway(s) for trucks to/from SLC. The shortest trip is between POLA/LB at 705 miles, followed closed by Port of Oakland at 725 miles. Routes are shown in Figure 3.6
Salt Lake City – Pacific Northwest
Distance: 840 Miles
Service Time: 14.5 hours
Corridor(s): I-84, I-32
Salt Lake City – Port of Oakland
Distance: 725 Miles
Service Time: 12.5 Hours
Corridor(s): I-80
Salt Lake City – Port of Los Angeles/Port of Long Beach
Distance: 705 Miles
Service Time: 12 Hours
Corridor(s): I-15
*Note: Distance and times are approximate
2-28 Cambridge Systematics, Inc.
Figure 3.6 Salt Lake Area Interstate Highways
Cambridge Systematics, Inc. 2-29
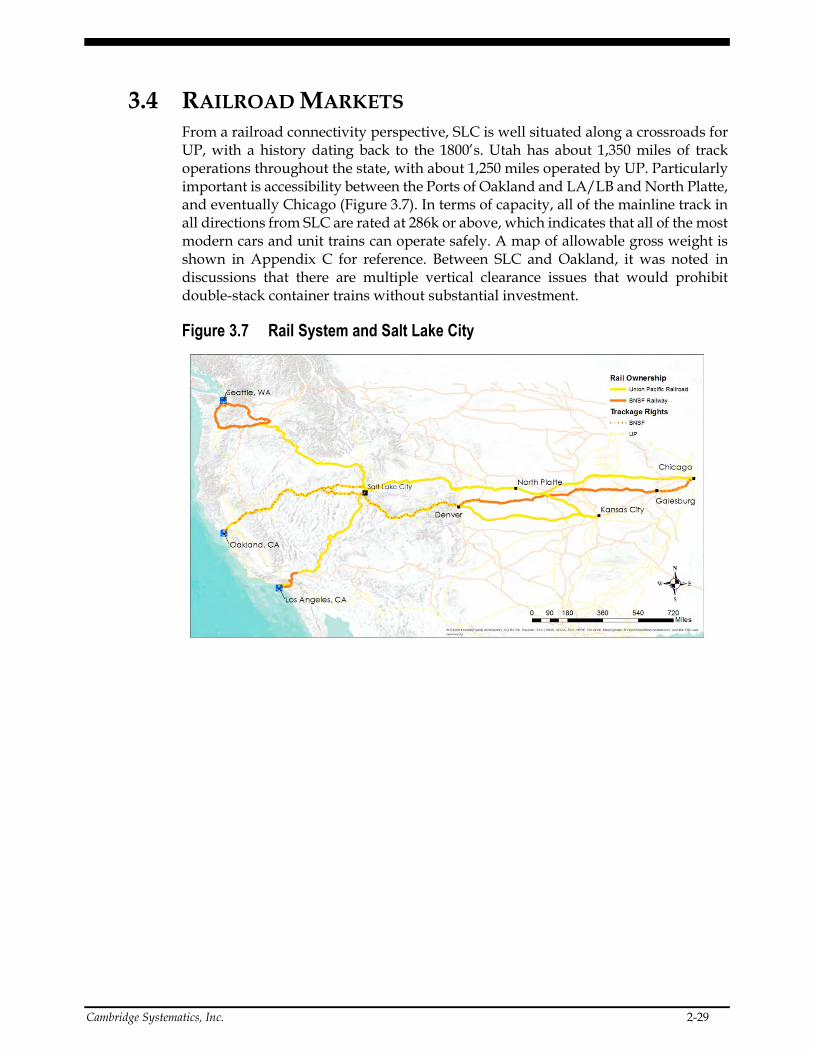
3.4 RAILROAD MARKETS From a railroad connectivity perspective, SLC is well situated along a crossroads for UP, with a history dating back to the 1800’s. Utah has about 1,350 miles of track operations throughout the state, with about 1,250 miles operated by UP. Particularly important is accessibility between the Ports of Oakland and LA/LB and North Platte, and eventually Chicago (Figure 3.7). In terms of capacity, all of the mainline track in all directions from SLC are rated at 286k or above, which indicates that all of the most modern cars and unit trains can operate safely. A map of allowable gross weight is shown in Appendix C for reference. Between SLC and Oakland, it was noted in discussions that there are multiple vertical clearance issues that would prohibit double-stack container trains without substantial investment.
Figure 3.7 Rail System and Salt Lake City
2-30 Cambridge Systematics, Inc.
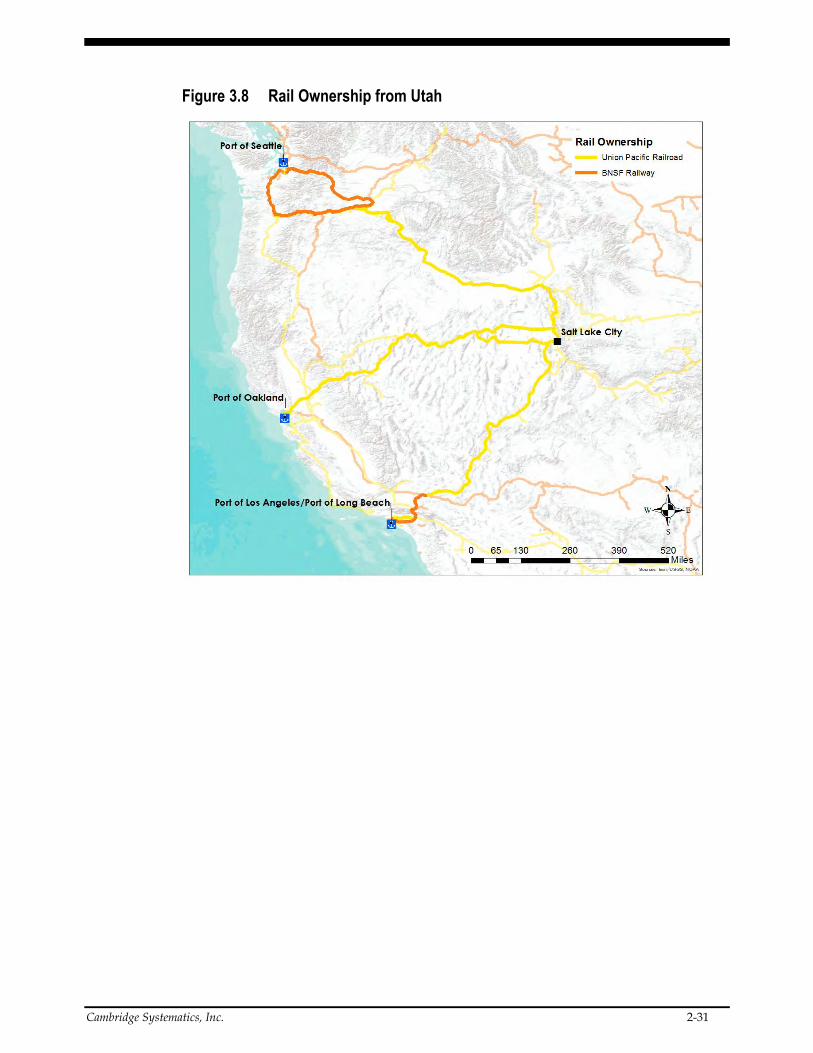
The following statistics indicate the approximate distance, estimated duration, and rail routes to/from SLC. The shortest trip is between POLA/LB and, followed closed by the Port of Oakland. BNSF does not have direct access between SLC and POLA/LB under current trackage rights agreements, therefore the trip would include Oakland, then southbound (Figure 3.8).
Salt Lake City – Pacific Northwest
Distance: 870 Miles (BNSF: 1370 Miles)
Service Time: Not currently served
Ownership: Segments of BNSF and UP
Salt Lake City – Port of Oakland
Distance: 840 Miles
Service Time: 3 Days
Ownership: UP (BNSF Trackage Rights)
Salt Lake City – Port of Los Angeles/Port of Long Beach
Distance: UP: 740 Miles BNSF: 1265 Miles
Service Time: 3 Day Intermodal (UP)
Ownership: UP from SLC to Barstow
*Note: Distance and times are approximate
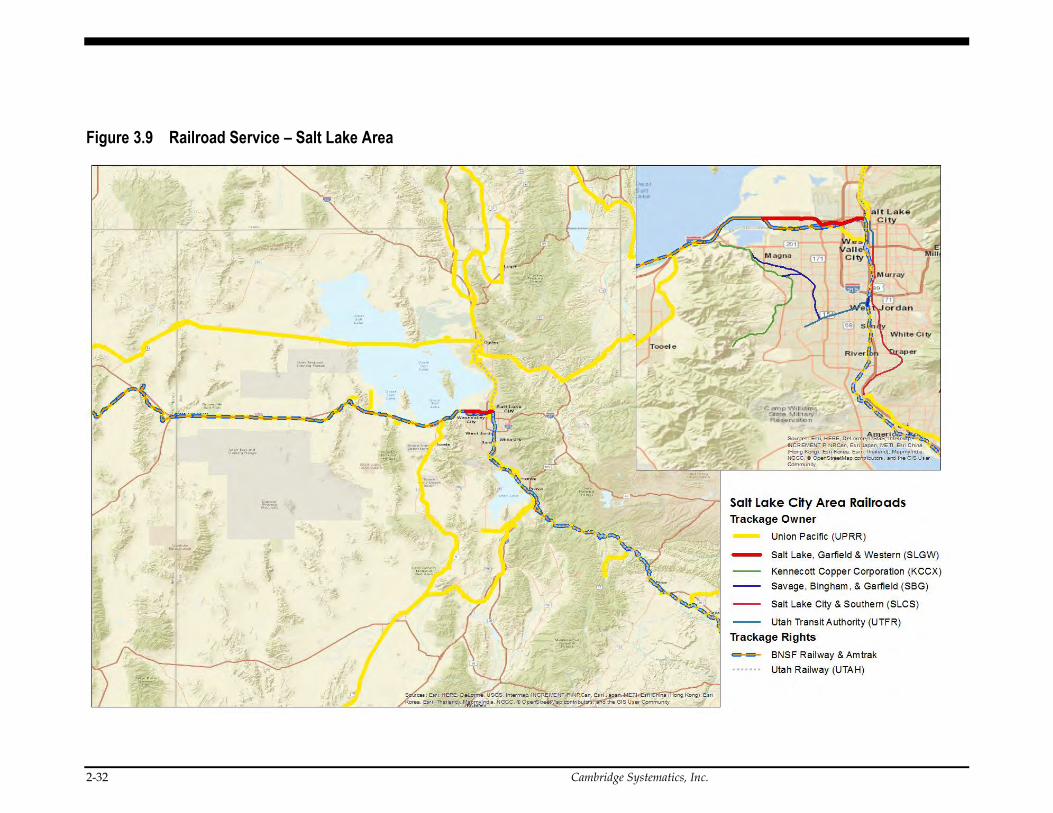
Figure 3.9 depicts rail operations in the Greater Salt Lake Region. As noted, UP owns the majority of trackage in the region, with four short line railroads providing service to customers in several areas of the metro area. BNSF, Utah Railway and Amtrak all have trackage rights to operate on specified segments, but do not own track in the region.
Cambridge Systematics, Inc. 2-31
Figure 3.8 Rail Ownership from Utah
2-32 Cambridge Systematics, Inc.
Figure 3.9 Railroad Service – Salt Lake Area

Cambridge Systematics, Inc. 2-33
Utah Inland Port - Feasibility Analysis
2-34 Cambridge Systematics, Inc.
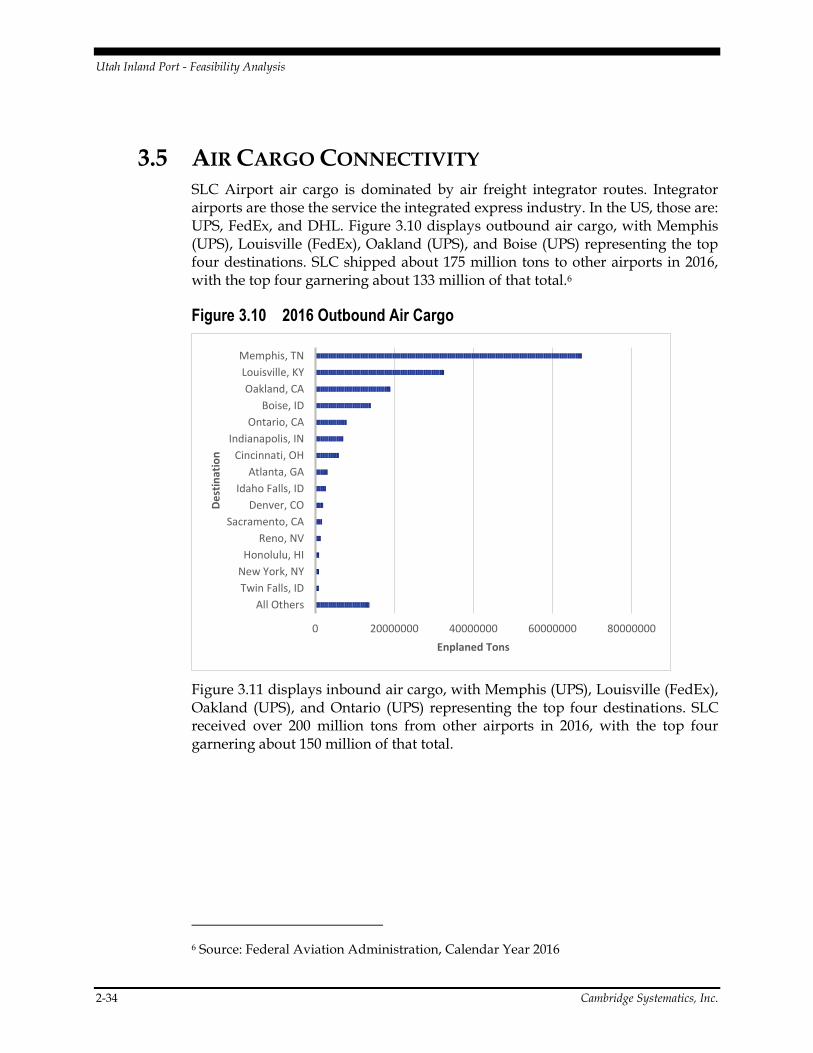
3.5 AIR CARGO CONNECTIVITY SLC Airport air cargo is dominated by air freight integrator routes. Integrator airports are those the service the integrated express industry. In the US, those are: UPS, FedEx, and DHL. Figure 3.10 displays outbound air cargo, with Memphis (UPS), Louisville (FedEx), Oakland (UPS), and Boise (UPS) representing the top four destinations. SLC shipped about 175 million tons to other airports in 2016, with the top four garnering about 133 million of that total.6
Figure 3.10 2016 Outbound Air Cargo
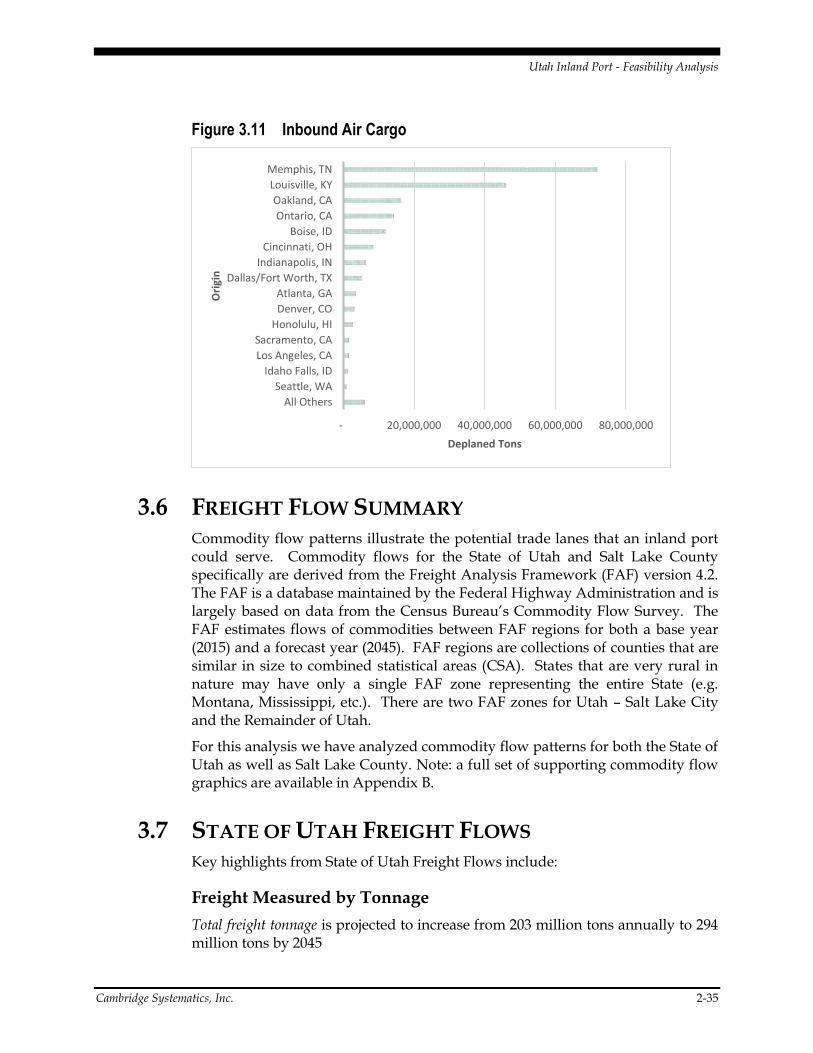
Figure 3.11 displays inbound air cargo, with Memphis (UPS), Louisville (FedEx), Oakland (UPS), and Ontario (UPS) representing the top four destinations. SLC received over 200 million tons from other airports in 2016, with the top four garnering about 150 million of that total.
6 Source: Federal Aviation Administration, Calendar Year 2016
0 20000000 40000000 60000000 80000000
All Others
Twin Falls, ID
New York, NY
Honolulu, HI
Reno, NV
Sacramento, CA
Denver, CO
Idaho Falls, ID
Atlanta, GA
Cincinnati, OH
Indianapolis, IN
Ontario, CA
Boise, ID
Oakland, CA
Louisville, KY
Memphis, TN
Enplaned Tons
De
stin
atio
n
Utah Inland Port - Feasibility Analysis
Cambridge Systematics, Inc. 2-35
Figure 3.11 Inbound Air Cargo
3.6 FREIGHT FLOW SUMMARY Commodity flow patterns illustrate the potential trade lanes that an inland port could serve. Commodity flows for the State of Utah and Salt Lake County specifically are derived from the Freight Analysis Framework (FAF) version 4.2. The FAF is a database maintained by the Federal Highway Administration and is largely based on data from the Census Bureau’s Commodity Flow Survey. The FAF estimates flows of commodities between FAF regions for both a base year (2015) and a forecast year (2045). FAF regions are collections of counties that are similar in size to combined statistical areas (CSA). States that are very rural in nature may have only a single FAF zone representing the entire State (e.g. Montana, Mississippi, etc.). There are two FAF zones for Utah – Salt Lake City and the Remainder of Utah.
For this analysis we have analyzed commodity flow patterns for both the State of Utah as well as Salt Lake County. Note: a full set of supporting commodity flow graphics are available in Appendix B.
3.7 STATE OF UTAH FREIGHT FLOWS Key highlights from State of Utah Freight Flows include:
Freight Measured by Tonnage
Total freight tonnage is projected to increase from 203 million tons annually to 294 million tons by 2045
- 20,000,000 40,000,000 60,000,000 80,000,000
All Others
Seattle, WA
Idaho Falls, ID
Los Angeles, CA
Sacramento, CA
Honolulu, HI
Denver, CO
Atlanta, GA
Dallas/Fort Worth, TX
Indianapolis, IN
Cincinnati, OH
Boise, ID
Ontario, CA
Oakland, CA
Louisville, KY
Memphis, TN
Deplaned Tons
Ori
gin
Utah Inland Port - Feasibility Analysis
2-36 Cambridge Systematics, Inc.
The outbound share of traffic is projected to increase by 4% in that time
Modal split is dominated by truck and pipeline (~85%)
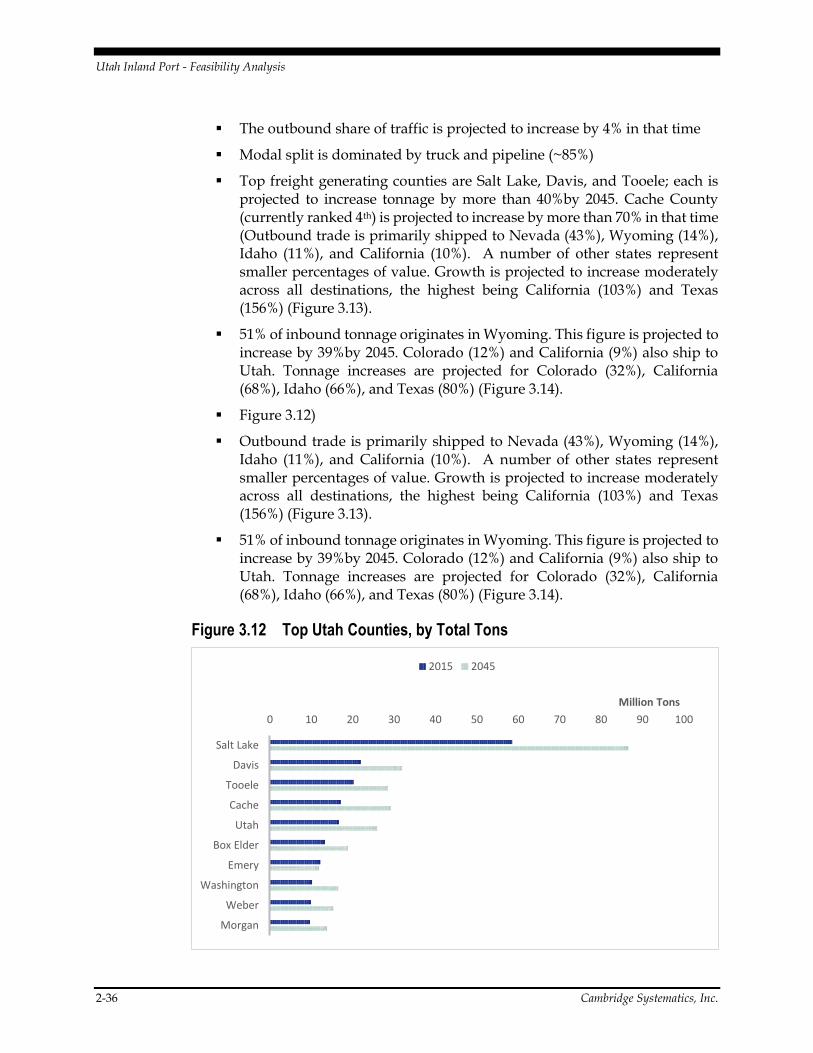
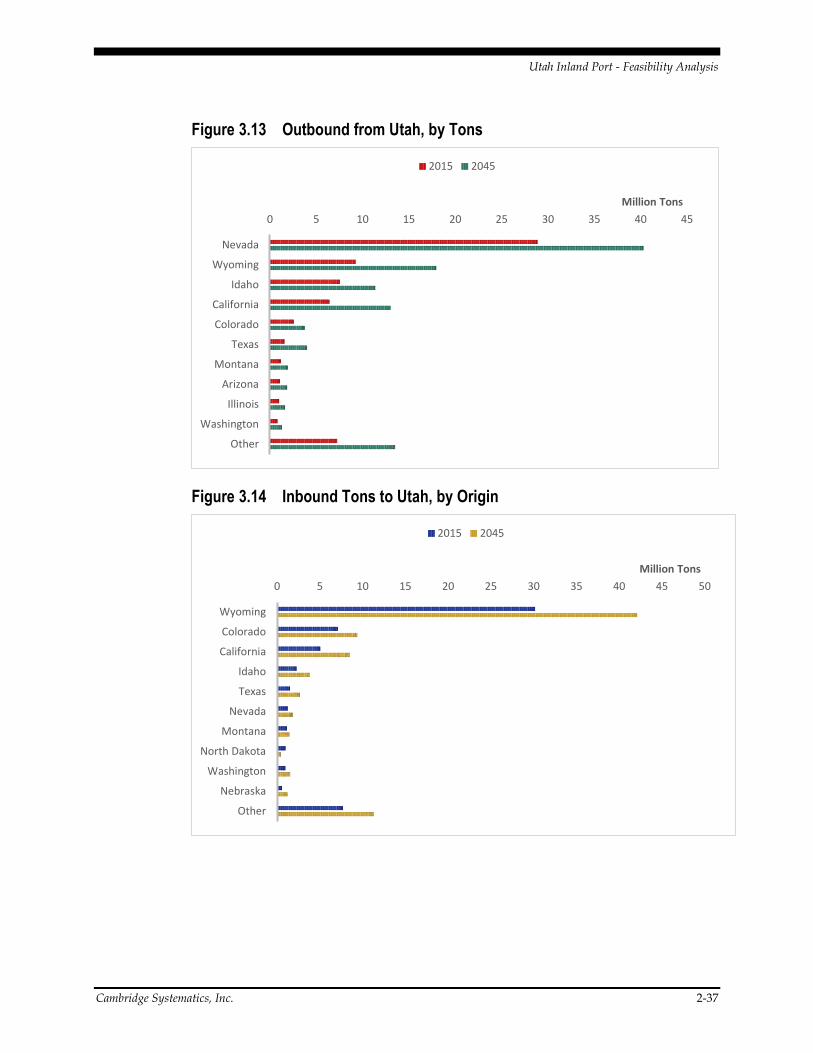
Top freight generating counties are Salt Lake, Davis, and Tooele; each is projected to increase tonnage by more than 40%by 2045. Cache County (currently ranked 4th) is projected to increase by more than 70% in that time (Outbound trade is primarily shipped to Nevada (43%), Wyoming (14%), Idaho (11%), and California (10%). A number of other states represent smaller percentages of value. Growth is projected to increase moderately across all destinations, the highest being California (103%) and Texas (156%) (Figure 3.13).
51% of inbound tonnage originates in Wyoming. This figure is projected to increase by 39%by 2045. Colorado (12%) and California (9%) also ship to Utah. Tonnage increases are projected for Colorado (32%), California (68%), Idaho (66%), and Texas (80%) (Figure 3.14).
Figure 3.12)
Outbound trade is primarily shipped to Nevada (43%), Wyoming (14%), Idaho (11%), and California (10%). A number of other states represent smaller percentages of value. Growth is projected to increase moderately across all destinations, the highest being California (103%) and Texas (156%) (Figure 3.13).
51% of inbound tonnage originates in Wyoming. This figure is projected to increase by 39%by 2045. Colorado (12%) and California (9%) also ship to Utah. Tonnage increases are projected for Colorado (32%), California (68%), Idaho (66%), and Texas (80%) (Figure 3.14).
Figure 3.12 Top Utah Counties, by Total Tons
0 10 20 30 40 50 60 70 80 90 100
Salt Lake
Davis
Tooele
Cache
Utah
Box Elder
Emery
Washington
Weber
Morgan
Million Tons
2015 2045
Utah Inland Port - Feasibility Analysis
Cambridge Systematics, Inc. 2-37
Figure 3.13 Outbound from Utah, by Tons
Figure 3.14 Inbound Tons to Utah, by Origin
0 5 10 15 20 25 30 35 40 45
Nevada
Wyoming
Idaho
California
Colorado
Texas
Montana
Arizona
Illinois
Washington
Other
Million Tons
2015 2045
0 5 10 15 20 25 30 35 40 45 50
Wyoming
Colorado
California
Idaho
Texas
Nevada
Montana
North Dakota
Washington
Nebraska
Other
Million Tons
2015 2045
Utah Inland Port - Feasibility Analysis
2-38 Cambridge Systematics, Inc.
Freight Measured by Value
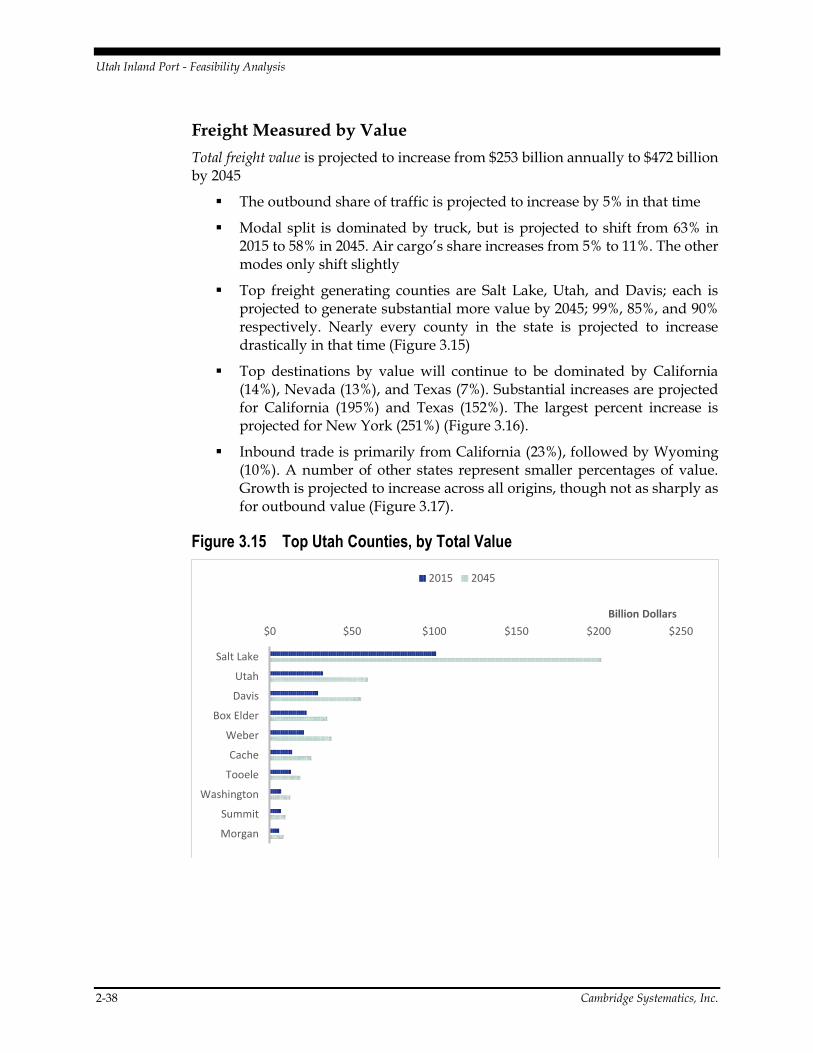
Total freight value is projected to increase from $253 billion annually to $472 billion by 2045
The outbound share of traffic is projected to increase by 5% in that time
Modal split is dominated by truck, but is projected to shift from 63% in 2015 to 58% in 2045. Air cargo’s share increases from 5% to 11%. The other modes only shift slightly
Top freight generating counties are Salt Lake, Utah, and Davis; each is projected to generate substantial more value by 2045; 99%, 85%, and 90% respectively. Nearly every county in the state is projected to increase drastically in that time (Figure 3.15)
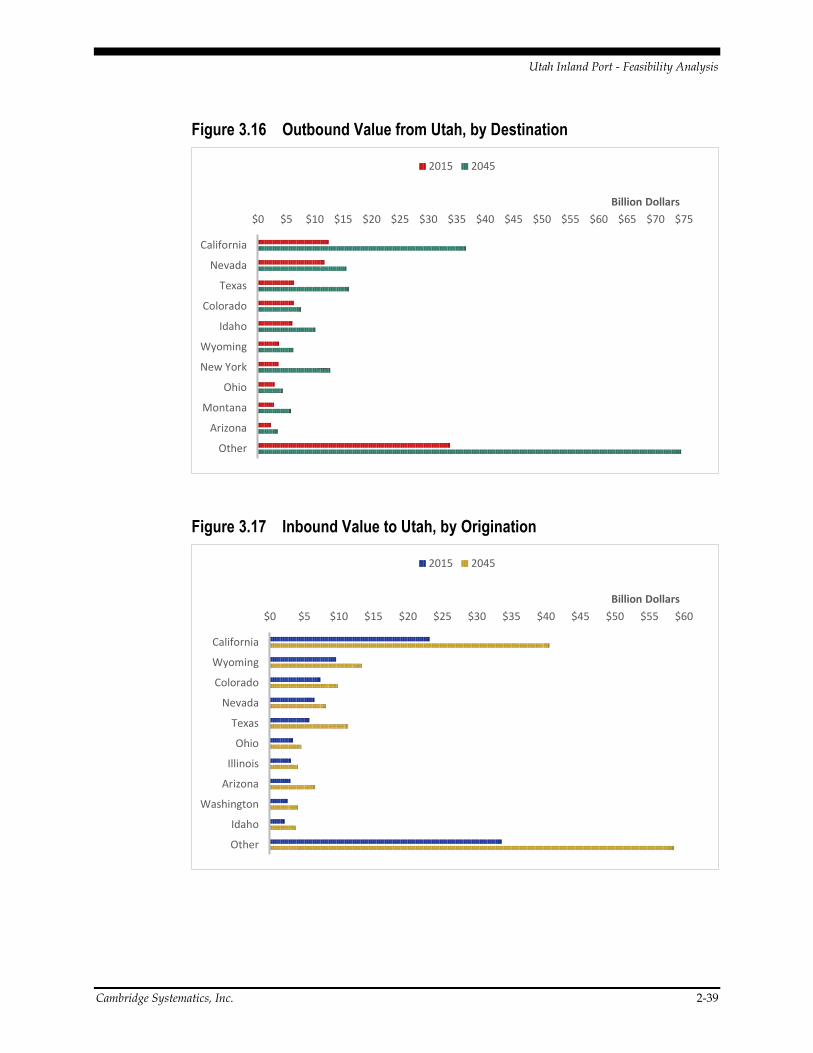
Top destinations by value will continue to be dominated by California (14%), Nevada (13%), and Texas (7%). Substantial increases are projected for California (195%) and Texas (152%). The largest percent increase is projected for New York (251%) (Figure 3.16).
Inbound trade is primarily from California (23%), followed by Wyoming (10%). A number of other states represent smaller percentages of value. Growth is projected to increase across all origins, though not as sharply as for outbound value (Figure 3.17).
Figure 3.15 Top Utah Counties, by Total Value
$0 $50 $100 $150 $200 $250
Salt Lake
Utah
Davis
Box Elder
Weber
Cache
Tooele
Washington
Summit
Morgan
Billion Dollars
2015 2045
Utah Inland Port - Feasibility Analysis
Cambridge Systematics, Inc. 2-39
Figure 3.16 Outbound Value from Utah, by Destination
Figure 3.17 Inbound Value to Utah, by Origination
$0 $5 $10 $15 $20 $25 $30 $35 $40 $45 $50 $55 $60 $65 $70 $75
California
Nevada
Texas
Colorado
Idaho
Wyoming
New York
Ohio
Montana
Arizona
Other
Billion Dollars
2015 2045
$0 $5 $10 $15 $20 $25 $30 $35 $40 $45 $50 $55 $60
California
Wyoming
Colorado
Nevada
Texas
Ohio
Illinois
Arizona
Washington
Idaho
Other
Billion Dollars
2015 2045
Utah Inland Port - Feasibility Analysis
2-40 Cambridge Systematics, Inc.
Foreign Trade
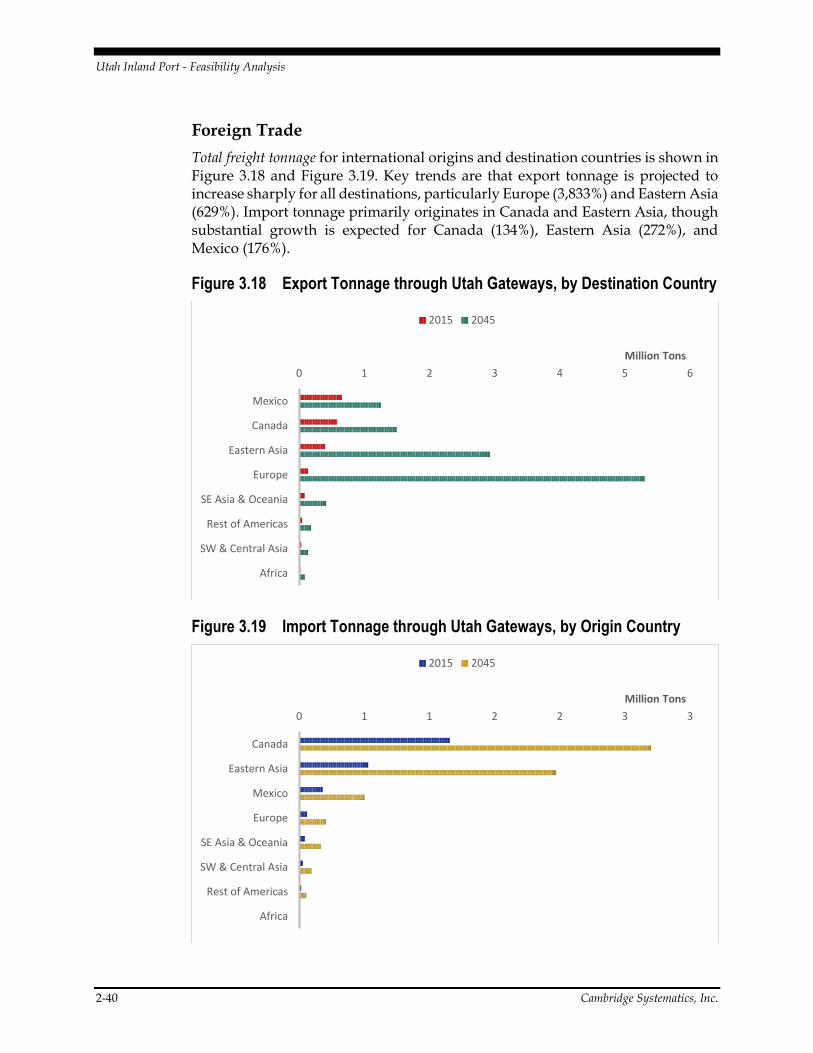
Total freight tonnage for international origins and destination countries is shown in Figure 3.18 and Figure 3.19. Key trends are that export tonnage is projected to increase sharply for all destinations, particularly Europe (3,833%) and Eastern Asia (629%). Import tonnage primarily originates in Canada and Eastern Asia, though substantial growth is expected for Canada (134%), Eastern Asia (272%), and Mexico (176%).
Figure 3.18 Export Tonnage through Utah Gateways, by Destination Country
Figure 3.19 Import Tonnage through Utah Gateways, by Origin Country
0 1 2 3 4 5 6
Mexico
Canada
Eastern Asia
Europe
SE Asia & Oceania
Rest of Americas
SW & Central Asia
Africa
Million Tons
2015 2045
0 1 1 2 2 3 3
Canada
Eastern Asia
Mexico
Europe
SE Asia & Oceania
SW & Central Asia
Rest of Americas
Africa
Million Tons
2015 2045
Utah Inland Port - Feasibility Analysis
Cambridge Systematics, Inc. 2-41
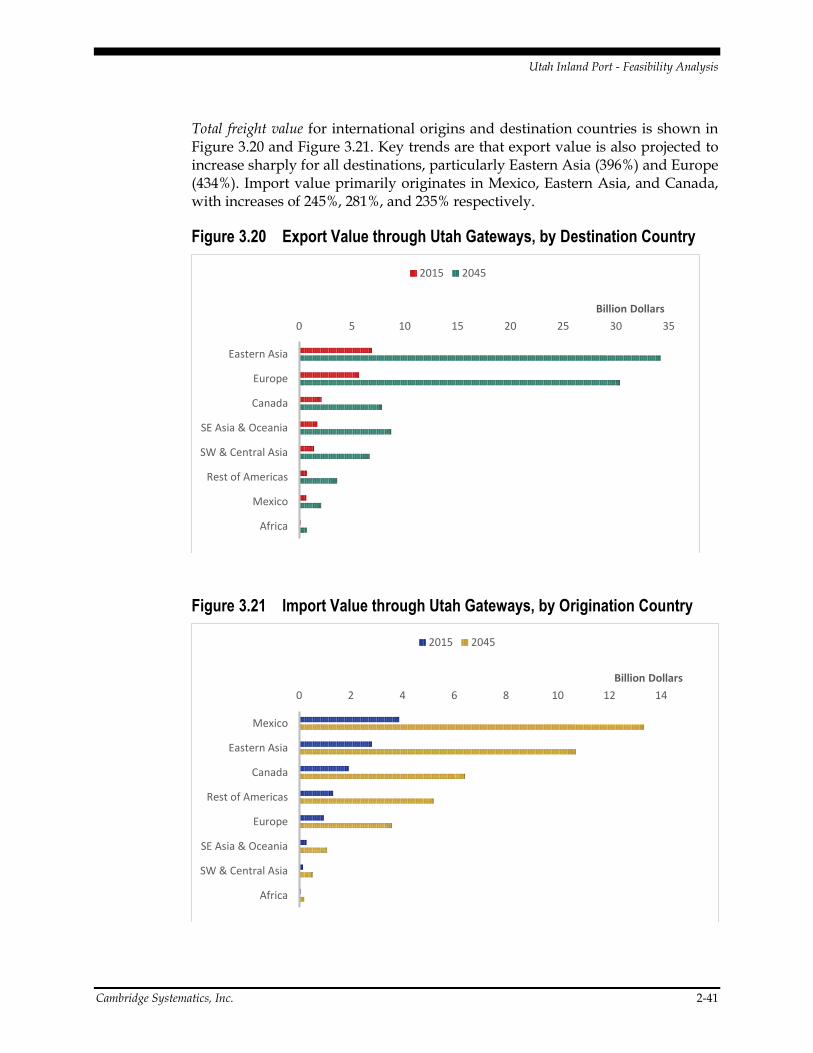
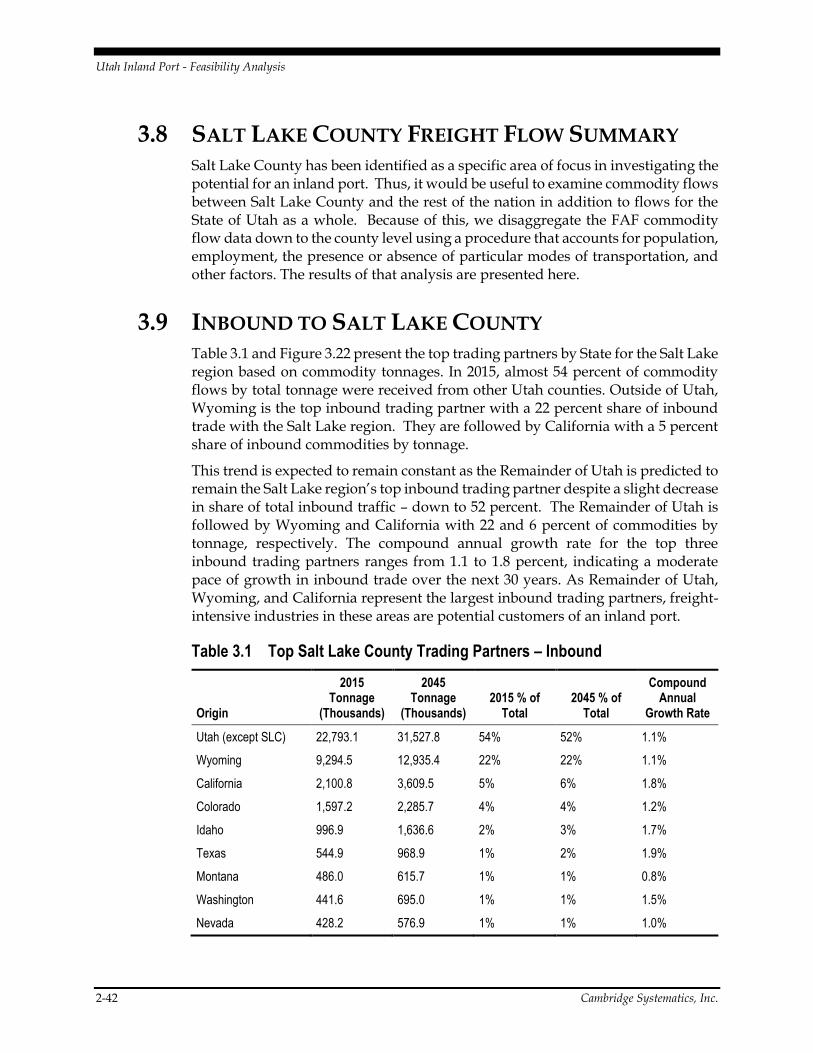
Total freight value for international origins and destination countries is shown in Figure 3.20 and Figure 3.21. Key trends are that export value is also projected to increase sharply for all destinations, particularly Eastern Asia (396%) and Europe (434%). Import value primarily originates in Mexico, Eastern Asia, and Canada, with increases of 245%, 281%, and 235% respectively.
Figure 3.20 Export Value through Utah Gateways, by Destination Country
Figure 3.21 Import Value through Utah Gateways, by Origination Country
0 5 10 15 20 25 30 35
Eastern Asia
Europe
Canada
SE Asia & Oceania
SW & Central Asia
Rest of Americas
Mexico
Africa
Billion Dollars
2015 2045
0 2 4 6 8 10 12 14
Mexico
Eastern Asia
Canada
Rest of Americas
Europe
SE Asia & Oceania
SW & Central Asia
Africa
Billion Dollars
2015 2045
Utah Inland Port - Feasibility Analysis
2-42 Cambridge Systematics, Inc.
3.8 SALT LAKE COUNTY FREIGHT FLOW SUMMARY Salt Lake County has been identified as a specific area of focus in investigating the potential for an inland port. Thus, it would be useful to examine commodity flows between Salt Lake County and the rest of the nation in addition to flows for the State of Utah as a whole. Because of this, we disaggregate the FAF commodity flow data down to the county level using a procedure that accounts for population, employment, the presence or absence of particular modes of transportation, and other factors. The results of that analysis are presented here.
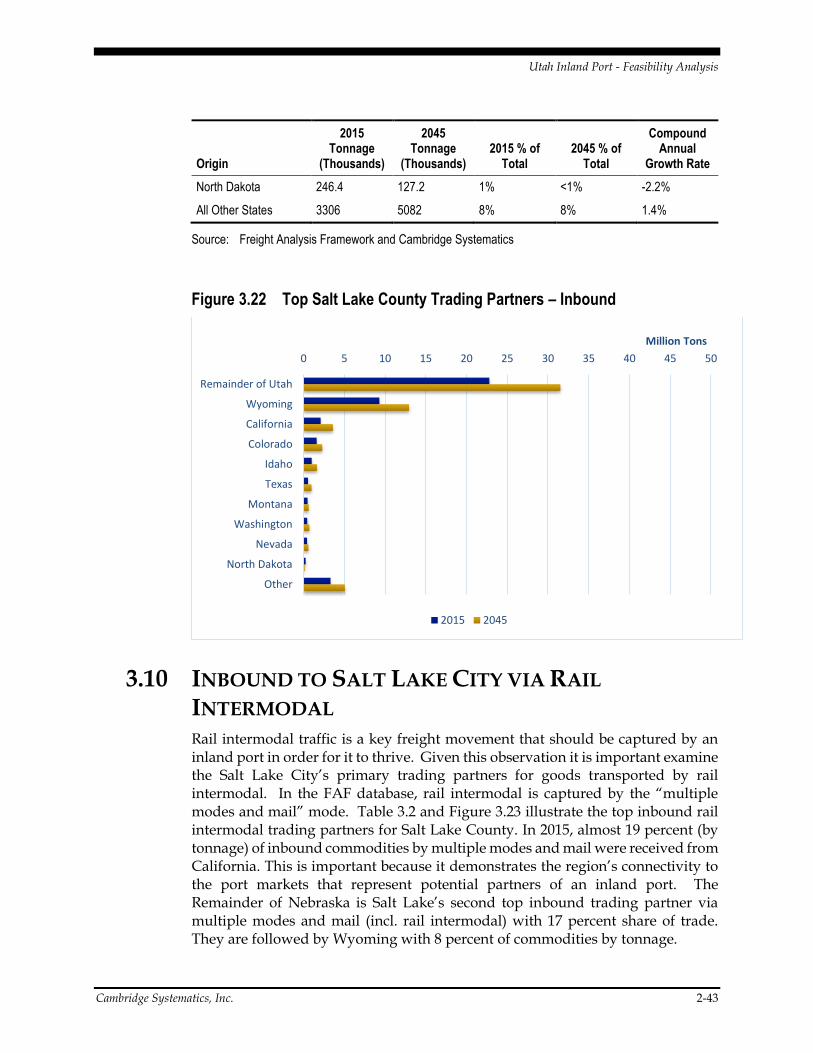
3.9 INBOUND TO SALT LAKE COUNTY Table 3.1 and Figure 3.22 present the top trading partners by State for the Salt Lake region based on commodity tonnages. In 2015, almost 54 percent of commodity flows by total tonnage were received from other Utah counties. Outside of Utah, Wyoming is the top inbound trading partner with a 22 percent share of inbound trade with the Salt Lake region. They are followed by California with a 5 percent share of inbound commodities by tonnage.
This trend is expected to remain constant as the Remainder of Utah is predicted to remain the Salt Lake region’s top inbound trading partner despite a slight decrease in share of total inbound traffic – down to 52 percent. The Remainder of Utah is followed by Wyoming and California with 22 and 6 percent of commodities by tonnage, respectively. The compound annual growth rate for the top three inbound trading partners ranges from 1.1 to 1.8 percent, indicating a moderate pace of growth in inbound trade over the next 30 years. As Remainder of Utah, Wyoming, and California represent the largest inbound trading partners, freight-intensive industries in these areas are potential customers of an inland port.
Table 3.1 Top Salt Lake County Trading Partners – Inbound
Origin
2015 Tonnage
(Thousands)
2045 Tonnage
(Thousands) 2015 % of
Total 2045 % of
Total
Compound Annual
Growth Rate
Utah (except SLC) 22,793.1 31,527.8 54% 52% 1.1%
Wyoming 9,294.5 12,935.4 22% 22% 1.1%
California 2,100.8 3,609.5 5% 6% 1.8%
Colorado 1,597.2 2,285.7 4% 4% 1.2%
Idaho 996.9 1,636.6 2% 3% 1.7%
Texas 544.9 968.9 1% 2% 1.9%
Montana 486.0 615.7 1% 1% 0.8%
Washington 441.6 695.0 1% 1% 1.5%
Nevada 428.2 576.9 1% 1% 1.0%
Utah Inland Port - Feasibility Analysis
Cambridge Systematics, Inc. 2-43
Origin
2015 Tonnage
(Thousands)
2045 Tonnage
(Thousands) 2015 % of
Total 2045 % of
Total
Compound Annual
Growth Rate
North Dakota 246.4 127.2 1% <1% -2.2%
All Other States 3306 5082 8% 8% 1.4%
Source: Freight Analysis Framework and Cambridge Systematics
Figure 3.22 Top Salt Lake County Trading Partners – Inbound
3.10 INBOUND TO SALT LAKE CITY VIA RAIL
INTERMODAL Rail intermodal traffic is a key freight movement that should be captured by an inland port in order for it to thrive. Given this observation it is important examine the Salt Lake City’s primary trading partners for goods transported by rail intermodal. In the FAF database, rail intermodal is captured by the “multiple modes and mail” mode. Table 3.2 and Figure 3.23 illustrate the top inbound rail intermodal trading partners for Salt Lake County. In 2015, almost 19 percent (by tonnage) of inbound commodities by multiple modes and mail were received from California. This is important because it demonstrates the region’s connectivity to the port markets that represent potential partners of an inland port. The Remainder of Nebraska is Salt Lake’s second top inbound trading partner via multiple modes and mail (incl. rail intermodal) with 17 percent share of trade. They are followed by Wyoming with 8 percent of commodities by tonnage.
0 5 10 15 20 25 30 35 40 45 50
Remainder of Utah
Wyoming
California
Colorado
Idaho
Texas
Montana
Washington
Nevada
North Dakota
Other
Million Tons
2015 2045
Utah Inland Port - Feasibility Analysis
2-44 Cambridge Systematics, Inc.
By 2045, California is estimated to remain the top inbound trading partner via multiple modes and mail for the Salt Lake region with a 33 percent share of total traffic. This is a significant increase over the 2015 value. California is followed by Remainder of Nebraska and Maryland with 14 and 8 percent of commodities by tonnage, respectively. The compound annual growth rate shows that California and Maryland will have a rapid increase in inbound tonnage to Salt Lake County over the next 30 years. Salt Lake County has direct access via rail and highway to California, which will help the inland port thrive given that California is expected to grow aggressively.
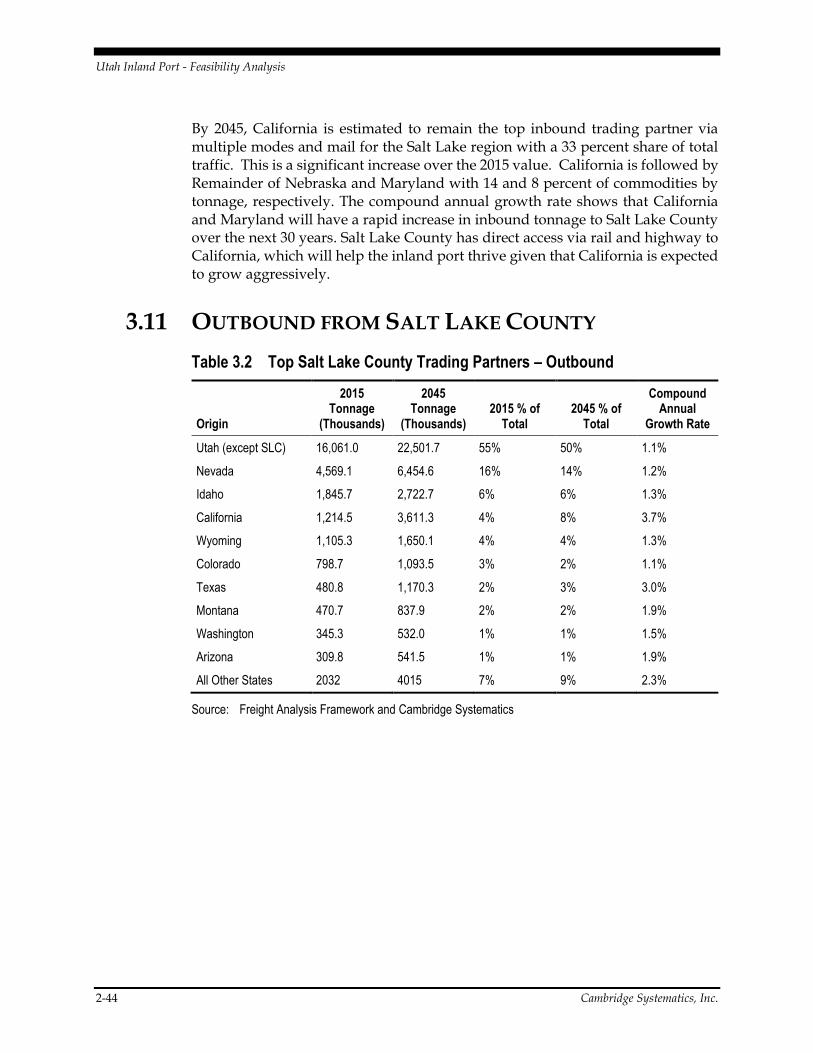
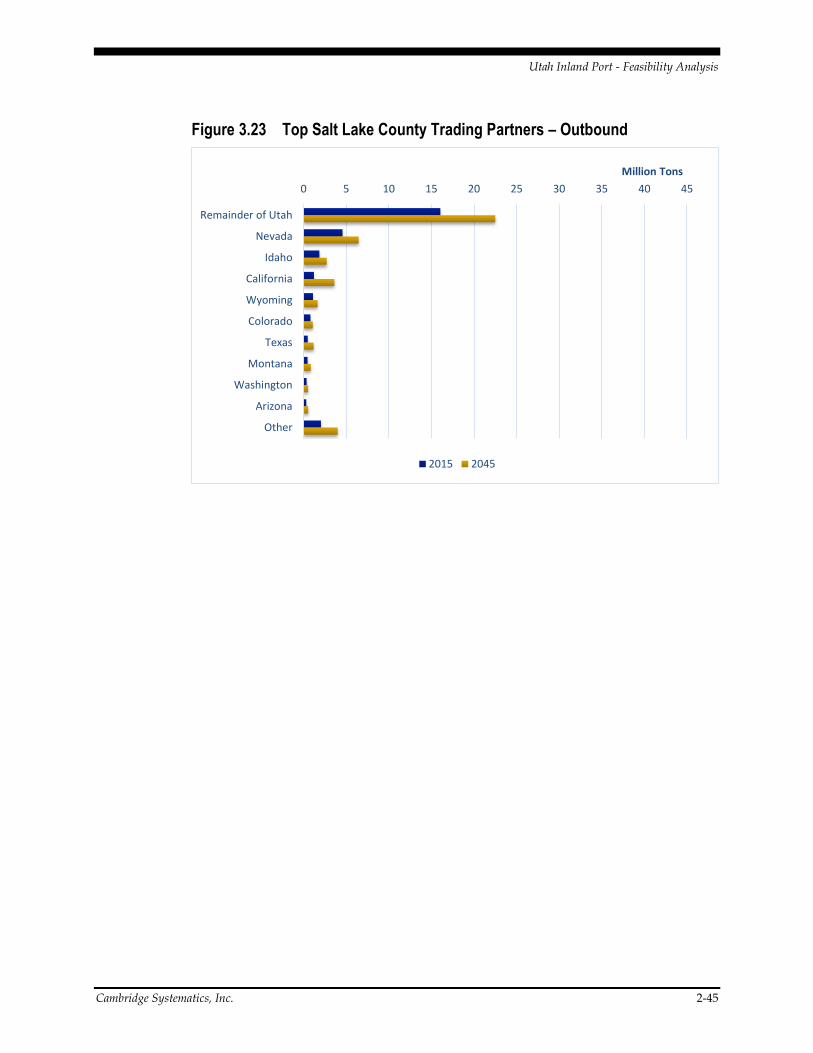
3.11 OUTBOUND FROM SALT LAKE COUNTY
Table 3.2 Top Salt Lake County Trading Partners – Outbound
Origin
2015 Tonnage
(Thousands)
2045 Tonnage
(Thousands) 2015 % of
Total 2045 % of
Total
Compound Annual
Growth Rate
Utah (except SLC) 16,061.0 22,501.7 55% 50% 1.1%
Nevada 4,569.1 6,454.6 16% 14% 1.2%
Idaho 1,845.7 2,722.7 6% 6% 1.3%
California 1,214.5 3,611.3 4% 8% 3.7%
Wyoming 1,105.3 1,650.1 4% 4% 1.3%
Colorado 798.7 1,093.5 3% 2% 1.1%
Texas 480.8 1,170.3 2% 3% 3.0%
Montana 470.7 837.9 2% 2% 1.9%
Washington 345.3 532.0 1% 1% 1.5%
Arizona 309.8 541.5 1% 1% 1.9%
All Other States 2032 4015 7% 9% 2.3%
Source: Freight Analysis Framework and Cambridge Systematics
Utah Inland Port - Feasibility Analysis
Cambridge Systematics, Inc. 2-45
Figure 3.23 Top Salt Lake County Trading Partners – Outbound
0 5 10 15 20 25 30 35 40 45
Remainder of Utah
Nevada
Idaho
California
Wyoming
Colorado
Texas
Montana
Washington
Arizona
Other
Million Tons
2015 2045
Utah Inland Port - Feasibility Analysis
4-46 Cambridge Systematics, Inc.
4.0 Competitiveness
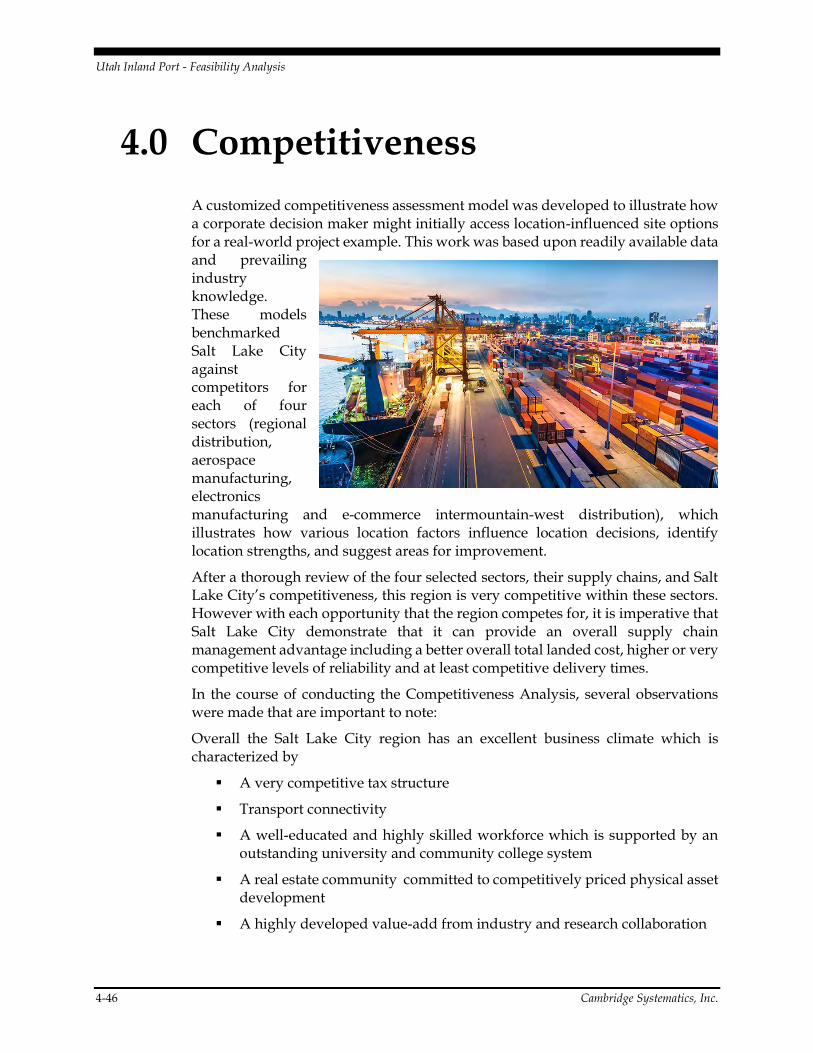
A customized competitiveness assessment model was developed to illustrate how a corporate decision maker might initially access location-influenced site options for a real-world project example. This work was based upon readily available data and prevailing industry knowledge. These models benchmarked Salt Lake City against competitors for each of four sectors (regional distribution, aerospace manufacturing, electronics manufacturing and e-commerce intermountain-west distribution), which illustrates how various location factors influence location decisions, identify location strengths, and suggest areas for improvement.
After a thorough review of the four selected sectors, their supply chains, and Salt Lake City’s competitiveness, this region is very competitive within these sectors. However with each opportunity that the region competes for, it is imperative that Salt Lake City demonstrate that it can provide an overall supply chain management advantage including a better overall total landed cost, higher or very competitive levels of reliability and at least competitive delivery times.
In the course of conducting the Competitiveness Analysis, several observations were made that are important to note:
Overall the Salt Lake City region has an excellent business climate which is characterized by
A very competitive tax structure
Transport connectivity
A well-educated and highly skilled workforce which is supported by an outstanding university and community college system
A real estate community committed to competitively priced physical asset development
A highly developed value-add from industry and research collaboration
Utah Inland Port - Feasibility Analysis
Cambridge Systematics, Inc. 4-47
Salt Lake International Airport is an underutilized asset that is a competitive advantage in attracting manufacturers that rely on air to move their high value manufactured products
Regional distribution can thrive based on Salt Lake’s transport connectivity, but when Coastal California markets are part of a business model, Salt Lake City loses its cost and time competitive advantages
Utah Inland Port - Feasibility Analysis
4-48 Cambridge Systematics, Inc.
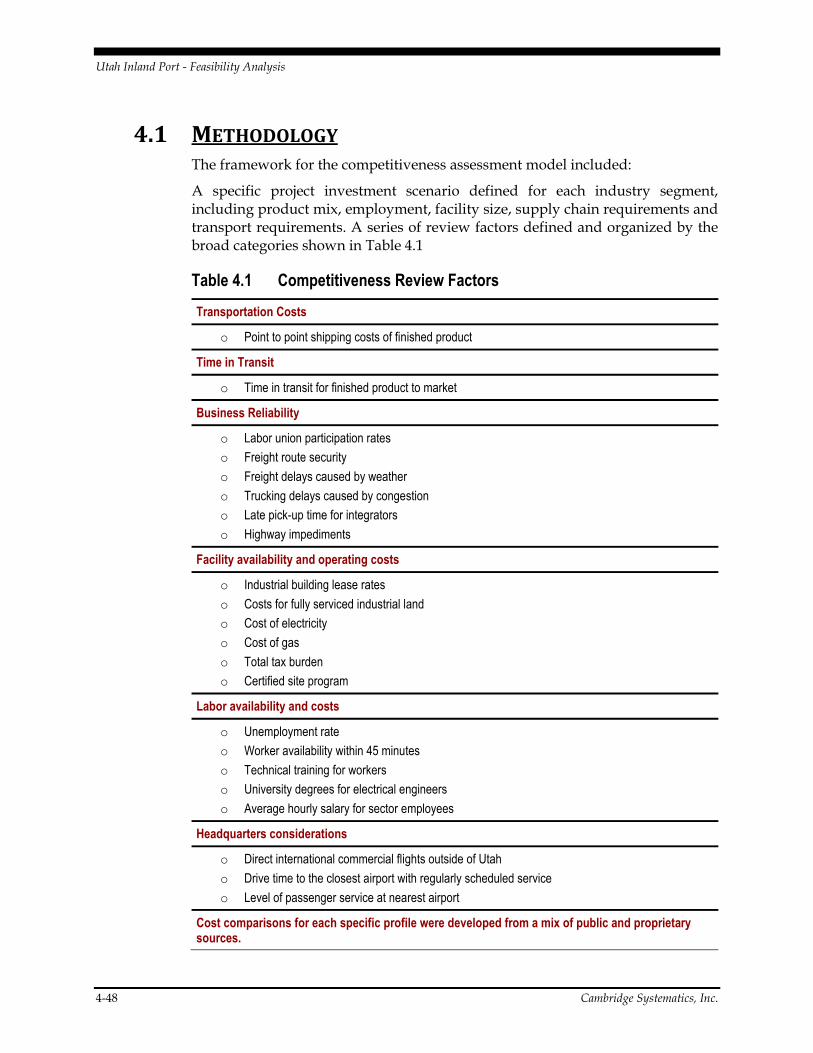
4.1 METHODOLOGY The framework for the competitiveness assessment model included:
A specific project investment scenario defined for each industry segment, including product mix, employment, facility size, supply chain requirements and transport requirements. A series of review factors defined and organized by the broad categories shown in Table 4.1
Table 4.1 Competitiveness Review Factors
Transportation Costs
o Point to point shipping costs of finished product
Time in Transit
o Time in transit for finished product to market
Business Reliability
o Labor union participation rates
o Freight route security
o Freight delays caused by weather
o Trucking delays caused by congestion
o Late pick-up time for integrators
o Highway impediments
Facility availability and operating costs
o Industrial building lease rates
o Costs for fully serviced industrial land
o Cost of electricity
o Cost of gas
o Total tax burden
o Certified site program
Labor availability and costs
o Unemployment rate
o Worker availability within 45 minutes
o Technical training for workers
o University degrees for electrical engineers
o Average hourly salary for sector employees
Headquarters considerations
o Direct international commercial flights outside of Utah
o Drive time to the closest airport with regularly scheduled service
o Level of passenger service at nearest airport
Cost comparisons for each specific profile were developed from a mix of public and proprietary sources.
Utah Inland Port - Feasibility Analysis
Cambridge Systematics, Inc. 4-49
Cost comparisons for each specific profile were developed from a mix of public and proprietary sources.
Qualitative criteria was selected by the GLDPartners team based on interviews, research & past deal and sector experience.
Relative weights were developed among the main categories and for each criterion within a category as a proportion of 100. Weights vary for each supply chain profile depending upon nature of the scenario.
For each profile, candidate locations were scored based on quantitative factors using a 1-10 scale (with 10 being the best score). A very competitive total score normally ranges between 6 and 7 and a difference of more than .05 is considered quite substantial
Source: GLDP Analysis
How to Interpret the Results Table
This is an objective numeric assessment of the key factors involved in a location decision process. There is little or no subjective input in evaluating the scoring results.
Decision-makers will undertake their review of the Overall Competitiveness Analysis by first evaluating the overall score.
Scores are based on a 0-10 scale, with 10 being the highest.
Scores that are within .10 of each other should be considered statistically equal
Scores that are within .25 of each other should be considered as close competitors
Scores that are more than .25 of each other should be considered meaningfully different
Even in the case of a high or competitive score, decision-makers will want to review areas of distinct weakness in an overall score as this can be a significant variable when making a final decision among close competitors
Scores are already weighted to indicate relative importance of factors as they relate to each other – so the Overall Competitiveness Score should be a meaningful indication of the best choices.
Utah Inland Port - Feasibility Analysis
4-50 Cambridge Systematics, Inc.
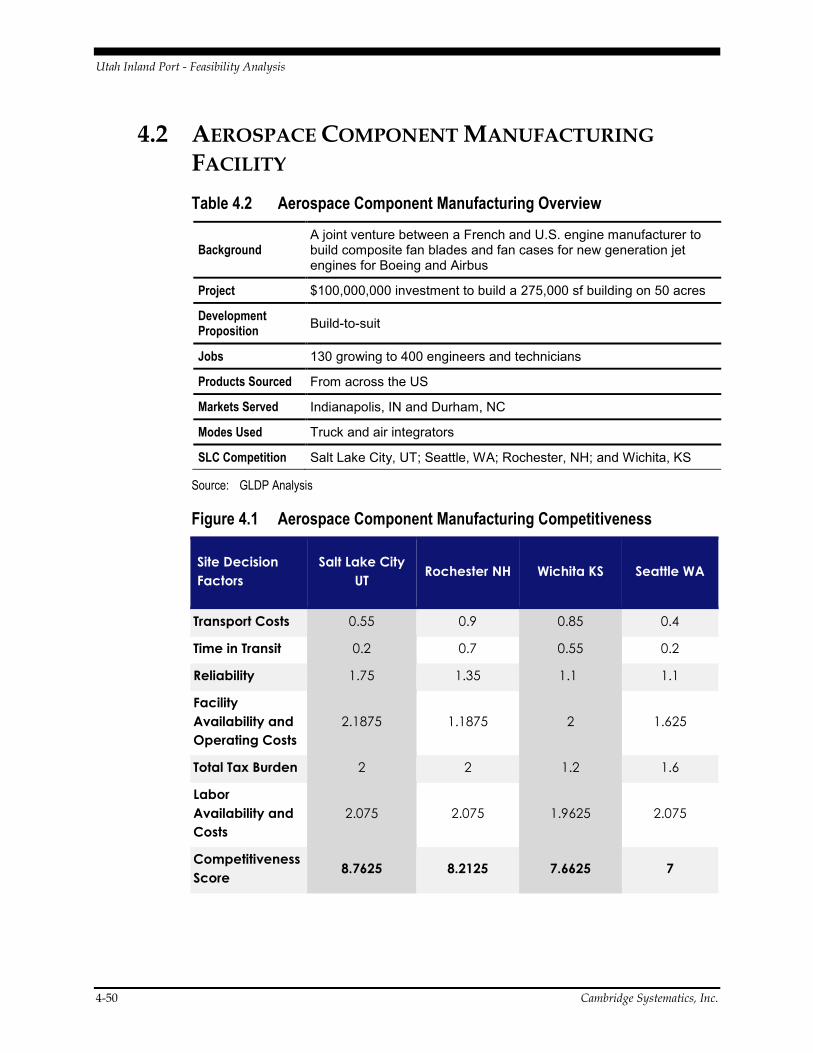
4.2 AEROSPACE COMPONENT MANUFACTURING
FACILITY
Table 4.2 Aerospace Component Manufacturing Overview
Background A joint venture between a French and U.S. engine manufacturer to build composite fan blades and fan cases for new generation jet engines for Boeing and Airbus
Project $100,000,000 investment to build a 275,000 sf building on 50 acres
Development Proposition
Build-to-suit
Jobs 130 growing to 400 engineers and technicians
Products Sourced From across the US
Markets Served Indianapolis, IN and Durham, NC
Modes Used Truck and air integrators
SLC Competition Salt Lake City, UT; Seattle, WA; Rochester, NH; and Wichita, KS
Source: GLDP Analysis
Figure 4.1 Aerospace Component Manufacturing Competitiveness
Site Decision
Factors
Salt Lake City
UT Rochester NH Wichita KS Seattle WA
Transport Costs 0.55 0.9 0.85 0.4
Time in Transit 0.2 0.7 0.55 0.2
Reliability 1.75 1.35 1.1 1.1
Facility
Availability and
Operating Costs
2.1875 1.1875 2 1.625
Total Tax Burden 2 2 1.2 1.6
Labor
Availability and
Costs
2.075 2.075 1.9625 2.075
Competitiveness
Score 8.7625 8.2125 7.6625 7
Utah Inland Port - Feasibility Analysis
Cambridge Systematics, Inc. 4-51
Results
This scenario points out very clearly that Salt Lake City offers a strong value proposition to a manufacturer of high value products when logistics costs are not the dominate factor. When the other costs of doing business dominate the site location process, the competitiveness of Salt Lake City shines. Salt Lake City’s experience with composite materials in both suppliers and workers was also a factor in this scenario as the competitors for this project have strong industrial roots in composite materials.
4.3 CORPORATE HEADQUARTERS AND
MANUFACTURING FACILITY
Table 4.3 Corporate Headquarters and Manufacturing Overview
Background
California privately held electrical engineering company that designs, develops and manufactures specialty custom air moving systems for the aerospace and defense industry. Interested in relocating their corporate headquarters and manufacturing operations out of California. They also have a manufacturing operation in the UK
Project 100,000sf modern office and manufacturing facility
Development Proposition
Build-to-suit
Jobs 90 jobs will be created over a five year period and will include engineers, machinists and senior executives with an average salary of $89,000
Products Sourced Various, throughout the United States
Markets Served Global
Modes Used Truck and air. Products will primarily be shipped by integrators
SLC Competition Las Vegas NV , Mobile AL, and Tucson, AZ
Source: GLDP Analysis
Utah Inland Port - Feasibility Analysis
4-52 Cambridge Systematics, Inc.
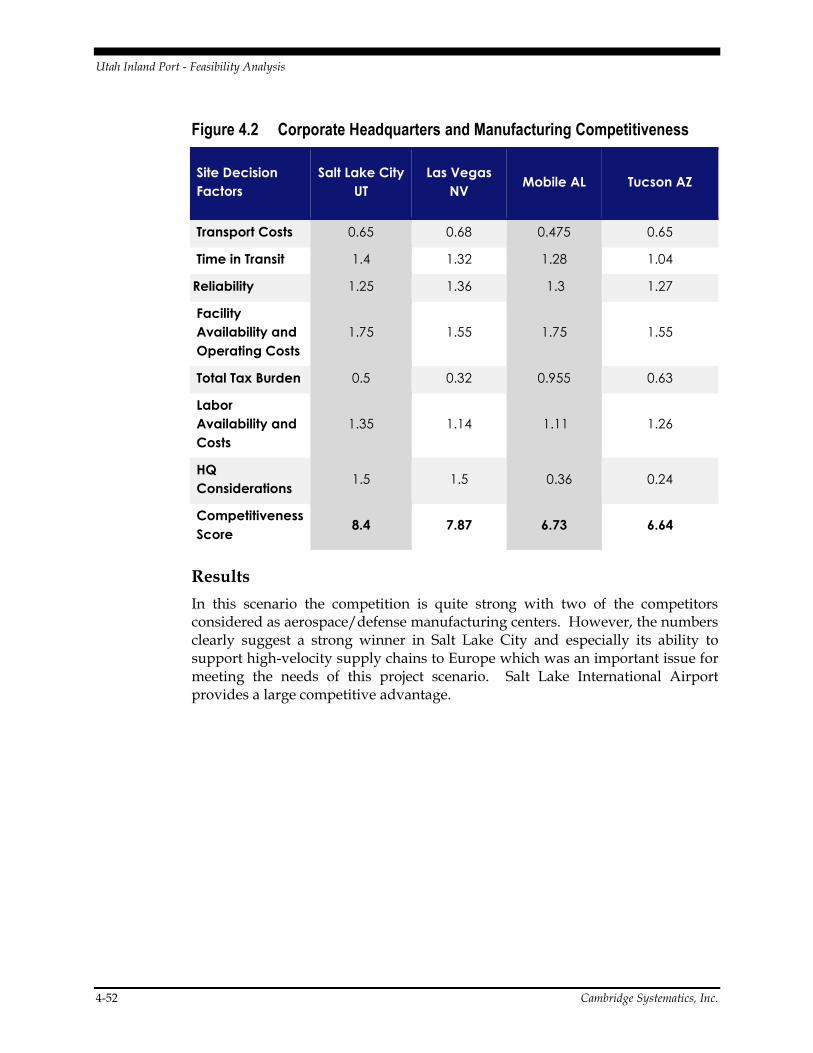
Figure 4.2 Corporate Headquarters and Manufacturing Competitiveness
Site Decision
Factors
Salt Lake City
UT
Las Vegas
NV Mobile AL Tucson AZ
Transport Costs 0.65 0.68 0.475 0.65
Time in Transit 1.4 1.32 1.28 1.04
Reliability 1.25 1.36 1.3 1.27
Facility
Availability and
Operating Costs
1.75 1.55 1.75 1.55
Total Tax Burden 0.5 0.32 0.955 0.63
Labor
Availability and
Costs
1.35 1.14 1.11 1.26
HQ
Considerations 1.5 1.5 0.36 0.24
Competitiveness
Score 8.4 7.87 6.73 6.64
Results
In this scenario the competition is quite strong with two of the competitors considered as aerospace/defense manufacturing centers. However, the numbers clearly suggest a strong winner in Salt Lake City and especially its ability to support high-velocity supply chains to Europe which was an important issue for meeting the needs of this project scenario. Salt Lake International Airport provides a large competitive advantage.
Utah Inland Port - Feasibility Analysis
Cambridge Systematics, Inc. 4-53
4.4 E-COMMERCE FACILITY FOR A NATIONAL
DEPARTMENT STORE CHAIN
Table 4.4 E-Commerce Facility Overview
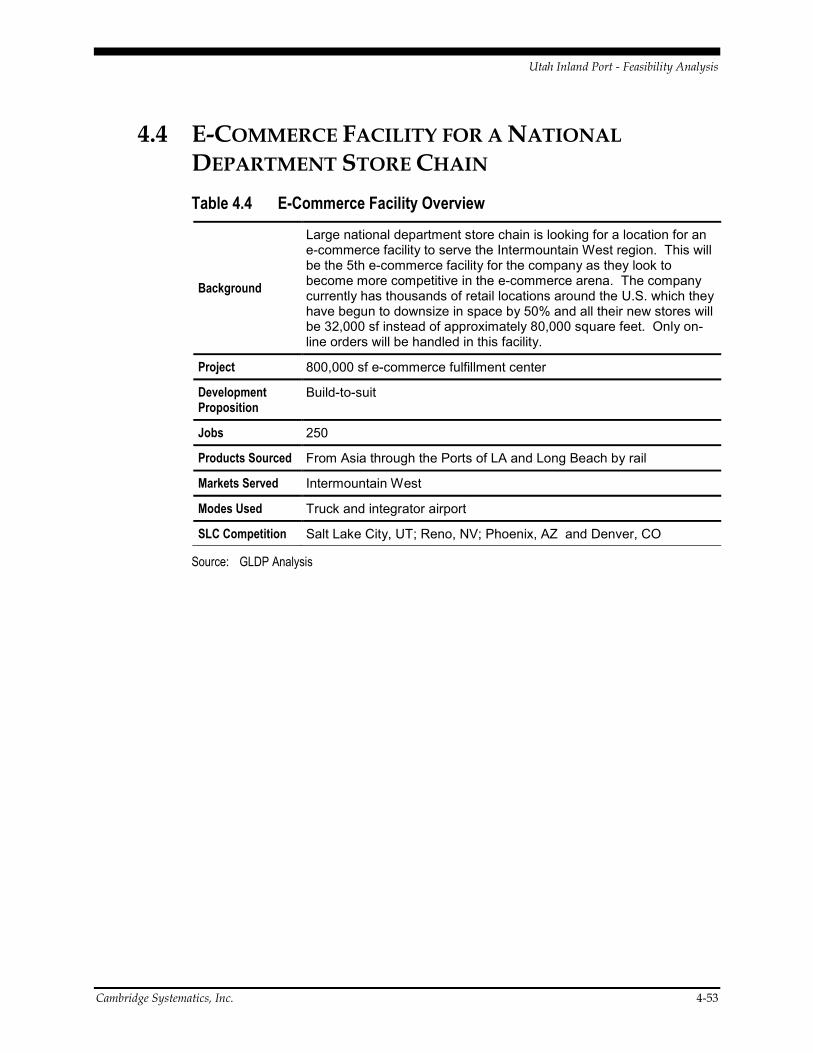
Background
Large national department store chain is looking for a location for an e-commerce facility to serve the Intermountain West region. This will be the 5th e-commerce facility for the company as they look to become more competitive in the e-commerce arena. The company currently has thousands of retail locations around the U.S. which they have begun to downsize in space by 50% and all their new stores will be 32,000 sf instead of approximately 80,000 square feet. Only on-line orders will be handled in this facility.
Project 800,000 sf e-commerce fulfillment center
Development Proposition
Build-to-suit
Jobs 250
Products Sourced From Asia through the Ports of LA and Long Beach by rail
Markets Served Intermountain West
Modes Used Truck and integrator airport
SLC Competition Salt Lake City, UT; Reno, NV; Phoenix, AZ and Denver, CO
Source: GLDP Analysis
Utah Inland Port - Feasibility Analysis
4-54 Cambridge Systematics, Inc.
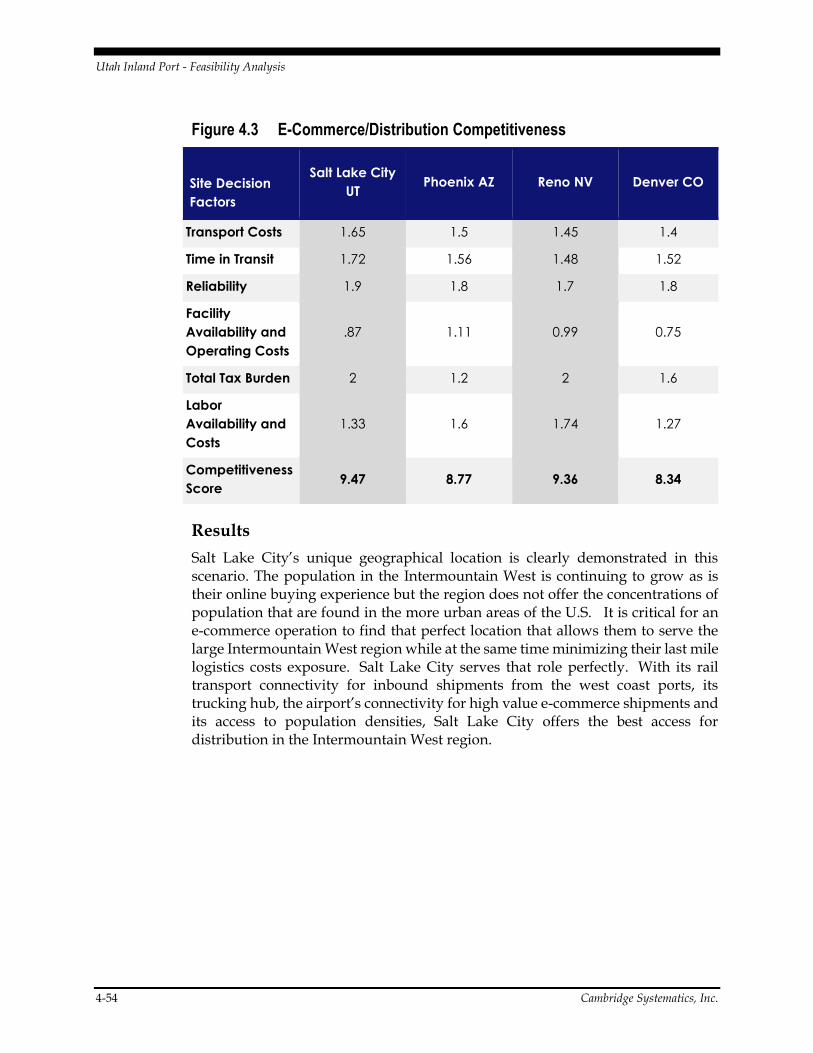
Figure 4.3 E-Commerce/Distribution Competitiveness
Site Decision
Factors
Salt Lake City
UT Phoenix AZ Reno NV Denver CO
Transport Costs 1.65 1.5 1.45 1.4
Time in Transit 1.72 1.56 1.48 1.52
Reliability 1.9 1.8 1.7 1.8
Facility
Availability and
Operating Costs
.87 1.11 0.99 0.75
Total Tax Burden 2 1.2 2 1.6
Labor
Availability and
Costs
1.33 1.6 1.74 1.27
Competitiveness
Score 9.47 8.77 9.36 8.34
Results
Salt Lake City’s unique geographical location is clearly demonstrated in this scenario. The population in the Intermountain West is continuing to grow as is their online buying experience but the region does not offer the concentrations of population that are found in the more urban areas of the U.S. It is critical for an e-commerce operation to find that perfect location that allows them to serve the large Intermountain West region while at the same time minimizing their last mile logistics costs exposure. Salt Lake City serves that role perfectly. With its rail transport connectivity for inbound shipments from the west coast ports, its trucking hub, the airport’s connectivity for high value e-commerce shipments and its access to population densities, Salt Lake City offers the best access for distribution in the Intermountain West region.
Utah Inland Port - Feasibility Analysis
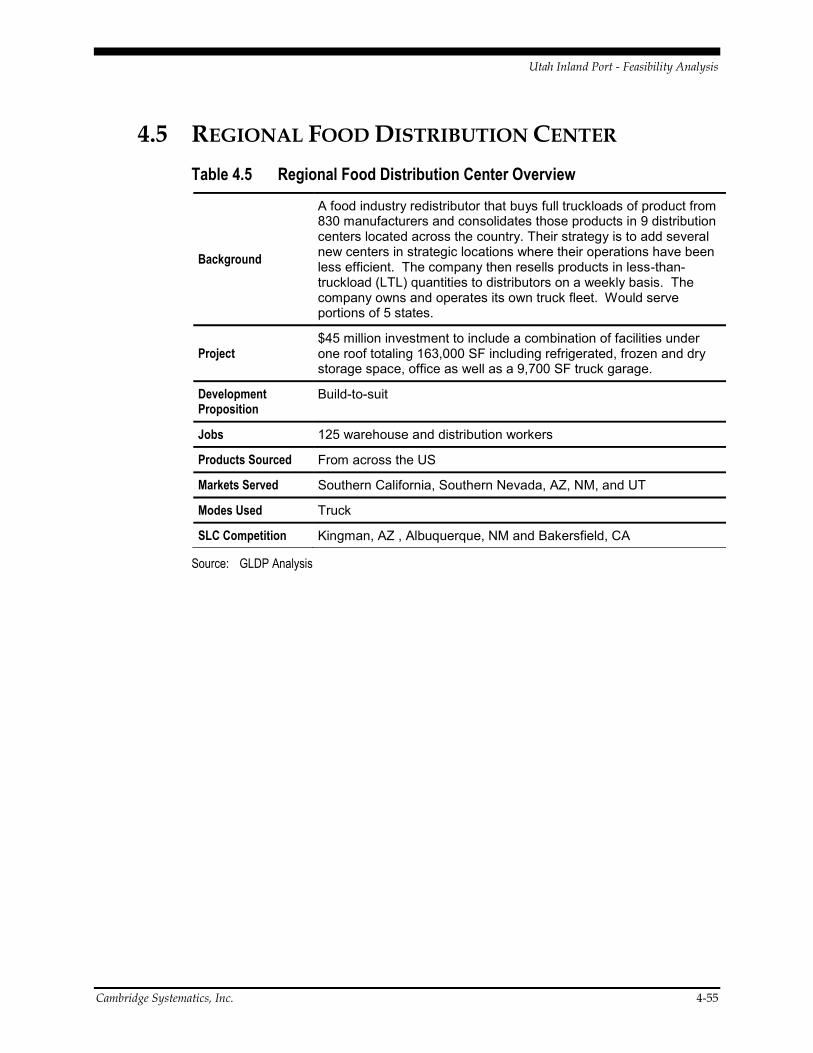
Cambridge Systematics, Inc. 4-55
4.5 REGIONAL FOOD DISTRIBUTION CENTER
Table 4.5 Regional Food Distribution Center Overview
Background
A food industry redistributor that buys full truckloads of product from 830 manufacturers and consolidates those products in 9 distribution centers located across the country. Their strategy is to add several new centers in strategic locations where their operations have been less efficient. The company then resells products in less-than-truckload (LTL) quantities to distributors on a weekly basis. The company owns and operates its own truck fleet. Would serve portions of 5 states.
Project $45 million investment to include a combination of facilities under one roof totaling 163,000 SF including refrigerated, frozen and dry storage space, office as well as a 9,700 SF truck garage.
Development Proposition
Build-to-suit
Jobs 125 warehouse and distribution workers
Products Sourced From across the US
Markets Served Southern California, Southern Nevada, AZ, NM, and UT
Modes Used Truck
SLC Competition Kingman, AZ , Albuquerque, NM and Bakersfield, CA
Source: GLDP Analysis
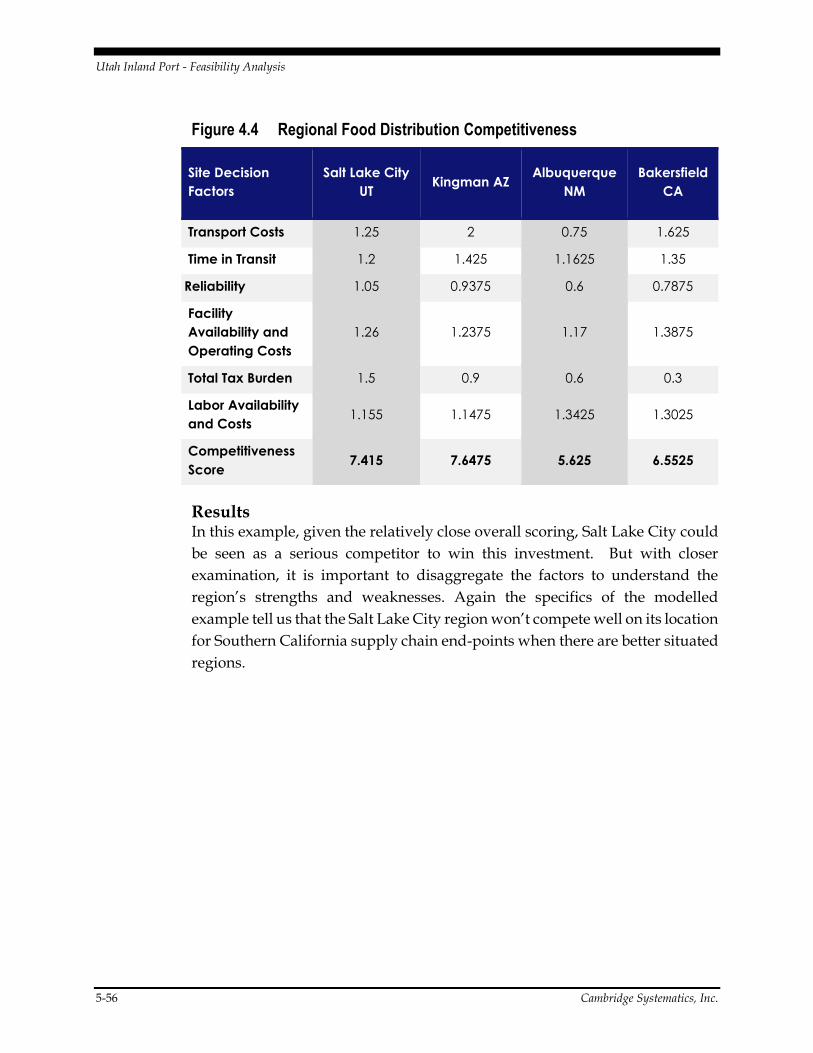
Utah Inland Port - Feasibility Analysis
5-56 Cambridge Systematics, Inc.
Figure 4.4 Regional Food Distribution Competitiveness
Site Decision
Factors
Salt Lake City
UT Kingman AZ
Albuquerque
NM
Bakersfield
CA
Transport Costs 1.25 2 0.75 1.625
Time in Transit 1.2 1.425 1.1625 1.35
Reliability 1.05 0.9375 0.6 0.7875
Facility
Availability and
Operating Costs
1.26 1.2375 1.17 1.3875
Total Tax Burden 1.5 0.9 0.6 0.3
Labor Availability
and Costs 1.155 1.1475 1.3425 1.3025
Competitiveness
Score 7.415 7.6475 5.625 6.5525
Results In this example, given the relatively close overall scoring, Salt Lake City could
be seen as a serious competitor to win this investment. But with closer
examination, it is important to disaggregate the factors to understand the
region’s strengths and weaknesses. Again the specifics of the modelled
example tell us that the Salt Lake City region won’t compete well on its location
for Southern California supply chain end-points when there are better situated
regions.
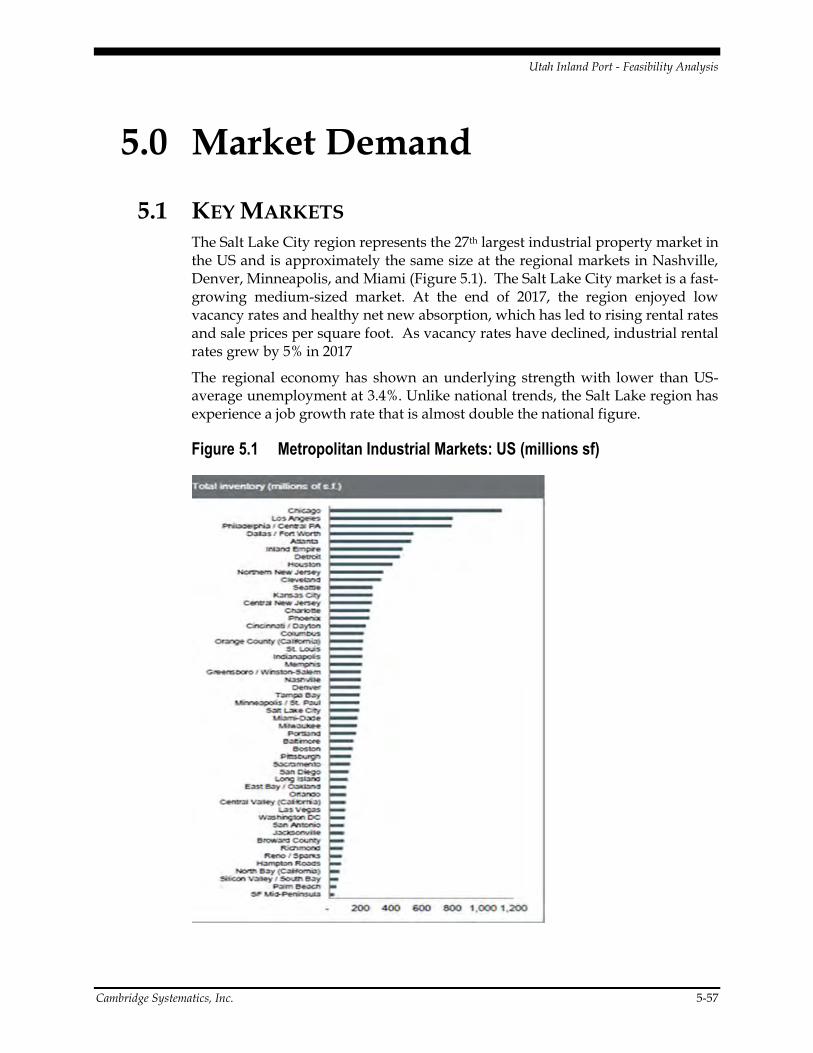
Utah Inland Port - Feasibility Analysis
Cambridge Systematics, Inc. 5-57
5.0 Market Demand
5.1 KEY MARKETS The Salt Lake City region represents the 27th largest industrial property market in the US and is approximately the same size at the regional markets in Nashville, Denver, Minneapolis, and Miami (Figure 5.1). The Salt Lake City market is a fast-growing medium-sized market. At the end of 2017, the region enjoyed low vacancy rates and healthy net new absorption, which has led to rising rental rates and sale prices per square foot. As vacancy rates have declined, industrial rental rates grew by 5% in 2017
The regional economy has shown an underlying strength with lower than US-average unemployment at 3.4%. Unlike national trends, the Salt Lake region has experience a job growth rate that is almost double the national figure.
Figure 5.1 Metropolitan Industrial Markets: US (millions sf)
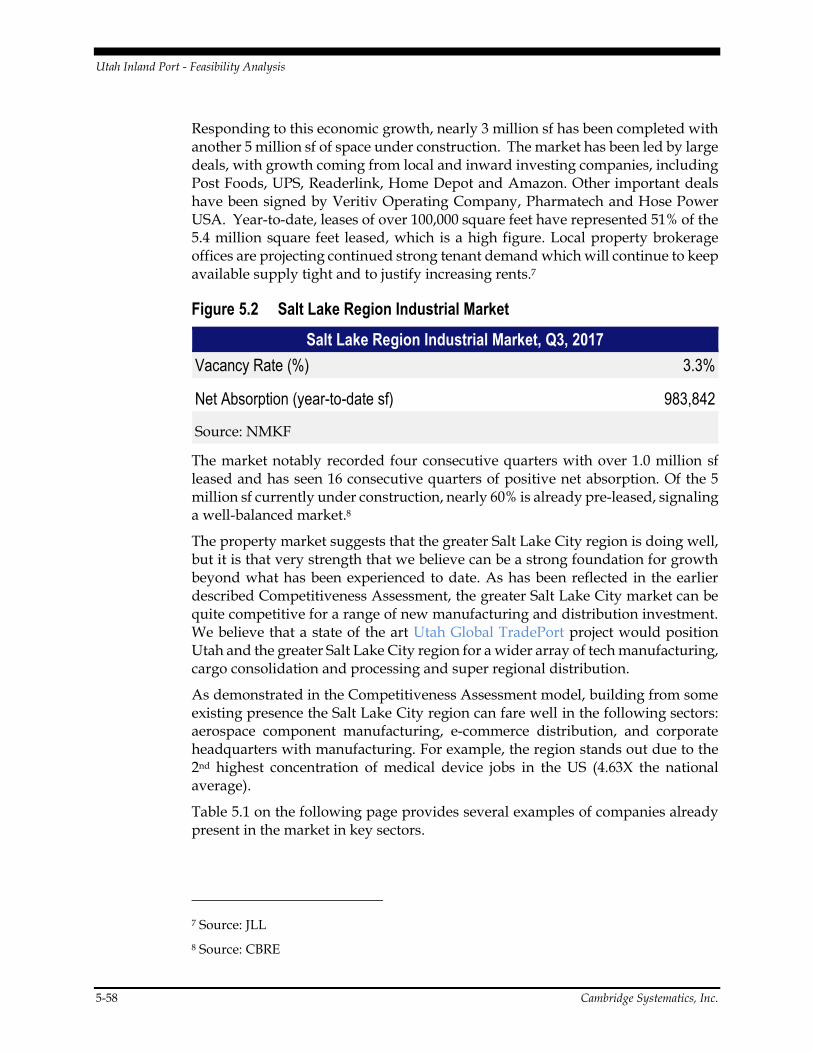
Utah Inland Port - Feasibility Analysis
5-58 Cambridge Systematics, Inc.
Responding to this economic growth, nearly 3 million sf has been completed with another 5 million sf of space under construction. The market has been led by large deals, with growth coming from local and inward investing companies, including Post Foods, UPS, Readerlink, Home Depot and Amazon. Other important deals have been signed by Veritiv Operating Company, Pharmatech and Hose Power USA. Year-to-date, leases of over 100,000 square feet have represented 51% of the 5.4 million square feet leased, which is a high figure. Local property brokerage offices are projecting continued strong tenant demand which will continue to keep available supply tight and to justify increasing rents.7
Figure 5.2 Salt Lake Region Industrial Market
Salt Lake Region Industrial Market, Q3, 2017
Vacancy Rate (%) 3.3%
Net Absorption (year-to-date sf) 983,842
Source: NMKF
The market notably recorded four consecutive quarters with over 1.0 million sf leased and has seen 16 consecutive quarters of positive net absorption. Of the 5 million sf currently under construction, nearly 60% is already pre-leased, signaling a well-balanced market.8
The property market suggests that the greater Salt Lake City region is doing well, but it is that very strength that we believe can be a strong foundation for growth beyond what has been experienced to date. As has been reflected in the earlier described Competitiveness Assessment, the greater Salt Lake City market can be quite competitive for a range of new manufacturing and distribution investment. We believe that a state of the art Utah Global TradePort project would position Utah and the greater Salt Lake City region for a wider array of tech manufacturing, cargo consolidation and processing and super regional distribution.
As demonstrated in the Competitiveness Assessment model, building from some existing presence the Salt Lake City region can fare well in the following sectors: aerospace component manufacturing, e-commerce distribution, and corporate headquarters with manufacturing. For example, the region stands out due to the 2nd highest concentration of medical device jobs in the US (4.63X the national average).
Table 5.1 on the following page provides several examples of companies already present in the market in key sectors.
7 Source: JLL
8 Source: CBRE
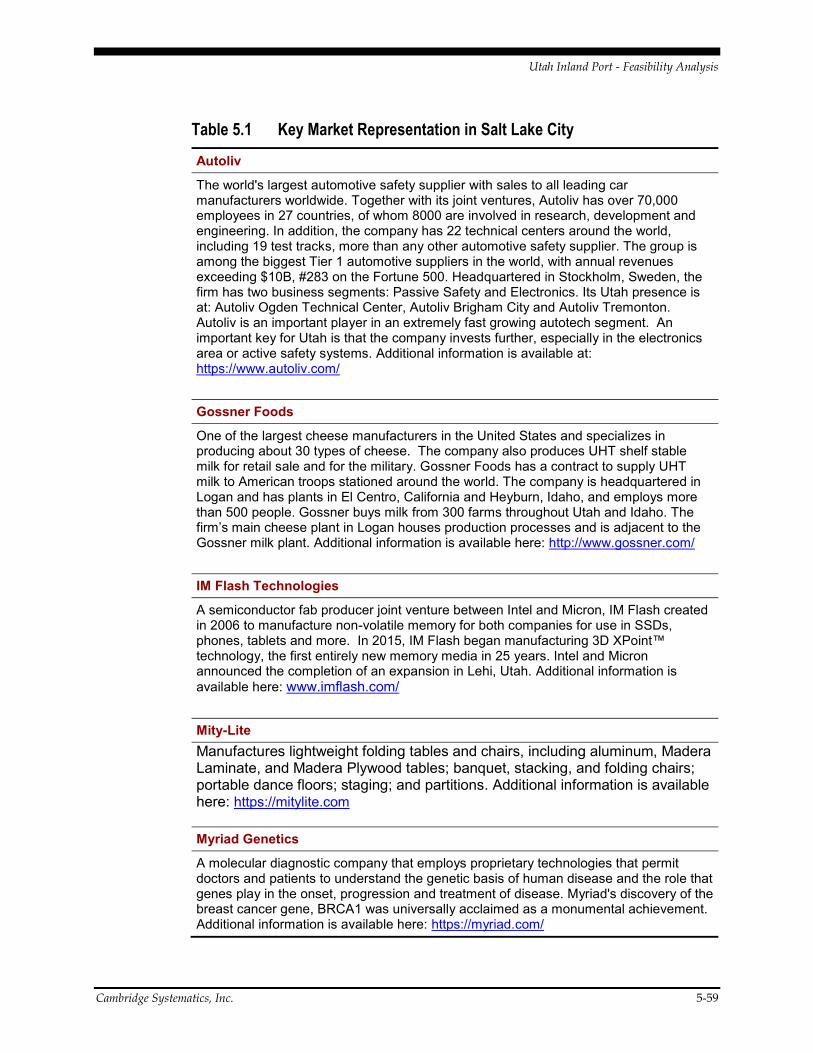
Utah Inland Port - Feasibility Analysis
Cambridge Systematics, Inc. 5-59
Table 5.1 Key Market Representation in Salt Lake City
Autoliv
The world's largest automotive safety supplier with sales to all leading car manufacturers worldwide. Together with its joint ventures, Autoliv has over 70,000 employees in 27 countries, of whom 8000 are involved in research, development and engineering. In addition, the company has 22 technical centers around the world, including 19 test tracks, more than any other automotive safety supplier. The group is among the biggest Tier 1 automotive suppliers in the world, with annual revenues exceeding $10B, #283 on the Fortune 500. Headquartered in Stockholm, Sweden, the firm has two business segments: Passive Safety and Electronics. Its Utah presence is at: Autoliv Ogden Technical Center, Autoliv Brigham City and Autoliv Tremonton. Autoliv is an important player in an extremely fast growing autotech segment. An important key for Utah is that the company invests further, especially in the electronics area or active safety systems. Additional information is available at: https://www.autoliv.com/
Gossner Foods
One of the largest cheese manufacturers in the United States and specializes in producing about 30 types of cheese. The company also produces UHT shelf stable milk for retail sale and for the military. Gossner Foods has a contract to supply UHT milk to American troops stationed around the world. The company is headquartered in Logan and has plants in El Centro, California and Heyburn, Idaho, and employs more than 500 people. Gossner buys milk from 300 farms throughout Utah and Idaho. The firm’s main cheese plant in Logan houses production processes and is adjacent to the Gossner milk plant. Additional information is available here: http://www.gossner.com/
IM Flash Technologies
A semiconductor fab producer joint venture between Intel and Micron, IM Flash created in 2006 to manufacture non-volatile memory for both companies for use in SSDs, phones, tablets and more. In 2015, IM Flash began manufacturing 3D XPoint™ technology, the first entirely new memory media in 25 years. Intel and Micron announced the completion of an expansion in Lehi, Utah. Additional information is available here: www.imflash.com/
Mity-Lite Manufactures lightweight folding tables and chairs, including aluminum, Madera Laminate, and Madera Plywood tables; banquet, stacking, and folding chairs; portable dance floors; staging; and partitions. Additional information is available here: https://mitylite.com Myriad Genetics
A molecular diagnostic company that employs proprietary technologies that permit doctors and patients to understand the genetic basis of human disease and the role that genes play in the onset, progression and treatment of disease. Myriad's discovery of the breast cancer gene, BRCA1 was universally acclaimed as a monumental achievement. Additional information is available here: https://myriad.com/
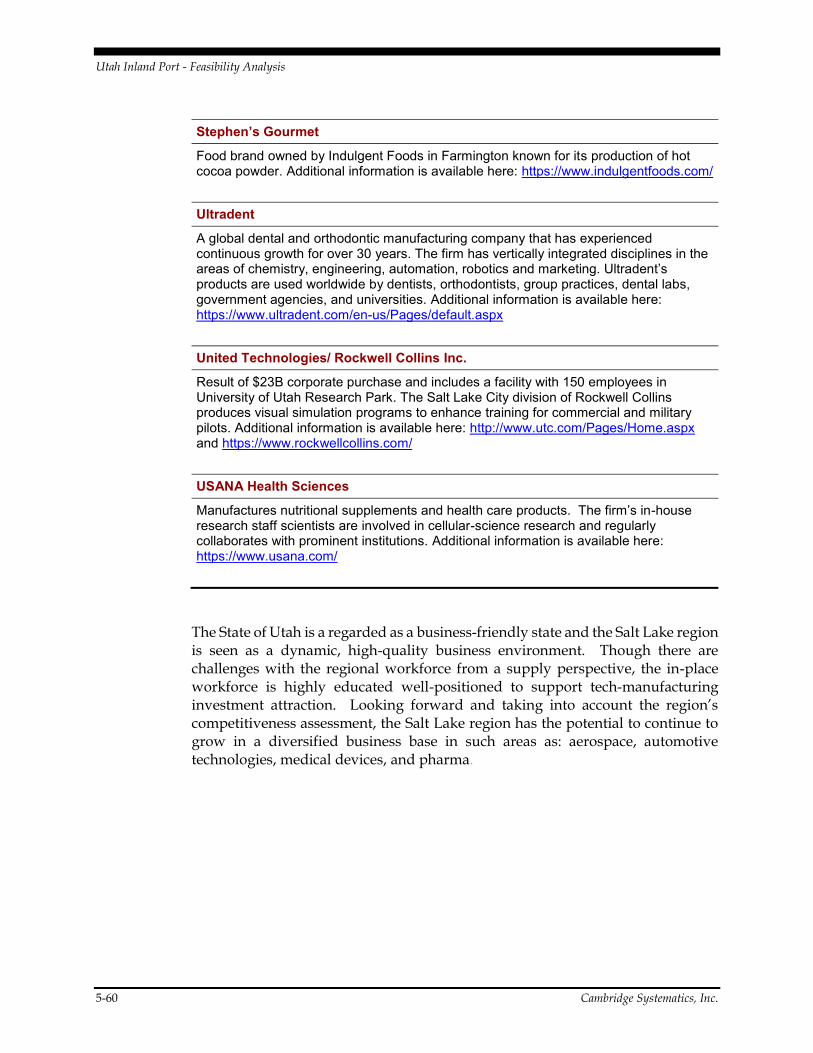
Utah Inland Port - Feasibility Analysis
5-60 Cambridge Systematics, Inc.
Stephen’s Gourmet
Food brand owned by Indulgent Foods in Farmington known for its production of hot cocoa powder. Additional information is available here: https://www.indulgentfoods.com/
Ultradent
A global dental and orthodontic manufacturing company that has experienced continuous growth for over 30 years. The firm has vertically integrated disciplines in the areas of chemistry, engineering, automation, robotics and marketing. Ultradent’s products are used worldwide by dentists, orthodontists, group practices, dental labs, government agencies, and universities. Additional information is available here: https://www.ultradent.com/en-us/Pages/default.aspx
United Technologies/ Rockwell Collins Inc.
Result of $23B corporate purchase and includes a facility with 150 employees in University of Utah Research Park. The Salt Lake City division of Rockwell Collins produces visual simulation programs to enhance training for commercial and military pilots. Additional information is available here: http://www.utc.com/Pages/Home.aspx and https://www.rockwellcollins.com/
USANA Health Sciences
Manufactures nutritional supplements and health care products. The firm’s in-house research staff scientists are involved in cellular-science research and regularly collaborates with prominent institutions. Additional information is available here: https://www.usana.com/
The State of Utah is a regarded as a business-friendly state and the Salt Lake region is seen as a dynamic, high-quality business environment. Though there are challenges with the regional workforce from a supply perspective, the in-place workforce is highly educated well-positioned to support tech-manufacturing investment attraction. Looking forward and taking into account the region’s competitiveness assessment, the Salt Lake region has the potential to continue to grow in a diversified business base in such areas as: aerospace, automotive technologies, medical devices, and pharma.
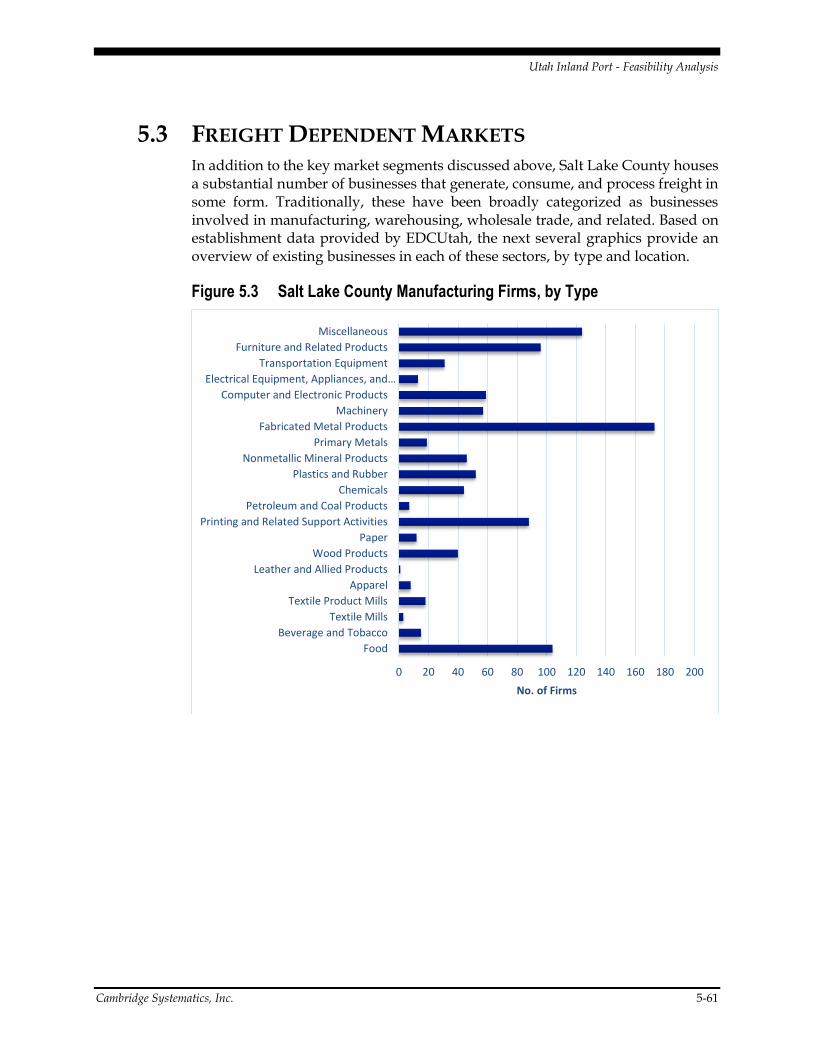
Utah Inland Port - Feasibility Analysis
Cambridge Systematics, Inc. 5-61
5.3 FREIGHT DEPENDENT MARKETS In addition to the key market segments discussed above, Salt Lake County houses a substantial number of businesses that generate, consume, and process freight in some form. Traditionally, these have been broadly categorized as businesses involved in manufacturing, warehousing, wholesale trade, and related. Based on establishment data provided by EDCUtah, the next several graphics provide an overview of existing businesses in each of these sectors, by type and location.
Figure 5.3 Salt Lake County Manufacturing Firms, by Type
0 20 40 60 80 100 120 140 160 180 200
Food
Beverage and Tobacco
Textile Mills
Textile Product Mills
Apparel
Leather and Allied Products
Wood Products
Paper
Printing and Related Support Activities
Petroleum and Coal Products
Chemicals
Plastics and Rubber
Nonmetallic Mineral Products
Primary Metals
Fabricated Metal Products
Machinery
Computer and Electronic Products
Electrical Equipment, Appliances, and…
Transportation Equipment
Furniture and Related Products
Miscellaneous
No. of Firms
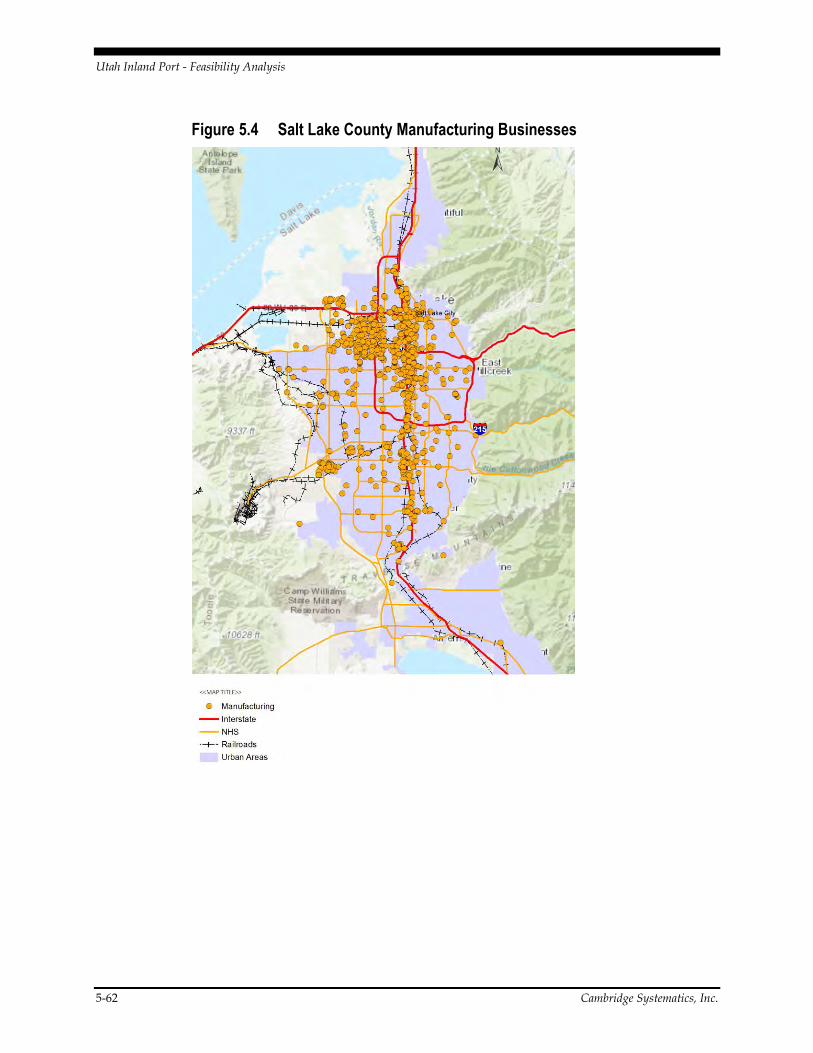
Utah Inland Port - Feasibility Analysis
5-62 Cambridge Systematics, Inc.
Figure 5.4 Salt Lake County Manufacturing Businesses
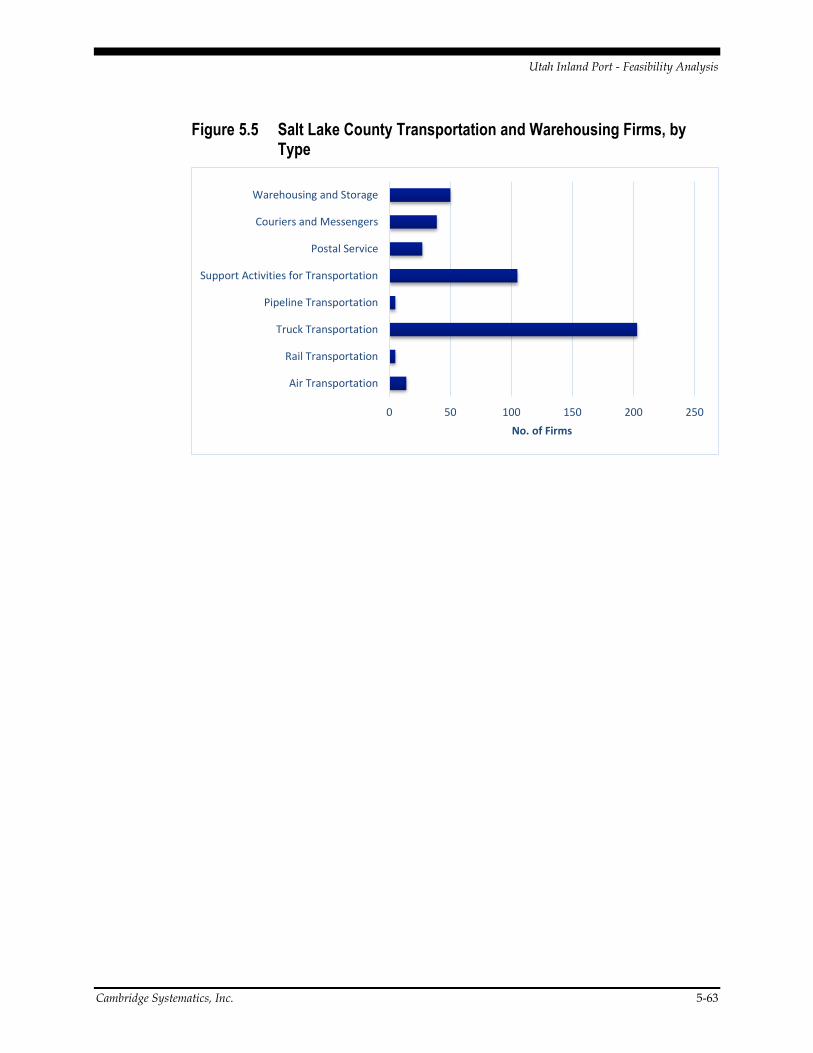
Utah Inland Port - Feasibility Analysis
Cambridge Systematics, Inc. 5-63
Figure 5.5 Salt Lake County Transportation and Warehousing Firms, by Type
0 50 100 150 200 250
Air Transportation
Rail Transportation
Truck Transportation
Pipeline Transportation
Support Activities for Transportation
Postal Service
Couriers and Messengers
Warehousing and Storage
No. of Firms
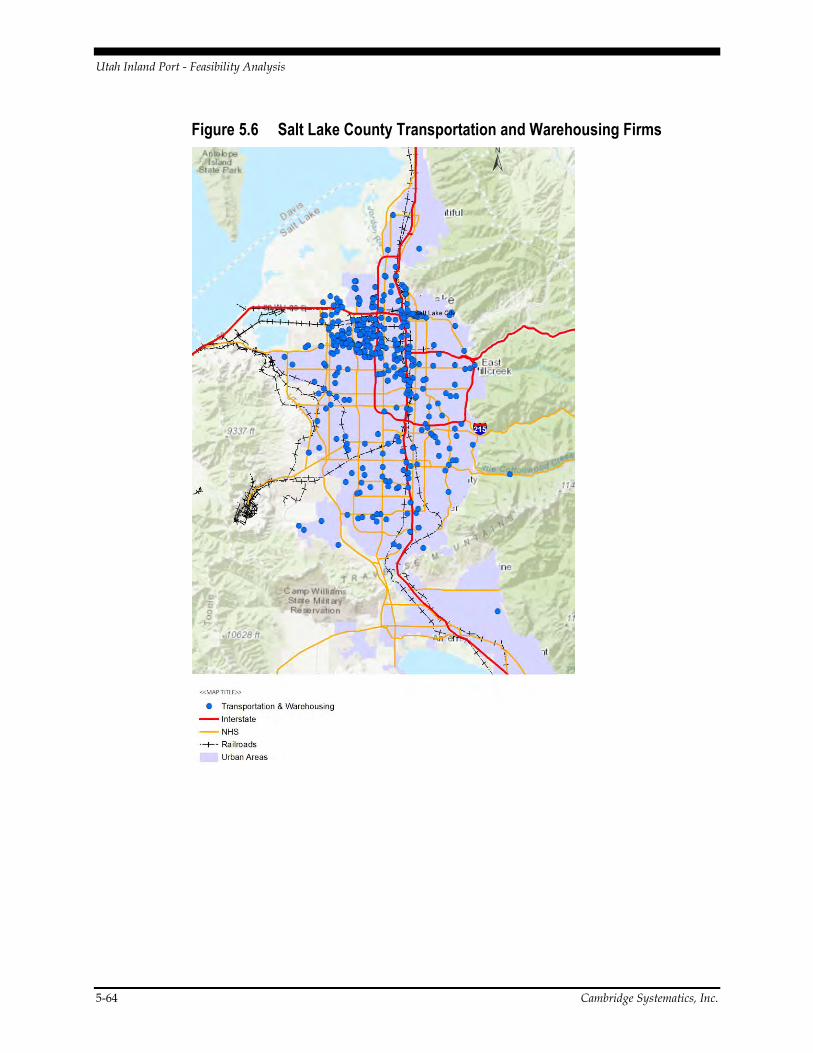
Utah Inland Port - Feasibility Analysis
5-64 Cambridge Systematics, Inc.
Figure 5.6 Salt Lake County Transportation and Warehousing Firms
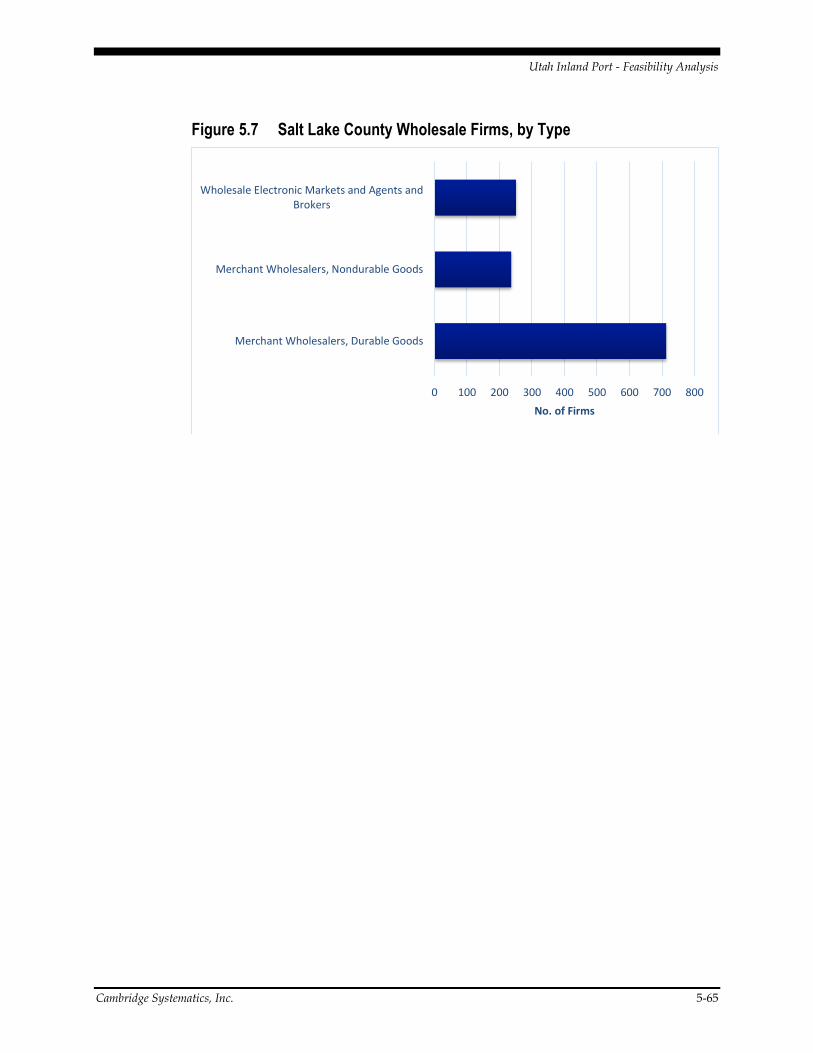
Utah Inland Port - Feasibility Analysis
Cambridge Systematics, Inc. 5-65
Figure 5.7 Salt Lake County Wholesale Firms, by Type
0 100 200 300 400 500 600 700 800
Merchant Wholesalers, Durable Goods
Merchant Wholesalers, Nondurable Goods
Wholesale Electronic Markets and Agents andBrokers
No. of Firms
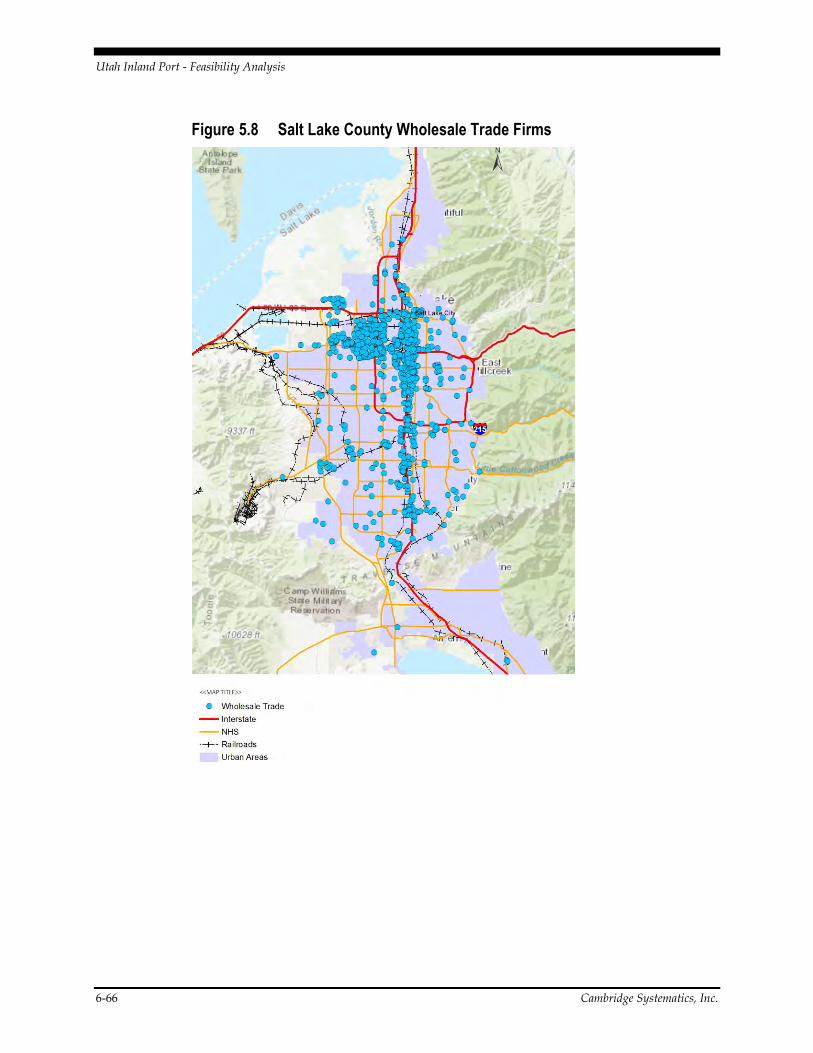
Utah Inland Port - Feasibility Analysis
6-66 Cambridge Systematics, Inc.
Figure 5.8 Salt Lake County Wholesale Trade Firms
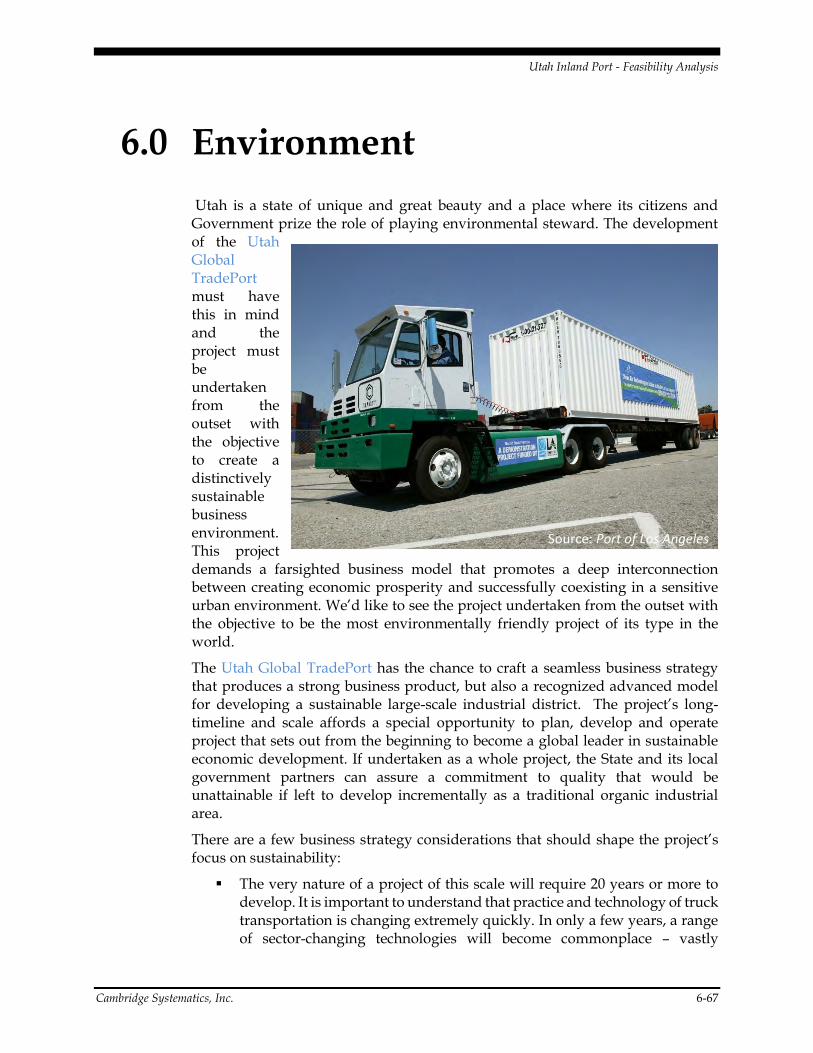
Utah Inland Port - Feasibility Analysis
Cambridge Systematics, Inc. 6-67
6.0 Environment
Utah is a state of unique and great beauty and a place where its citizens and Government prize the role of playing environmental steward. The development of the Utah Global TradePort must have this in mind and the project must be undertaken from the outset with the objective to create a distinctively sustainable business environment. This project demands a farsighted business model that promotes a deep interconnection between creating economic prosperity and successfully coexisting in a sensitive urban environment. We’d like to see the project undertaken from the outset with the objective to be the most environmentally friendly project of its type in the world.
The Utah Global TradePort has the chance to craft a seamless business strategy that produces a strong business product, but also a recognized advanced model for developing a sustainable large-scale industrial district. The project’s long-timeline and scale affords a special opportunity to plan, develop and operate project that sets out from the beginning to become a global leader in sustainable economic development. If undertaken as a whole project, the State and its local government partners can assure a commitment to quality that would be unattainable if left to develop incrementally as a traditional organic industrial area.
There are a few business strategy considerations that should shape the project’s focus on sustainability:
The very nature of a project of this scale will require 20 years or more to develop. It is important to understand that practice and technology of truck transportation is changing extremely quickly. In only a few years, a range of sector-changing technologies will become commonplace – vastly
Source: Port of Los Angeles
Utah Inland Port - Feasibility Analysis
6-68 Cambridge Systematics, Inc.
reducing mobile source pollutants. With new technologies that will allow for truck autonomy, truck platooning and alternate propulsion systems, there is little doubt that the negative environmental impacts will be vastly reduced over the development period of the project. Though a vastly larger scale, the experience at the Port of Los Angeles over the past ten years demonstrates how significant the powerful combination of management will and technological evolution can be, as the Port has reduced emissions by huge amounts
By its business strategy, the Utah Global TradePort will establish a focus that emphasizes to the greatest degree the efficiencies associated with rail transportation. Cargo via rail has a far lighter impact on the environment, as even a single-stack freight train would replace over 110 trucks.
The project should be master planned in a manner that supports logical and efficient internal and external truck circulation. Development and infrastructure phasing should promote adjacencies to other development, to the highway, airport and the rail intermodal facility.
If the project is focused on outbound manufacturing, the ship-out element of the project will be via air (mostly on existing aircraft movements), truck or rail.
The project is likely to accommodate some regional distribution development, but those projects would occur somewhere in the region in any case. To the extent that they are developed in a managed master plan development, there is some influence to manage impacts (design, truck technology, etc.
The project may have some distribution development that is focused on a super-region, say within 300-500 miles from the Salt Lake City region. These activities may be truck or rail served with most of the transit outside of the Salt Lake City region. Again, being within a managed master planned environment will allow a higher degree of management of these issues.
The Utah Global TradePort can set-out to learn from the best examples of sustainable development and adapt a custom best practice model for Salt Lake City and Utah. Reviewing some best practice examples from California and Europe helps to paint a broad picture of how a project of scale could define a meaningful plan for sustainability.
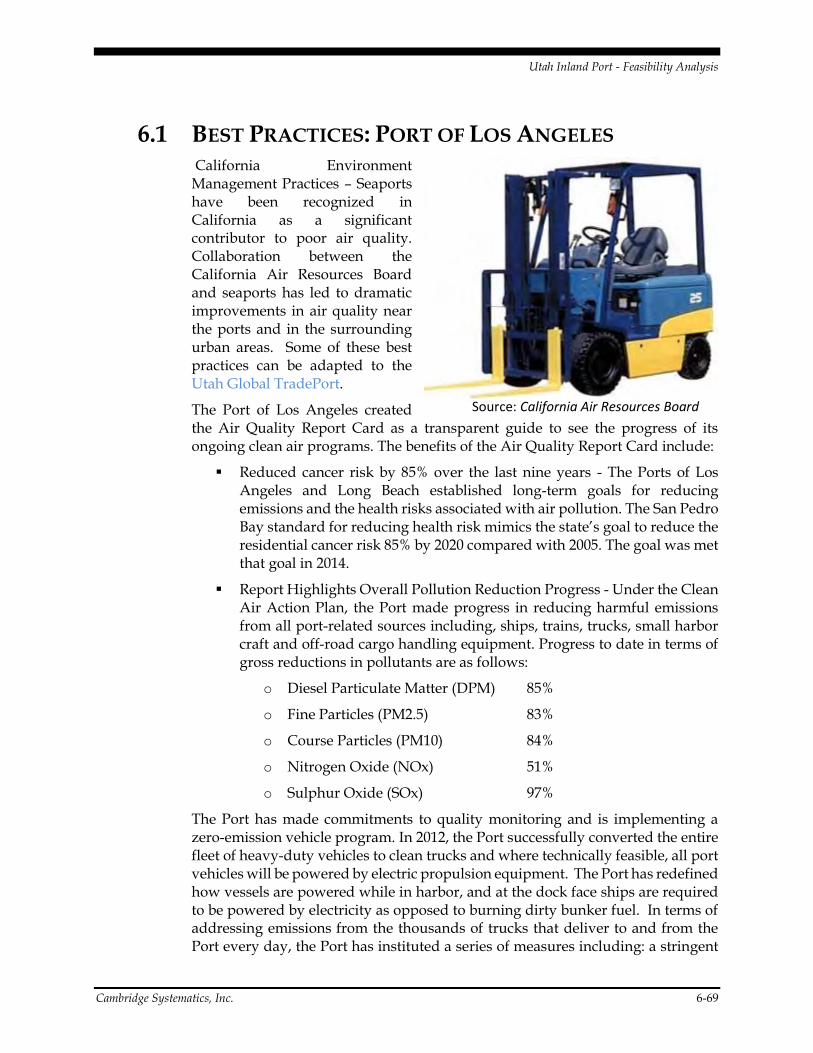
Utah Inland Port - Feasibility Analysis
Cambridge Systematics, Inc. 6-69
6.1 BEST PRACTICES: PORT OF LOS ANGELES California Environment Management Practices – Seaports have been recognized in California as a significant contributor to poor air quality. Collaboration between the California Air Resources Board and seaports has led to dramatic improvements in air quality near the ports and in the surrounding urban areas. Some of these best practices can be adapted to the Utah Global TradePort.
The Port of Los Angeles created the Air Quality Report Card as a transparent guide to see the progress of its ongoing clean air programs. The benefits of the Air Quality Report Card include:
Reduced cancer risk by 85% over the last nine years - The Ports of Los Angeles and Long Beach established long-term goals for reducing emissions and the health risks associated with air pollution. The San Pedro Bay standard for reducing health risk mimics the state’s goal to reduce the residential cancer risk 85% by 2020 compared with 2005. The goal was met that goal in 2014.
Report Highlights Overall Pollution Reduction Progress - Under the Clean Air Action Plan, the Port made progress in reducing harmful emissions from all port-related sources including, ships, trains, trucks, small harbor craft and off-road cargo handling equipment. Progress to date in terms of gross reductions in pollutants are as follows:
o Diesel Particulate Matter (DPM) 85%
o Fine Particles (PM2.5) 83%
o Course Particles (PM10) 84%
o Nitrogen Oxide (NOx) 51%
o Sulphur Oxide (SOx) 97%
The Port has made commitments to quality monitoring and is implementing a zero-emission vehicle program. In 2012, the Port successfully converted the entire fleet of heavy-duty vehicles to clean trucks and where technically feasible, all port vehicles will be powered by electric propulsion equipment. The Port has redefined how vessels are powered while in harbor, and at the dock face ships are required to be powered by electricity as opposed to burning dirty bunker fuel. In terms of addressing emissions from the thousands of trucks that deliver to and from the Port every day, the Port has instituted a series of measures including: a stringent
Source: California Air Resources Board
Utah Inland Port - Feasibility Analysis
6-70 Cambridge Systematics, Inc.
truck idling program and a requirement that all port-serving trucks have newer emission technology (post 2007). Additionally, the Port has undertaken a myriad of other measures to improve water quality and also make large investments in waterfront access and recreation.
6.2 BEST PRACTICES: WORLD LONDON GATEWAY London Gateway – DP World London Gateway is a combination of deep-sea port and logistics park, offering port-centric logistics and investment solutions with unrivalled facilities and tri-modal connectivity.
The London Gateway Port accommodates large vessels in a location that is close to one of the largest consumer markets in Western Europe. The Port provides excellent accessibility, with road connections to the North, South, East and West via an eight-lane highway, and the UK’s largest port rail terminal with hi-cube access to the country’s major rail hubs. The London Gateway Logistics Park can accommodate over 9M sf of development and is designed to be the best connected, most integrated and most environmentally aware logistics services space in the UK.
Excerpts from London Gateway’s sustainability strategy:
Creation of an Advisory Committee on Sustainability including nationally and internationally recognized experts
Defined a next-generation building guidelines, supported by PlanetMark certification of sustainability
DP World London Gateway - Stanford Wharf Nature Reserve - During the development of DP World London Gateway, some areas of intermodal mudflat had to be removed to create the port's berths. These areas were feeding grounds for many important bird species. DP World London Gateway developed a solution to be able to offer the wildlife an equally suitable alternative.
DP World Institute - Creating learning opportunities for busy employees spread across six continents, and speaking multiple languages, is quite a challenge. The DP World Institute, based out of DP World's head office in Dubai, was established to coordinate worldwide learning, using the best available methods, tools, expertise and resources. We work with leading international business schools, universities, professional bodies, consultants and in-house experts to design and deliver relevant, focused courses for individuals and organizations.
Go Green - DP World London Gateway partnered with a number of other international port operators to launch the Go Green campaign. 38 DP World terminals across 29 countries organized activities which suited the local communities in which they operate. Each activity focused on one of three themes: reuse and recycle, climate change and communities.
Utah Inland Port - Feasibility Analysis
Cambridge Systematics, Inc. 6-71
United for Wildlife - Committed to change - Illegal trade is one of the largest threats to the survival of some of the world's most iconic species. In particular, elephant ivory, rhino horn and big cats are traded across the world in large quantities. As a major port operator, we know there's a danger that criminals will attempt to ship illegal wildlife products via our terminals. To find out how we prevent this click here.
CDP-Reporting Carbon Emissions - As a responsible business, we’re committed to reducing greenhouse-gas emissions and improving our environmental performance. To do this right, we need to measure and monitor our progress, and report on this transparently. Since 2010, DP World has participated in CDP – the most respected initiative of its kind, which holds the most comprehensive set of global corporate environmental data.
Apprenticeship program - DP World London Gateway’s engineering apprenticeship scheme has been accredited by the Institution of Mechanical Engineers (IMechE).
For the Utah Global TradePort, it has the potential to develop from the ground up advanced model for environmental sustainability. A whole project approach allows for the project to be strategically designed to support economic growth while managing environmental impacts. As opposed to ad hoc industrial development, the Utah Global TradePort can drive a much higher standard of environmental stewardship. Some key elements that might be employed as the project were to create specific development and operational plans could include:
Crafting a business model and physical design that will minimize truck trips and delivery distances
Develop a port district sustainability strategy that would include limiting truck idling time, require zero-emission drayage equipment and new truck technology, manage point-source air emissions via an air quality management plan
Utah Inland Port - Feasibility Analysis
7-72 Cambridge Systematics, Inc.
7.0 Site Requirements
The Utah Global TradePort is a long-term multimodal project whose ultimate objective is to attract investment in logistics activity and export-oriented value-add manufacturing investment. The core elements of the project are:
1. Spine infrastructure - to and through the site, including road and rail infrastructure.
2. Cargo management infrastructure; including rail intermodal assets
3. Industrial Land
a. Local distribution
b. Super-regional distribution
c. Airport-oriented high-velocity logistics
d. Low intensity manufacturing
e. Medium intensity manufacturing
f. High intensity manufacturing
4. Interior Infrastructure
a. Roads
b. Rail lines
c. Utility easements
d. Environmental buffers
5. Ancillary Support Land
a. Retail
b. Restaurants
c. Hotels
Considering the potential for approximately 7,000 acres of industrial development in the NWQ, even if the project is extraordinarily successful, the market won’t be able to absorb this quantity of development land for decades. With a round assumption that the market and specifically this site could absorb 500,000 to 1,000,000 sf annually, the entire site would take around 40-45 years to complete. We suggest a practical timeline that doesn’t go past 20-25 years is a wise starting point, and assuming the 1,000,000 sf annually, this would require in the neighborhood of 3500-4000 acres of development land.
Within that overall footprint and reviewing the practical lands available for industrial development in the NWQ, we believe that a first phase of approximately 1250 acres would make sense for the following reasons:
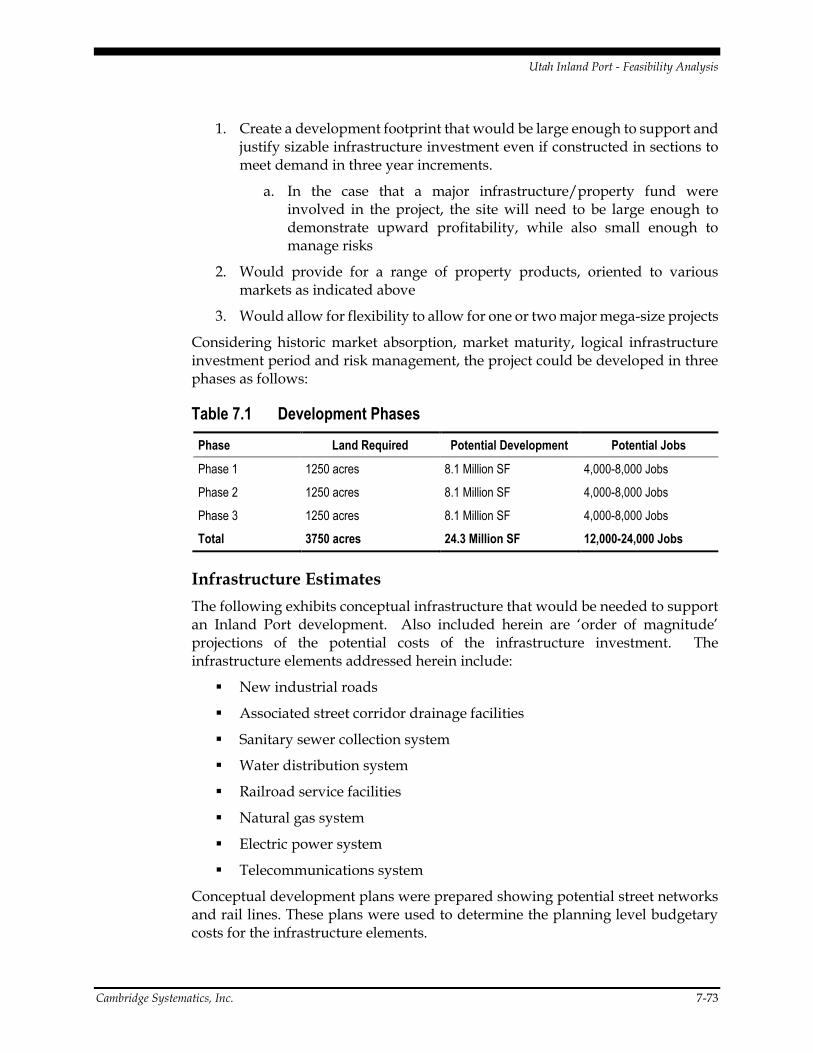
Utah Inland Port - Feasibility Analysis
Cambridge Systematics, Inc. 7-73
1. Create a development footprint that would be large enough to support and justify sizable infrastructure investment even if constructed in sections to meet demand in three year increments.
a. In the case that a major infrastructure/property fund were involved in the project, the site will need to be large enough to demonstrate upward profitability, while also small enough to manage risks
2. Would provide for a range of property products, oriented to various markets as indicated above
3. Would allow for flexibility to allow for one or two major mega-size projects
Considering historic market absorption, market maturity, logical infrastructure investment period and risk management, the project could be developed in three phases as follows:
Table 7.1 Development Phases
Phase Land Required Potential Development Potential Jobs
Phase 1 1250 acres 8.1 Million SF 4,000-8,000 Jobs
Phase 2 1250 acres 8.1 Million SF 4,000-8,000 Jobs
Phase 3 1250 acres 8.1 Million SF 4,000-8,000 Jobs
Total 3750 acres 24.3 Million SF 12,000-24,000 Jobs
Infrastructure Estimates
The following exhibits conceptual infrastructure that would be needed to support an Inland Port development. Also included herein are ‘order of magnitude’ projections of the potential costs of the infrastructure investment. The infrastructure elements addressed herein include:
New industrial roads
Associated street corridor drainage facilities
Sanitary sewer collection system
Water distribution system
Railroad service facilities
Natural gas system
Electric power system
Telecommunications system
Conceptual development plans were prepared showing potential street networks and rail lines. These plans were used to determine the planning level budgetary costs for the infrastructure elements.
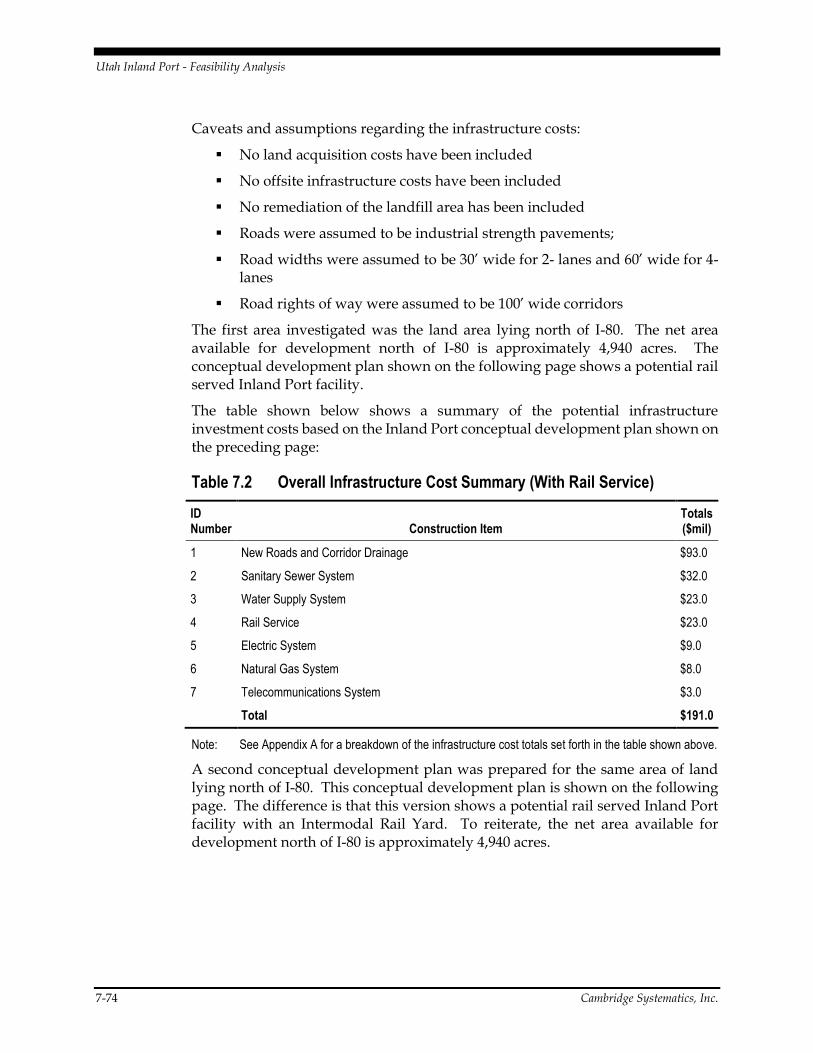
Utah Inland Port - Feasibility Analysis
7-74 Cambridge Systematics, Inc.
Caveats and assumptions regarding the infrastructure costs:
No land acquisition costs have been included
No offsite infrastructure costs have been included
No remediation of the landfill area has been included
Roads were assumed to be industrial strength pavements;
Road widths were assumed to be 30’ wide for 2- lanes and 60’ wide for 4-lanes
Road rights of way were assumed to be 100’ wide corridors
The first area investigated was the land area lying north of I-80. The net area available for development north of I-80 is approximately 4,940 acres. The conceptual development plan shown on the following page shows a potential rail served Inland Port facility.
The table shown below shows a summary of the potential infrastructure investment costs based on the Inland Port conceptual development plan shown on the preceding page:
Table 7.2 Overall Infrastructure Cost Summary (With Rail Service)
ID Number Construction Item
Totals ($mil)
1 New Roads and Corridor Drainage $93.0
2 Sanitary Sewer System $32.0
3 Water Supply System $23.0
4 Rail Service $23.0
5 Electric System $9.0
6 Natural Gas System $8.0
7 Telecommunications System $3.0
Total $191.0
Note: See Appendix A for a breakdown of the infrastructure cost totals set forth in the table shown above.
A second conceptual development plan was prepared for the same area of land lying north of I-80. This conceptual development plan is shown on the following page. The difference is that this version shows a potential rail served Inland Port facility with an Intermodal Rail Yard. To reiterate, the net area available for development north of I-80 is approximately 4,940 acres.
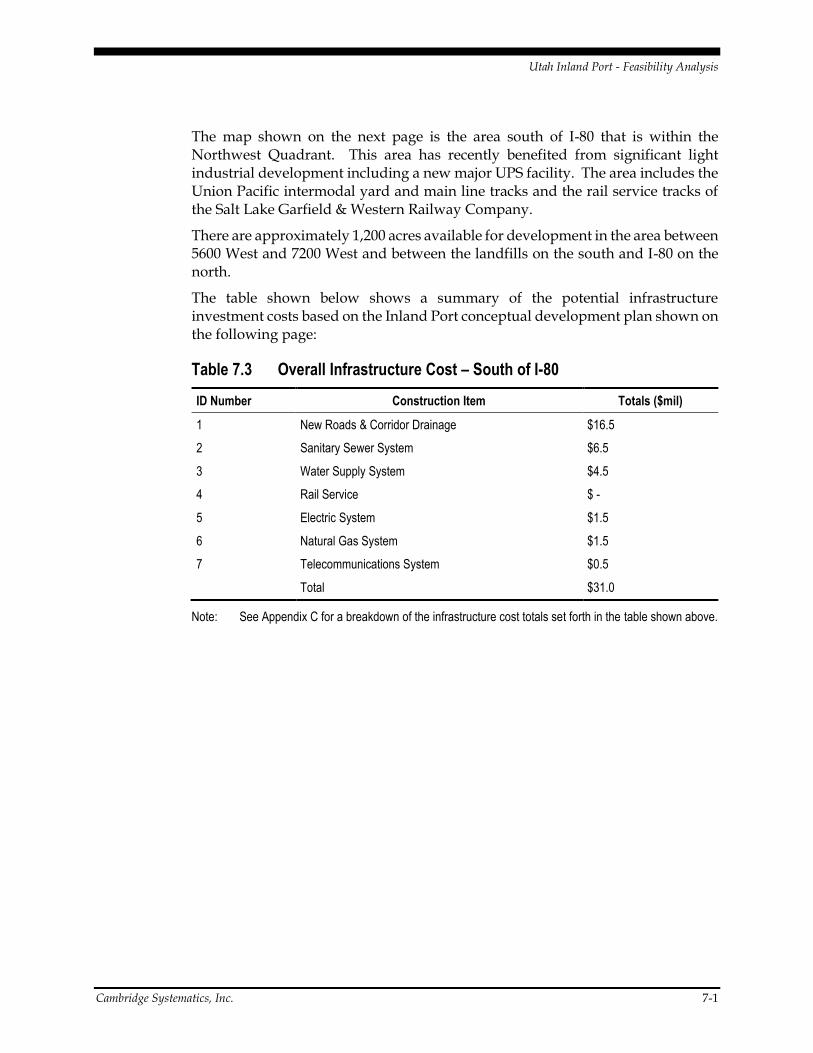
Utah Inland Port - Feasibility Analysis
Cambridge Systematics, Inc. 7-1
The map shown on the next page is the area south of I-80 that is within the Northwest Quadrant. This area has recently benefited from significant light industrial development including a new major UPS facility. The area includes the Union Pacific intermodal yard and main line tracks and the rail service tracks of the Salt Lake Garfield & Western Railway Company.
There are approximately 1,200 acres available for development in the area between 5600 West and 7200 West and between the landfills on the south and I-80 on the north.
The table shown below shows a summary of the potential infrastructure investment costs based on the Inland Port conceptual development plan shown on the following page:
Table 7.3 Overall Infrastructure Cost – South of I-80
ID Number Construction Item Totals ($mil)
1 New Roads & Corridor Drainage $16.5
2 Sanitary Sewer System $6.5
3 Water Supply System $4.5
4 Rail Service $ -
5 Electric System $1.5
6 Natural Gas System $1.5
7 Telecommunications System $0.5
Total $31.0
Note: See Appendix C for a breakdown of the infrastructure cost totals set forth in the table shown above.

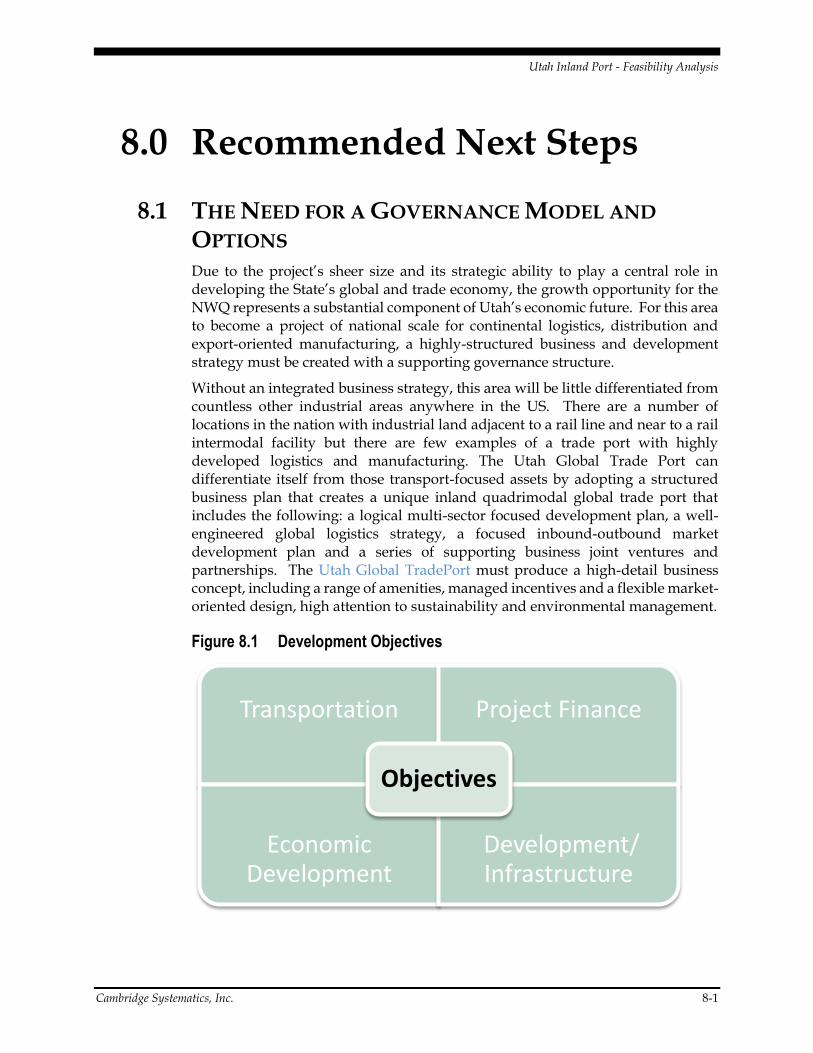
Utah Inland Port - Feasibility Analysis
Cambridge Systematics, Inc. 8-1
8.0 Recommended Next Steps
8.1 THE NEED FOR A GOVERNANCE MODEL AND
OPTIONS Due to the project’s sheer size and its strategic ability to play a central role in developing the State’s global and trade economy, the growth opportunity for the NWQ represents a substantial component of Utah’s economic future. For this area to become a project of national scale for continental logistics, distribution and export-oriented manufacturing, a highly-structured business and development strategy must be created with a supporting governance structure.
Without an integrated business strategy, this area will be little differentiated from countless other industrial areas anywhere in the US. There are a number of locations in the nation with industrial land adjacent to a rail line and near to a rail intermodal facility but there are few examples of a trade port with highly developed logistics and manufacturing. The Utah Global Trade Port can differentiate itself from those transport-focused assets by adopting a structured business plan that creates a unique inland quadrimodal global trade port that includes the following: a logical multi-sector focused development plan, a well-engineered global logistics strategy, a focused inbound-outbound market development plan and a series of supporting business joint ventures and partnerships. The Utah Global TradePort must produce a high-detail business concept, including a range of amenities, managed incentives and a flexible market-oriented design, high attention to sustainability and environmental management.
Figure 8.1 Development Objectives
Transportation Project Finance
Economic Development
Development/ Infrastructure
Objectives
Utah Inland Port - Feasibility Analysis
8-2 Cambridge Systematics, Inc.
Increasingly, global companies are attracted to site locations that are purpose-designed as globally connected business settings, are highly planned high-quality settings with access to a range of amenities for their employees and are designed as flexible business environments allowing for facility growth and investment certainty. These site locations need to reflect their client company’s corporate values and represent justifiable investment propositions – that can pass muster for investment committee approval.
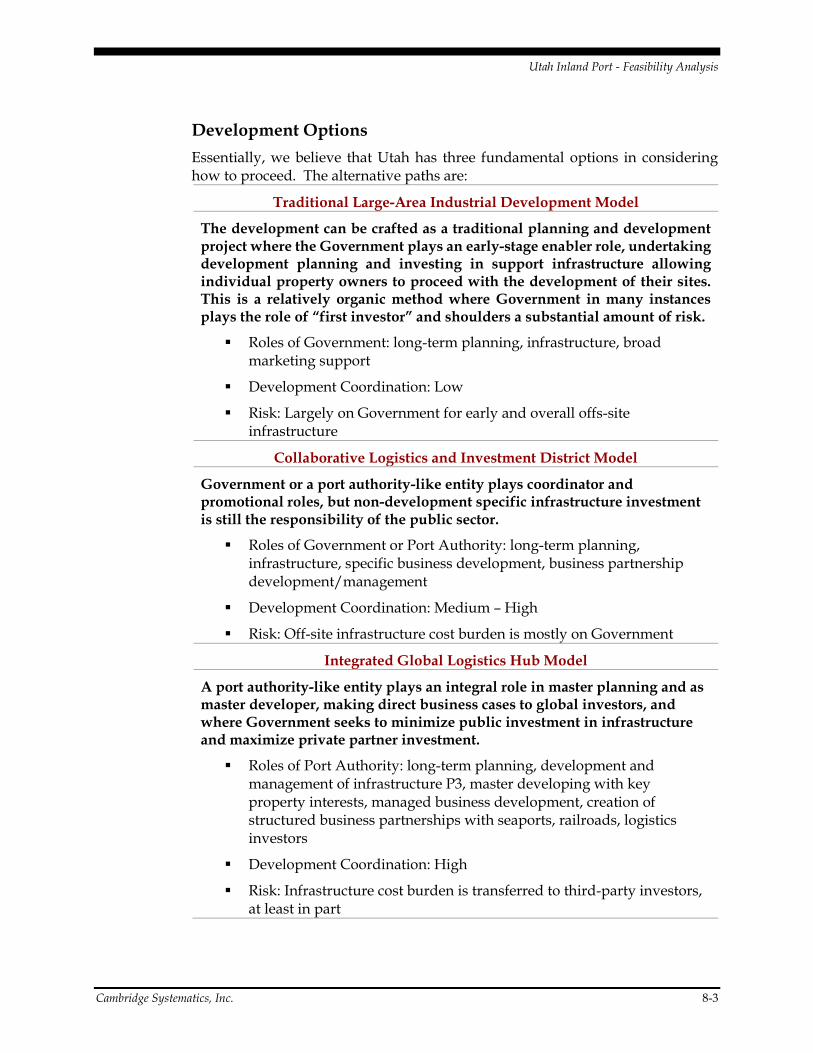
Utah Inland Port - Feasibility Analysis
Cambridge Systematics, Inc. 8-3
Development Options
Essentially, we believe that Utah has three fundamental options in considering how to proceed. The alternative paths are:
Traditional Large-Area Industrial Development Model
The development can be crafted as a traditional planning and development project where the Government plays an early-stage enabler role, undertaking development planning and investing in support infrastructure allowing individual property owners to proceed with the development of their sites. This is a relatively organic method where Government in many instances plays the role of “first investor” and shoulders a substantial amount of risk.
Roles of Government: long-term planning, infrastructure, broad marketing support
Development Coordination: Low
Risk: Largely on Government for early and overall offs-site infrastructure
Collaborative Logistics and Investment District Model
Government or a port authority-like entity plays coordinator and promotional roles, but non-development specific infrastructure investment is still the responsibility of the public sector.
Roles of Government or Port Authority: long-term planning, infrastructure, specific business development, business partnership development/management
Development Coordination: Medium – High
Risk: Off-site infrastructure cost burden is mostly on Government
Integrated Global Logistics Hub Model
A port authority-like entity plays an integral role in master planning and as master developer, making direct business cases to global investors, and where Government seeks to minimize public investment in infrastructure and maximize private partner investment.
Roles of Port Authority: long-term planning, development and management of infrastructure P3, master developing with key property interests, managed business development, creation of structured business partnerships with seaports, railroads, logistics investors
Development Coordination: High
Risk: Infrastructure cost burden is transferred to third-party investors, at least in part
Utah Inland Port - Feasibility Analysis
8-4 Cambridge Systematics, Inc.
In the end, we believe that a port authority-like vehicle should be created. There should be discussion about the options above though, and a view established about whether the authority should play an integral development role, or the role of enabler. It should be noted that enabling legislation was passed by the Utah Legislature in 1973 and this may prove to be a platform for creating a modern, fit for purpose entity today. The Utah Global TradePort would be organized as a public-private entity that can maximize the power of government, but function as a business entity.
The UGTP should have a primary mission of planning and delivering the project in the NWQ region of Salt Lake City, but also have authority and capability to deliver other related transport and logistics projects elsewhere in the State. This wider role would emphasize that the UGTP should be a focus point for the entire State of Utah and support to connecting and export-oriented infrastructure supporting a range of key industries including agriculture and natural resource extraction.
Though this would need to be developed further, the following represents the structure of an organization that plays a more integral development role. The authority would be a central organization representing State, local municipal, and property-owner interests would be shaped as follows:
Powers and Authorities: Constructed to allow the Utah Global TradePort to undertake master planning for the NWQ, acquire and own real and transport assets and infrastructure, enter into joint ventures, issue debt and borrow.
The Utah Global TradePort would function as an organization that can develop and carry out innovative financing to speed the development of infrastructure and reduce the burden on the public sector. The Utah Global TradePort would be constructed to position Utah as a recognized leader in joining private resources to accomplish public economic development objectives.
Control and Reporting: The Utah Global TradePort should be governed by a Managing Board that is appointed by its government owner(s) and for it to provide maximum credibility in the investor, logistics and manufacturing marketplace, the Utah Global TradePort should have the full weight of the State of Utah behind it. Given its main current mission in the Salt Lake City region, it would be valuable to have both the City and County Government represented on the Board of Directors. The Board should be comprised of a range of local and non-local businesspeople with pertinent business expertise in such areas as: manufacturing, logistics, infrastructure development and planning, project finance and public-private finance, and transport facility ownership and development. This could include for example, a director of a major coastal seaport, an executive from a global third party logistics firm or a leader from a global infrastructure investment fund. The Utah Global TradePort should have a
Utah Inland Port - Feasibility Analysis
Cambridge Systematics, Inc. 8-5
fully transparent governance structure, whereby its Board of Directors should provide annual and bi-annual report updates to the State, local government partners and private partners. Further, the Utah Global TradePort should provide a forward five-year business plan to local government partners and the public.
Logistics Sector Expertise and Relationships: The Utah Global TradePort would function as a State and local region partner to the logistics industry in a manner that is currently not possible. Today, in Utah there is no person or expertise representing the public that is of and understands the logistics industry. To illustrate, in states where there is a statewide seaport authority, the Port Authority Board, Director and staff are experts in the field and have deep and consistent business relationships in the field. Today, except for the SLC International Airport, in Utah there is no person or entity that has that those responsibilities. In the case of SLC international Airport, the Airport’s role is somewhat narrow and limited to air service issues. With a Statewide port entity, the organization including its Board and Director would be able to craft partnerships and agreements with seaports, railroads and others.
State and Local Economic Development Incentives: The Utah Global TradePort should have special tools to promote investment attraction. This would include financial incentives for investing businesses and workforce training support mechanisms.
Organizational Scale: The UGTP is not envisioned to be a large organization and its staff size should be modest.
Relationship to the Salt Lake City International Airport: Due to the necessity for the UGTP to support high-velocity supply chains and because of the adjacent location to the expanding Salt Lake City International Airport, we feel strongly that the UGTP and the Airport should be co-joined as partners. For the Utah Global TradePort to maximize its potential as a quadrimodal investment hub, it is critical that air cargo and related ground logistics be fully integrated. With significant potential for high-value manufacturing, ecommerce and logistics, it is critical that air cargo and lands associated with air cargo be integrated into the Utah Global TradePort in one way or another. It does not appear that SLC has made air cargo and related economic development a priority in the past and it makes little sense to keep this function separate.
Sunset Provision: From our experience, it is vital for a mission-specific delivery entity to have a date certain sunset, or a date where it will go out of existence to coincide with the completion of its mission. The specifics should be reviewed to coincide with further specifics, but it may make sense for a 20-year sunset, combined with the requirement that the UGTP should return to the State every five years for a review and renewal.
Utah Inland Port - Feasibility Analysis
8-6 Cambridge Systematics, Inc.
By working in a coordinated manner under a common corporate structure, we believe that there will be increased returns to both local and state governments and also private property interests. By working in tandem under one business plan, we believe that the market will come to Utah faster and more substantially. In addition to a pure logistics product, by engineering the project to support high-value manufacturing the combined blend of economic activity represents a higher return to both public and private interests.
8.2 FUNDING STRATEGY RECOMMENDATIONS There will be a range of costs associated with the development of an industrial district of national scale. In this case the NWQ area requires substantial infrastructure investment for the construction of roads, water, sewer, electric, gas, and telecom systems. Further investment may be needed for rail track, intermodal assets, onsite cargo management equipment and airport-related access infrastructure. Keys will be developing infrastructure with enough scale and at an investment pace that is leading the market.
Taken together over the period of development, the project would likely require hundreds of millions of dollars if core infrastructure, which would be developed to support potentially $3-5B of private plant and equipment investment. A project of this scale would probably develop over a 20-30-year period and would occur in development phases.
Critical investment planning factors:
1) For infrastructure investment efficiency, development must occur in an orderly and strategic manner; this means that an overall project vision and implementation plan would be crafted and agreed by participating parties.
2) Infrastructure should be built in cost-efficient phases and somewhat ahead of the demonstrated and current market, but in a manner that limits and manages risks.
Traditional Large-Area Industrial Development Funding Model
Government and utility providers build core infrastructure to the property line; property owners develop vertical assets and construct infrastructure inside property line
Core infrastructure investment leads the market and is ready as the market demands
Core infrastructure (non-utility): Government pays; recoups investment via future tax revenues and economic development: typically funded through General Obligation bond debt or debt supported by future district tax revenues
Private property investment undertaken by individual owners or development entities on behalf of ownership
Utah Inland Port - Feasibility Analysis
Cambridge Systematics, Inc. 8-7
As development patterns are typically non-linear with inefficiencies, there is a corresponding inefficiency for public core infrastructure investment
Collaborative Logistics and Investment District Model
Government and utility providers build core infrastructure to the property line; property owners develop vertical assets and construct infrastructure inside property line
Integrated Logistics and Investment District Model
Due to its scale, duration, need for maximum investment efficiency and intention to limit the burden on the public – the project is developed as an integrated business structure including State, local government, private infrastructure investors, property ownership
Assumptions: A larger integrated business structure will yield faster, more substantial and higher-returns for investors and for public economic development
A share capital business entity is formed, and by formula provides private investors to participate and share project profitability
Private investment is committed to core infrastructure, global scale partners can be attracted to implement the overall project; benefits: deep pockets, demonstrated commitment to State and long-term market for growth, brand, relationships
In any instance, we strongly suggest that the State and its local government partners not assume that it must be a public responsibility to invest substantial resources without clear expectations of the return to the public – including timing. The traditional model generally suggests that the State take all the risk in forward-funding infrastructure to the benefit of private property interests. The State should be an investor, but only as a partner. If there is a substantial upside growth, there is private risk capital that will be interested.
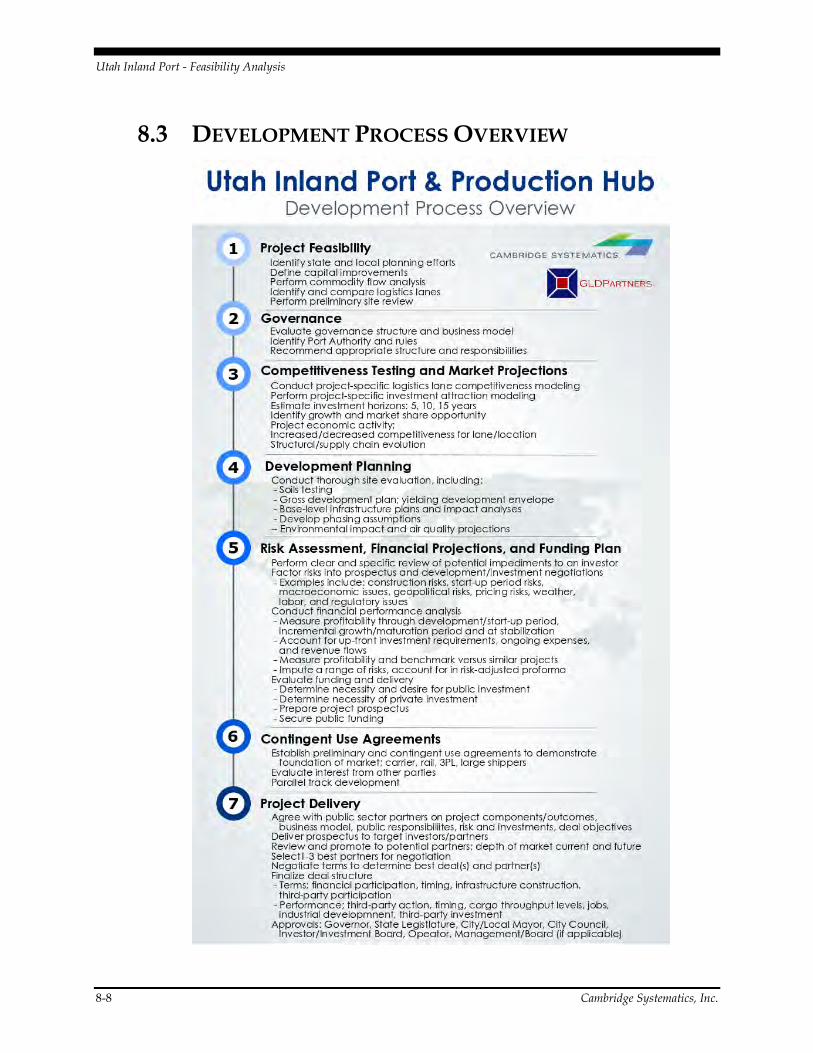
Utah Inland Port - Feasibility Analysis
8-8 Cambridge Systematics, Inc.
8.3 DEVELOPMENT PROCESS OVERVIEW
Utah Inland Port - Feasibility Analysis
Cambridge Systematics, Inc. 8-1
Utah Inland Port - Feasibility Analysis
8-2 Cambridge Systematics, Inc.
A. 2016 Salt Lake Inland Port Market Assessment
Salt Lake Inland Port Market Assessment Research Brief - August 2016
Authored by: Natalie Gochnour I Director, Kem C. Gardner Policy Institute
Summary of findings
1) Significant nationwide interest in inland port development—Logistics hubs that combine containerized rail, trucking interchange, and warehousing and distribution activity are experiencing notable growth .U .S . rail intermodal volume reached a record 13 .7 mil-lion containers and trailers in 2015 Driven in a large way by globalization, e-commerce, and environmental sensibilities, transportation investments that re-duce costs, save time, and minimizes the impact on the environment are becoming more and more at-tractive .
2) Salt Lake City favorably positioned—Salt Lake City is favorably positioned both geographically and economically. In terms of location, Salt Lake City sits at the center of the interior west and ties together the Intermountain West, central plains, northern plateaus, and west coast . The area benefits from direct rail connection to all major west coast terminals and access to major interstates in all directions (I-80 and I-70 East-West, and I-84 Northwest) .Economically, Salt Lake City offers economic advantages for freight movement such as lower wage costs . Business leaders also referenced Salt Lake City’s competitive rates for transloading, faster clearance of car-go, cheaper holding costs at warehouse facilities, tax advantages compared to California, and the potential for faster deliveries.
3) Recent land use decisions make development of an inland port more attractive—The decision to relocate the Utah State Prison to Salt Lake City’s northwest quadrant creates additional potential for government entities to collaborate and invest in infrastructure that services the prison and new economic development options like an inland port . In many ways, the development of a prison and inland port are complementary .
4) Transportation infrastructure investments are supportive; additional investment is needed —The $2 .6 billion rebuild of the Salt Lake City International Airport and more than decade-long surge of
Utah Inland Port - Feasibility Analysis
Cambridge Systematics, Inc. 8-3
transportation investment in the greater Salt Lake area’s road system provide advantages to the development of an inland port . More investment is needed .The current epicenter for freight movement is the Union Pacific Intermodal Terminal . Although located in close proximity to I-80, SR-201 and I-215, for trucks to access these routes they must do so via 5600 West (S .R . 172), which is a narrow two-lane rural road with an at-grade crossing over the railroad at the busy west end of the intermodal terminal . Trucks and other highway traffic can be delayed up to 30 minutes when lengthy intermodal trains arrive or depart at their federally-mandated terminal speed of 10 MPH . This can result in back-ups of more than 500 vehicles extending north to I-80 and south to SR-201 .In addition, the Utah Department of Transportation reports that SR-172 (5600 West) between I-80 and SR-201 needs to be upgraded to a five-lane facility with full 10-foot shoulders for trucks, with realigned and more efficient access points at upgraded intersections, and grade separation over the Union Pacific tracks . Such a rebuilding will allow much faster and more efficient access not only to the intermodal terminal and its potential role as Utah’s Inland Port, but to all the other warehouses and businesses that must use 5600 West .
5) Supply chain—Salt Lake City’s northwest quadrant has emerged as a regional supply chain hub . That emergence is a result of a greatly diverse economy, large manufacturing base, and proximity to the regional population . The Mountain States and some coastal markets are accessible from Salt Lake City within the allowable National Transportation Safety Board window for a single driver shift . This proximity has driven advancements in the logistical coordination of packaging, over-the-road freight, air carriers, and rail access, and made Salt Lake City a critical component of the supply chain in the interior western United States .While Salt Lake City’s immediate access to air, ground, and rail transportation provides the multi-modal options which today’s supply chain professionals seek, to remain attractive will require ongoing investment. Transportation modalities must remain competitive. This means critical investment in, and connectivity among, the major nodes for each transportation modality. Any major infrastructure investment in a node itself (such as an inland port or airport) must see the accompanying investment in arterial thoroughfares and surface roads for the connectivity to happen. The ultimate benefit comes when a freight consumer has as many options as possible to avoid supply chain bottlenecks . As efficiency is the “name of the game,” businesses will be focused on markets where multimodal transportation is not just available, but reliable, affordable, and in proximity to growing bases of population .
6) The location of a major shipping carrier in South Jordan is helpful—The presence and market influence of Orient Overseas Container Line (OOCL) could be a key building block to making Salt Lake
Utah Inland Port - Feasibility Analysis
8-4 Cambridge Systematics, Inc.
County a primary catchment area for shipping in the interior western United States . OOCL opened an office in South Jordan, Utah in 2013, which serves as their North American headquarters. OOCL is one of the top ten global container shipping companies in the world with 270 offices in 70 countries . They are members of the Ocean Alliance, which also includes China’s Cosco Group and France’s CMA CGM . OOCL employs approximately 200 people in Utah, with plans to grow, and provide a vital link to world trade.
7) Potential to become a jobs center—The creation of an inland port could provide significant job opportunities with attractive wages to residents .3It would encourage additional inbound trade, “last piece” manufacturing, warehousing and distribution jobs, local trucking and freight jobs, third-party logistic providers, freight forwarders and courier jobs, and other job opportunities . The full impact of these spinoff effects and how it relates to alternative economic development opportunities, tax revenue, and public expenditure is an area ripe for additional study .
8) Labor market conditions—Labor market conditions in Salt Lake City and Utah are favorable to an inland port, but present some challenges .4 The Salt Lake City and Utah economies continue to out-perform the national economy . Job growth is strong and unemployment rates are low. Wages are notably lower than many inland port cities, particularly California port cities. While wage rates are attractive to employers, Utah’s low unemployment rate creates a labor supply challenge for many industries.
9) Rural Utah economic development—Rural Utah depends on transportation connections for the agriculture, mining, and manufactured products grown, mined, or assembled there . Rural Utah is also a natural location to relieve some of the growth pressures in urban Utah. An inland port facility could be an import-ant rural Utah economic development asset.
10) Master planning Salt Lake City’s Northwest Quadrant—The vision and land use decisions in the northwest quadrant of Salt Lake City are of critical importance to the potential development of an inland port . This is an area of urgent concern because Salt Lake City recently adopted a new master plan for this area . The northwest quadrant includes approximately 19,000 acres west of Salt Lake City International Airport, from 4000 West to approximately 8800 West and from 2100 South to the north city limits . This vital area of real estate includes Salt Lake City’s International Center, the Union Pacific Intermodal Hub, and portions of Interstate 80. It would also be the likely location of an inland port.
Utah Inland Port - Feasibility Analysis
Cambridge Systematics, Inc. 8-5
11) Investment and collaboration—The development of an inland port would require significant transportation investments and collaboration. These include land for increased intermodal lift capacity, trans-loading facility, highway improvements to provide access to lift facilities, support facilities for trucks and personnel to provide off loading and re-loading, short-haul rail capacity, and additional investments . In addition, formal and informal collaboration among the airport, air freight operators, and railroads would be essential. One community leader suggested the inland port could be used as a catalyst to bind state and local government together in productive ways .
12) Address warehousing and processing needs—An inland port would be advantaged by a set aside of land for a new warehousing district (zoning and dedicated use) and infrastructure to support a large warehousing district (roads, water, sewer, and utilities) .
13) Role of Salt Lake City Redevelopment Agency—Tax increment would provide a significant source of funding for infrastructure improvements and incentives to support the creation and development of an inland port . The Redevelopment Agency of Salt Lake City has commenced the process of creating a Community Reinvestment Project Area within the portion of the Northwest Quadrant located north of Interstate 80 . It is anticipated that a project area could be established by early 2017.
14) Governance and JPAs—There are many forms of port governance and studies on the topic indicate that there is no right, “one-size-fits-all,” way to govern a port . Local, regional, and statewide circumstances, along with the port’s strategic objectives, are key determinants . Every port governing body must consider and balance the needs of government regulators (or owners), port customers, community stakeholders, and managers (or shareholders).
15) Tax incentives—U .S. Port Authorities, despite governance structure type, generally offer public incentives, including tax credits, tax exemptions, and financing options .6 Performance-based tax credits, job tax credits, investment tax credits, sales and use tax exemptions, property tax exemptions, tax increment financing, industrial revenue bonds, education and training grants, and other funding options are among the incentives used to support port development .
16) Environmental impact—Many of the people interviewed suggested that enhanced rail freight will result in fewer trucks, less pollution and a reduced carbon footprint . Others noted the potential for increased highway congestion .The Gardner Policy Institute did not analyze these issues, but notes the comments of many of the subject matter experts involved . Because of the state of Utah and Salt Lake City’s commitment to improving air quality, the environmental
Utah Inland Port - Feasibility Analysis
8-6 Cambridge Systematics, Inc.
impact of a proposed inland port deserves in-depth research and analysis .
17) Additional issues raised during the scoping process—These include the following:
a. Rail competition. Union Pacific dominates long-haul freight movement in Utah . Although BNSF Railway provides limited manifest (multi-commodity) freight service to Northern Utah via a trackage rights agreement with Union Pacific, only the latter provides intermodal freight service between Salt Lake City and Pacific Gulf and Atlantic (via connecting eastern railroads) seaports . Some commented that rail costs are high in Utah and more competition would be helpful .
b. Nationwide shortage of truck drivers. Experts estimate the trucking industry could use between 20,000 and 50,000 additional drivers right now to support current needs. The shortage of drivers is a major capacity constraint and may advantage rail freight .
c. Private sector competition. One comment was made about how an inland port financed with public funds (all or a portion) may crowd out private investment and simply add another layer of government .
d. Concern about Salt Lake City’s permitting processes. Several people commented about Salt Lake City’s reputation as a difficult place to do business . Zoning and permitting issues are of particular concern. The Salt Lake City Council has commissioned an audit of the city’s permitting processes to address if permitting problems are a perception or a reality .
e. Impact of Panama Canal. The 10-year, $5 .4 billion Panama Canal expansion opened in June 2016 .8The larger canal is expected to change shipping patterns and impact existing, expanding, and new ports . The expansion nearly triples the capacity of ships transiting the canal and allows supersized ships that carry nearly three times as many containers as before to pass through the canal . Estimates of the impact on west coast shipping vary, but one local expert suggested the impact will be modest, somewhere in the neighborhood of a 10-15 percent negative disruption .
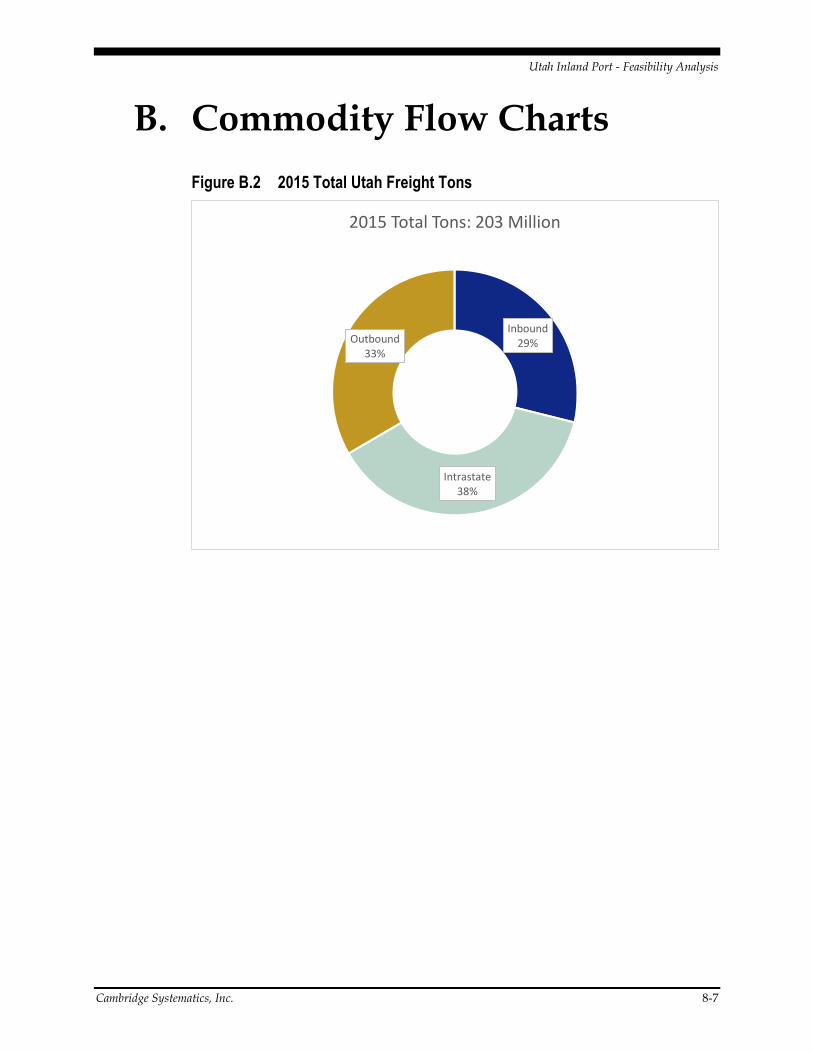
Utah Inland Port - Feasibility Analysis
Cambridge Systematics, Inc. 8-7
B. Commodity Flow Charts
Figure B.2 2015 Total Utah Freight Tons
Inbound29%
Intrastate38%
Outbound33%
2015 Total Tons: 203 Million
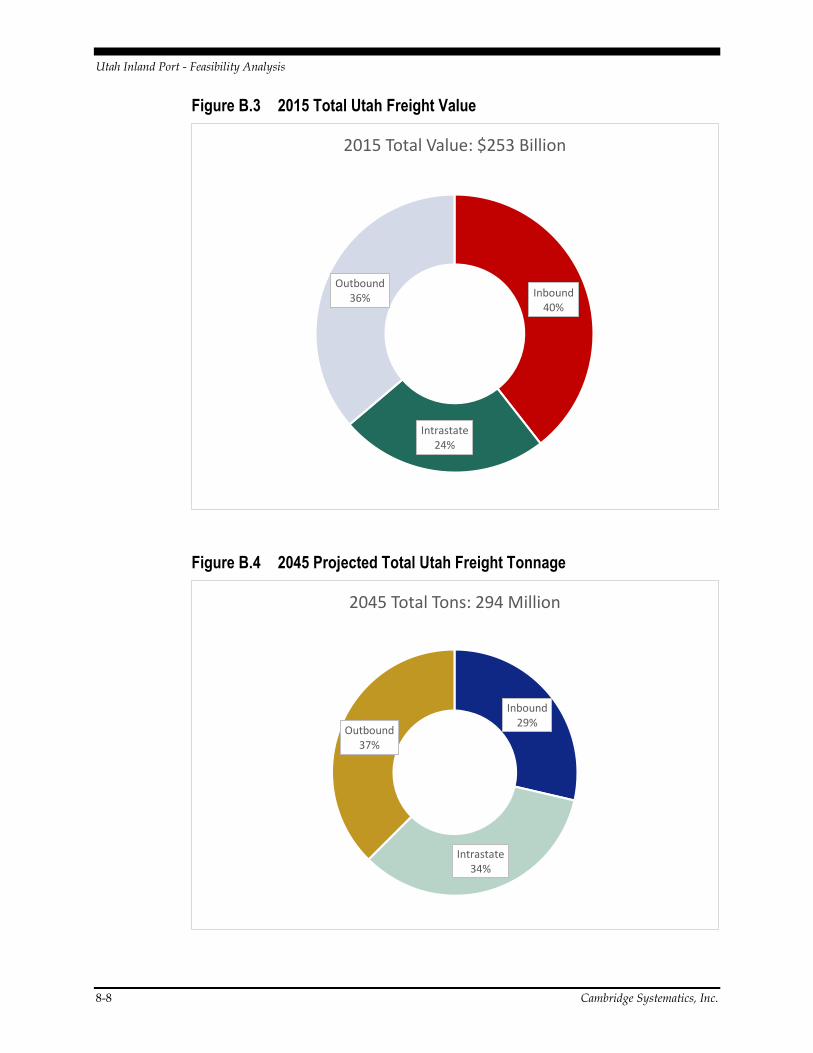
Utah Inland Port - Feasibility Analysis
8-8 Cambridge Systematics, Inc.
Figure B.3 2015 Total Utah Freight Value
Figure B.4 2045 Projected Total Utah Freight Tonnage
Inbound40%
Intrastate24%
Outbound36%
2015 Total Value: $253 Billion
Inbound29%
Intrastate34%
Outbound37%
2045 Total Tons: 294 Million
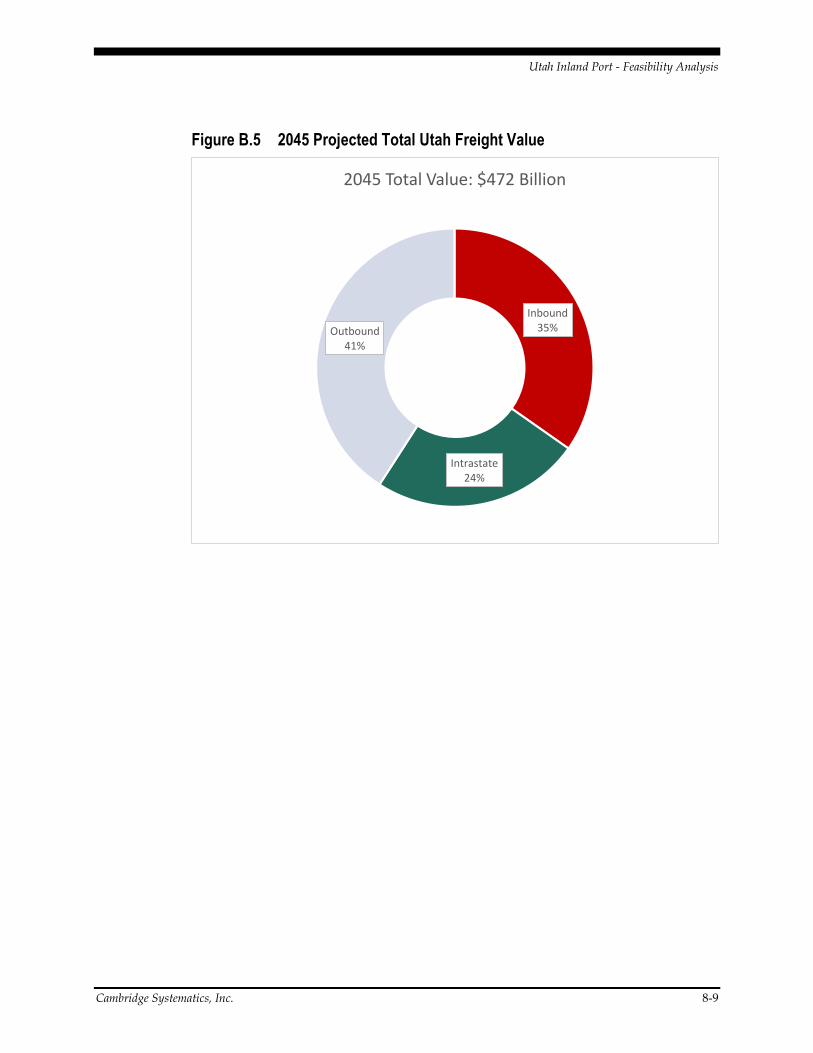
Utah Inland Port - Feasibility Analysis
Cambridge Systematics, Inc. 8-9
Figure B.5 2045 Projected Total Utah Freight Value
Inbound35%
Intrastate24%
Outbound41%
2045 Total Value: $472 Billion
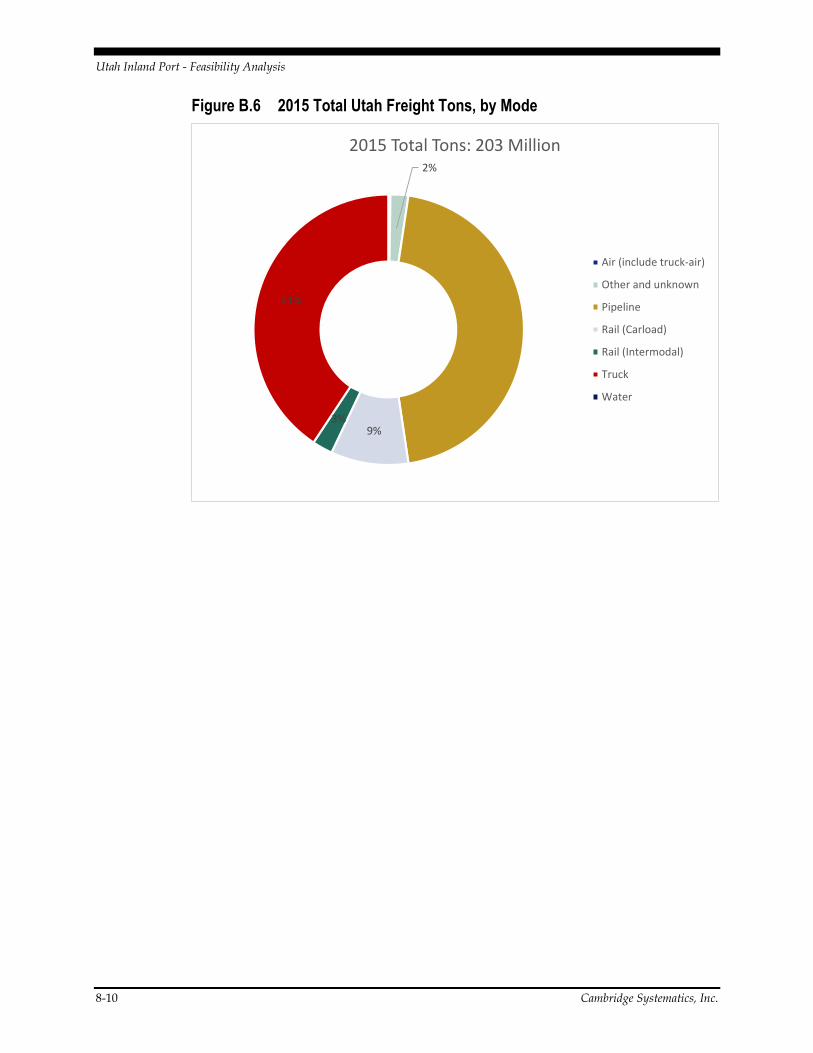
Utah Inland Port - Feasibility Analysis
8-10 Cambridge Systematics, Inc.
Figure B.6 2015 Total Utah Freight Tons, by Mode
2%
9%3%
41%
2015 Total Tons: 203 Million
Air (include truck-air)
Other and unknown
Pipeline
Rail (Carload)
Rail (Intermodal)
Truck
Water
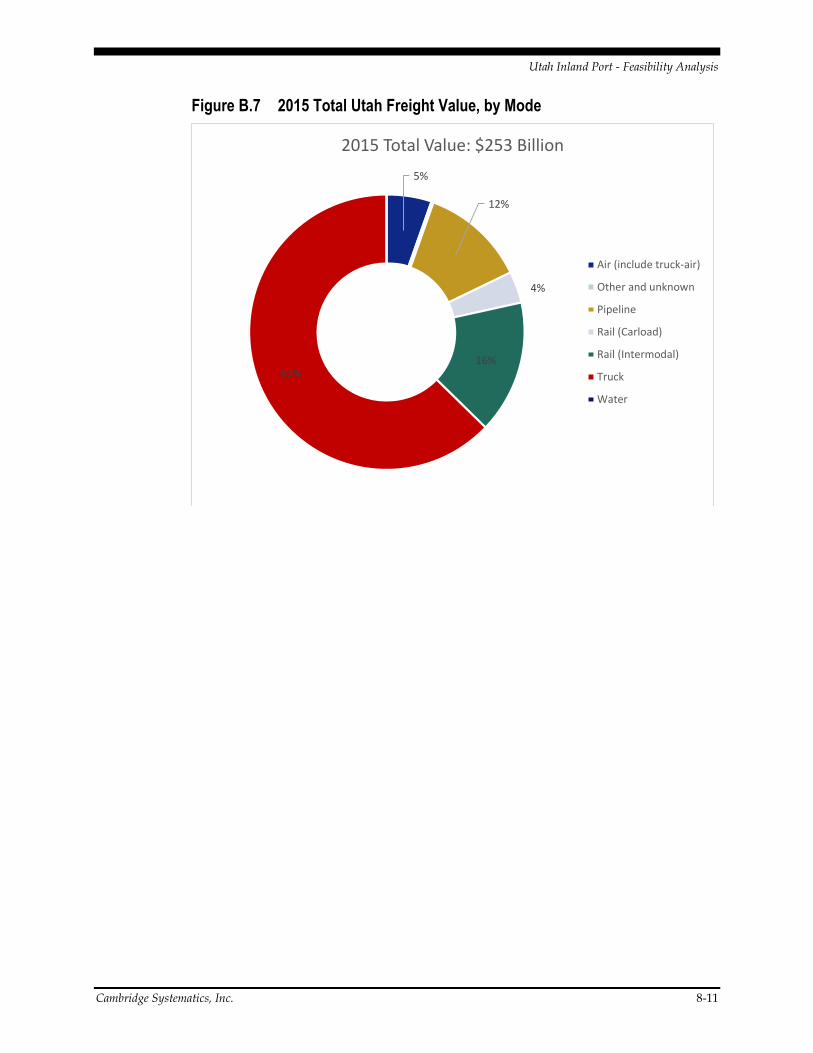
Utah Inland Port - Feasibility Analysis
Cambridge Systematics, Inc. 8-11
Figure B.7 2015 Total Utah Freight Value, by Mode
5%
12%
4%
16%63%
2015 Total Value: $253 Billion
Air (include truck-air)
Other and unknown
Pipeline
Rail (Carload)
Rail (Intermodal)
Truck
Water
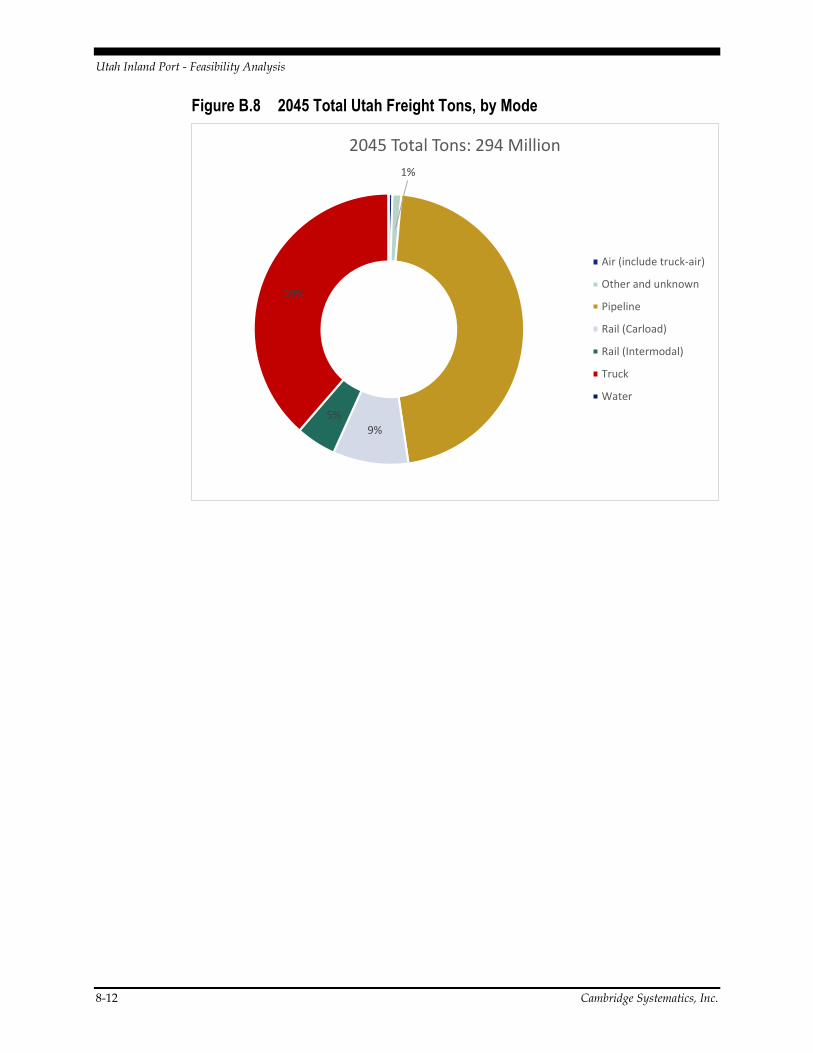
Utah Inland Port - Feasibility Analysis
8-12 Cambridge Systematics, Inc.
Figure B.8 2045 Total Utah Freight Tons, by Mode
1%
9%
5%
39%
2045 Total Tons: 294 Million
Air (include truck-air)
Other and unknown
Pipeline
Rail (Carload)
Rail (Intermodal)
Truck
Water
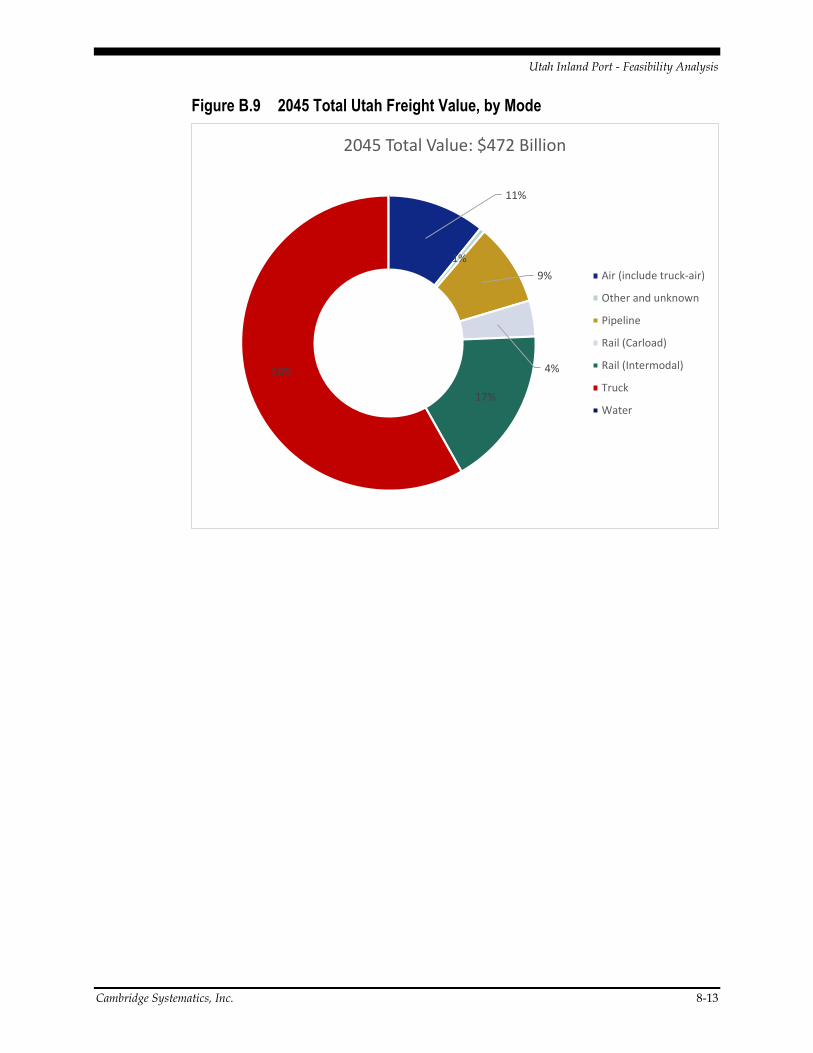
Utah Inland Port - Feasibility Analysis
Cambridge Systematics, Inc. 8-13
Figure B.9 2045 Total Utah Freight Value, by Mode
11%
1%
9%
4%
17%
58%
2045 Total Value: $472 Billion
Air (include truck-air)
Other and unknown
Pipeline
Rail (Carload)
Rail (Intermodal)
Truck
Water
Utah Inland Port - Feasibility Analysis
8-14 Cambridge Systematics, Inc.
C. Competitiveness References
Sources used for competitiveness analysis were as follows:
Utah Inland Port - Feasibility Analysis
Cambridge Systematics, Inc. 8-15
Table C.1 Competitiveness References
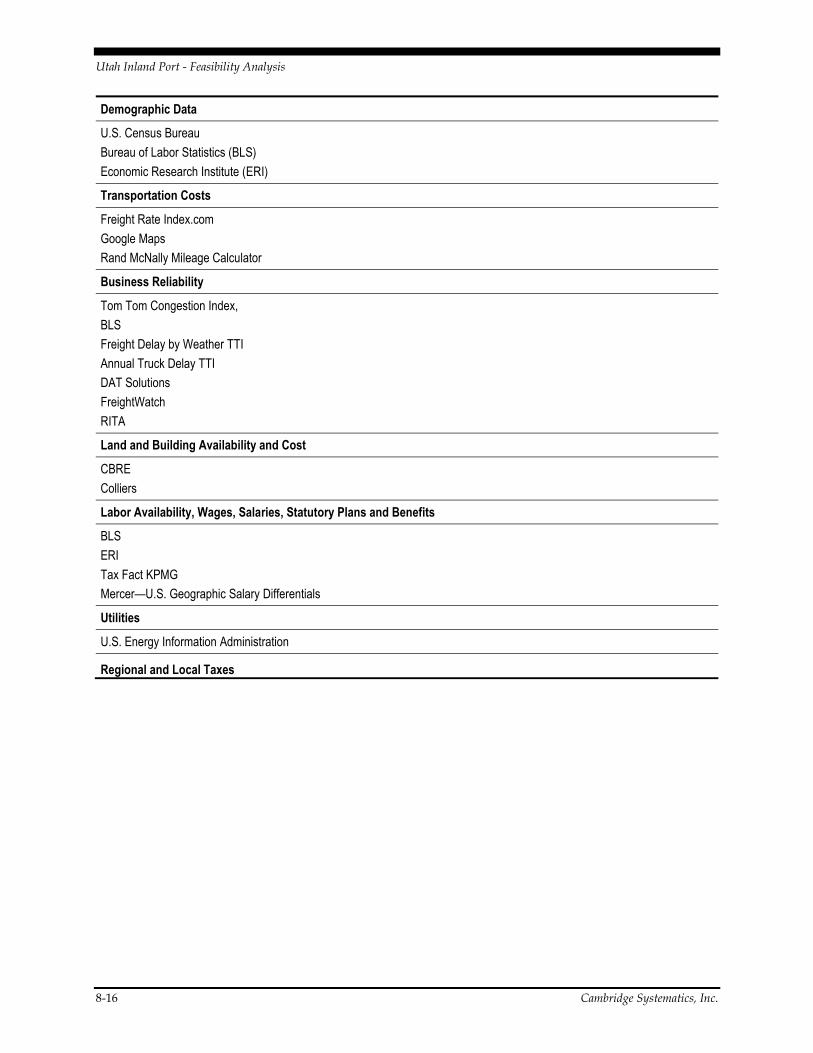
Utah Inland Port - Feasibility Analysis
8-16 Cambridge Systematics, Inc.
Demographic Data
U.S. Census Bureau
Bureau of Labor Statistics (BLS)
Economic Research Institute (ERI)
Transportation Costs
Freight Rate Index.com
Google Maps
Rand McNally Mileage Calculator
Business Reliability
Tom Tom Congestion Index,
BLS
Freight Delay by Weather TTI
Annual Truck Delay TTI
DAT Solutions
FreightWatch
RITA
Land and Building Availability and Cost
CBRE
Colliers
Labor Availability, Wages, Salaries, Statutory Plans and Benefits
BLS
ERI
Tax Fact KPMG
Mercer—U.S. Geographic Salary Differentials
Utilities
U.S. Energy Information Administration
Regional and Local Taxes
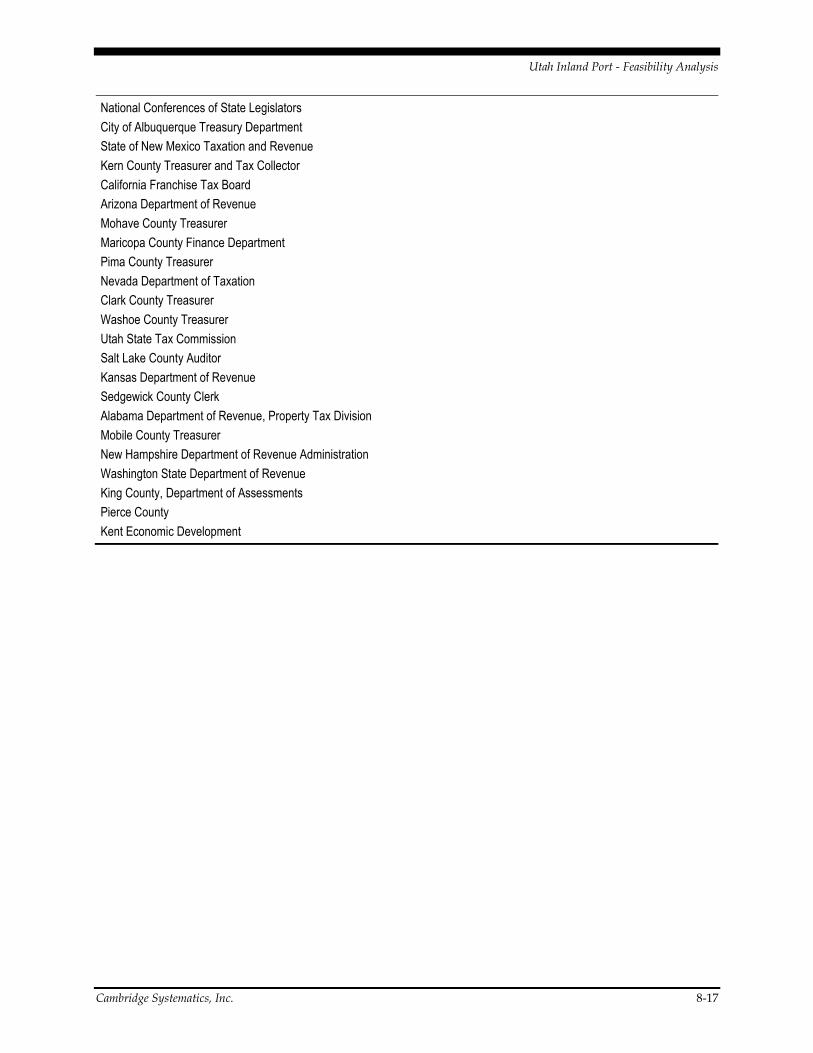
Utah Inland Port - Feasibility Analysis
Cambridge Systematics, Inc. 8-17
National Conferences of State Legislators
City of Albuquerque Treasury Department
State of New Mexico Taxation and Revenue
Kern County Treasurer and Tax Collector
California Franchise Tax Board
Arizona Department of Revenue
Mohave County Treasurer
Maricopa County Finance Department
Pima County Treasurer
Nevada Department of Taxation
Clark County Treasurer
Washoe County Treasurer
Utah State Tax Commission
Salt Lake County Auditor
Kansas Department of Revenue
Sedgewick County Clerk
Alabama Department of Revenue, Property Tax Division
Mobile County Treasurer
New Hampshire Department of Revenue Administration
Washington State Department of Revenue
King County, Department of Assessments
Pierce County
Kent Economic Development
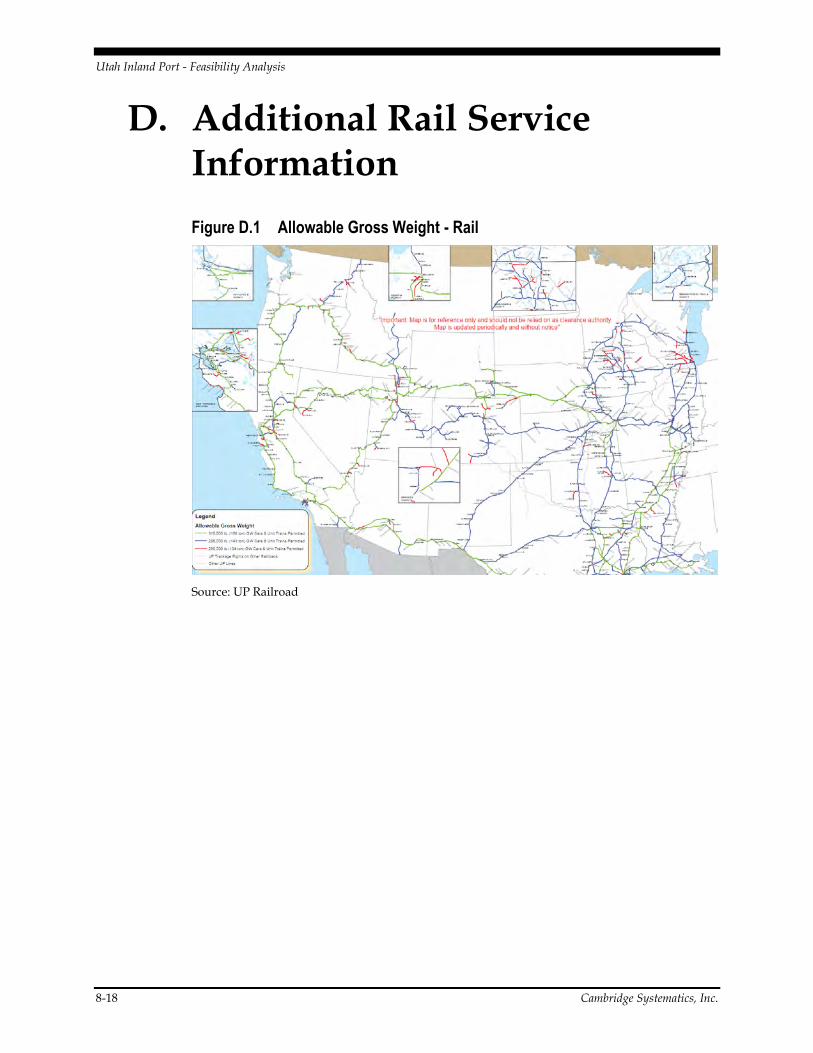
Utah Inland Port - Feasibility Analysis
8-18 Cambridge Systematics, Inc.
D. Additional Rail Service Information
Figure D.1 Allowable Gross Weight - Rail
Source: UP Railroad
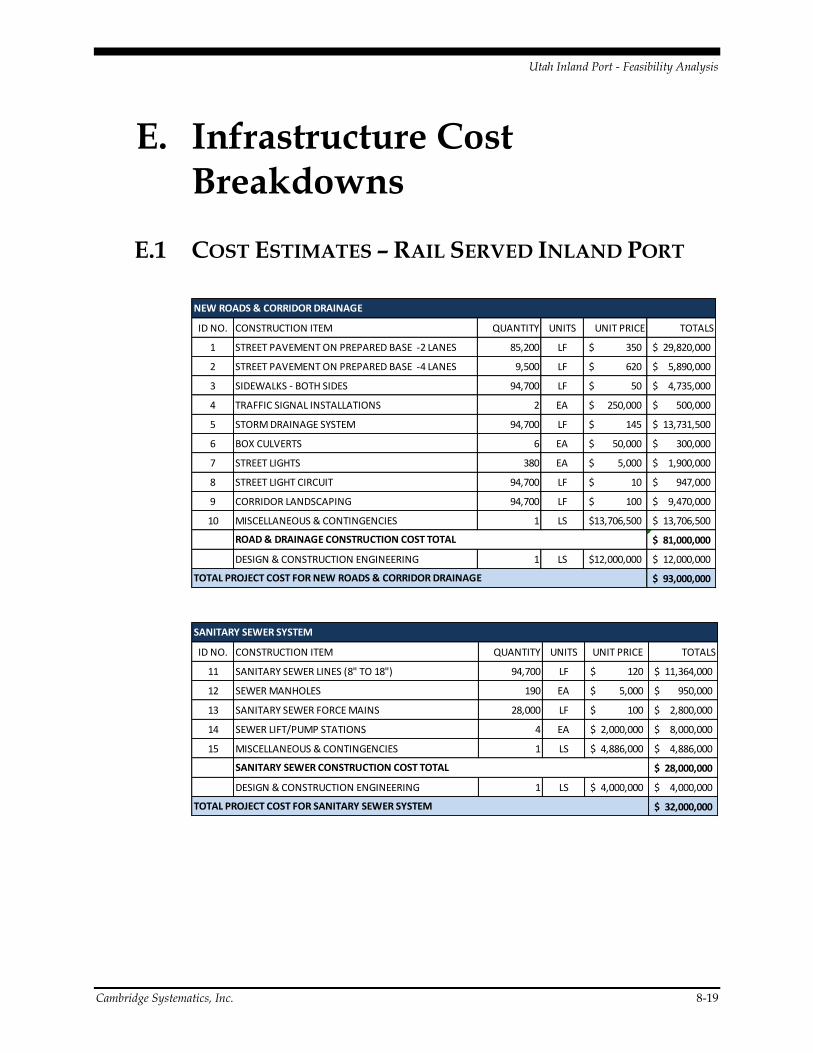
Utah Inland Port - Feasibility Analysis
Cambridge Systematics, Inc. 8-19
E. Infrastructure Cost Breakdowns
E.1 COST ESTIMATES – RAIL SERVED INLAND PORT
ID NO. CONSTRUCTION ITEM QUANTITY UNITS UNIT PRICE TOTALS
1 STREET PAVEMENT ON PREPARED BASE -2 LANES 85,200 LF 350$ 29,820,000$
2 STREET PAVEMENT ON PREPARED BASE -4 LANES 9,500 LF 620$ 5,890,000$
3 SIDEWALKS - BOTH SIDES 94,700 LF 50$ 4,735,000$
4 TRAFFIC SIGNAL INSTALLATIONS 2 EA 250,000$ 500,000$
5 STORM DRAINAGE SYSTEM 94,700 LF 145$ 13,731,500$
6 BOX CULVERTS 6 EA 50,000$ 300,000$
7 STREET LIGHTS 380 EA 5,000$ 1,900,000$
8 STREET LIGHT CIRCUIT 94,700 LF 10$ 947,000$
9 CORRIDOR LANDSCAPING 94,700 LF 100$ 9,470,000$
10 MISCELLANEOUS & CONTINGENCIES 1 LS 13,706,500$ 13,706,500$
81,000,000$
DESIGN & CONSTRUCTION ENGINEERING 1 LS 12,000,000$ 12,000,000$
93,000,000$
ROAD & DRAINAGE CONSTRUCTION COST TOTAL
NEW ROADS & CORRIDOR DRAINAGE
TOTAL PROJECT COST FOR NEW ROADS & CORRIDOR DRAINAGE
ID NO. CONSTRUCTION ITEM QUANTITY UNITS UNIT PRICE TOTALS
11 SANITARY SEWER LINES (8" TO 18") 94,700 LF 120$ 11,364,000$
12 SEWER MANHOLES 190 EA 5,000$ 950,000$
13 SANITARY SEWER FORCE MAINS 28,000 LF 100$ 2,800,000$
14 SEWER LIFT/PUMP STATIONS 4 EA 2,000,000$ 8,000,000$
15 MISCELLANEOUS & CONTINGENCIES 1 LS 4,886,000$ 4,886,000$
28,000,000$
DESIGN & CONSTRUCTION ENGINEERING 1 LS 4,000,000$ 4,000,000$
32,000,000$
SANITARY SEWER CONSTRUCTION COST TOTAL
SANITARY SEWER SYSTEM
TOTAL PROJECT COST FOR SANITARY SEWER SYSTEM
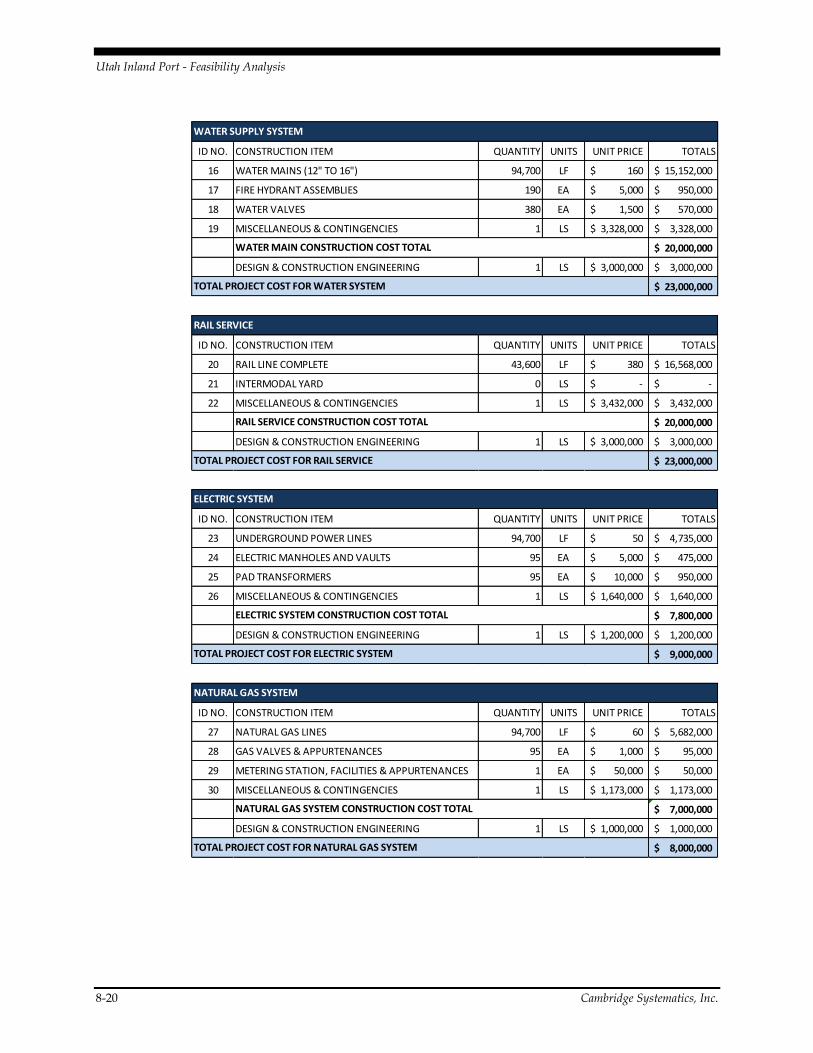
Utah Inland Port - Feasibility Analysis
8-20 Cambridge Systematics, Inc.
ID NO. CONSTRUCTION ITEM QUANTITY UNITS UNIT PRICE TOTALS
20 RAIL LINE COMPLETE 43,600 LF 380$ 16,568,000$
21 INTERMODAL YARD 0 LS -$ -$
22 MISCELLANEOUS & CONTINGENCIES 1 LS 3,432,000$ 3,432,000$
20,000,000$
DESIGN & CONSTRUCTION ENGINEERING 1 LS 3,000,000$ 3,000,000$
23,000,000$ TOTAL PROJECT COST FOR RAIL SERVICE
RAIL SERVICE CONSTRUCTION COST TOTAL
RAIL SERVICE
ID NO. CONSTRUCTION ITEM QUANTITY UNITS UNIT PRICE TOTALS
23 UNDERGROUND POWER LINES 94,700 LF 50$ 4,735,000$
24 ELECTRIC MANHOLES AND VAULTS 95 EA 5,000$ 475,000$
25 PAD TRANSFORMERS 95 EA 10,000$ 950,000$
26 MISCELLANEOUS & CONTINGENCIES 1 LS 1,640,000$ 1,640,000$
7,800,000$
DESIGN & CONSTRUCTION ENGINEERING 1 LS 1,200,000$ 1,200,000$
9,000,000$
ELECTRIC SYSTEM CONSTRUCTION COST TOTAL
ELECTRIC SYSTEM
TOTAL PROJECT COST FOR ELECTRIC SYSTEM
ID NO. CONSTRUCTION ITEM QUANTITY UNITS UNIT PRICE TOTALS
27 NATURAL GAS LINES 94,700 LF 60$ 5,682,000$
28 GAS VALVES & APPURTENANCES 95 EA 1,000$ 95,000$
29 METERING STATION, FACILITIES & APPURTENANCES 1 EA 50,000$ 50,000$
30 MISCELLANEOUS & CONTINGENCIES 1 LS 1,173,000$ 1,173,000$
7,000,000$
DESIGN & CONSTRUCTION ENGINEERING 1 LS 1,000,000$ 1,000,000$
8,000,000$
NATURAL GAS SYSTEM CONSTRUCTION COST TOTAL
TOTAL PROJECT COST FOR NATURAL GAS SYSTEM
NATURAL GAS SYSTEM
ID NO. CONSTRUCTION ITEM QUANTITY UNITS UNIT PRICE TOTALS
16 WATER MAINS (12" TO 16") 94,700 LF 160$ 15,152,000$
17 FIRE HYDRANT ASSEMBLIES 190 EA 5,000$ 950,000$
18 WATER VALVES 380 EA 1,500$ 570,000$
19 MISCELLANEOUS & CONTINGENCIES 1 LS 3,328,000$ 3,328,000$
20,000,000$
DESIGN & CONSTRUCTION ENGINEERING 1 LS 3,000,000$ 3,000,000$
23,000,000$
WATER SUPPLY SYSTEM
WATER MAIN CONSTRUCTION COST TOTAL
TOTAL PROJECT COST FOR WATER SYSTEM
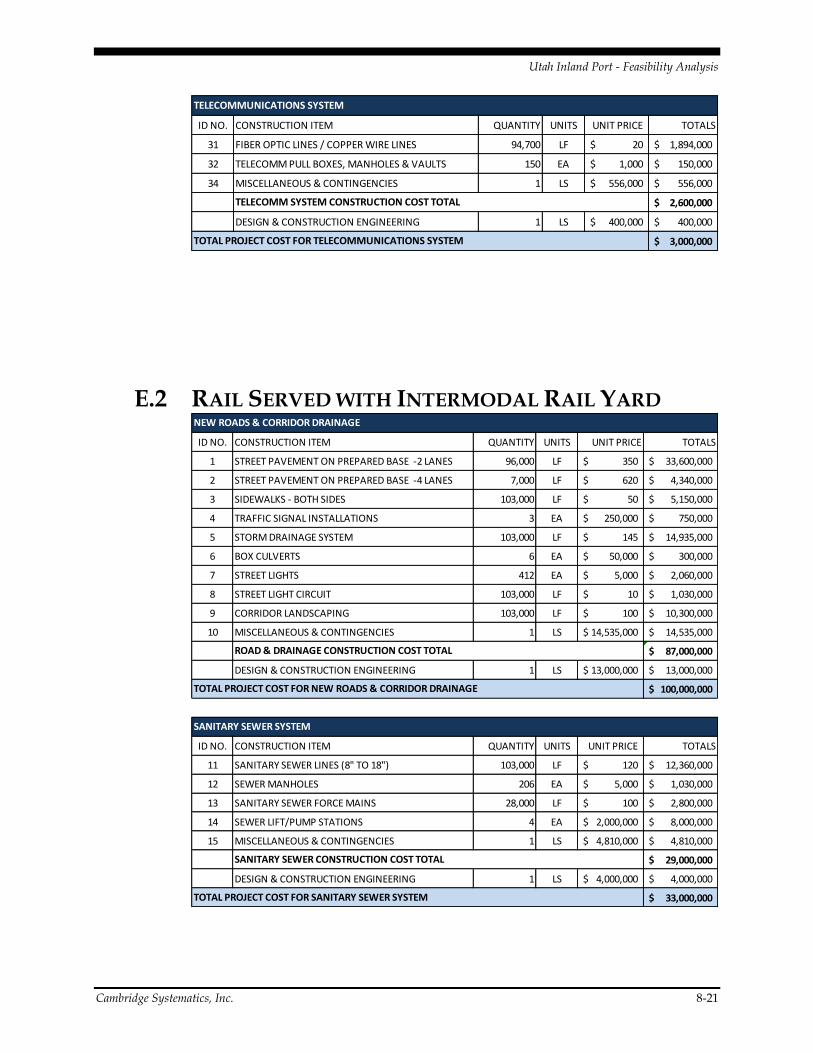
Utah Inland Port - Feasibility Analysis
Cambridge Systematics, Inc. 8-21
E.2 RAIL SERVED WITH INTERMODAL RAIL YARD
ID NO. CONSTRUCTION ITEM QUANTITY UNITS UNIT PRICE TOTALS
31 FIBER OPTIC LINES / COPPER WIRE LINES 94,700 LF 20$ 1,894,000$
32 TELECOMM PULL BOXES, MANHOLES & VAULTS 150 EA 1,000$ 150,000$
34 MISCELLANEOUS & CONTINGENCIES 1 LS 556,000$ 556,000$
2,600,000$
DESIGN & CONSTRUCTION ENGINEERING 1 LS 400,000$ 400,000$
3,000,000$
TELECOMM SYSTEM CONSTRUCTION COST TOTAL
TELECOMMUNICATIONS SYSTEM
TOTAL PROJECT COST FOR TELECOMMUNICATIONS SYSTEM
ID NO. CONSTRUCTION ITEM QUANTITY UNITS UNIT PRICE TOTALS
1 STREET PAVEMENT ON PREPARED BASE -2 LANES 96,000 LF 350$ 33,600,000$
2 STREET PAVEMENT ON PREPARED BASE -4 LANES 7,000 LF 620$ 4,340,000$
3 SIDEWALKS - BOTH SIDES 103,000 LF 50$ 5,150,000$
4 TRAFFIC SIGNAL INSTALLATIONS 3 EA 250,000$ 750,000$
5 STORM DRAINAGE SYSTEM 103,000 LF 145$ 14,935,000$
6 BOX CULVERTS 6 EA 50,000$ 300,000$
7 STREET LIGHTS 412 EA 5,000$ 2,060,000$
8 STREET LIGHT CIRCUIT 103,000 LF 10$ 1,030,000$
9 CORRIDOR LANDSCAPING 103,000 LF 100$ 10,300,000$
10 MISCELLANEOUS & CONTINGENCIES 1 LS 14,535,000$ 14,535,000$
87,000,000$
DESIGN & CONSTRUCTION ENGINEERING 1 LS 13,000,000$ 13,000,000$
100,000,000$
NEW ROADS & CORRIDOR DRAINAGE
TOTAL PROJECT COST FOR NEW ROADS & CORRIDOR DRAINAGE
ROAD & DRAINAGE CONSTRUCTION COST TOTAL
ID NO. CONSTRUCTION ITEM QUANTITY UNITS UNIT PRICE TOTALS
11 SANITARY SEWER LINES (8" TO 18") 103,000 LF 120$ 12,360,000$
12 SEWER MANHOLES 206 EA 5,000$ 1,030,000$
13 SANITARY SEWER FORCE MAINS 28,000 LF 100$ 2,800,000$
14 SEWER LIFT/PUMP STATIONS 4 EA 2,000,000$ 8,000,000$
15 MISCELLANEOUS & CONTINGENCIES 1 LS 4,810,000$ 4,810,000$
29,000,000$
DESIGN & CONSTRUCTION ENGINEERING 1 LS 4,000,000$ 4,000,000$
33,000,000$
SANITARY SEWER SYSTEM
TOTAL PROJECT COST FOR SANITARY SEWER SYSTEM
SANITARY SEWER CONSTRUCTION COST TOTAL
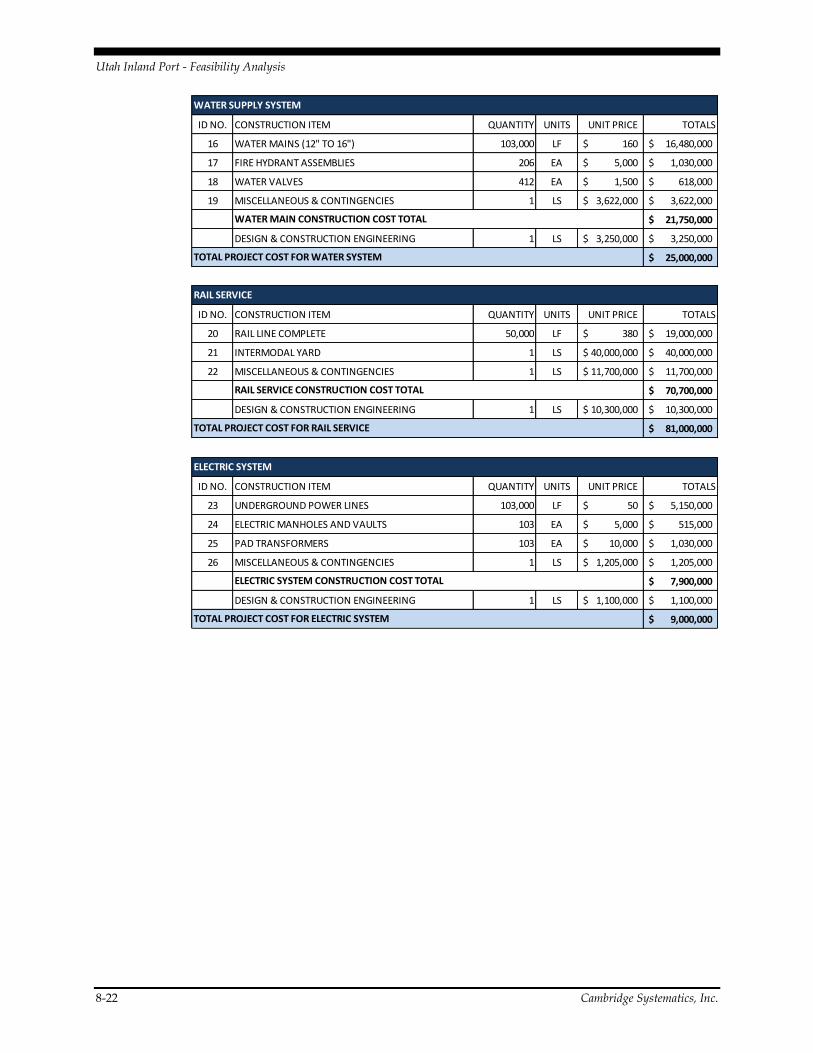
Utah Inland Port - Feasibility Analysis
8-22 Cambridge Systematics, Inc.
ID NO. CONSTRUCTION ITEM QUANTITY UNITS UNIT PRICE TOTALS
16 WATER MAINS (12" TO 16") 103,000 LF 160$ 16,480,000$
17 FIRE HYDRANT ASSEMBLIES 206 EA 5,000$ 1,030,000$
18 WATER VALVES 412 EA 1,500$ 618,000$
19 MISCELLANEOUS & CONTINGENCIES 1 LS 3,622,000$ 3,622,000$
21,750,000$
DESIGN & CONSTRUCTION ENGINEERING 1 LS 3,250,000$ 3,250,000$
25,000,000$ TOTAL PROJECT COST FOR WATER SYSTEM
WATER SUPPLY SYSTEM
WATER MAIN CONSTRUCTION COST TOTAL
ID NO. CONSTRUCTION ITEM QUANTITY UNITS UNIT PRICE TOTALS
20 RAIL LINE COMPLETE 50,000 LF 380$ 19,000,000$
21 INTERMODAL YARD 1 LS 40,000,000$ 40,000,000$
22 MISCELLANEOUS & CONTINGENCIES 1 LS 11,700,000$ 11,700,000$
70,700,000$
DESIGN & CONSTRUCTION ENGINEERING 1 LS 10,300,000$ 10,300,000$
81,000,000$ TOTAL PROJECT COST FOR RAIL SERVICE
RAIL SERVICE CONSTRUCTION COST TOTAL
RAIL SERVICE
ID NO. CONSTRUCTION ITEM QUANTITY UNITS UNIT PRICE TOTALS
23 UNDERGROUND POWER LINES 103,000 LF 50$ 5,150,000$
24 ELECTRIC MANHOLES AND VAULTS 103 EA 5,000$ 515,000$
25 PAD TRANSFORMERS 103 EA 10,000$ 1,030,000$
26 MISCELLANEOUS & CONTINGENCIES 1 LS 1,205,000$ 1,205,000$
7,900,000$
DESIGN & CONSTRUCTION ENGINEERING 1 LS 1,100,000$ 1,100,000$
9,000,000$ TOTAL PROJECT COST FOR ELECTRIC SYSTEM
ELECTRIC SYSTEM CONSTRUCTION COST TOTAL
ELECTRIC SYSTEM
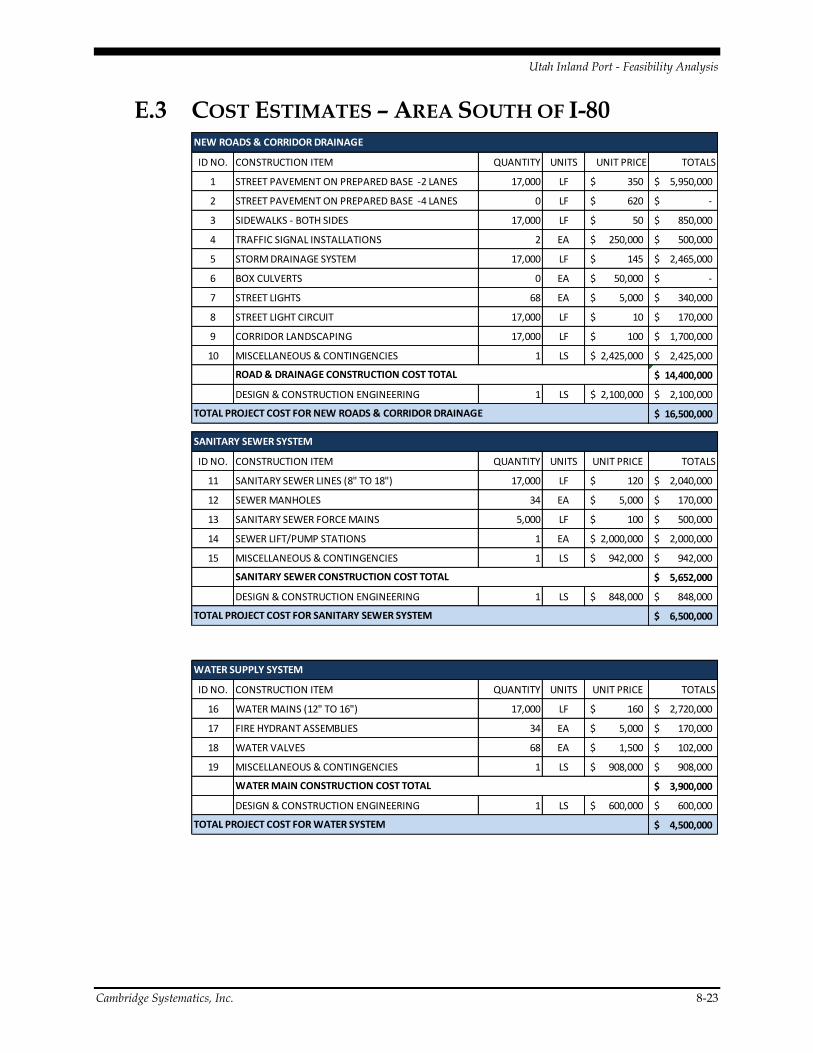
Utah Inland Port - Feasibility Analysis
Cambridge Systematics, Inc. 8-23
E.3 COST ESTIMATES – AREA SOUTH OF I-80
ID NO. CONSTRUCTION ITEM QUANTITY UNITS UNIT PRICE TOTALS
1 STREET PAVEMENT ON PREPARED BASE -2 LANES 17,000 LF 350$ 5,950,000$
2 STREET PAVEMENT ON PREPARED BASE -4 LANES 0 LF 620$ -$
3 SIDEWALKS - BOTH SIDES 17,000 LF 50$ 850,000$
4 TRAFFIC SIGNAL INSTALLATIONS 2 EA 250,000$ 500,000$
5 STORM DRAINAGE SYSTEM 17,000 LF 145$ 2,465,000$
6 BOX CULVERTS 0 EA 50,000$ -$
7 STREET LIGHTS 68 EA 5,000$ 340,000$
8 STREET LIGHT CIRCUIT 17,000 LF 10$ 170,000$
9 CORRIDOR LANDSCAPING 17,000 LF 100$ 1,700,000$
10 MISCELLANEOUS & CONTINGENCIES 1 LS 2,425,000$ 2,425,000$
14,400,000$
DESIGN & CONSTRUCTION ENGINEERING 1 LS 2,100,000$ 2,100,000$
16,500,000$
ROAD & DRAINAGE CONSTRUCTION COST TOTAL
NEW ROADS & CORRIDOR DRAINAGE
TOTAL PROJECT COST FOR NEW ROADS & CORRIDOR DRAINAGE
ID NO. CONSTRUCTION ITEM QUANTITY UNITS UNIT PRICE TOTALS
11 SANITARY SEWER LINES (8" TO 18") 17,000 LF 120$ 2,040,000$
12 SEWER MANHOLES 34 EA 5,000$ 170,000$
13 SANITARY SEWER FORCE MAINS 5,000 LF 100$ 500,000$
14 SEWER LIFT/PUMP STATIONS 1 EA 2,000,000$ 2,000,000$
15 MISCELLANEOUS & CONTINGENCIES 1 LS 942,000$ 942,000$
5,652,000$
DESIGN & CONSTRUCTION ENGINEERING 1 LS 848,000$ 848,000$
6,500,000$
SANITARY SEWER CONSTRUCTION COST TOTAL
SANITARY SEWER SYSTEM
TOTAL PROJECT COST FOR SANITARY SEWER SYSTEM
ID NO. CONSTRUCTION ITEM QUANTITY UNITS UNIT PRICE TOTALS
16 WATER MAINS (12" TO 16") 17,000 LF 160$ 2,720,000$
17 FIRE HYDRANT ASSEMBLIES 34 EA 5,000$ 170,000$
18 WATER VALVES 68 EA 1,500$ 102,000$
19 MISCELLANEOUS & CONTINGENCIES 1 LS 908,000$ 908,000$
3,900,000$
DESIGN & CONSTRUCTION ENGINEERING 1 LS 600,000$ 600,000$
4,500,000$
WATER SUPPLY SYSTEM
WATER MAIN CONSTRUCTION COST TOTAL
TOTAL PROJECT COST FOR WATER SYSTEM
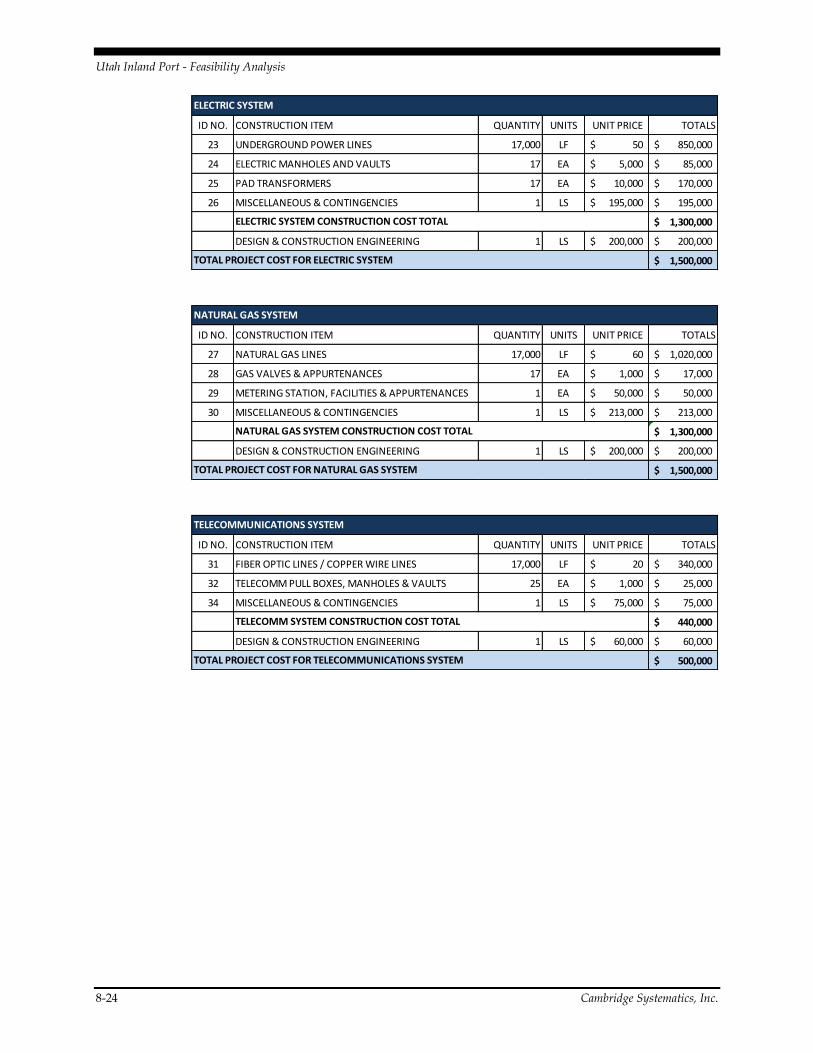
Utah Inland Port - Feasibility Analysis
8-24 Cambridge Systematics, Inc.
ID NO. CONSTRUCTION ITEM QUANTITY UNITS UNIT PRICE TOTALS
23 UNDERGROUND POWER LINES 17,000 LF 50$ 850,000$
24 ELECTRIC MANHOLES AND VAULTS 17 EA 5,000$ 85,000$
25 PAD TRANSFORMERS 17 EA 10,000$ 170,000$
26 MISCELLANEOUS & CONTINGENCIES 1 LS 195,000$ 195,000$
1,300,000$
DESIGN & CONSTRUCTION ENGINEERING 1 LS 200,000$ 200,000$
1,500,000$
ELECTRIC SYSTEM CONSTRUCTION COST TOTAL
ELECTRIC SYSTEM
TOTAL PROJECT COST FOR ELECTRIC SYSTEM
ID NO. CONSTRUCTION ITEM QUANTITY UNITS UNIT PRICE TOTALS
27 NATURAL GAS LINES 17,000 LF 60$ 1,020,000$
28 GAS VALVES & APPURTENANCES 17 EA 1,000$ 17,000$
29 METERING STATION, FACILITIES & APPURTENANCES 1 EA 50,000$ 50,000$
30 MISCELLANEOUS & CONTINGENCIES 1 LS 213,000$ 213,000$
1,300,000$
DESIGN & CONSTRUCTION ENGINEERING 1 LS 200,000$ 200,000$
1,500,000$
NATURAL GAS SYSTEM CONSTRUCTION COST TOTAL
TOTAL PROJECT COST FOR NATURAL GAS SYSTEM
NATURAL GAS SYSTEM
ID NO. CONSTRUCTION ITEM QUANTITY UNITS UNIT PRICE TOTALS
31 FIBER OPTIC LINES / COPPER WIRE LINES 17,000 LF 20$ 340,000$
32 TELECOMM PULL BOXES, MANHOLES & VAULTS 25 EA 1,000$ 25,000$
34 MISCELLANEOUS & CONTINGENCIES 1 LS 75,000$ 75,000$
440,000$
DESIGN & CONSTRUCTION ENGINEERING 1 LS 60,000$ 60,000$
500,000$
TELECOMM SYSTEM CONSTRUCTION COST TOTAL
TELECOMMUNICATIONS SYSTEM
TOTAL PROJECT COST FOR TELECOMMUNICATIONS SYSTEM