Embed Size (px)
Citation preview

BUREAU OF ECONOMIC AND BUSINESS RESEARCH
UTAH ECONOMICAND BUSINESS
REVIEWVOLUME 60, NUMBERS 9 & 10 SEPTEMBER/OCTOBER 2000
STRUCTURAL CHANGE IN
UTAH’S METAL MINING INDUSTRY
1970 – 1999Alan E. Isaacson, Research Analyst
For decades, metal miningwas synonymous with theeconomy, life style, and socialstructure of large areas of thewestern United States. Theseareas ranged from the northernIdaho silver belt, the coppermines of Montana, Arizona andNew Mexico, and the silverboom towns in the ColoradoRockies, to gold camps acrossNevada. The influence of thesemining areas often extendedwell beyond their borders.During World War II, coppermining was consideredimportant enough that theminers were exempt from thedraft.
Utah was no exception tothe influence of metal mining.Silver mines in Park City, mines
in the Tintic mining district andthe Bingham Canyon coppermine all influenced Utah’s socialand economic structure.
Utah continues to be hometo several metal miningoperations which are significanton a worldwide basis. TheKennecott Bingham Canyonmine is the second largestdomestic copper producer interms of capacity and one of theworld’s lowest-cost producers.The Brush Wellman facilitynear Delta is the largest andone of only three beryllium oreprocessing plants in the world.The Magnesium Corporation ofAmerica (MagCorp) plant on thewest side of the Great Salt Lakeis one of two domestic primarymagnesium producers and is
responsible for nearly 10percent of total worldwidemagnesium capacity.
Industry ConsolidationSignificant structural
changes have occurred in theUtah metal mining industryduring the past several decades.Production efficiencies andvolumes have increased. Wageshave consistently been thehighest paid of any industry inUtah; however, metal miningemployment is currently about28 percent of 1970 employmentlevels. Prices received havevaried widely, with increasingprices during the 1970s andearly 1980s and generally weakprices since the mid 1980s.
BEBRDAVID ECCLES
SCHOOL OFBUSINESS
UNIVERSITY OFUTAH
September/October 2000 UTAH ECONOMIC AND BUSINESS REVIEW 2
BUREAU OF ECONOMIC AND BUSINESS RESEARCH
During the past 30 years,the Utah metal mining industryhas greatly consolidated. In1970, there were 17 copper-producing mines located in 11different counties, 12 minesproducing lead, 17 silver-producing mines in ten differentcounties, and 10 zinc-producingmines in eight differentcounties. Many mines produceddifferent metals, for example,the Mayflower Mine producedcopper, gold, lead, silver, andzinc.
During 2000, there wasonly one mine producing copperin Utah, two mines producinggold, one mine producing silver,and no lead or zinc production.Additionally, the copper mine,one of the gold mines, and thesilver mine were actually thesame operation—the KennecottBingham Canyon Mine.Kennecott also owned the othergold mine, the Barney’s CanyonMine, located in the OquirrhMountains.
Production and OperationsMajor metal producing
minerals produced in Utah overthe past three decades includeberyllium, copper, gold andsilver, iron ore, lead and zinc,magnesium and vanadium, aswell as small amounts of othermetals. Production for selectedcommodities is presented inTable 1.
Beryllium—Beryllium is alightweight metal used foralloying copper for strength,aerospace applications, andsemiconductor substrates.About 75 percent of U.S.beryllium consumption is in theform of beryllium-copper alloys,which contain approximately 2
percent beryllium. These alloysare used in springs, switches,and connectors by theautomobile, aerospace, andelectronics industries. Thesockets for joining integratedcircuits on printed circuitboards are beryllium-copperalloy, as are connectors in fiberoptic communication systems.
Beryllium metal accountsfor about 10 percent of U.S.consumption. Its high stiffness,light weight, and dimensionalstability make it useful indefen s e and aerospaceapplications. For instance, somestructural elements and thebrakes on the Space Shuttlesare made from beryllium.
The Brush Wellmanberyllium processing plant,located north of Delta, is one ofonly three facilities in the worldthat processes beryllium ore.(The other beryllium processingfacilities are in China andKazakstan.) The plant opened in1969 and processes bertranditeore mined about 50 miles to thenorthwest, in addition to a smallamount of beryl ore importedfrom other locations. The plantwas expanded in 1976 to processberyl ores in addition to thebertrandite mined in Utah, andagain in 1980 to expandcapacity. Capacity was furtherexpanded during the early1990s. The plant produced 6,490tons of beryllium hydroxideconcentrate during 1999, upfrom 6,325 tons in 1998. Provenore reserves are adequate for 60years of production at currentrates. The concentrate isprocessed into beryllium metal,alloys, and oxide at BrushWellman’s plant in Ellmore,Ohio. The Utah facility employsjust under 100 persons.
Copper—The copper industryhas greatly consolidated overthe past 30 years. In 1970, therewere 17 different minesproducing copper in 11 differentcount ies , a l though theKennecott Bingham CanyonMine was by far the largestproducer. Copper was shippedfrom the state in severaldifferent stages of processing.These included refined copper(copper used for manufacturingproducts such as plumbing andwiring), copper concentrate (thecopper-bearing minerals whichhave been separated from theother minerals in the ore, usedas feed material for smelters),and cement copper (an impuremetallic copper obtained bycontacting aqueous copper leachsolutions with scrap iron, alsoused as feed material forsmelters).
Conventional undergroundmines producing severaldifferent metals, such as thosein the Park City and Tinticdistricts, often produced acopper concentrate which wasshipped out of state or to theKennecott Garfield Smelter forsmelting. Several operations,notably the Big Indian leachplant in San Juan County andOK Mine in Millard County,produced cement copper whichwas also shipped to varioussmelters.
The Carr Fork property,located just northeast of Tooele,was perhaps one of the biggestdisappointments in the Utahmining industry in the past 30years. The Anaconda Companyspent four years exploring andfive years developing theproperty at a cost of $220million. The mine was inproduction for only 27 months,

September/October 2000 UTAH ECONOMIC AND BUSINESS REVIEW 3
BUREAU OF ECONOMIC AND BUSINESS RESEARCH
closing on November 18, 1981.In February, 1985 the pumpswere pulled and the mine wasallowed to flood. Kennecotteventually purchased theproperty from the AtlanticRichfield Company.
In 1992, Sunshine Miningended production of copper-bearing smelter flux from theTrixie Mine near Eureka,marking the last year that amine other than BinghamCanyon produced copper-bearing ore in Utah. Despitethis consolidation, total copperproduction in Utah hasincreased by about 10 percent inthe last 30 years, from 296thousand tons in 1970 to 328thousand tons in 1998. Much ofthis production increase wasdue to modernization and largeamounts of capital investmentmade in the Bingham Canyonoperation.
The first large capitalinvestment made by Kennecottin the Bingham Canyon Mineover the past three decades wasto replace the originalreverberatory smelter with aNoranda smelter in the 1970s.The project was completed in1978 and cost $280 million.Production dropped to 50,063tons in 1985, a result of theBingham Canyon Mine closingfor modernization. Over $1billion has been invested inBingham Canyon during thepast 15 years to increasee f f i c i e n c i e s a n d l owerproduction costs. The mine wasmodernized and the Coppertonconcentrator opened in 1988 ata cost of $400 million.
The mine modernizationreplaced rail haulage with truckhaulage in the pit, in-pit orecrushing, a conveyor system to
transport crushed ore out of thepit, and a slurry pipelinesystem. The primary feature ofthe Copperton concentrator waslarger grinding mills, to takeadvantage of economies of scale.The largest grinding millsinstalled had a 34 foot diameter.A d d i t i ona l l y , ex tens iveelectronic control equipmentwas installed to optimizeoperations. The Coppertonconcentrator was enlarged in1992 at a cost of $227 million.The new Outokumpu flashsmelter came online in 1995, ata cost of $880 million. The newsmelter had increased capacityover the Noranda smelterinstalled during the 1970s andmore effective pollution controlequipment.
Prior to installing theOutokumpu smelter, Kennecottwas exporting approximately 40percent o f the copperconcentrate produced. The newsmelter allowed for all of theconcentrate produced atBingham Canyon to be smeltedin Utah and cut sulfur dioxideemissions by 96 percent.
The Bingham Canyon mineis estimated to contain another15 years worth of reserves andan additional 15 years ofreserves have been identified forunderground mining. Inaddition to copper, the mine isalso a significant producer ofgold, molybdenum, and silver.
Gold and Silver—These metalswere the driving forces behindmuch of the early mining inUtah, and the state remains atop producer of both metals. TheBingham Canyon Mine is by farthe largest Utah producer ofboth precious metals. In 1970,408 thousand ounces of gold and6.0 million ounces of silver were
produced in Utah. Significantproducers included BinghamCanyon, the Mayflower Mine inWasatch County, the UnitedPark City Mines Companyproperties in Summit County,and the mines in the TinticDistrict, then operated by theKennecott Tintic Division.
The Mayflower Mine, thenleased by Hecla MiningCompany from New ParkResources, closed at the end of1972. The United Park Cityproperties were operated byPark City Ventures, a 60/40joint venture of The AnacondaCompany and ASARCO, Inc.,from 1971 until 1978. NorandaExploration, Inc., then leasedthe properties from 1979 until1982, when the last mining inPark City occurred.
Kennecott operated variousmines in the Tintic District untilNovember, 1982. SunshineMining Company subsequentlyleased the Tintic miningproperties in 1983 and operateduntil the end of 1992. Most ofSunshine’s production was soldto Kennecott as smelter flux.The last production in the TinticDistrict was in 1994 when NorthLily Mining closed its smallheap leach operation, which ithad operated since 1988, atSilver City. Currently, ChiefConsolidated Mining is workingon refurbishing the mill at theTrixie Mine and obtainingoperating permits for the Trixieand Burgin Mines, in additionto conducting additionalexploration in the area. Thecompany intends to recommencemining operations in the nearfuture.
Ranchers Exploration andDevelopment Company initiatedd e v e l o p m e n t a t t h e

September/October 2000 UTAH ECONOMIC AND BUSINESS REVIEW 4
BUREAU OF ECONOMIC AND BUSINESS RESEARCH
underground Escalante SilverMine near Enterprise during1979. A mill and refinery werecompleted on August 20, 1981and on October 16, 1981,Ranchers announced that thefirst silver had been poured.Ranchers was purchased by theHecla Mining Company on July26, 1984. Hecla discontinuedmining on December 30, 1988,when the ore body played outand pumping costs becameexcessive. Stockpiled ore wasprocessed through August,1990. During the nine years ofoperation from late 1981 untilthe last ore was milled, theEscalante Mine producedapproximately 18 million ouncesof silver.
Tenneco Minerals openedthe open pit Goldstrike Minenorthwest of St. George duringMay, 1989, at a capital cost of$23 million. The mine producedabout 40 thousand ounces ofgold annually, and a similaramount of silver. USMX, Inc.,purchased the mine inNovember, 1992 and continuedto operate the mine throughOctober, 1994. Gold recoverycontinued until the first part of1996.
Getty Oil poured the firstgold at the open pit MercurMine, south of Tooele in theOquirrh Mountains, on April 21,1983, after 10 years ofexploration and development.The original mill designcapacity was 3,000 tons per dayof ore with gold productionbeing 80,000 ounces annually.Barrick Resources, Inc.,purchased the mine in 1985.During 1985, the mill wasexpanded to 4,000 tons per dayand heap leaching of low gradeore was initiated, increasing
annual production to 105,000ounces. The mine operated until1997, when Barrick Goldannounced a strategy offocusing on low cost mines.Mining ceased in December,1997, although gold recoverycontinued into 1998.
Kennecott opened theBarney’s Canyon Mine in theOquirrh Mountains during thefall of 1989. The original designcapacity was 80,000 ouncesannually of gold and the capitalcost was $32 million. Productionduring 1999 was 112,000ounces, up from 83,000 ouncesduring 1998.
At the present time, the twoKennecott mines, BinghamCanyon and Barney’s Canyon,are the only significant gold andsilver producers in Utah. Thetwo mines combined produced479,000 ounces of gold during1999, while Bingham Canyonproduced 3,859 thousand ouncesof silver. Employment in goldand silver mining increasedfrom 14 in 1980 to a high of 499in 1985. During 1999,employment in gold and silvermining was 248. This issomewhat misleading, becausethe Kennecott Bingham CanyonMine, by far the largest gold andsilver producer in the state isclassified under copper miningfor wage and employmentreporting purposes.
Iron Ore—At the beginning ofthe 1970s, two companies wereproducing iron ore west of CedarCity. U. S. Steel was miningfeed material for the GenevaWorks and Utah Constructionand Mining was mining ore forboth U. S. Steel and CF&I Steel.All mining in the district wasdiscontinued during 1982 andUtah International sold its
processing plants. During 1986,U. S. Steel resumed mining,which was continued by GenevaSteel after the Geneva Workswas purchased from U. S. Steel.Geneva Steel continued contractmining operations until 1995,when installation of the basicoxygen furnace at the GenevaWorks forced the use of higheriron taconite ore fromMinnesota. Employment in ironore mining dropped from 272 in1970, to 184 in 1980, to 42 in1990, to zero in 1995.
Lead and Zinc—During 1970,45,377 tons of lead and 34,688tons of zinc were produced inUtah. These metals often coexistin deposits, and were almostalways produced together atUtah mines. The lead and zincproducers in Utah were dealt ablow in November, 1971, whenThe Anaconda Company closedthe lead smelter near Tooele.The Lark Mine in southwesternSalt Lake County closed a weeklater and the Ophir Hill Mine inTooele County closed inDecember, 1971. Any Utah leadand zinc production since thenwas in the form of mineralconcentrate that was shippedout of state for smelting.Additionally, the economicdriving force for minesproducing lead and zinc wasusually the contained silvercontent, with the other metalsconsidered byproducts. The lastsignificant production of leadand zinc in Utah was in 1982,when Noranda Mines wasleasing the properties owned byUnited Park City MinesCompany. The number ofemployees engaged in mininglead and zinc ores dropped from564 in 1970 to 421 in 1975 tozero in 1985.

September/October 2000 UTAH ECONOMIC AND BUSINESS REVIEW 5
BUREAU OF ECONOMIC AND BUSINESS RESEARCH
Magnesium—Utah became aplayer in the world magnesiummarket when NL Industries,Inc., opened a magnesiumrecovery plant during 1972 onthe western shore of the GreatSalt Lake. The first magnesiumwas produced in 1973.Production continued throughApril of 1976, when productionwas suspended for a plantoverhaul. Production resumedin 1977, after $55 million hadbeen spent on modifications.The modification decreasedplant capacity from 40,000 tonsof magnesium per year to 25,000tons per year. However,operating costs were drasticallyreduced.
NL Industries sold theplant to AMAX, Inc., during1980 for $58 million. AMAXcontinued operating the plant atnear capacity levels whileundertaking a project toreinforce the dikes around thecompany’s evaporation pondsduring 1983 and 1984. On June7th, 1986, the main dike whichs e p a r a t e d t h e p l a n t ’ sevaporation ponds from theGreat Salt Lake rupturedduring a storm; lake waterdiluted the brine, rendering itunusable. AMAX responded bypurchasing magnesium chloridebrine from the KaiserAluminum & Chemical Corp.potash plant (now owned byRei l ly Industries) nearWendover, Utah and from theLeslie Salt Company, locatednear San Francisco, California.
The facility was sold againto Renco Group, Inc., inSeptember, 1989 for anundisclosed price. Since thattime, the company has steadilyincreased the plant capacityfrom 32,000 tons per year in
1989 to the current capacity of44,000 tons per year. Theoperation is currently in themidst of upgrading theelectrolytic cells and emissionscontrol devices; primarily tomeet Title II regulations of theClean Air Act. The projectedcapital expenditures are $20million, $35 million, and $17million during the years 1999-2001, respectively. TheMagCorp plant employsapproximately 540 persons.Sales for 1999 were $134.7million, down from a peak of$152.9 million in 1996.
Uranium and Vanadium—TheUtah uranium industry boomedduring the 1950s, as a result ofg o v e r n m e n t - e n c o u r a g e dexploration. During 1970,uranium was mined at 66different mines in Utah. Veryfew of these mines hadprocessing plants and most soldore to larger operations thatowned mills. Utah uraniumproduction during 1970 was1,635 thousand pounds of U3O8.At the time, Atlas Minerals wasoperating a mill just north ofMoab and Rio Algom Ltd wasconstructing a mill in San JuanCounty.
Vanadium metal is usedprimarily for alloying steel forincreased strength andtoughness. It often exists inuranium ores and most uraniumrecovery plants include avanadium recovery circuit.
Altas Corp., announced a$750 thousand expansion to itsmill in 1977. Atlas continued tooperate and mined severaldifferent ore bodies until placingthe mill on standby in 1984. Themi l l was s u bs equ ent lydismantled. By 1996, the only
structure left on site was anoffice/warehouse building.
The Rio Algom mill becameoperational on Oct. 1, 1972 andoperated efficiently, processing600 tons per day of ore insteadof the design capacity of 500tons per day. The mill operateduntil the fall of 1988, when boththe mill and the Lisbon Minewere closed. The mill has beenpermanently closed and the siteis being reclaimed.
Energy Fuels, Inc., openedthe White Mesa Mill, whichincluded a vanadium circuit,south of Blanding during 1980at a cost of approximately $40million. The company alsooperated an ore buying stationat the mill site and custommilled ores. The mill wastemporarily idled in 1991 due tolow uranium prices. The millwas reopened in the fall of 1995.The White Mesa Mill waspurchased by the InternationalUranium Corp. in May, 1997.International Uranium closedthe mines supplying the mill inJune, 1999 and decided to focuson processing alternative feedmaterials, which are uranium-bearing materials other thannatural ores. These alternativefeed materials are primarilyf r o m s i t e s t h a t a r econtaminated with uranium andare being cleaned-up forenvironmental purposes. Thestate Division of RadiationControl initially challenged thelegal right of the mill to acceptthe alternative feed materials,claiming the facility was actingas an unlicenced waste disposalsite; however, a federaladministrative law judge foundin favor of Energy Fuels andallowed the practice to continue.

September/October 2000 UTAH ECONOMIC AND BUSINESS REVIEW 6
BUREAU OF ECONOMIC AND BUSINESS RESEARCH
Plateau Resources, a whollyowned subsidiary of ConsumersPower Corp., started buyingand stockpiling ore for aproposed mill in 1977. Thec o m p a n y s u b s e q u e n t l ydeveloped the ShootaringCanyon Mill and Ticabootownsite north of Bullfrog inGarfield County. The mill onlyoperated on a trial basis for twomonths in mid-summer 1982.Consumers Power placed themill on standby because itcanceled construction of anadditional nuclear power plant.US Energy Corp., purchased allof the outstanding stock ofPlateau Resources fromConsumers Power for a nominalcash consideration in August,1993. US Energy is working torehabilitate the mill and plansto reopen the operation. USE n erg y i s c o n s i d e r i n gprocessing alternative feedmaterials in the ShootaringMill.
Uranium production hit alow of 858 thousand pounds ofU3O8 in 1984 before recoveringto a 30-year high of 5,320thousand pounds of U3O8 in1987. No production occurredfrom 1991 to 1994. Productionin 1999 was estimated to be 608thousand pounds of U3O8.Approximately two-thirds of thiswas from uranium ore, while theother third was from alternativefeed materials. No productionoccurred during 2000, butI n t e r n a t i o n a l U r a n i u mstockpiled alternative feedmaterials at the White MesaMill and plans on processingthem during 2001.
EfficiencyThe large amounts of
capital investment in recent
years has resulted in largeproductivity increases. Theproductivity increases are aresult of both economies of scalethat were realized when smallero p e r a t i o n s c l o s e d a n dproduction consolidated to theremaining large operations, andtechnology and mechanizationreplacing human labor. Thecopper industry demonstrateshow productivity has increasedin the past 30 years (Figure 1).In 1970, the copper miningindustry produced, on average,46 tons of copper per year pere m p l o y e e . P r o d u c t i v i t yremained in this range until thelate 1980s. Productivity incopper mining increased from 51tons per employee in 1985 to146 tons per employee in 1990.Copper mining productivityfurther increased to 197 tonsper employee in 1998. This largeincrease in productivity wasmostly due to modernization atthe Bingham Canyon facility.The productivity increase from1985 to 1990 corresponded withmine modernization andbuilding the Coppertonconcentrator while the increasefrom 1995 to 1998 correspondedwith the new smelter comingonline.
Several of the preciousmetal operations throughoutUtah over the past severaldecades were a result of newt e c h n o l o g y t h a t w a sdevelopment during the 1970sand 1980s. The heap leachtechnology that BarrickResources used at Mercur,Tenneco Minerals/USMX usedat the Goldstrike Mine andNorth Lily used in the TinticDistrict was developed at thistime. Using earlier technologies,the Goldstrike and North Lily
projects probably would nothave become operational andproduction at Mercur wouldhave been lower.
Employment and Wages M eta l m i n i n g h a s
maintained its position has oneof the highest-paying industriesin the state, while employmenthas decreased. In 1970, theUtah metal mining industryemployed 9,073 individuals(Figure 2). Employment droppedto 7,318 in 1973 beforerecovering to 8,962 in 1979.Employment then droppedprecipitously to 2,770 in 1986, adrop of 69 percent in 7 years.This large employment dropcoincided with several layoffs atthe Kennecott Bingham CanyonMine (the operation wase v e n t u a l l y c l o s e d f o rmodernization in 1985),Anaconda idling the Carr Forkproperty in 1981, and the Atlasuranium mill closure in 1984.Employment recovered to 3,093in 1990, but has since declinedto an average annualemployment of 2,384 in 1999.
In terms of employment,metal mining is becoming anincreasingly small portion ofboth the Utah mining industryand the Utah economy. In 1970,metal mining was responsiblefor 70.0 percent of miningemployment in Utah. Theremaining 30.0 percent wasdistributed across coal mining,oil and gas extraction, andindustrial minerals mining. By1999, metal mining employmenthad dropped to 30.7 percent oftotal mining employment. Interms of percentage of totals t a t e n o n a g r i c u l t u r a lemployment, metal miningdropped from 2.54 percent of all

September/October 2000 UTAH ECONOMIC AND BUSINESS REVIEW 7
BUREAU OF ECONOMIC AND BUSINESS RESEARCH
employment in Utah in 1970 to0.23 percent in 1999.
In 1970, total wages paid bythe metal mining industry inUtah were $85,032,156 (Figure3). Total metal mining wagespeaked at $251,608,409 in 1981,declined to $64,176,984 in 1986,and recovered to $143,832,803in 1997. Wages paid by the Utahmetal mining industry in 1999were $126,687,239. While totalwages paid have generallyincreased over the past 30years, the rate of increase hasbeen lower than that for totalnonagricultural wages paid inUtah. Between 1970 and 1999,total wages paid by the Utahmetal mining industryincreased 1.4 percent annually.Over the same time period, totalnonagricultural wages paid inUtah increased 9.2 percentannually. In 1970, metal miningwas responsible for 3.75 percentof all nonagricultural wagespaid in Utah. In 1999, metalmining was responsible for 0.44percent of all nonagriculturalwages paid in Utah.
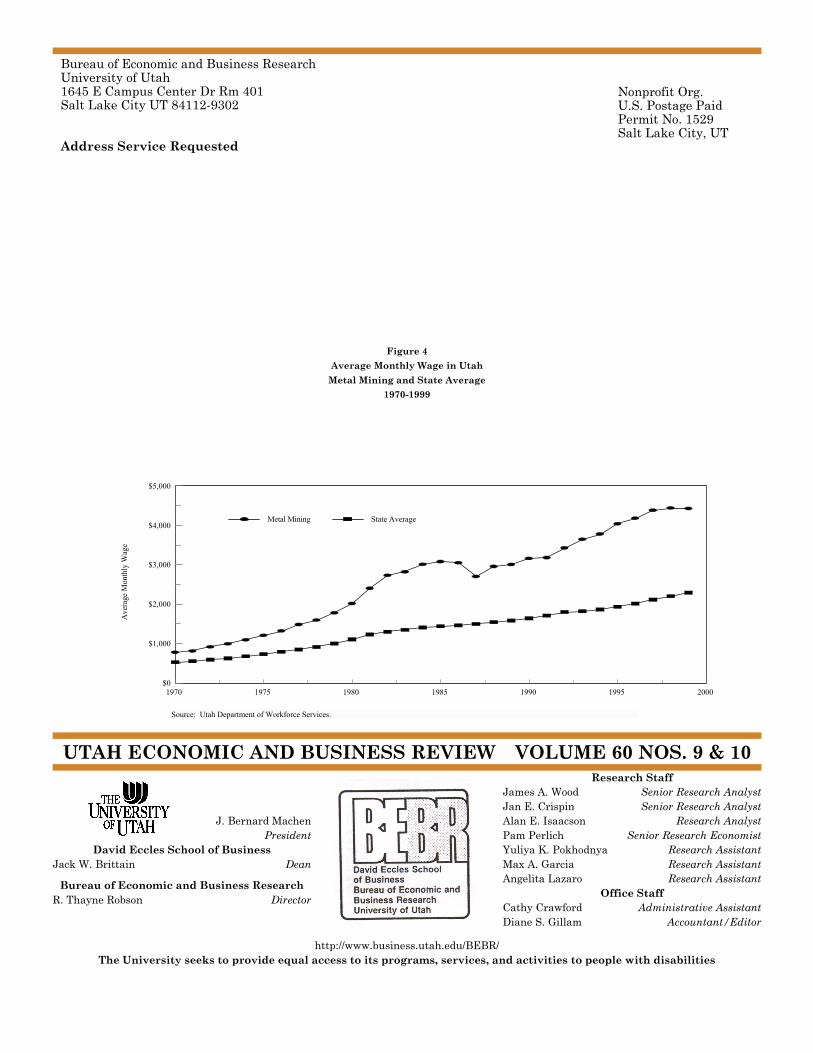
One bright spot in theeconomics of the metal miningindustry is the average monthlywage paid. Over the past 30years, the average monthlywage in the metal miningindustry has consistently beenhigher than the state averagenonagricultural monthly wageand has increased at a higherrate (Figure 4). The averagemetal mining monthly wageincreased from $781 in 1970 to$4,430 in 1999, an annualincrease of 6.2 percent. Over thesame time period, the stateaverage nonagri cu l turalmonthly wage increased from$529 to $2,291, an averageannual increase of 5.2 percent.
This increase in averageannual wage was necessitatedby the increased efficiencies andautomation that has occurredover the past 30 years. Asmechanization and technologyhas replaced human labor in themetal mining industry, a moreeducated, and higher paid,workforce has been required. In1970, the average monthly wagein the metal mining industrywas 148 percent of the statewideaverage monthly wage. By 1999,the average metal miningmonthly wage had increased to193 percent of the state average.
SummaryWhile metal mining will
undoubtedly continued to shrinkas a proportion of Utah’seconomy, the industry willremain in Utah and continue toprovide high paying jobs. TheKennecott Bingham CanyonMine is a world class copperproducer and should continue soin the near term. The majorityof the world’s beryllium supplyis mined and processed in Utahwhile MagCorp is a majorplayer in the magnesiummarket . The successfuloperations are continuing tomake capital investmentsnecessary to increase operatingefficiencies and lower costs.
While not at levelsexperienced in the past,exploration and developmentprojects continue to beundertaken at Utah properties.Su mmo Corporat i on i sconducting a feasibility study ona 20 thousand ton per yearcopper mine in the LisbonValley south of Moab. ChiefConsolidated Mining is workingto reopen the Trixie and BurginMines near Eureka and recently
obtained a $7 mil l ioninvestment in the company.
The Utah minerals industrywill continue to be significant ona worldwide basis into theforeseeable future, although itsportion of Utah’s economy willcontinue to shrink as the overalleconomy continues to expand.While increased efficiencyallows Utah’s metal miningoperations to compete on aglobal scale the result is loweremployment. Similarly, thesignificance of metal mining inthe nation’s economy isdecreasing as the metal miningindustry moves overseas todeveloping countries, notably toSouth America and Asia.
ReferencesAssociated Press. “White Mesauranium mill’s disposal of radioactivewaste deemed legal.” Deseret News,February 11, 1999.
Atlas Corp., SEC Form 10-K405.April 15, 1999
Baker, C. E., and D. K. Sparling.Design and Development of the WhiteMesa Uranium Mill. MiningEngineering. April, 1981. Society ofMining Engineers. pp. 382-385.
Brush Wellman Inc., SEC Form 10-K. March 31, 1999.
Chief Consolidated AnnouncesFurther Details Regarding Sale ofShares. Chief Consolidated MiningCompany Press Release, datedNovember 23, 1999.
International Uranium Corp., SECForm 20-F/A. July 20, 1999.
International Uranium Corp., SECForm 6-K. August 31, 1999.
Kennecott plans 32 kt/d (35,000 stpd)increase at Utah Copper. MiningEngineering. February, 1990. Societyfor Mining, Metallurgy, andExploration. p. 156.
Kennecott Plans Mid-Year SmelterStartup. Mining Engineering. May,1978. Society of Mining Engineers. p.445.

September/October 2000 UTAH ECONOMIC AND BUSINESS REVIEW 8
BUREAU OF ECONOMIC AND BUSINESS RESEARCH
0
50
100
150
200
Pro
duct
ivit
y (t
ons
per
empl
oyee
)
1970 1975 1980 1985 1990 1995 2000
Source: BEBR calculation.
Modernization breaths life back intoB i n g h a m C a n y o n . M i n i n gEngineering. February, 1986. MiningEngineering. February, 1986. Societyof Mining Engineers. p. 82.
Newman, C. J., T. I. Probert, and A.J. Weddick. Kennecott Utah Coppersmelter modernization. MiningEngineering. July, 1999. Society forMining Metallurgy, and Exploration.pp. 39-45.
Renco Metals Inc., SEC Form 10-K405. Jan. 29, 1999.
Rio Tinto quarterly production reportfor the quarter ended 31 December1 9 9 9 . A c c e s s e d a thttp://www.riotinto.com.
Spangles, Jerry. “State claimsauthority over White Mesashipments.” The Deseret News,January 20, 1999.
Summo Corporation. SummoMinerals Corporation AnnouncesContinued Exploration Drilling forLisbon Valley Project. SummoCorporation Press Release, datedNovember 30, 1999.
Summo Corporation. Increased OreReserves at Lisbon Valley CopperProject. Summo Corporation PressRelease, dated August 21, 2000.
U. S. Department of the Interior,Bureau of Mines, Minerals Yearbook,1970-1994 editions.
U. S. Department of the Interior, U.S. Geological Survey, MineralsYearbook, 1995-1998 editions.
US Energy Corp., SEC Form 10-K.August 30, 1999.
Utah Department of WorkforceServices, Annual Report of LaborMarket Information, 1999.
Wolf, Jim. “Ruling: Uranium mill tokeep recycling waste.” The Salt LakeTribune, February 18, 2000.
Figure 1
Copper Mine Productivity in Utah
1970-1999

Table 1Production of Selected Metals in Utah
1970-1999
Year
BerylliumHydroxide
Concentrate (tons)
Copper(tons)
Gold(troy oz.)
Iron Ore(thous. long
tons)Lead(tons)
ManganeseOre
(tons)Silver
(thous. troy oz.)
Uranium(thous. lbs.
U3O8
Vanadium(tons)
Zinc(tons)
1970 w 295,738 408,029 1,990 45,377 700 6,030 1,635 257 34,688 1971 w 263,451 368,966 1,681 38,270 112 5,294 1,445 226 25,701 1972 w 259,507 362,413 1,788 20,706 0 4,300 1,496 188 21,853 1973 w 256,589 307,080 1,986 13,733 0 3,619 1,961 142 16,800 1974 w 230,593 254,909 1,808 10,510 0 3,208 1,860 w 12,619 1975 w 177,155 189,620 1,334 12,679 0 2,822 2,020 w 19,640 1976 w 185,458 187,318 w 16,297 0 3,134 2,410 w 22,481 1977 w 193,722 210,501 1,932 10,724 0 3,283 2,460 w 17,722 1978 w 204,963 235,929 1,961 2,795 0 2,885 2,810 w 3,860 1979 w 212,390 260,916 1,618 w 0 2,454 2,810 w 5 1980 w 173,553 179,538 1,307 w 0 2,203 2,400 w w 1981 w 232,404 227,706 691 1,828 0 2,883 4,490 w 1,734 1982 w 207,999 174,940 w w 0 4,342 2,890 w 0 1983 w 186,726 238,459 w 0 0 4,567 1,370 w 0 1984 6,030 139,891 w 0 w 0 w 860 w w 1985 5,738 50,063 135,489 0 0 0 w 1,560 w w 1986 6,533 w 43,039 w 0 0 w 5,770 w 0 1987 6,062 w w w 0 0 w 5,320 w 0 1988 5,839 212,000 406,390 w 0 0 w 2,800 w 0 1989 5,839 253,200 w w 0 0 w 3,800 w 0 1990 5,003 260,416 w w 0 0 4,737 3,400 w 0 1991 4,773 260,150 748,450 w 0 0 w 0 0 0 1992 5,309 318,234 801,554 424 0 0 w 0 0 0 1993 5,433 w w w 0 0 w 0 0 0 1994 4,763 w w w 0 0 w 0 0 0 1995 5,544 w 755,000 w 0 0 4,100 1,500 0 0 1996 5,786 327,470 775,000 0 0 0 4,800 660 0 0 1997 6,336 335,610 730,000 0 0 0 4,916 560 0 0 1998 6,325 328,020 449,000 0 0 0 4,247 80 0 0 1999 6.490 307,230 479,000 0 0 0 3,859 608 0 0 w: Withheld to avoid disclosing individual company data.Source: U. S. Bureau of Mines. U. S. Geological Survey. State Office of Energy and Resource Planning. Rio Tinto plc.

September/October 2000 UTAH ECONOMIC AND BUSINESS REVIEW 10
BUREAU OF ECONOMIC AND BUSINESS RESEARCH
0
2,000
4,000
6,000
8,000
10,000
Em
ploy
men
t
1970 1975 1980 1985 1990 1995 2000
Source: Utah Department of Workforce Services
50
100
150
200
250
300
Tot
al W
ages
(m
illi
ons
of d
olla
rs)
1970 1975 1980 1985 1990 1995 2000
Source: Utah Department of Workforce Services.
Figure 2Metal Mining Employment in Utah
1970-1999
Figure 3Metal Mining Wages in Utah
1970-1999

September/October 2000 UTAH ECONOMIC AND BUSINESS REVIEW 11
BUREAU OF ECONOMIC AND BUSINESS RESEARCH
Utah Business Statistics
UTAH DATA
July
1999
July
2000% Change from
Year Ago
12-MonthAverage Current
Year
12-MonthAverage Last
Year
12-MonthAverage %
ChangeTotal Personal Income (seas. adj. at ann. rates, mil. of dol., qtly.) na na na 51,414.8 47,557 8.1 New Corporations (no.) 601 454 -24.5 611.2 1,287 -52.5 New Car, Truck, and Motor Home Sales (no.) 7,682 na na 6,974.8 6,982 -0.1 Agriculture Average Prices Received by Farmers (dol.) Lambs (cwt.) 76.00 83.00 9.2 83.2 69.86 19.1 Milk, All (cwt.) 1 12.70 na na 13.6 15.03 -9.5 Barley (per bushel) 1.83 1.83 0.0 1.9 1.84 4.9 Alfalfa Hay, Baled (per ton) 2 67.00 74.00 10.4 72.5 74.92 -3.2 Commercial Red Meat Production (thous. of lbs.) 41,700 41,500 -0.5 40,875.0 40,870 0.0 Construction Total Permit Construction (thous. of dol.) 350,514.5 311,549.2 -11.1 343,214.7 313,531.0 9.5 Residential 205,993.8 181,704.4 -11.8 184,485.5 182,821.3 0.9 Nonresidential 78,014.8 81,788.7 4.8 112,182.7 89,051.6 26.0 Additions, Alterations, and Repairs 66,505.9 48,056.1 -27.7 46,546.4 41,658.0 11.7 New Dwelling Units (no.) 1,739 1,468 -15.6 1,614.6 1,696.8 -4.8 Employment 3
Civilian Labor Force (thous.) 1,098.9 1,127.5 2.6 1,104.4 1,084.5 1.8 Employed 1,054.7 1,091.7 3.5 1,070.2 1,045.4 2.4 Unemployed 44.1 35.8 -18.8 34.3 39.3 -12.8 Percent of Labor Force 4.0 3.2 -20.0 3.1 3.6 -14.3 Nonagricultural Jobs (thous.) 1,042.3 1,066.0 2.3 1,064.9 1,038.5 2.5 Mining 7.9 8.1 2.5 7.8 7.8 -0.2 Contract Construction 76.6 78.5 2.5 75.1 70.9 6.0 Manufacturing 132.2 132.8 0.5 132.9 133.2 -0.2 Transportation, Communications, and Utilities 59.9 60.8 1.5 59.9 59.1 1.4 Wholesale Trade 51.2 52.5 2.5 51.3 50.4 1.8 Retail Trade 198.1 201.7 1.8 199.8 195.9 2.0 Finance, Insurance, and Real Estate 56.6 57.1 0.9 57.5 56.4 1.9 Services 4 295.2 304.8 3.3 298.7 287.5 3.9 Federal Government 31.1 33.3 7.1 31.9 30.9 3.4 State Government 5 52.9 54.1 2.3 57.1 55.7 2.5 Local Government 5 80.6 82.3 2.1 92.7 90.7 2.2 Average Weekly Hours Mining 42.9 43.4 1.2 46.0 45.4 1.3 Manufacturing 39.3 39.9 1.5 39.8 40.5 -1.6 Wholesale Trade 39.7 38.8 -2.3 38.9 39.0 -0.4 Retail Trade 28.5 28.3 -0.7 28.0 28.4 -1.6 Amount of Unemployment Compensation (thous. of dol.) 6,409.6 8,049.1 25.6 7,925.3 6,978.0 13.6 Finance (qtly.) Total State and National Chartered In-State Banks na na na 32 32 -1.6 Total Assets (mil. of dol.) na na na 29,935.2 27,182.7 10.1 Total Liabilities (mil. of dol.) na na na 27,516.2 27,493.7 0.1 Total Equity Capital (mil. of dol.) na na na 2,419.0 2,189.1 10.5 Capital to Assets 6 na na na 8.9 8.9 0.0 Loan Loss Reserve Ratio na na na 1.3 1.34 -3.6 Loans to Assets na na na 63.8 63.74 0.1 Temporary Investment Ratio na na na 11.2 11.84 -5.0 Return on Assets na na na 1.2 0.88 33.7 Production Crude Oil (thous. of bbls.) 1,355.3 1,317.7 -2.8 1,316.9 1,440.0 -8.6 Natural Gas (mil. of cu. ft.) 22,675.7 23,600.5 4.1 22,587.6 24,360.0 -7.3 Coal (thous. short tons) 1,799 2,009 11.7 3,432.8 2,287 50.1 Crude Oil to Refineries, Barrels Received (thous. of bbls.) 4,395 4,313 -1.9 4,134.2 4,242 -2.5 Travel/Tourism Air Passengers (total no. on and off, S.L. Int'l. Airport) 1,932,356 1,952,573 1 1,630,405.1 1,674,478 -3 Highway Traffic Count Across State Lines (both directions) 86,217 87,444 1 67,135.2 63,821 5 Visits to State and National Parks and Monuments 2,604,474 1,529,841 -41 1,270,817.0 1,345,256 -6 Utilities Natural Gas Customers (residential and commercial) 666,333 687,330 3.2 677,158.9 657,363 3.0 Natural Gas Customers (industrial) 1,080 1,058 -2.0 1,073.8 1,048 2.5 Telephone Lines in Service (U.S. West, residential access) 759,767 na na 774,998.2 749,556 3.4 Telephone Lines in Service (U.S. West, business/public access) 349,166 na na 352,345.1 346,375 1.7

September/October 2000 UTAH ECONOMIC AND BUSINESS REVIEW 12
BUREAU OF ECONOMIC AND BUSINESS RESEARCH
Utah Business Statistics
UTAH DATA
July
1999
July
2000% Change from
Year Ago
12-MonthAverage
Current Year
12-MonthAverage Last
Year
12-MonthAverage %
ChangeDavis County Nonagricultural Employment (thous.) 83.2 86.3 3.7 83.8 81.8 2.5 Unemployment Rate (seasonally adjusted) 3.7 3.0 -18.9 2.9 3.3 -12.7 Authorized Permit Construction (thous. of dol.) 31,199.7 21,584.4 -30.8 25,943.1 30,891.2 -16.0 New Dwelling Units (no.) 191 134 -29.8 169 199 -15.1 New Car, Truck, and Motor Home Sales, Owner's County (no.) 831 na na 721 779 -7.4 Natural Gas Customers (residential and commercial) 72,529 74,798 3.1 73,713 71,058 3.7 Natural Gas Customers (industrial) 94 96 2.1 95 98 -2.7 Telephone Lines in Service (U.S. West, residential access) 91,393 na na 93,341 89,605 4.2 Telephone Lines in Service (U.S. West, business access) 26,582 na na 26,959 26,239 2.7
Salt Lake County Nonagricultural Employment (thous.) 529.6 540.4 2.0 539.4 526.8 2.4 Unemployment Rate (seasonally adjusted) 3.5 2.6 -25.7 2.8 3.2 -11.8 Authorized Permit Construction (thous. of dol.) 99,412.0 107,180.5 7.8 124,890.5 107,531.7 16.1 New Dwelling Units (no.) 325 349 7.4 405 448 -9.4 New Car, Truck, and Motor Home Sales, Owner's County (no.) 4,233 na na 3,639 3,400 7.0 Natural Gas Customers (residential and commercial) 286,583 292,234 2.0 287,929 283,599 1.5 Natural Gas Customers (industrial) 486 467 -3.9 484 474 2.0 Telephone Lines in Service (U.S. West, residential access) 343,433 na na 346,500 340,405 1.8 Telephone Lines in Service (U.S. West, business access) 194,688 na na 195,216 193,730 0.8
Utah County Nonagricultural Employment (thous.) 142.5 146.0 2.5 148.2 143.5 3.3 Unemployment Rate (seasonally adjusted) 3.3 2.4 -27.3 2.5 3.1 -19.9 Authorized Permit Construction (thous. of dol.) 73,419.4 70,657.8 -3.8 60,606.1 56,994.3 6.3 New Dwelling Units (no.) 319 360 12.9 342 317 7.6 New Car, Truck, and Motor Home Sales, Owner's County (no.) 683 na na 815 729 11.8 Natural Gas Customers (residential and commercial) 94,888 99,375 4.7 97,639 93,184 4.8 Natural Gas Customers (industrial) 146 154 5.5 149 141 5.7 Telephone Lines in Service (U.S. West, residential access) 108,028 na na 111,160 106,202 4.7 Telephone Lines in Service (U.S. West, business access) 44,319 na na 45,611 44,102 3.4
Weber County Nonagricultural Employment (thous.) 87.9 88.8 1.0 89.1 87.2 2.1 Unemployment Rate (seasonally adjusted) 5.0 4.2 -16.0 3.8 4.4 -13.5 Authorized Permit Construction (thous. of dol.) 46,952.1 19,727.1 -58.0 35,189.2 25,566.2 37.6 New Dwelling Units (no.) 294 68 -76.9 135 143 -5.4 New Car, Truck, and Motor Home Sales, Owner's County (no.) 408 na na 460 419 9.7 Natural Gas Customers (residential and commercial) 65,129 66,577 2.2 66,242 64,280 3.1 Natural Gas Customers (industrial) 107 103 -3.7 103 106 -2.4 Telephone Lines in Service (U.S. West, residential access) 63,873 na na 64,570 63,264 2.1 Telephone Lines in Service (U.S. West, business access) 22,737 na na 22,885 22,583 1.3 na Not Available1 Before deductions for hauling and government withholding; includes quality, quantity and other premiums. Excludes hauling subsidies. 2 Mid-month prices. 3 Some figures not strictlycomparable due to reclassification. 4 Includes services by nonprofit and religious organizations. 5 Includes public schools and college institutions. 6 Includes allowance for loan losses.Sources:Personal Income U.S. Department of Commerce, Bureau of Economic Analysis.New Corporations Utah Department of Commerce, Division of Corporations and Commercial Code.New Car and Truck Sales Utah State Tax Commission, Economic and Statistics Unit, Utah Car and Truck Sales.Agriculture U.S. Department of Agriculture, Utah Agricultural Statistics Service, Utah Agriculture.Construction Data Bureau of Economic and Business Research, University of Utah, Utah Construction Report.Employment Data Utah Department of Workforce Services, Utah Labor Market Report.Finance Data Utah Department of Financial Institutions.Crude Oil Production Utah Division of Oil, Gas and Mining, Oil and Gas Production Report, and Utah Office of Energy and
Resource Planning.Natural Gas Production Utah Division of Oil, Gas and Mining, Oil and Gas Production Report.Coal Production U.S. Department of Energy, Energy Information Administration.Air Passengers SLC International Airport, Statistics Division, Air Traffic Statistics and Activity Report.Highway Traffic Count Utah Department of Transportation, Automatic Traffic Recorder Data Report.Visits to State and National Parks and Monuments U.S. Forest Service and Utah State Parks and Recreation Department.Utilities Data Cooperating Utility Companies.

September/October 2000 UTAH ECONOMIC AND BUSINESS REVIEW 13
BUREAU OF ECONOMIC AND BUSINESS RESEARCH
Utah Business Statistics
UTAH DATA
August
1999
August
2000% Change from
Year Ago
12-MonthAverage Current
Year
12-MonthAverage Last
Year
12-MonthAverage %
ChangeTotal Personal Income (seas. adj. at ann. rates, mil. of dol., qtly.) na na na 51,415 47,557 8.1 New Corporations (no.) 572 1,500 162.2 689 1,274 -46.0 New Car, Truck, and Motor Home Sales (no.) 7,857 na na 6,887 7,010 -1.8 Agriculture Average Prices Received by Farmers (dol.) Lambs (cwt.) 76.00 83.0 9.2 83.75 69.69 20.2 Milk, All (cwt.) 1 13.30 na na 13.68 14.91 -8.3 Barley (per bushel) 1.85 1.8 -1.6 1.92 1.84 4.8 Alfalfa Hay, Baled (per ton) 2 74.00 84.0 13.5 73.33 74.33 -1.3 Commercial Red Meat Production (thous. of lbs.) 46,100 46,300 0.4 40,892 41,211 -0.8 Construction Total Permit Construction (thous. of dol.) 423,408.8 422,398.1 -0.2 343,130.4 320,491.5 7.1 Residential 222,452.3 219,242.8 -1.4 184,218.1 183,922.6 0.2 Nonresidential 125,396.0 145,907.4 16.4 113,892.0 92,494.8 23.1 Additions, Alterations, and Repairs 75,560.5 57,247.9 -24.2 45,020.4 44,074.1 2.1 New Dwelling Units (no.) 1,997 2,048 2.6 1,619 1,696 -4.5 Employment 3
Civilian Labor Force (thous.) 1,098.9 1,126.9 2.5 1,106.8 1,086.1 1.9 Employed 1,054.8 1,088.9 3.2 1,073.0 1,047.0 2.5 Unemployed 44.1 38.0 -13.8 33.8 39.2 -13.9 Percent of Labor Force 4.0 3.4 -15.0 3.1 3.6 -15.2 Nonagricultural Jobs (thous.) 1,048.3 1,073.3 2.4 1,067.0 1,040.5 2.5 Mining 7.9 7.9 0.0 7.8 7.8 -0.0 Contract Construction 77.4 79.1 2.2 75.3 71.2 5.7 Manufacturing 132.5 133.0 0.4 133.0 133.1 -0.1 Transportation, Communications, and Utilities 59.9 61.0 1.8 60.0 59.2 1.5 Wholesale Trade 51.4 52.7 2.5 51.4 50.5 1.9 Retail Trade 199.5 202.9 1.7 200.1 196.2 2.0 Finance, Insurance, and Real Estate 56.8 57.3 0.9 57.5 56.5 1.9 Services 4 297.6 309.2 3.9 299.7 288.6 3.8 Federal Government 31.1 32.8 5.5 32.1 30.9 3.7 State Government 5 53.8 54.9 2.0 57.2 55.8 2.5 Local Government 5 80.4 82.5 2.6 92.9 90.9 2.2 Average Weekly Hours Mining 42.3 40.7 -3.8 45.8 44.9 2.1 Manufacturing 39.2 40.3 2.8 39.9 40.4 -1.1 Wholesale Trade 39.8 38.1 -4.3 38.7 39.1 -1.0 Retail Trade 28.8 28.4 -1.4 27.9 28.4 -1.7 Amount of Unemployment Compensation (thous. of dol.) 7,338.0 7,020.7 -4.3 7,898.8 7,452.2 6.0 Finance (qtly.) Total State and National Chartered In-State Banks na na na 32 32 -1.6 Total Assets (mil. of dol.) na na na 29,935.2 27,182.7 10.1 Total Liabilities (mil. of dol.) na na na 27,516.2 27,493.7 0.1 Total Equity Capital (mil. of dol.) na na na 2,419.0 2,189.1 10.5 Capital to Assets 6 na na na 8.90 8.90 0.0 Loan Loss Reserve Ratio na na na 1.29 1.34 -3.6 Loans to Assets na na na 63.78 63.74 0.1 Temporary Investment Ratio na na na 11.25 11.84 -5.0 Return on Assets na na na 1.18 0.88 33.7 Production Crude Oil (thous. of bbls.) 1,380.0 1,305.8 -5.4 1,310.7 1,420.8 -7.8 Natural Gas (mil. of cu. ft.) 22,316.3 23,616.3 5.8 22,695.9 24,024.0 -5.5 Coal (thous. short tons) 1,802 2,240 24.3 3,469 2,250 54.2 Crude Oil to Refineries, Barrels Received (thous. of bbls.) 4,490 4,233 -5.7 4,113 4,180 -1.6 Travel/Tourism Air Passengers (total no. on and off, S.L. Int'l. Airport) 1,566,331 1,934,267 23.5 1,661,066 1,642,272 1.1 Highway Traffic Count Across State Lines (both directions) 84,861 83,241 -1.9 66,988 64,008 4.7 Visits to State and National Parks and Monuments 2,525,626 1,308,053 -48.2 1,169,353 1,340,684 -12.8 Utilities Natural Gas Customers (residential and commercial) 666,043 686,253 3.0 678,843 659,316 3.0 Natural Gas Customers (industrial) 1,080 1,056 -2.2 1,072 1,052 1.9 Telephone Lines in Service (U.S. West, residential access) 763,238 na na 776,174 752,154 3.2 Telephone Lines in Service (U.S. West, business/public access) 345,412 na na 353,038 346,620 1.9

September/October 2000 UTAH ECONOMIC AND BUSINESS REVIEW 14
BUREAU OF ECONOMIC AND BUSINESS RESEARCH
Utah Business Statistics
UTAH DATA
August
1999
August
2000% Change from
Year Ago
12-MonthAverage
Current Year
12-MonthAverage Last
Year
12-MonthAverage %
ChangeDavis County Nonagricultural Employment (thous.) 83.8 86.9 3.7 84.0 82.0 2.5 Unemployment Rate (seasonally adjusted) 3.5 2.9 -17.1 2.8 3.3 -14.0 Authorized Permit Construction (thous. of dol.) 30,606.5 30,192.7 -1.4 25,908.6 30,530.9 -15.1 New Dwelling Units (no.) 212 172 -18.9 166 202 -18.1 New Car, Truck, and Motor Home Sales, Owner's County (no.) 853 na na 708 777 -8.9 Natural Gas Customers (residential and commercial) 72,155 74,601 3.4 73,916 71,306 3.7 Natural Gas Customers (industrial) 94 95 1.1 95 98 -2.4 Telephone Lines in Service (U.S. West, residential access) 92,003 na na 93,474 89,967 3.9 Telephone Lines in Service (U.S. West, business access) 26,328 na na 27,022 26,274 2.8
Salt Lake County Nonagricultural Employment (thous.) 531.9 545.2 2.5 540.5 527.7 2.4 Unemployment Rate (seasonally adjusted) 3.2 2.8 -12.5 2.8 3.2 -12.1 Authorized Permit Construction (thous. of dol.) 132,946.9 157,270.1 18.3 126,917.5 110,529.5 14.8 New Dwelling Units (no.) 574 727.0 26.7 418 450 -7.1 New Car, Truck, and Motor Home Sales, Owner's County (no.) 4,370 na na 3,566 3,422 4.2 Natural Gas Customers (residential and commercial) 286,192 291,155 1.7 288,342 284,409 1.4 Natural Gas Customers (industrial) 485 467 -3.7 482 476 1.3 Telephone Lines in Service (U.S. West, residential access) 344,441 na na 346,705 341,220 1.6 Telephone Lines in Service (U.S. West, business access) 192,200 na na 195,517 193,730 0.9
Utah County Nonagricultural Employment (thous.) 144.5 148.6 2.8 148.6 143.8 3.3 Unemployment Rate (seasonally adjusted) 3.1 2.6 -16.1 2.4 3.1 -21.3 Authorized Permit Construction (thous. of dol.) 82,152.6 76,392.6 -7.0 60,126.1 59,084.9 1.8 New Dwelling Units (no.) 388 369.0 -4.9 340 329 3.4 New Car, Truck, and Motor Home Sales, Owner's County (no.) 745 na na 822 722 13.9 Natural Gas Customers (residential and commercial) 95,297 99,887 4.8 98,021 93,552 4.8 Natural Gas Customers (industrial) 146 154 5.5 150 142 5.6 Telephone Lines in Service (U.S. West, residential access) 108,487 na na 111,428 106,678 4.5 Telephone Lines in Service (U.S. West, business access) 43,892 na na 45,783 44,133 3.7
Weber County Nonagricultural Employment (thous.) 87.7 88.6 1.0 89.2 87.4 2.0 Unemployment Rate (seasonally adjusted) 4.3 4.3 0.0 3.8 4.3 -11.5 Authorized Permit Construction (thous. of dol.) 23,776.4 23,623.6 -0.6 35,176.5 25,129.1 40.0 New Dwelling Units (no.) 136 244 79.4 144 143 0.8 New Car, Truck, and Motor Home Sales, Owner's County (no.) 455 na na 460 414 11.1 Natural Gas Customers (residential and commercial) 64,963 66,109 1.8 66,337 64,450 2.9 Natural Gas Customers (industrial) 107 102 -4.7 103 106 -2.8 Telephone Lines in Service (U.S. West, residential access) 64,188 na na 64,609 63,451 1.8 Telephone Lines in Service (U.S. West, business access) 22,209 na na 22,953 22,562 1.7 na Not Available1 Before deductions for hauling and government withholding; includes quality, quantity and other premiums. Excludes hauling subsidies. 2 Mid-month prices. 3 Some figures not strictlycomparable due to reclassification. 4 Includes services by nonprofit and religious organizations. 5 Includes public schools and college institutions. 6 Includes allowance for loan losses.Sources:Personal Income U.S. Department of Commerce, Bureau of Economic Analysis.New Corporations Utah Department of Commerce, Division of Corporations and Commercial Code.New Car and Truck Sales Utah State Tax Commission, Economic and Statistics Unit, Utah Car and Truck Sales.Agriculture U.S. Department of Agriculture, Utah Agricultural Statistics Service, Utah Agriculture.Construction Data Bureau of Economic and Business Research, University of Utah, Utah Construction Report.Employment Data Utah Department of Workforce Services, Utah Labor Market Report.Finance Data Utah Department of Financial Institutions.Crude Oil Production Utah Division of Oil, Gas and Mining, Oil and Gas Production Report, and Utah Office of Energy and
Resource Planning.Natural Gas Production Utah Division of Oil, Gas and Mining, Oil and Gas Production Report.Coal Production U.S. Department of Energy, Energy Information Administration.Air Passengers SLC International Airport, Statistics Division, Air Traffic Statistics and Activity Report.Highway Traffic Count Utah Department of Transportation, Automatic Traffic Recorder Data Report.Visits to State and National Parks and Monuments U.S. Forest Service and Utah State Parks and Recreation Department.Utilities Data Cooperating Utility Companies.
September/October 2000 UTAH ECONOMIC AND BUSINESS REVIEW 15
BUREAU OF ECONOMIC AND BUSINESS RESEARCH
Utah Business Statistics
NATIONAL DATA
August
1999
August
2000% Change
from Year Ago
12-MonthAverage
Current Year
12-MonthAverage Last
Year
12-MonthAverage %
Change
U.S. Gross Domestic Product (seas. adj. at ann. rates, bil., qrtly.) na na na 9,401.1 8,725.3 7.7 Total Personal Income (seas. adj. at ann. rates, bil. of dol.) 7,837.0 8,330.2 6.3 8,117.2 7,389.1 9.9 Industrial Production Index (seasonally adjusted, 1992=100) 135.6 145.9 7.6 142.9 134.6 6.2 Capacity Utilization Rate (seasonally adjusted, percent) 80.8 82.4 2.0 81.6 80.3 1.7 Net Exports of Goods & Services (millions of dollars; seasonally adj.) -24,095.0 -29,860.0 23.9 -28,311.8 -14,553.7 94.5 Exports of Goods & Services (millions of dollars; seasonally adj.) 82,027.0 92,968.0 13.3 86,131.8 78,485.6 9.7 Imports of Goods & Services (millions of dollars; seasonally adj.) 106,122.0 122,774.0 15.7 114,439.2 97,236.5 17.7 Composite Index of 11 Leading Indicators (1992=100) 108.0 105.7 -2.1 106.3 106.9 -0.6
Price Indexes Consumer Price Indexes (not seasonally adjusted, 1982-84=100) CPI-U (All Urban Consumers) All Items 167.2 172.8 3.3 170.3 165.2 3.1 CPI-U (All Urban Consumers) Food and Beverages 164.8 169.2 2.7 167.0 163.5 2.1 CPI-U (All Urban Consumers) Housing 164.1 170.9 4.1 167.3 162.5 3.0 CPI-U (All Urban Consumers) Transportation 146.0 153.2 4.9 150.9 146.8 2.8 CPI-U (All Urban Consumers) Medical Care 252.1 262.6 4.2 257.2 247.4 3.9 CPI-U (All Urban Consumers) Energy 108.9 125.9 15.6 118.9 103.0 15.4 Producer Price Index (not seasonally adjusted, 1982=100) Producer Price Index, All Finished Goods 133.7 137.8 3.1 136.3 131.7 3.5 GDP Implicit Price Deflator (seasonally adjusted, 1992=100, qrtly.) na na na 105.5 113.3 -6.9
Corporate Profits (seas. adj. at ann. rates, bil., qrtly.) Profits Before Taxes na na na 905.7 745.1 21.6 Profits-Tax Liability na na na 279.6 245.9 13.7 Profits After Taxes na na na 626.1 499.2 25.4
Civilian Employment (seasonally adjusted) Labor Force (mil.) 139.3 140.7 1.0 140.5 138.8 1.2 Employment (mil.) 133.4 134.9 1.1 134.8 132.8 1.4 Unemployment Rate 4.2 4.1 -2.4 4.1 4.3 -5.8
Value of New Construction Put In Place Total Construction (seas. adj. at ann. rates, bil. of dol.) 755.3 800.3 6.0 795.4 753.0 5.6 Private Const.: Residential (seas. adj. at ann. rates, bil. of dol.)b 348.1 349.0 0.3 359.4 340.4 5.6 New Housing Units (seas. adj. at ann. rates, bil. of dol.) 248.4 253.9 2.2 260.1 243.6 6.8 Private Const.: Nonresidential (seas. adj. at ann. rates, bil. of dol.) 191.3 221.6 15.8 208.1 196.3 6.0
Interest Rates Federal Funds Rate 5.07 6.5 28.2 5.85 4.91 19.2 Discount Rate on New 91-Day Treasury Bills 4.76 6.0 26.1 5.49 4.45 23.6 Yield on Long-Term Treasury Bonds 6.07 5.7 -5.8 6.10 5.51 10.8 Average Prime Rate Charged by Banks 8.06 9.5 17.9 8.85 7.90 12.0 Mortgage Rate (conventional 1st mortgage, new home, U.S. avg.) 7.94 8.0 1.1 8.05 7.06 14.0
na Not Availableb Includes residential improvements, not shown separately.Sources:U.S. Gross Domestic Product U.S. Department of Commerce, Survey of Current Business.Total Personal Income U.S. Department of Commerce, Survey of Current Business.Industrial Production Index Board of Governors of the Federal Reserve System, Federal Reserve Bulletin.Capacity Utilization Rate Board of Governors of the Federal Reserve System, Federal Reserve Bulletin.Export/Import Data U.S. Department of Commerce, Survey of Current Business.Composite Index of 11 Leading Indicators The Conference Board, Inc.Consumer Price Indices U.S. Department of Labor, Bureau of Labor Statistics, Monthly Labor Review.Producer Price Index U.S. Department of Labor, Bureau of Labor Statistics, Monthly Labor Review.GDP Implicit Price Deflator U.S. Department of Commerce, Survey of Current Business.Corporate Profits U.S. Department of Commerce, Survey of Current Business.National Employment Data U.S. Department of Labor, Bureau of Labor Statistics, Monthly Labor Review.National Construction Data U.S. Department of Commerce, Bureau of the Census, Value of New Construction Put in Place.Interest Rates Board of Governors of the Federal Reserve System, Federal Reserve Bulletin.
$0
$1,000
$2,000
$3,000
$4,000
$5,000
Ave
rage
Mon
thly
Wag
e
1970 1975 1980 1985 1990 1995 2000
Metal Mining State Average
Source: Utah Department of Workforce Services.
Bureau of Economic and Business ResearchUniversity of Utah1645 E Campus Center Dr Rm 401Salt Lake City UT 84112-9302
Address Service Requested
Nonprofit Org.U.S. Postage PaidPermit No. 1529Salt Lake City, UT
Figure 4Average Monthly Wage in Utah
Metal Mining and State Average1970-1999
UTAH ECONOMIC AND BUSINESS REVIEW VOLUME 60 NOS. 9 & 10
J. Bernard MachenPresident
David Eccles School of BusinessJack W. Brittain Dean
Bureau of Economic and Business ResearchR. Thayne Robson Director
Research StaffJames A. Wood Senior Research AnalystJan E. Crispin Senior Research AnalystAlan E. Isaacson Research AnalystPam Perlich Senior Research EconomistYuliya K. Pokhodnya Research AssistantMax A. Garcia Research AssistantAngelita Lazaro Research Assistant
Office StaffCathy Crawford Administrative AssistantDiane S. Gillam Accountant/Editor
http://www.business.utah.edu/BEBR/The University seeks to provide equal access to its programs, services, and activities to people with disabilities