Embed Size (px)
Citation preview
Utah Division of Air Quality 2016 Annual Report
Memory Grove Park, Salt Lake City
Division of Air Quality – 2016 Annual Report
ii
Table of Contents Introduction .................................................................................................................................................................2 2016 Synopsis ............................................................................................................................................................2 Air Quality Standards ..................................................................................................................................................3 Ambient Air Quality in Utah ........................................................................................................................................6
Utah’s Air Monitoring Network ................................................................................................................................6 NAAQS Nonattainment & Maintenance Areas .......................................................................................................7 Criteria Air Pollutants ..............................................................................................................................................9
Carbon Monoxide (CO) ......................................................................................................................................9 Nitrogen Dioxide (NO2) ................................................................................................................................... 11 Ozone (O3) ...................................................................................................................................................... 12 Particulate Matter (PM) ................................................................................................................................... 15 Sulfur Dioxide (SO2) ........................................................................................................................................ 20 Lead (Pb) ........................................................................................................................................................ 21
Emissions Inventories .............................................................................................................................................. 23 Sources of Air Contaminants .............................................................................................................................. 23 Triennial Emissions Inventory ............................................................................................................................. 24
Division Organization ............................................................................................................................................... 29 Planning Branch .................................................................................................................................................. 30
Status of Projects and Initiatives ..................................................................................................................... 30 Ancillary Programs .......................................................................................................................................... 38
Compliance Branch ............................................................................................................................................. 41 Major and Minor Source Compliance ............................................................................................................. 41 Air Toxics, Lead-Based Paint, and Asbestos Section (ATLAS) ...................................................................... 42 Small Business Environmental Assistance Program (SBEAP) ...................................................................... 43 Enforcement Actions ....................................................................................................................................... 43
Permitting Branch ................................................................................................................................................ 44 New Source Review ........................................................................................................................................ 45 Operating Permits ........................................................................................................................................... 45
List of Tables Table 1. EPA Designated Criteria Pollutants ..............................................................................................................4 Table 2. Ambient Air Quality Standards for Criteria Air Pollutants .............................................................................5 Table 3. Utah Monitoring Network Stations ................................................................................................................6 Table 4. 2014 Triennial Inventory (tons/year) .......................................................................................................... 25 Table 5. Major and Minor Source Compliance Summary........................................................................................ 41 Table 6. ATLAS Activity Summary .......................................................................................................................... 43
List of Figures
Figure 1. Utah Nonattainment Areas ..........................................................................................................................7 Figure 2. Utah Maintenance Areas .............................................................................................................................8 Figure 3. Carbon Monoxide Second Highest 1-Hour Concentration ....................................................................... 10 Figure 4. Carbon Monoxide Second Highest 8-Hour Concentration ....................................................................... 10 Figure 5. Three-Year Average Nitrogen Dioxide Hourly Averages (PPB) ............................................................... 11 Figure 6. Nitrogen Dioxide Annual Averages .......................................................................................................... 12 Figure 7. Ozone 4th Highest 8-Hour Concentration ................................................................................................ 13 Figure 8. Three-Year Average 4th Highest 8-Hour Ozone Concentration .............................................................. 14 Figure 9. PM10 Second Highest 24-Hour Concentration ......................................................................................... 16 Figure 10. PM10 Second Highest 24-Hour Excluding Exceptional Events .............................................................. 17 Figure 11. PM2.5 Three-Year Average 98th Percentile 24-Hour Concentration ...................................................... 18
Division of Air Quality – 2016 Annual Report
iii
Figure 12. PM2.5 Annual Mean Concentration ......................................................................................................... 19 Figure 13. PM2.5 Three-Year Average of the Annual Mean Concentration ............................................................. 19 Figure 14. Sulfur Dioxide Three-Year Average of 99th Percentile of Daily Maximum One-Hour Averages ........... 21 Figure 15. Lead Max Three-Month Average 24-Hour Concentration ...................................................................... 22 Figure 16. 2014 Triennial Emissions Inventory by Source Category – Statewide, Annual (tons/year) ................... 26 Figure 17. SO2 Milestones and Emission Trends .................................................................................................... 37
Division of Air Quality – 2016 Annual Report
iv
Acronyms
AO Approval Order AHERA Asbestos Hazard Emergency Response Act ATLAS Air Toxics, Lead-Based Paint, and Asbestos Section AMS Air Monitoring Section BACT Best Available Control Technology CAA Clean Air Act CFR Code of Federal Regulations CO Carbon Monoxide DAQ Division of Air Quality DEQ Department of Environmental Quality EPA Environmental Protection Agency HAPs Hazardous Air Pollutants MACT Maximum Available Control Technology µg/m3 Micrograms Per Cubic Meter Micron One Millionth of a Meter NAAQS National Ambient Air Quality Standards NESHAP National Emissions Standards for Hazardous Air Pollutants NOI Notice of Intent NO2 Nitrogen Dioxide NOx Nitrogen Oxides NSPS New Source Performance Standard NSR New Source Review O3 Ozone PB Lead PM Particulate Matter PM10 Particulate Matter Smaller Than 10 Microns in Diameter PM2.5 Particulate Matter Smaller Than 2.5 Microns in Diameter PPB Parts Per Billion PPM Parts Per Million SBEAP Small Business Environmental Assistance Program SIP State Implementation Plan SO2 Sulfur Dioxide SOx Sulfur Oxides TSCA Toxic Substances Control Act TSP Total Suspended Particles UAC Utah Administrative Code UBWOS Uinta Basin Wintertime Ozone Study VOCs Volatile Organic Compounds
Division of Air Quality – 2016 Annual Report
1
NOTE THIS REPORT IS INTENDED TO PROVIDE AN OVERVIEW OF UTAH’S AIR QUALITY PROGRAM. THIS REPORT IS PUBLISHED BEFORE END-OF-YEAR DATA CAN BE AUDITED AND MAY BE SUBJECT TO CHANGE.
Division of Air Quality – 2016 Annual Report
2
Introduction The mission of the Utah Division of Air Quality (DAQ) is to protect public health and the environment from the harmful effects of air pollution, while, to the greatest degree practicable, preventing injury to plant and animal life and property, fostering the comfort and convenience of the people of Utah, promoting the economic and social development of the state, and facilitating the enjoyment of the natural attractions of this state. It is the responsibility of the DAQ to ensure that the air in Utah meets health and visibility standards established under the federal Clean Air Act (CAA). To fulfill this responsibility, the DAQ is required by the federal government to ensure compliance with the U.S. Environmental Protection Agency’s (EPA) National Ambient Air Quality Standards (NAAQS) statewide and visibility standards at national parks. The DAQ enacts rules pertaining to air quality standards, develops plans to meet the federal standards when necessary, issues preconstruction and operating permits to stationary sources, and ensures compliance with state and federal air quality rules. The DAQ allocates a large portion of its resources to implementing the CAA. The Utah Air Conservation Act (Utah Code § 19-2) delegates rulemaking power to the Utah Air Quality Board (Board) to promulgate rules pertaining to air quality issues. DAQ staff supports the Board in its policy-making role. The Board is made up of nine members representing local government, environmental groups, the public, industry, and the Executive Director of the Department of Environmental Quality. The Board members have diverse interests, are knowledgeable in air pollution matters, and are appointed by the Governor with consent of the Senate. The Director of the DAQ is the Board’s Executive Secretary. The Utah air quality rules define the Utah air quality program. Implementation of the rules requires the DAQs interaction with industry, other government agencies and the public. The state air quality program is responsible for the implementation of the federal standards under the CAA, as well as state rules for pollution sources not regulated by the CAA. 2016 Synopsis Generally speaking, emissions for criteria air pollutants either stayed the same or continued their downward trends in 2016. The DAQ accomplished much in 2016 towards fulfilling our mission to safeguard human health and quality of life through improving the air quality throughout the state. With an increasing population, industrial base, and more stringent federal air quality standards, it has been a challenge to meet air quality objectives; however, 2016 proved to be a year in which we made great strides to ensure cleaner air in the years to come. The following is a brief list of notable air quality achievements from 2016:
• The Board adopted amendments to the Moderate Area PM2.5 State Implementation Plan (SIP). EPA’s pending approval of the amendments to Part H of the SIP will allow
Division of Air Quality – 2016 Annual Report
3
the DAQ to issue operating permits under Title V of the CAA to several sources that have never had operating permits before.
• The DAQ’s Lawn Mower Discount and Exchange event helped reduce emissions equivalent to removing 424 passenger cars from Utah roads. The event provided 944 electric lawn mowers and 707 electric trimmers at discounted prices. If the participant turned in a gasoline mower to scrap, they received an additional discount. The Legislature did not fund the program during the 2016 legislative session.
• The Governor submitted a geographic recommendation for the Unita Basin and Wasatch Front nonattainment areas for the 2015 Ozone NAAQS to the EPA. The DAQ provided the technical analysis for the recommendation so that the boundaries of the proposed areas would be based on the best available science.
Air Quality Standards The CAA requires the EPA to set NAAQS for pollutants considered harmful to public health and the environment. The CAA establishes two types of air quality standards, primary and secondary. Primary standards are set to protect public health, including the health of sensitive populations such as asthmatics, children, and the elderly. Secondary standards are set to protect public welfare, including protection from decreased visibility and damage to animals, crops, vegetation, and buildings. Standards are composed of a numerical value and a form (see Table 2). The form may be a statistical value, such as the 98th percentile calculation or a rolling average over a designated period of time that is then compared against the numerical value. The EPA has established health-based NAAQS for six pollutants known as criteria pollutants. These are carbon monoxide, nitrogen dioxide, ozone, particulate matter, sulfur dioxide, and lead. Each of these pollutants is addressed in greater detail later in this chapter. Table 1 provides a brief description of each criteria pollutant and Table 2 provides a brief description of each criteria pollutant’s primary and secondary standard. The EPA establishes the primary health standards after considering both the concentration level and the duration of exposure that can cause adverse health effects. Pollutant concentrations that exceed the NAAQS are considered unhealthy for some portion of the population. At concentrations between 1.0 and 1.5 times the standard, while the general public is not expected to be affected by the pollutant, the most sensitive portion of the population may be adversely affected. However, at levels above 1.5 times the standard, even healthy people may see adverse effects. The DAQ monitors each of these criteria pollutants, as well as several non-criteria pollutants for special studies at various monitoring sites throughout the state.
Division of Air Quality – 2016 Annual Report
4
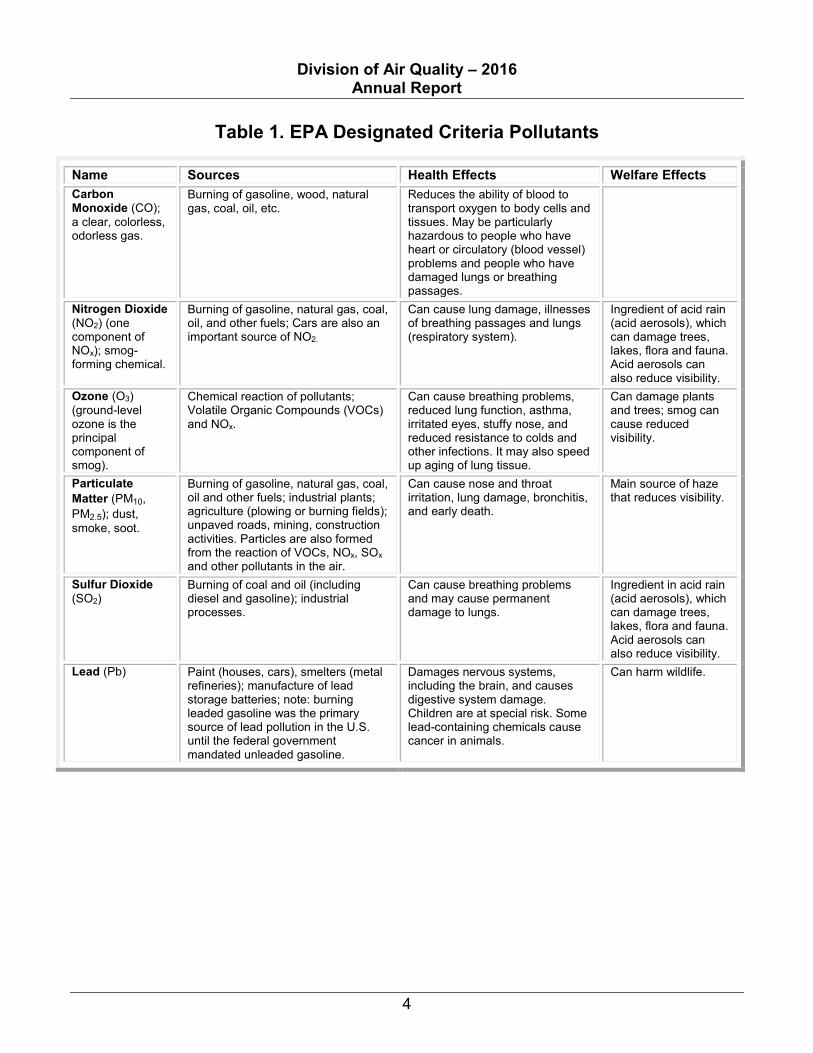
Table 1. EPA Designated Criteria Pollutants
Name Sources Health Effects Welfare Effects Carbon Monoxide (CO); a clear, colorless, odorless gas.
Burning of gasoline, wood, natural gas, coal, oil, etc.
Reduces the ability of blood to transport oxygen to body cells and tissues. May be particularly hazardous to people who have heart or circulatory (blood vessel) problems and people who have damaged lungs or breathing passages.
Nitrogen Dioxide (NO2) (one component of NOx); smog-forming chemical.
Burning of gasoline, natural gas, coal, oil, and other fuels; Cars are also an important source of NO2.
Can cause lung damage, illnesses of breathing passages and lungs (respiratory system).
Ingredient of acid rain (acid aerosols), which can damage trees, lakes, flora and fauna. Acid aerosols can also reduce visibility.
Ozone (O3) (ground-level ozone is the principal component of smog).
Chemical reaction of pollutants; Volatile Organic Compounds (VOCs) and NOx.
Can cause breathing problems, reduced lung function, asthma, irritated eyes, stuffy nose, and reduced resistance to colds and other infections. It may also speed up aging of lung tissue.
Can damage plants and trees; smog can cause reduced visibility.
Particulate Matter (PM10, PM2.5); dust, smoke, soot.
Burning of gasoline, natural gas, coal, oil and other fuels; industrial plants; agriculture (plowing or burning fields); unpaved roads, mining, construction activities. Particles are also formed from the reaction of VOCs, NOx, SOx and other pollutants in the air.
Can cause nose and throat irritation, lung damage, bronchitis, and early death.
Main source of haze that reduces visibility.
Sulfur Dioxide (SO2)
Burning of coal and oil (including diesel and gasoline); industrial processes.
Can cause breathing problems and may cause permanent damage to lungs.
Ingredient in acid rain (acid aerosols), which can damage trees, lakes, flora and fauna. Acid aerosols can also reduce visibility.
Lead (Pb) Paint (houses, cars), smelters (metal refineries); manufacture of lead storage batteries; note: burning leaded gasoline was the primary source of lead pollution in the U.S. until the federal government mandated unleaded gasoline.
Damages nervous systems, including the brain, and causes digestive system damage. Children are at special risk. Some lead-containing chemicals cause cancer in animals.
Can harm wildlife.
Division of Air Quality – 2016 Annual Report
5
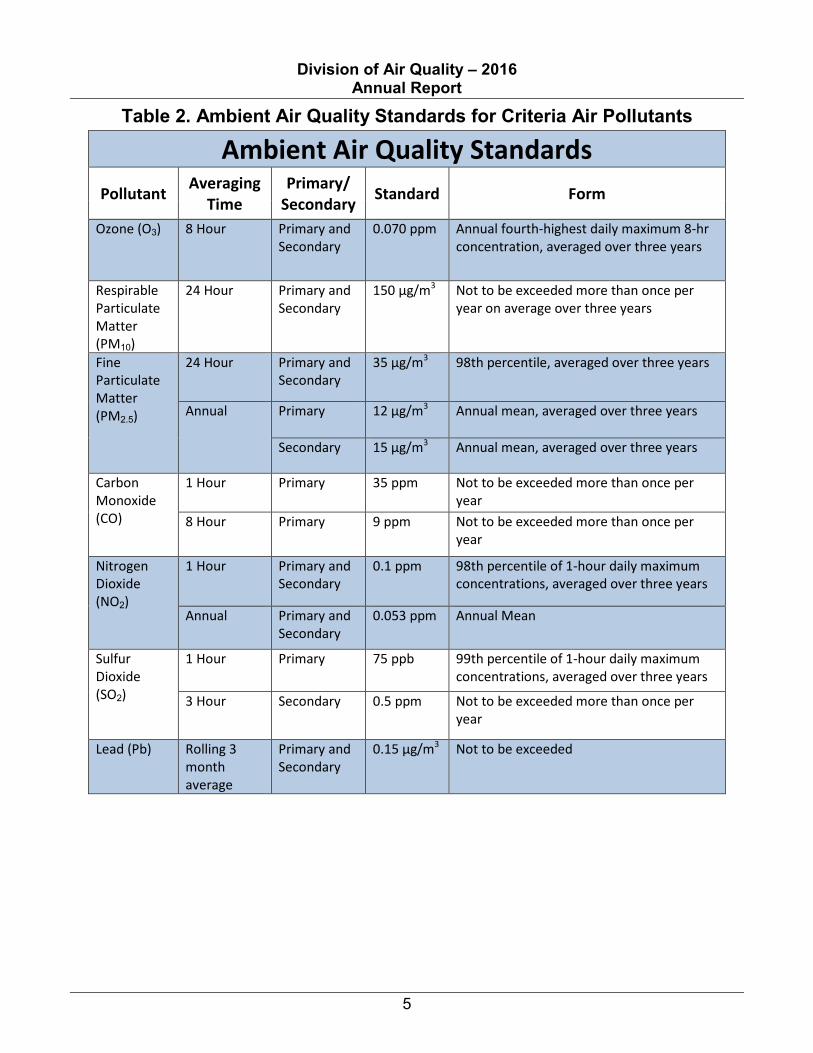
Table 2. Ambient Air Quality Standards for Criteria Air Pollutants
Ambient Air Quality Standards Pollutant Averaging
Time Primary/
Secondary Standard Form
Ozone (O3) 8 Hour Primary and Secondary
0.070 ppm Annual fourth-highest daily maximum 8-hr concentration, averaged over three years
Respirable Particulate Matter (PM10)
24 Hour Primary and Secondary
150 µg/m3 Not to be exceeded more than once per year on average over three years
Fine Particulate Matter (PM2.5)
24 Hour Primary and Secondary
35 µg/m3 98th percentile, averaged over three years
Annual Primary 12 µg/m3 Annual mean, averaged over three years
Secondary 15 µg/m3 Annual mean, averaged over three years
Carbon Monoxide (CO)
1 Hour Primary 35 ppm Not to be exceeded more than once per year
8 Hour Primary 9 ppm Not to be exceeded more than once per year
Nitrogen Dioxide (NO2)
1 Hour Primary and Secondary
0.1 ppm 98th percentile of 1-hour daily maximum concentrations, averaged over three years
Annual Primary and Secondary
0.053 ppm Annual Mean
Sulfur Dioxide (SO2)
1 Hour Primary 75 ppb 99th percentile of 1-hour daily maximum concentrations, averaged over three years
3 Hour Secondary 0.5 ppm Not to be exceeded more than once per year
Lead (Pb) Rolling 3 month average
Primary and Secondary
0.15 µg/m3 Not to be exceeded
Division of Air Quality – 2016 Annual Report
6
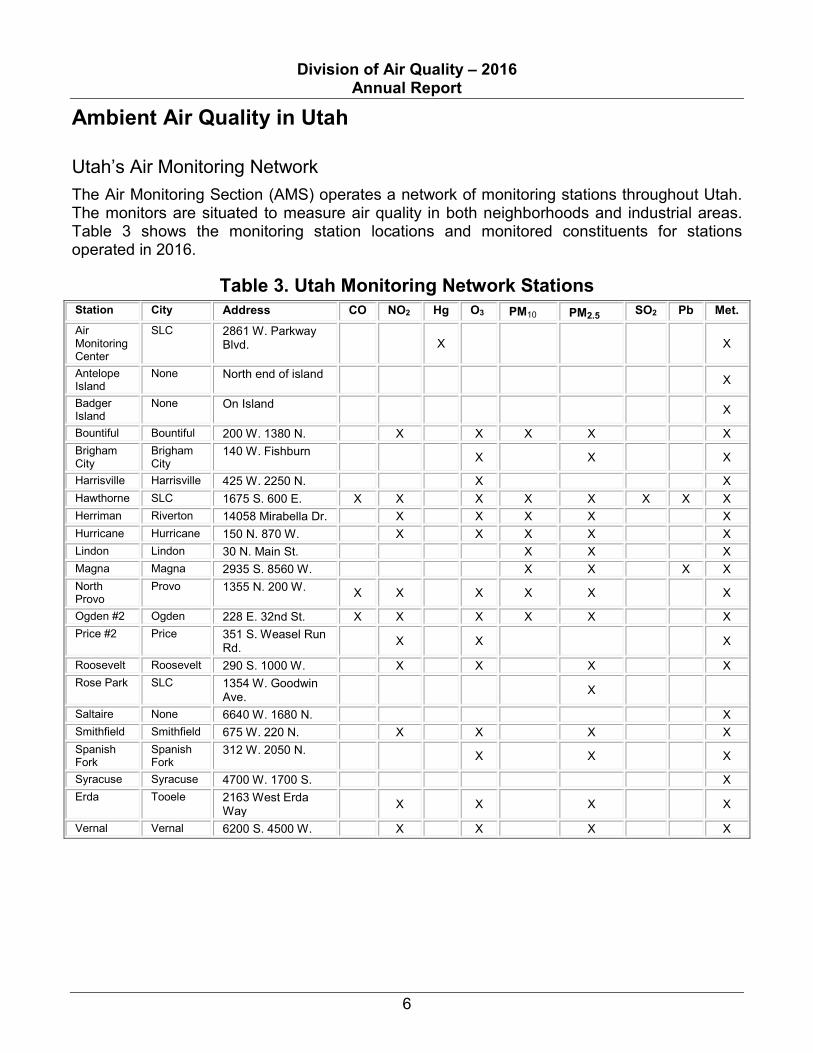
Ambient Air Quality in Utah Utah’s Air Monitoring Network The Air Monitoring Section (AMS) operates a network of monitoring stations throughout Utah. The monitors are situated to measure air quality in both neighborhoods and industrial areas. Table 3 shows the monitoring station locations and monitored constituents for stations operated in 2016.
Table 3. Utah Monitoring Network Stations Station City Address CO NO2 Hg O3 PM10 PM2.5 SO2 Pb Met. Air Monitoring Center
SLC 2861 W. Parkway Blvd. X X
Antelope Island
None North end of island X
Badger Island
None On Island X
Bountiful Bountiful 200 W. 1380 N. X X X X X Brigham City
Brigham City
140 W. Fishburn X X X
Harrisville Harrisville 425 W. 2250 N. X X Hawthorne SLC 1675 S. 600 E. X X X X X X X X Herriman Riverton 14058 Mirabella Dr. X X X X X Hurricane Hurricane 150 N. 870 W. X X X X X Lindon Lindon 30 N. Main St. X X X Magna Magna 2935 S. 8560 W. X X X X North Provo
Provo 1355 N. 200 W. X X X X X X
Ogden #2 Ogden 228 E. 32nd St. X X X X X X Price #2 Price 351 S. Weasel Run
Rd. X X X
Roosevelt Roosevelt 290 S. 1000 W. X X X X Rose Park SLC 1354 W. Goodwin
Ave. X
Saltaire None 6640 W. 1680 N. X Smithfield Smithfield 675 W. 220 N. X X X X Spanish Fork
Spanish Fork
312 W. 2050 N. X X X
Syracuse Syracuse 4700 W. 1700 S. X Erda Tooele 2163 West Erda
Way X X X X
Vernal Vernal 6200 S. 4500 W. X X X X
Division of Air Quality – 2016 Annual Report
7
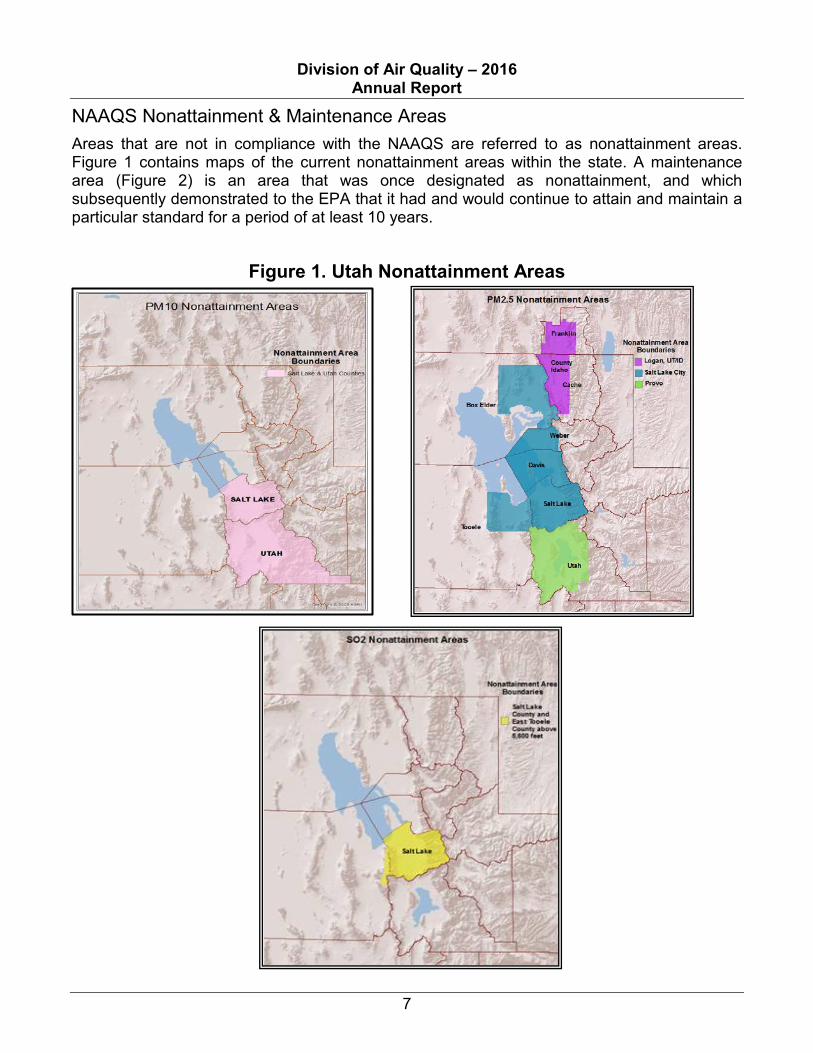
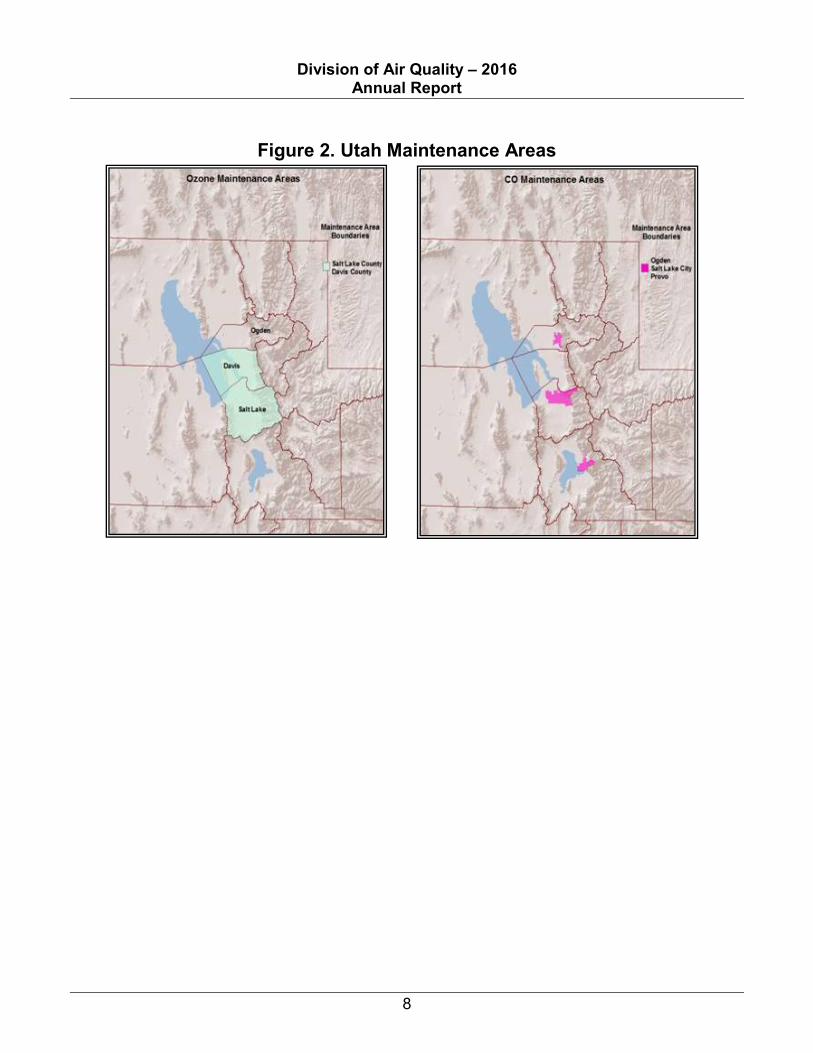
NAAQS Nonattainment & Maintenance Areas Areas that are not in compliance with the NAAQS are referred to as nonattainment areas. Figure 1 contains maps of the current nonattainment areas within the state. A maintenance area (Figure 2) is an area that was once designated as nonattainment, and which subsequently demonstrated to the EPA that it had and would continue to attain and maintain a particular standard for a period of at least 10 years.
Figure 1. Utah Nonattainment Areas
Division of Air Quality – 2016 Annual Report
8
Figure 2. Utah Maintenance Areas
Division of Air Quality – 2016 Annual Report
9
Criteria Air Pollutants
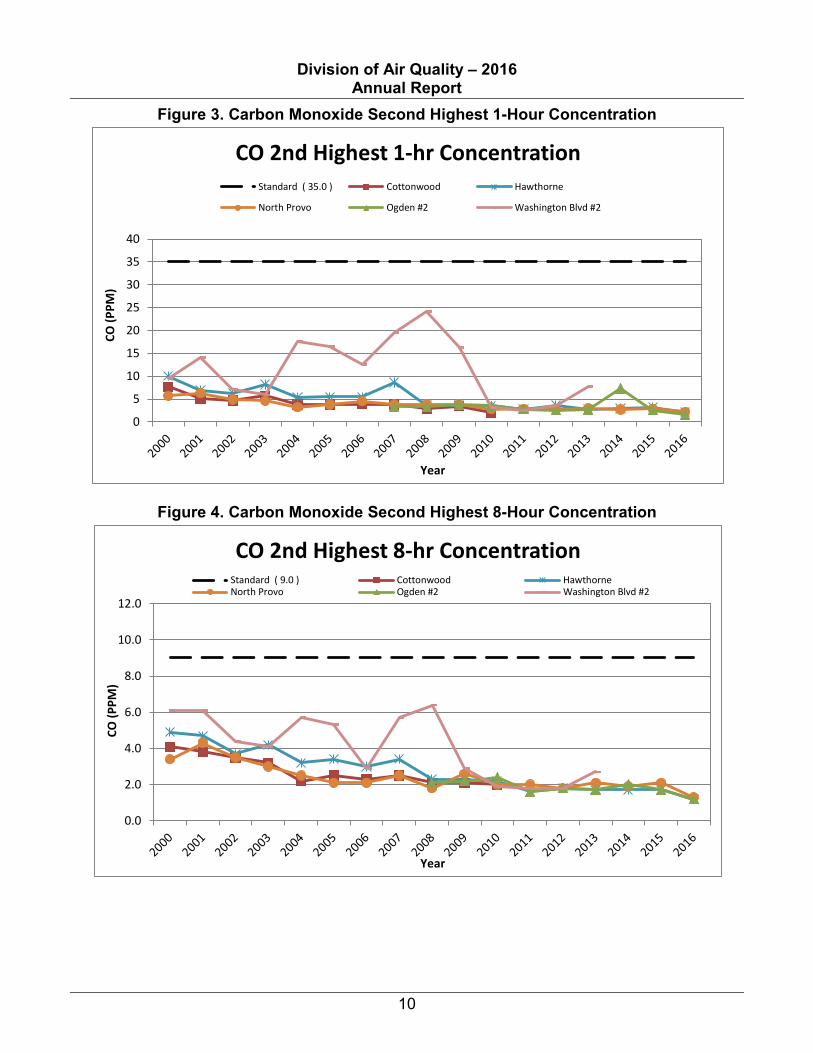
Carbon Monoxide (CO) Carbon monoxide is a colorless and odorless gas formed by the incomplete combustion of carbon-based fuel. Carbon monoxide is primarily produced from on-road motor vehicles. Other significant sources of carbon monoxide emissions are wood burning stoves and fireplaces. The remaining emissions come from industrial facilities, construction equipment, miscellaneous mobile sources and other types of space heating. Because motor vehicle emissions are the major source of carbon monoxide, the highest concentrations occur during morning and evening rush hours near high-traffic areas. The worst problems occur when there are large numbers of slow-moving vehicles in large parking lots, busy intersections, and traffic jams. Historically, as exhibited in the CAA, it was the EPA’s presumption that all elevated carbon monoxide levels were the result of mobile source emissions, and a state had to go through a rigorous demonstration to prove otherwise. In Utah, areas of elevated carbon monoxide concentrations were always found near roadways. Carbon monoxide problems are greater in winter due to several factors: cold weather makes motor vehicles run less efficiently, wood burning and other space heating take place, and temperature inversions trap carbon monoxide near the ground. Standards The EPA has developed two national standards for carbon monoxide. They are 35 ppm of CO averaged over a one-hour period, and 9 ppm of CO averaged over an eight-hour period. A violation of the NAAQS occurs with the second exceedance of either standard at a single location in a calendar year. Once a location is in violation, it is designated as a “nonattainment area.” Three cities in Utah (Salt Lake City, Ogden, and Provo) were at one time designated as nonattainment areas for carbon monoxide. Due primarily to improvements in motor vehicle technology, Utah has been in compliance with the carbon monoxide standards since 1994 (see Figure 3 and Figure 4). Salt Lake City, Ogden, and Provo were successfully re-designated to attainment status in 1999, 2001, and 2006, respectively.
Division of Air Quality – 2016 Annual Report
10
Figure 3. Carbon Monoxide Second Highest 1-Hour Concentration
Figure 4. Carbon Monoxide Second Highest 8-Hour Concentration
0
5
10
15
20
25
30
35
40
CO (P
PM)
Year
CO 2nd Highest 1-hr Concentration Standard ( 35.0 ) Cottonwood Hawthorne
North Provo Ogden #2 Washington Blvd #2
0.0
2.0
4.0
6.0
8.0
10.0
12.0
CO (P
PM)
Year
CO 2nd Highest 8-hr Concentration Standard ( 9.0 ) Cottonwood HawthorneNorth Provo Ogden #2 Washington Blvd #2
Division of Air Quality – 2016 Annual Report
11
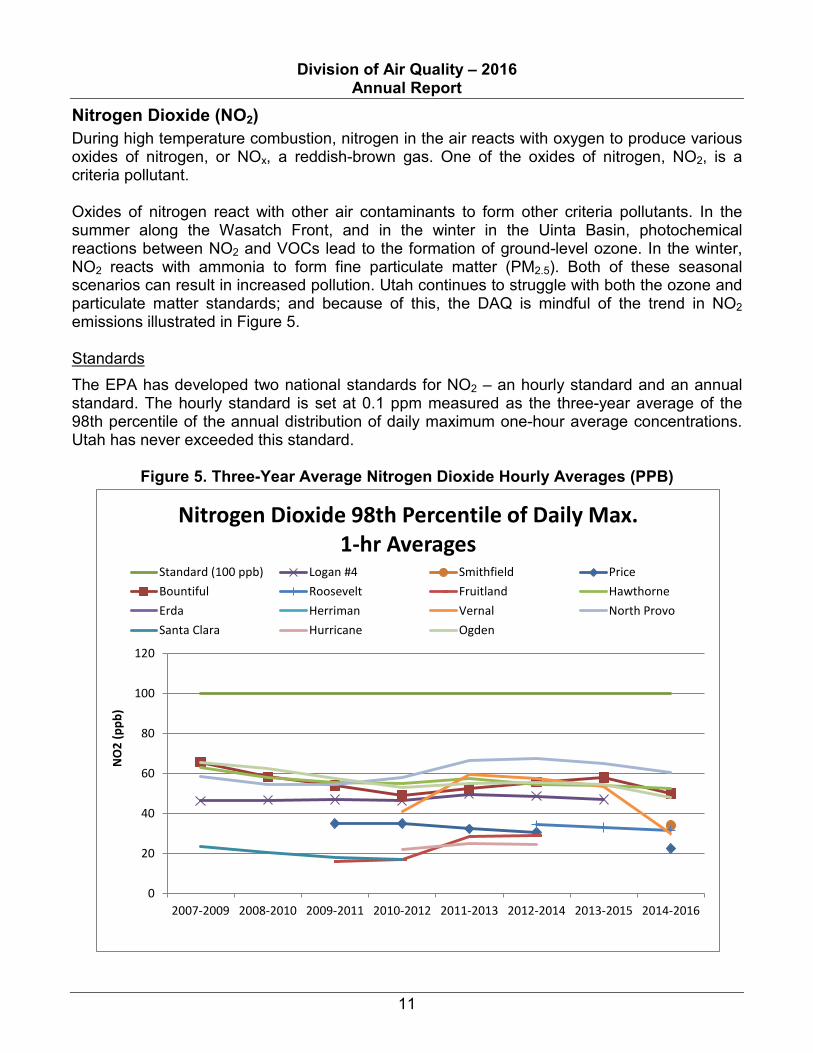
Nitrogen Dioxide (NO2) During high temperature combustion, nitrogen in the air reacts with oxygen to produce various oxides of nitrogen, or NOx, a reddish-brown gas. One of the oxides of nitrogen, NO2, is a criteria pollutant. Oxides of nitrogen react with other air contaminants to form other criteria pollutants. In the summer along the Wasatch Front, and in the winter in the Uinta Basin, photochemical reactions between NO2 and VOCs lead to the formation of ground-level ozone. In the winter, NO2 reacts with ammonia to form fine particulate matter (PM2.5). Both of these seasonal scenarios can result in increased pollution. Utah continues to struggle with both the ozone and particulate matter standards; and because of this, the DAQ is mindful of the trend in NO2 emissions illustrated in Figure 5. Standards The EPA has developed two national standards for NO2 – an hourly standard and an annual standard. The hourly standard is set at 0.1 ppm measured as the three-year average of the 98th percentile of the annual distribution of daily maximum one-hour average concentrations. Utah has never exceeded this standard.
Figure 5. Three-Year Average Nitrogen Dioxide Hourly Averages (PPB)
0
20
40
60
80
100
120
2007-2009 2008-2010 2009-2011 2010-2012 2011-2013 2012-2014 2013-2015 2014-2016
NO
2 (p
pb)
Nitrogen Dioxide 98th Percentile of Daily Max. 1-hr Averages
Standard (100 ppb) Logan #4 Smithfield PriceBountiful Roosevelt Fruitland HawthorneErda Herriman Vernal North ProvoSanta Clara Hurricane Ogden
Division of Air Quality – 2016 Annual Report
12
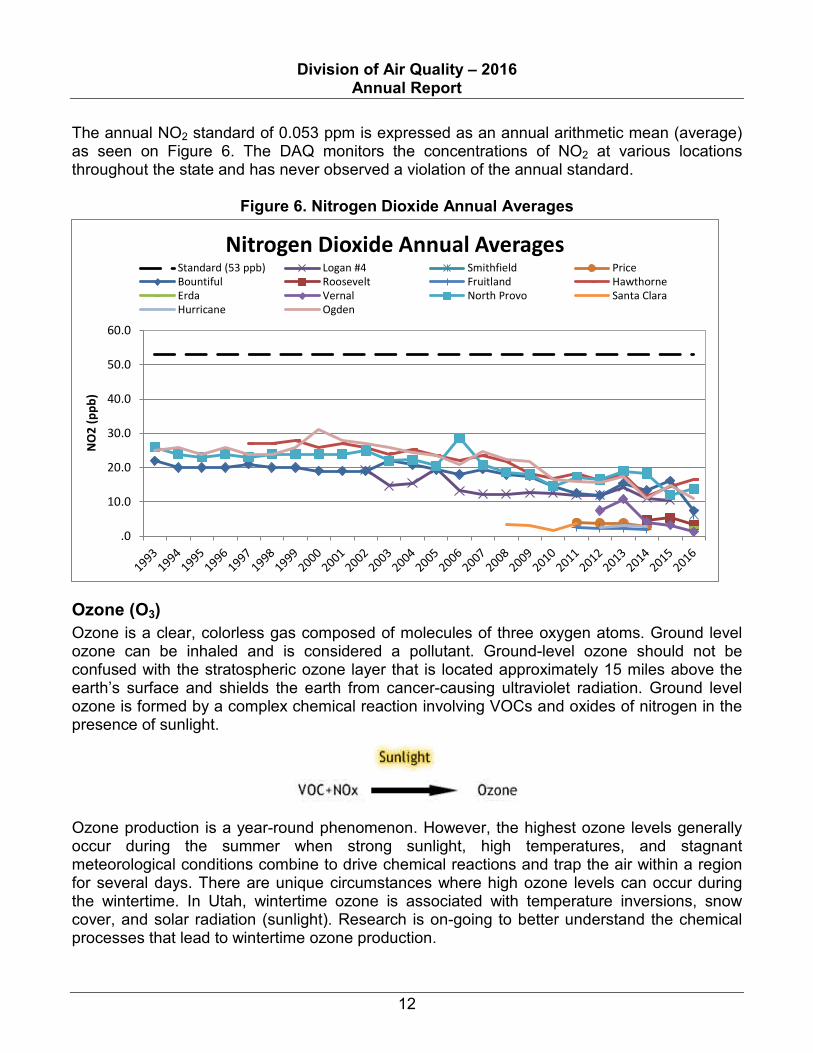
The annual NO2 standard of 0.053 ppm is expressed as an annual arithmetic mean (average) as seen on Figure 6. The DAQ monitors the concentrations of NO2 at various locations throughout the state and has never observed a violation of the annual standard.
Figure 6. Nitrogen Dioxide Annual Averages
Ozone (O3) Ozone is a clear, colorless gas composed of molecules of three oxygen atoms. Ground level ozone can be inhaled and is considered a pollutant. Ground-level ozone should not be confused with the stratospheric ozone layer that is located approximately 15 miles above the earth’s surface and shields the earth from cancer-causing ultraviolet radiation. Ground level ozone is formed by a complex chemical reaction involving VOCs and oxides of nitrogen in the presence of sunlight.
Ozone production is a year-round phenomenon. However, the highest ozone levels generally occur during the summer when strong sunlight, high temperatures, and stagnant meteorological conditions combine to drive chemical reactions and trap the air within a region for several days. There are unique circumstances where high ozone levels can occur during the wintertime. In Utah, wintertime ozone is associated with temperature inversions, snow cover, and solar radiation (sunlight). Research is on-going to better understand the chemical processes that lead to wintertime ozone production.
.0
10.0
20.0
30.0
40.0
50.0
60.0
NO
2 (p
pb)
Nitrogen Dioxide Annual Averages Standard (53 ppb) Logan #4 Smithfield PriceBountiful Roosevelt Fruitland HawthorneErda Vernal North Provo Santa ClaraHurricane Ogden
Division of Air Quality – 2016 Annual Report
13
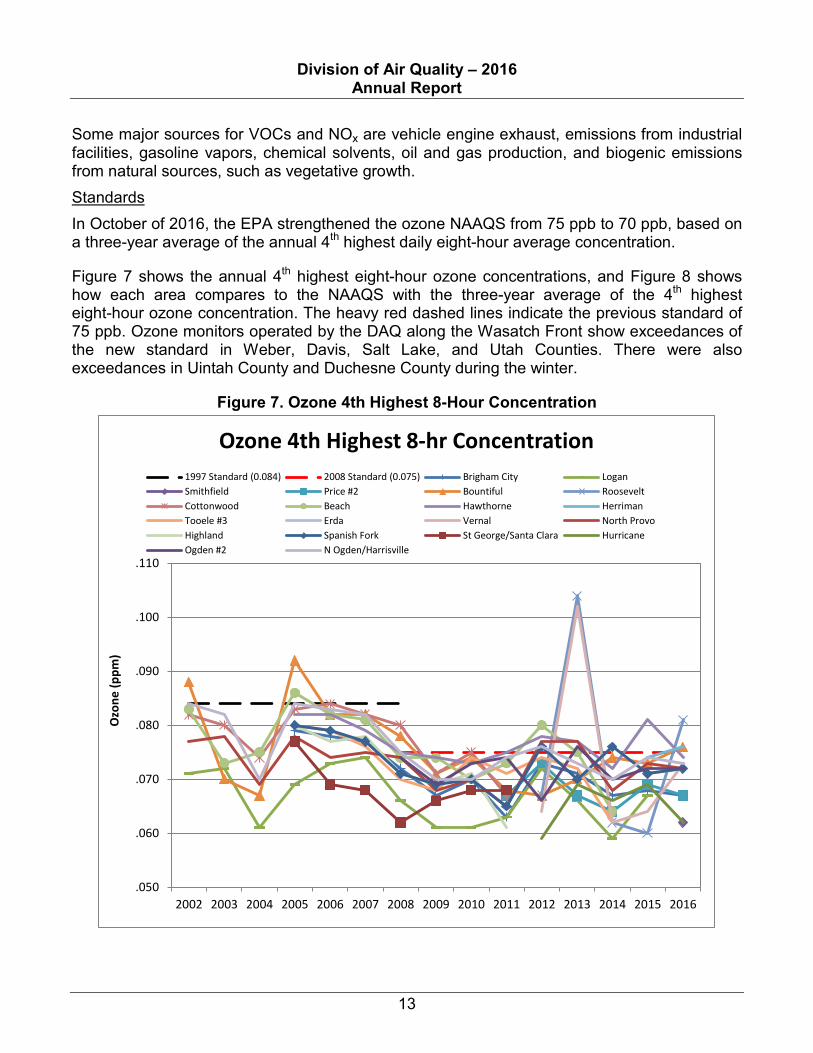
Some major sources for VOCs and NOx are vehicle engine exhaust, emissions from industrial facilities, gasoline vapors, chemical solvents, oil and gas production, and biogenic emissions from natural sources, such as vegetative growth. Standards In October of 2016, the EPA strengthened the ozone NAAQS from 75 ppb to 70 ppb, based on a three-year average of the annual 4th highest daily eight-hour average concentration.
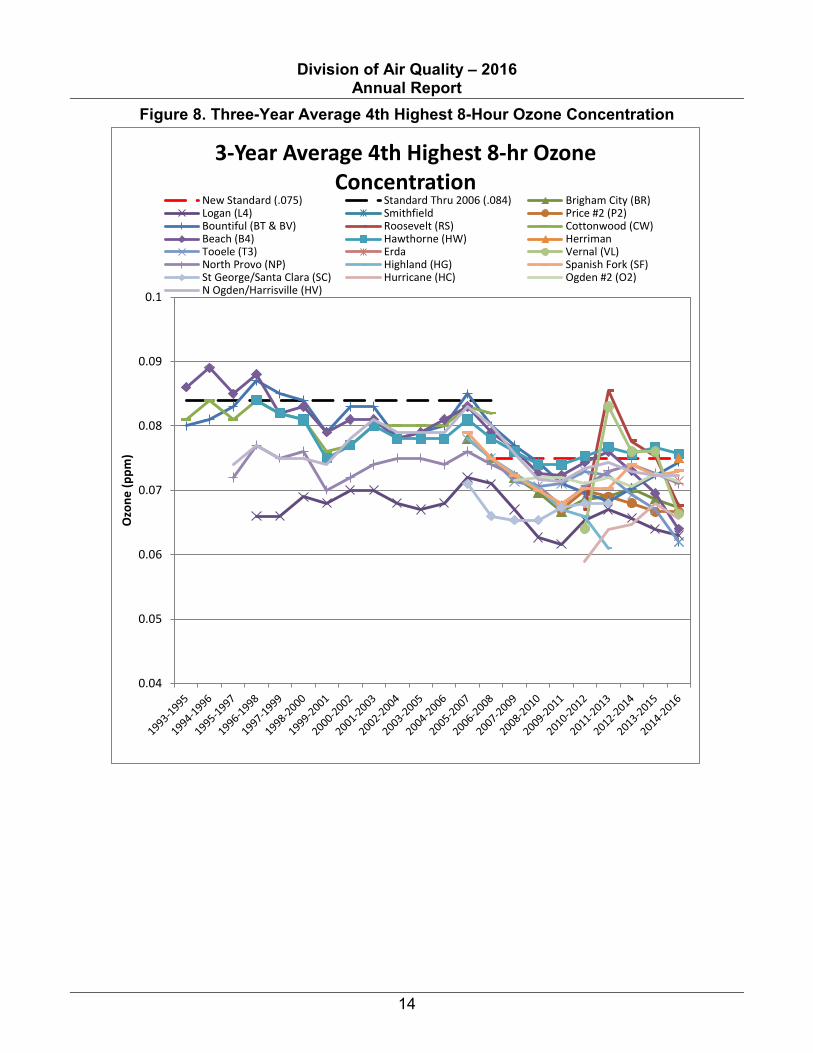
Figure 7 shows the annual 4th highest eight-hour ozone concentrations, and Figure 8 shows how each area compares to the NAAQS with the three-year average of the 4th highest eight-hour ozone concentration. The heavy red dashed lines indicate the previous standard of 75 ppb. Ozone monitors operated by the DAQ along the Wasatch Front show exceedances of the new standard in Weber, Davis, Salt Lake, and Utah Counties. There were also exceedances in Uintah County and Duchesne County during the winter.
Figure 7. Ozone 4th Highest 8-Hour Concentration
.050
.060
.070
.080
.090
.100
.110
2002 2003 2004 2005 2006 2007 2008 2009 2010 2011 2012 2013 2014 2015 2016
Ozo
ne (p
pm)
Ozone 4th Highest 8-hr Concentration 1997 Standard (0.084) 2008 Standard (0.075) Brigham City LoganSmithfield Price #2 Bountiful RooseveltCottonwood Beach Hawthorne HerrimanTooele #3 Erda Vernal North ProvoHighland Spanish Fork St George/Santa Clara HurricaneOgden #2 N Ogden/Harrisville
Division of Air Quality – 2016 Annual Report
14
Figure 8. Three-Year Average 4th Highest 8-Hour Ozone Concentration
0.04
0.05
0.06
0.07
0.08
0.09
0.1
Ozo
ne (p
pm)
3-Year Average 4th Highest 8-hr Ozone Concentration
New Standard (.075) Standard Thru 2006 (.084) Brigham City (BR)Logan (L4) Smithfield Price #2 (P2)Bountiful (BT & BV) Roosevelt (RS) Cottonwood (CW)Beach (B4) Hawthorne (HW) HerrimanTooele (T3) Erda Vernal (VL)North Provo (NP) Highland (HG) Spanish Fork (SF)St George/Santa Clara (SC) Hurricane (HC) Ogden #2 (O2)N Ogden/Harrisville (HV)
Division of Air Quality – 2016 Annual Report
15
Particulate Matter (PM) Regulated particulate matter is a complex mixture of extremely tiny particles of solid or semi-solid material suspended in the atmosphere and is divided into two categories: PM10 and PM2.5. PM10 is a particulate less than ten micrometers in diameter, which is about one-seventh the width of a strand of human hair. PM2.5, or fine particulate, is a subset of PM10 that measures 2.5 microns in diameter or less. The coarse fraction of PM10, that which is larger than 2.5 microns, is typically made up of “fugitive dust” (sand and dirt blown by winds from roadways, fields, and construction sites) and contains large amounts of silicate (sand-like) material. Primary PM2.5 is directly emitted into the atmosphere from combustion sources such as fly ash from power plants, carbon black from cars and trucks, and soot from fireplaces and woodstoves. These particles are so small that they can become imbedded in human lung tissue, exacerbating respiratory diseases and cardiovascular problems. Other negative effects are reduced visibility and accelerated deterioration of buildings. The majority of Utah’s PM2.5 is called secondary aerosol, meaning that it is not emitted directly as a particle, but is produced when gasses such as Sulfur Dioxide (SO2), NOx, and VOCs react with other gasses in the atmosphere, such as ammonia, to become tiny particles. Wintertime temperature inversions not only provide ideal conditions for the creation of secondary aerosols, they also act to trap air in valleys long enough for concentrations of PM2.5 to build up to levels that can be unhealthy. The smallest of particles that make up PM2.5 are major contributors to visibility impairment in both urban and rural areas. Along the Wasatch Front, the effects can be seen as the thick, brownish haze that lingers in our northern valleys, particularly in the winter. The DAQ currently operates PM10 and PM2.5 monitors throughout the state to assess the ambient air quality with respect to the standards for both PM10 and PM2.5. Standards – PM10
The EPA established the 24-hour air quality standard for PM10 in July 1987, when it was set at 150 μg/m3. The standard is met when the probability of exceeding the standard is no greater than once per year for a three-year averaging period. In other words, four expected exceedances within a three-year period would constitute a violation. Salt Lake and Utah counties are officially designated as PM10 nonattainment areas because of past difficulty with the 24-hour standard. Control strategies contained in the SIP promulgated in 1991 are responsible for the marked decrease in concentrations observed in the early 1990s. Ogden was also designated as a nonattainment area due to one year of high concentrations (1992), but was determined to be attaining the standard in January 2013. High values of monitored PM10 sometimes result from exceptional events, such as from dust storms during high wind events and wildfires, as was the case in 2010, when Utah experienced an exceptional dust storm on March 30th, resulting in very high PM10 values across the network. The DAQ has flagged data collected during exceptional events incurred from 2008 through 2011 and in 2015, and those events are currently under review for exclusion per the EPA Exceptional Event Rule. There were no exceptional events for high-wind or fire in 2012,
Division of Air Quality – 2016 Annual Report
16
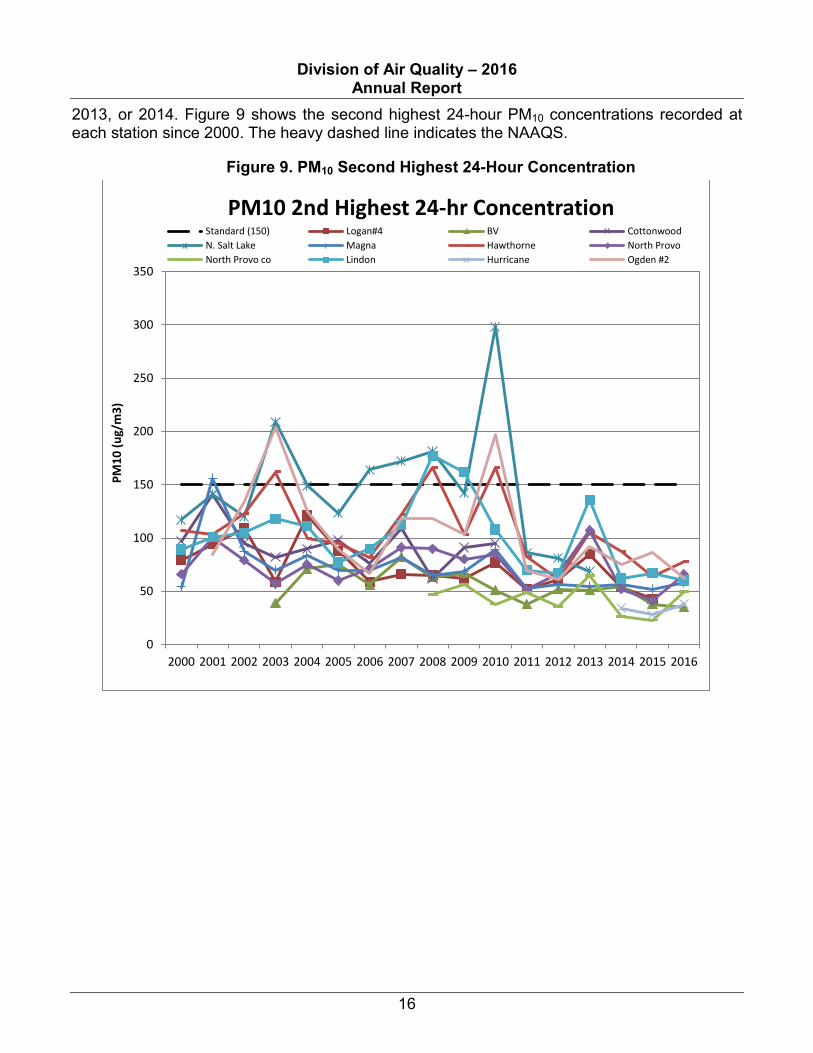
2013, or 2014. Figure 9 shows the second highest 24-hour PM10 concentrations recorded at each station since 2000. The heavy dashed line indicates the NAAQS.
Figure 9. PM10 Second Highest 24-Hour Concentration
0
50
100
150
200
250
300
350
2000 2001 2002 2003 2004 2005 2006 2007 2008 2009 2010 2011 2012 2013 2014 2015 2016
PM10
(ug/
m3)
PM10 2nd Highest 24-hr Concentration Standard (150) Logan#4 BV CottonwoodN. Salt Lake Magna Hawthorne North ProvoNorth Provo co Lindon Hurricane Ogden #2
Division of Air Quality – 2016 Annual Report
17
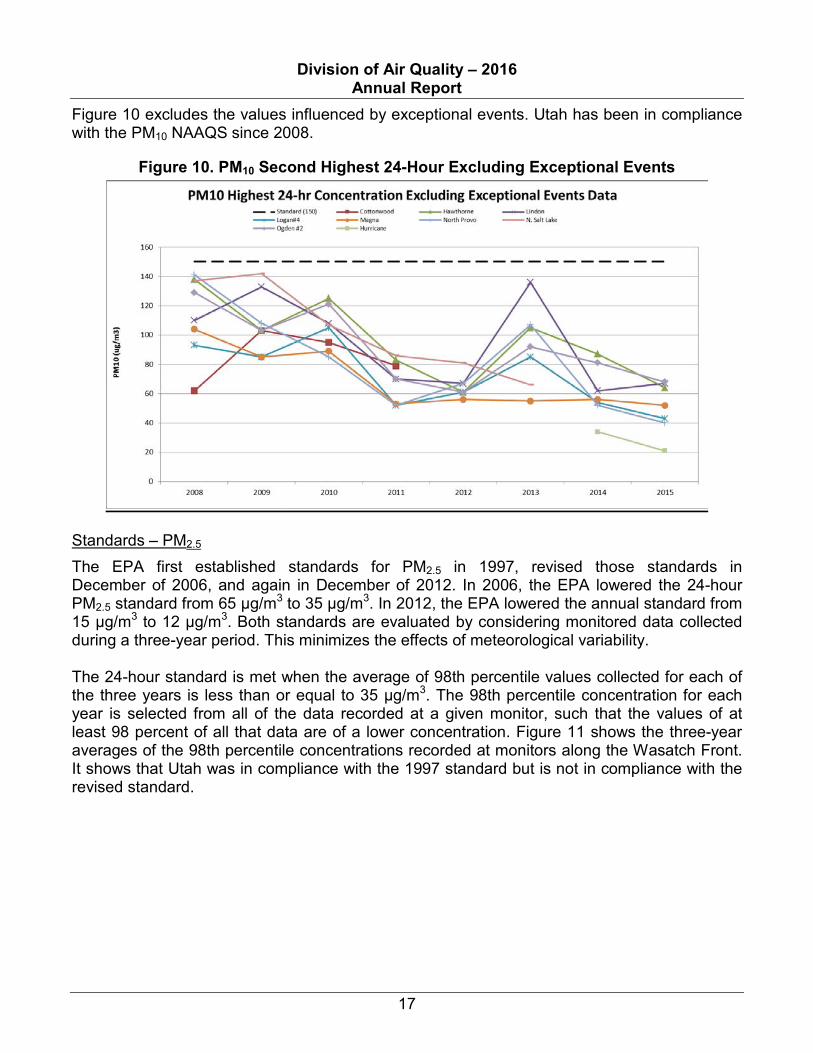
Figure 10 excludes the values influenced by exceptional events. Utah has been in compliance with the PM10 NAAQS since 2008.
Figure 10. PM10 Second Highest 24-Hour Excluding Exceptional Events
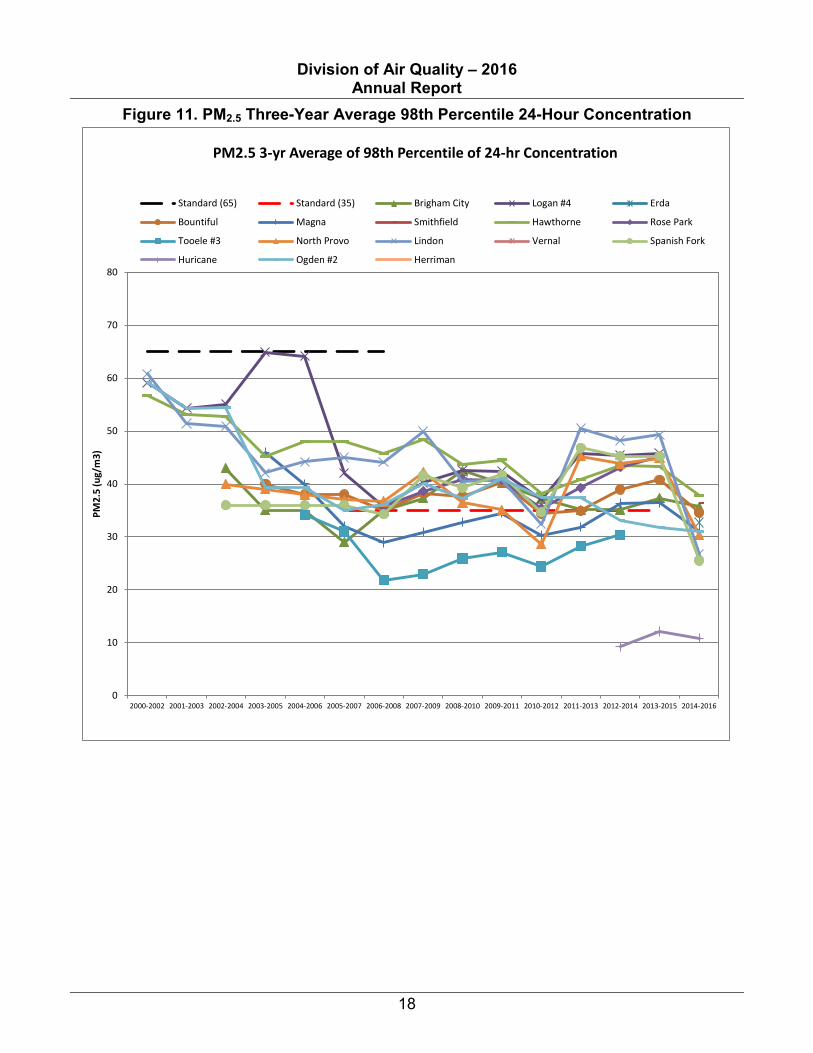
Standards – PM2.5
The EPA first established standards for PM2.5 in 1997, revised those standards in December of 2006, and again in December of 2012. In 2006, the EPA lowered the 24-hour PM2.5 standard from 65 µg/m3 to 35 µg/m3. In 2012, the EPA lowered the annual standard from 15 μg/m3 to 12 µg/m3. Both standards are evaluated by considering monitored data collected during a three-year period. This minimizes the effects of meteorological variability. The 24-hour standard is met when the average of 98th percentile values collected for each of the three years is less than or equal to 35 μg/m3. The 98th percentile concentration for each year is selected from all of the data recorded at a given monitor, such that the values of at least 98 percent of all that data are of a lower concentration. Figure 11 shows the three-year averages of the 98th percentile concentrations recorded at monitors along the Wasatch Front. It shows that Utah was in compliance with the 1997 standard but is not in compliance with the revised standard.
Division of Air Quality – 2016 Annual Report
18
Figure 11. PM2.5 Three-Year Average 98th Percentile 24-Hour Concentration
0
10
20
30
40
50
60
70
80
2000-2002 2001-2003 2002-2004 2003-2005 2004-2006 2005-2007 2006-2008 2007-2009 2008-2010 2009-2011 2010-2012 2011-2013 2012-2014 2013-2015 2014-2016
PM2.
5 (u
g/m
3)
PM2.5 3-yr Average of 98th Percentile of 24-hr Concentration
Standard (65) Standard (35) Brigham City Logan #4 Erda
Bountiful Magna Smithfield Hawthorne Rose Park
Tooele #3 North Provo Lindon Vernal Spanish Fork
Huricane Ogden #2 Herriman
Division of Air Quality – 2016 Annual Report
19
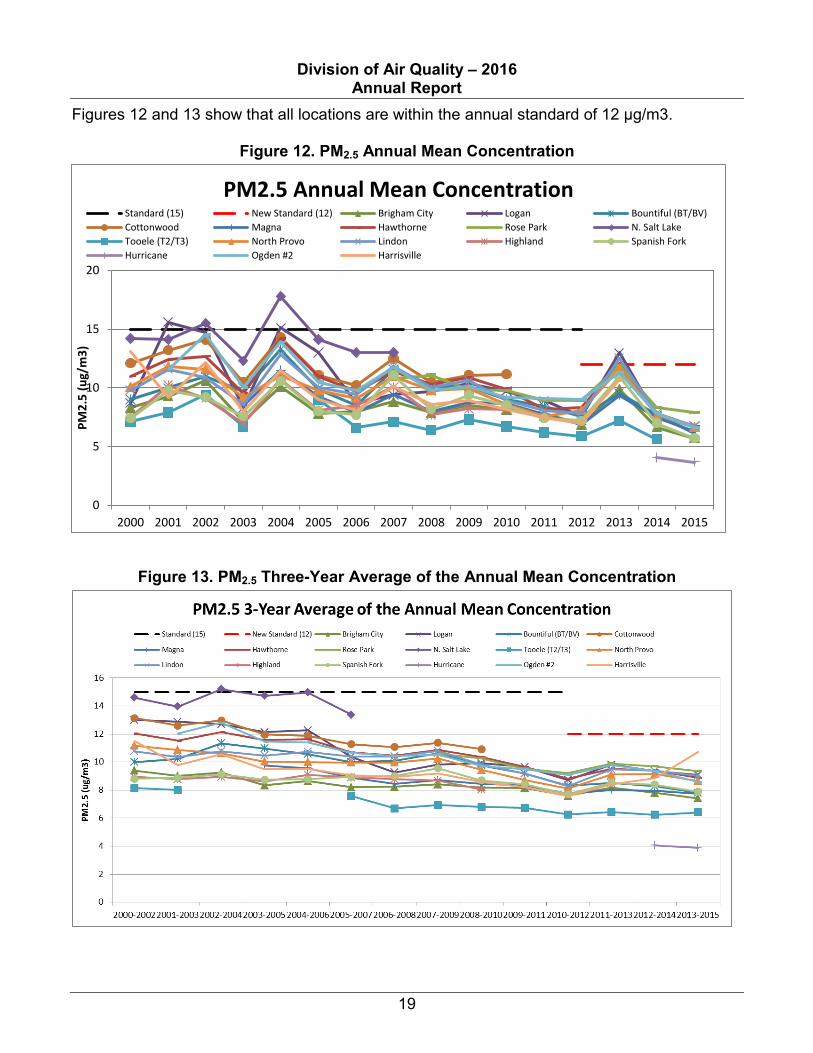
Figures 12 and 13 show that all locations are within the annual standard of 12 µg/m3.
Figure 12. PM2.5 Annual Mean Concentration
Figure 13. PM2.5 Three-Year Average of the Annual Mean Concentration
0
5
10
15
20
2000 2001 2002 2003 2004 2005 2006 2007 2008 2009 2010 2011 2012 2013 2014 2015
PM2.
5 (u
g/m
3)
PM2.5 Annual Mean Concentration Standard (15) New Standard (12) Brigham City Logan Bountiful (BT/BV)Cottonwood Magna Hawthorne Rose Park N. Salt LakeTooele (T2/T3) North Provo Lindon Highland Spanish ForkHurricane Ogden #2 Harrisville
Division of Air Quality – 2016 Annual Report
20
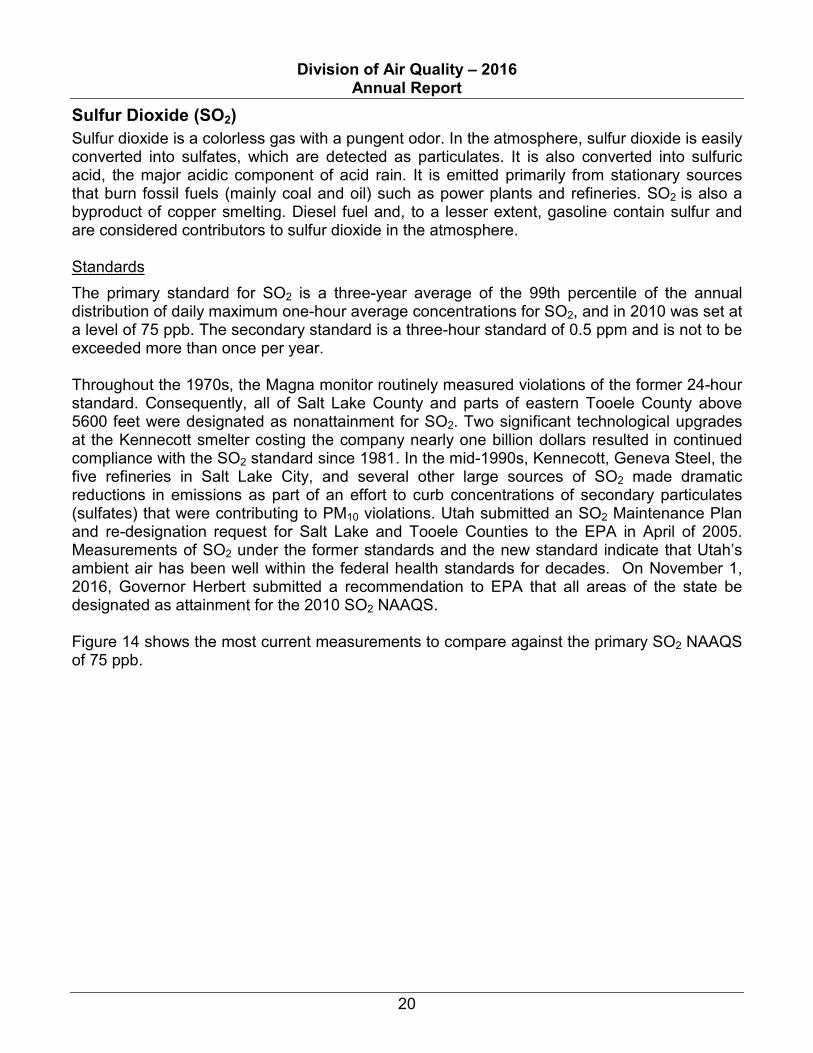
Sulfur Dioxide (SO2) Sulfur dioxide is a colorless gas with a pungent odor. In the atmosphere, sulfur dioxide is easily converted into sulfates, which are detected as particulates. It is also converted into sulfuric acid, the major acidic component of acid rain. It is emitted primarily from stationary sources that burn fossil fuels (mainly coal and oil) such as power plants and refineries. SO2 is also a byproduct of copper smelting. Diesel fuel and, to a lesser extent, gasoline contain sulfur and are considered contributors to sulfur dioxide in the atmosphere. Standards The primary standard for SO2 is a three-year average of the 99th percentile of the annual distribution of daily maximum one-hour average concentrations for SO2, and in 2010 was set at a level of 75 ppb. The secondary standard is a three-hour standard of 0.5 ppm and is not to be exceeded more than once per year. Throughout the 1970s, the Magna monitor routinely measured violations of the former 24-hour standard. Consequently, all of Salt Lake County and parts of eastern Tooele County above 5600 feet were designated as nonattainment for SO2. Two significant technological upgrades at the Kennecott smelter costing the company nearly one billion dollars resulted in continued compliance with the SO2 standard since 1981. In the mid-1990s, Kennecott, Geneva Steel, the five refineries in Salt Lake City, and several other large sources of SO2 made dramatic reductions in emissions as part of an effort to curb concentrations of secondary particulates (sulfates) that were contributing to PM10 violations. Utah submitted an SO2 Maintenance Plan and re-designation request for Salt Lake and Tooele Counties to the EPA in April of 2005. Measurements of SO2 under the former standards and the new standard indicate that Utah’s ambient air has been well within the federal health standards for decades. On November 1, 2016, Governor Herbert submitted a recommendation to EPA that all areas of the state be designated as attainment for the 2010 SO2 NAAQS. Figure 14 shows the most current measurements to compare against the primary SO2 NAAQS of 75 ppb.
Division of Air Quality – 2016 Annual Report
21
Figure 14. Sulfur Dioxide Three-Year Average of 99th Percentile of Daily Maximum One-Hour Averages
Lead (Pb) Lead in the ambient air exists primarily as particulate matter in the respirable size range. Historically, the major source of lead emissions came from the burning of gasoline. However, because leaded gasoline for automobiles was completely phased out in the U.S. by the end of 1995, lead from gasoline is no longer a significant problem. Currently, the primary source of lead emissions in Utah is the extraction and processing of metallic ores. Exhaust from small aircraft is another source of lead emissions in the state. Utah has not exceeded the health standard for lead since the late 1970s, and the EPA authorized the discontinuation of lead monitoring in Utah in 2005; however, in both 2008 and 2010, the EPA set new monitoring requirements for lead. The DAQ now monitors for lead at one point source site and one urban non-source monitoring location.
0
10
20
30
40
50
60
70
80
2007-2009 2008-2010 2009-2011 2010-2012 2011-2013 2012-2014 2013-2015 2014-2016
SO2
(ppb
)
Sulfur Dioxide 3-yr Average of 99th Percentile of 1-hr Maxium Values
New Standard Beach Bountiful
Hawthrone Magna North Salt Lake #2
Division of Air Quality – 2016 Annual Report
22
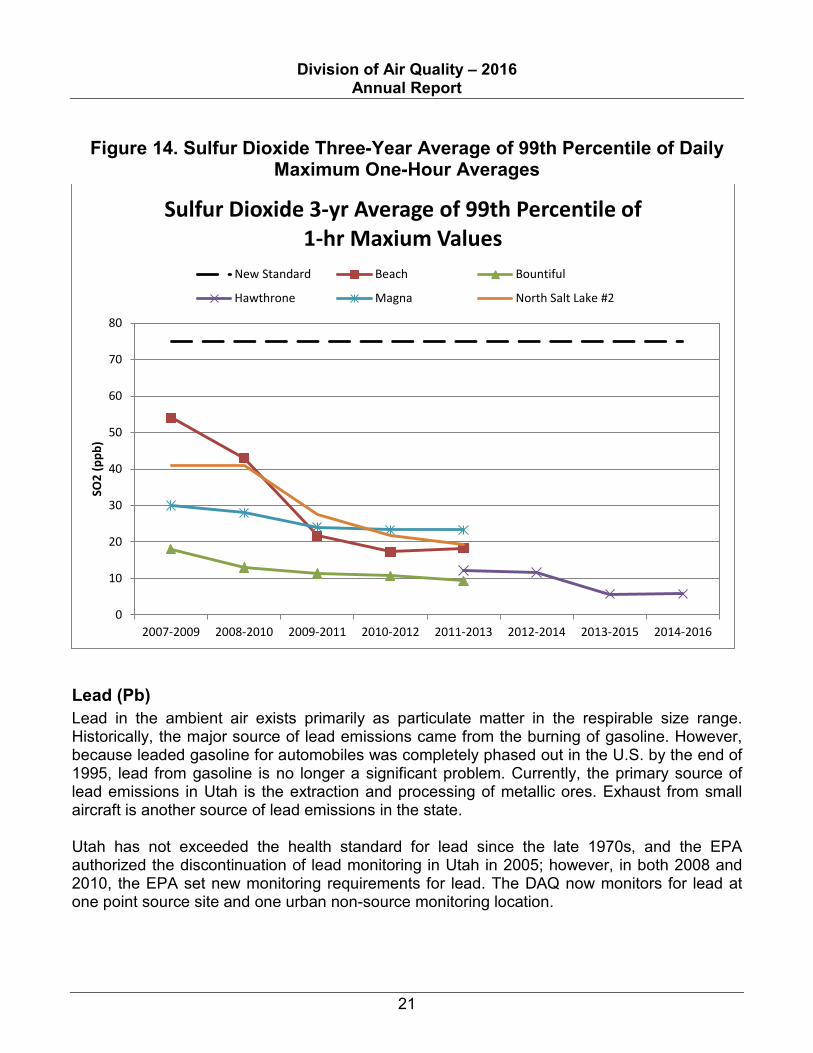
Standards On November 12, 2008, the EPA strengthened the NAAQS for lead. The previous standard was a calendar quarter (three-month) average concentration not to exceed 1.5 μg/m3. The new standard is 0.15 μg/m3 as total suspended particles (TSP), measured as a three-month rolling average. The new standard included a new monitoring requirement, so the DAQ began lead monitoring again at the Magna station near the Kennecott copper smelter (See Figure 15).
Figure 15. Lead Max Three-Month Average 24-Hour Concentration
Division of Air Quality – 2016 Annual Report
23
Emissions Inventories Every three years, the DAQ collects information about the quantity and characteristics of the various air pollutants released by all emission sources in the state. In addition to these triennial inventories, emissions information is also collected annually from the largest industrial sources. Finally, additional detailed inventories are prepared, as needed, for special projects such as SIP development to quantify emissions during specific seasonal air pollution episodes. Once collected, the inventory information is reviewed, quality assured, analyzed, stored in the DAQ data system, and made available to the public. The DAQ uses this emissions information to review trends over time, as input data for air quality modeling analysis and as an indicator of the effectiveness of existing and projected control strategies. The emissions information is also compiled according to source type to provide billing information for the Title V operating permits program of the CAA. Both triennial and annual emissions inventory data is uploaded to the EPA’s National Emissions Inventory (NEI) data system. Sources of Air Contaminants Emission inventories are typically organized into three types of sources: Point, Area, and Mobile. Point sources are large stationary industrial or commercial facilities such as power plants, steel mills, and manufacturing facilities that emit more than 100 tons per year of a regulated pollutant or are on a list of sources the EPA has determined need to be tracked closely. Air pollutants released from these stationary sources are accounted for on a facility-by-facility basis. Because much of the Wasatch Front was proposed to be reclassified as Serious PM2.5 nonattainment areas during late 2016, the threshold for classification as a “Point Source” will change in the future from 100 to 70 tons per year. Area sources are generally much smaller stationary sources, and due to their greater number, are generally accounted for as a group. However, as the federal air quality standards become more restrictive, it is becoming necessary to start tracking emissions more closely from smaller industrial sources. Home heating, agricultural burning and harvesting, construction, residential and commercial energy generation, wildfires, and biogenics (emissions from vegetation) are examples of other area source categories. Mobile sources consist of emissions from non-stationary sources such as cars, trains, and aircraft. Mobile emissions are further broken down into on-road mobile and off-road mobile categories. On-road mobile sources primarily consist of personal and commercial cars and trucks, and contribute by far the largest part of the mobile source emissions. Off-road mobile sources consist of a diverse group of heavy construction equipment, small engines (lawnmowers and snow blowers), trains, and aircraft. Estimating emissions from mobile sources requires an understanding of the various emission characteristics of the many types of vehicles and model years that make up the fleet, an understanding of how and where they are driven, and the distances they travel. With this understanding, it is possible to see, for example, that on-road mobile sources produce about 36% of the annual pollution (NOx, PM2.5
Division of Air Quality – 2016 Annual Report
24
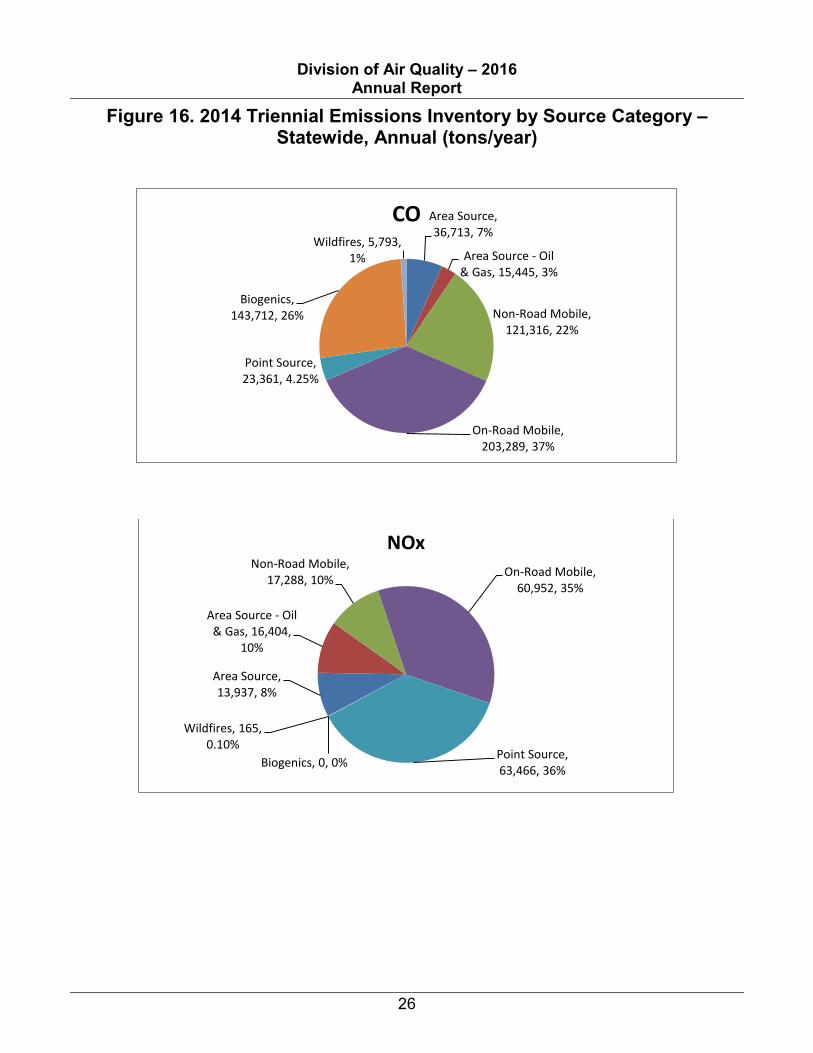
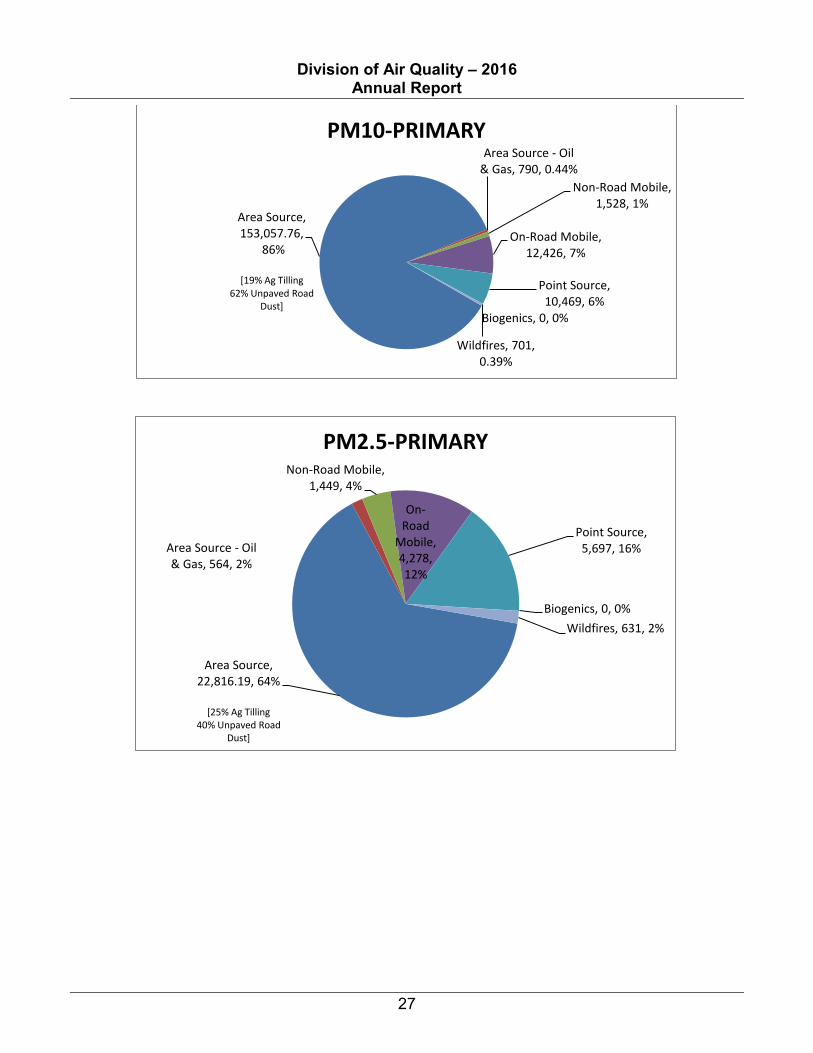
exhaust, and VOC) along the Wasatch Front, and although heavy-duty diesel vehicles currently account for only 3% of the vehicle miles travelled, they produce over 15% of the pollution. Triennial Emissions Inventory The 2014 triennial inventory is the most recent statewide inventory available. The triennial inventory covers over 360 individual point sources, 194 area categories, and 12 mobile on-road and off-road categories. Table 4 shows total emissions, by county, of the criteria pollutants, CO, NOx, PM10, PM2.5, SOX, and VOCs. Figure 16 shows the updated 2014 triennial emissions inventory in six pie charts, displaying the relative portion of emissions generated within source categories. The figures in the charts are statewide annual figures and should not be compared to the inventories used in the PM2.5 or other SIPs, which are seasonal and area specific. Biogenic and wildfire emissions produced from non-anthropogenic (non-human) natural activity of vegetation and wildfires are usually estimated as segments within the area source category but have been listed separately due to their unique nature and impact. The triennial inventory for 2014 was collected and compiled through 2016 as EPA calculation methods for area categories were revised and supplied. The inventory as described in this report differs from that of the 2011 statewide inventory for several reasons:
1. Many of the 2014 area source calculations were re-edited using new calculation methods provided by the EPA,
2. Over 60 detailed categories supplemented or replaced the previous Oil and Gas production categories in the area source category;
3. Fewer wildfires occurred in 2014 than in 2011; and 4. On-road emissions reductions are seen with the increasing proportion of newer vehicles
in the statewide fleet. a. These emissions reductions are achieved as a result of EPA’s Tier II emissions
standards for newer vehicles.
Division of Air Quality – 2016 Annual Report
25
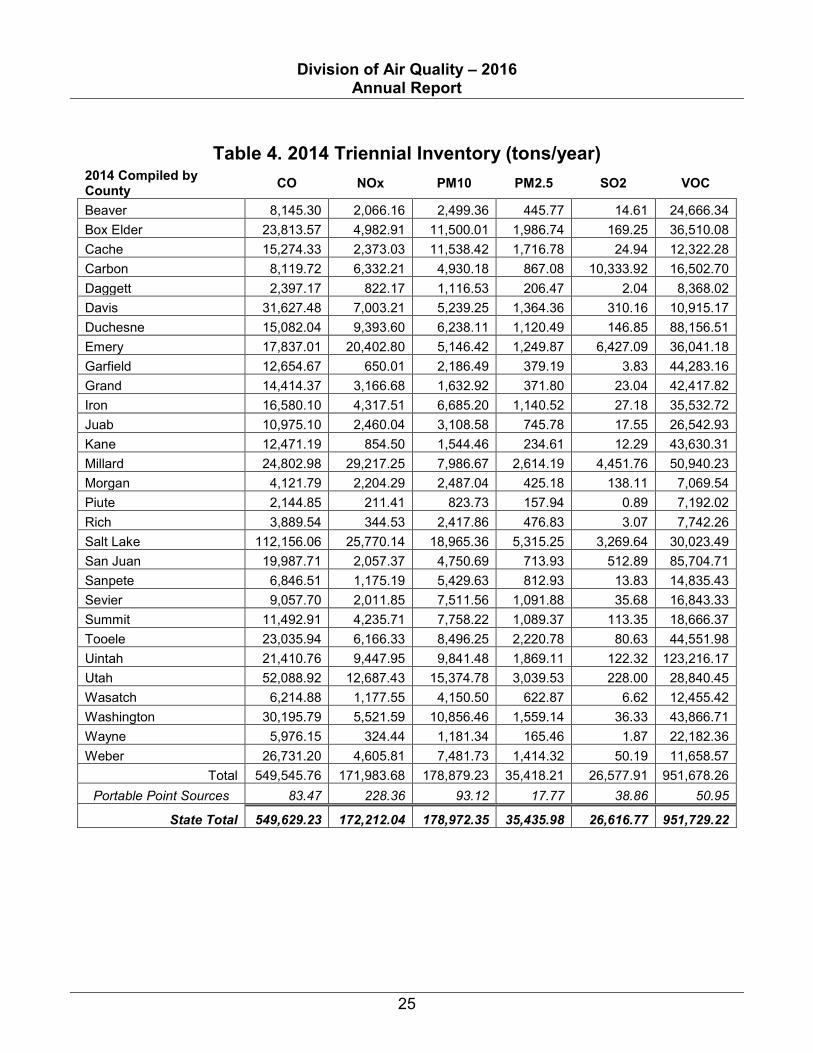
Table 4. 2014 Triennial Inventory (tons/year) 2014 Compiled by County CO NOx PM10 PM2.5 SO2 VOC
Beaver 8,145.30 2,066.16 2,499.36 445.77 14.61 24,666.34 Box Elder 23,813.57 4,982.91 11,500.01 1,986.74 169.25 36,510.08 Cache 15,274.33 2,373.03 11,538.42 1,716.78 24.94 12,322.28 Carbon 8,119.72 6,332.21 4,930.18 867.08 10,333.92 16,502.70 Daggett 2,397.17 822.17 1,116.53 206.47 2.04 8,368.02 Davis 31,627.48 7,003.21 5,239.25 1,364.36 310.16 10,915.17 Duchesne 15,082.04 9,393.60 6,238.11 1,120.49 146.85 88,156.51 Emery 17,837.01 20,402.80 5,146.42 1,249.87 6,427.09 36,041.18 Garfield 12,654.67 650.01 2,186.49 379.19 3.83 44,283.16 Grand 14,414.37 3,166.68 1,632.92 371.80 23.04 42,417.82 Iron 16,580.10 4,317.51 6,685.20 1,140.52 27.18 35,532.72 Juab 10,975.10 2,460.04 3,108.58 745.78 17.55 26,542.93 Kane 12,471.19 854.50 1,544.46 234.61 12.29 43,630.31 Millard 24,802.98 29,217.25 7,986.67 2,614.19 4,451.76 50,940.23 Morgan 4,121.79 2,204.29 2,487.04 425.18 138.11 7,069.54 Piute 2,144.85 211.41 823.73 157.94 0.89 7,192.02 Rich 3,889.54 344.53 2,417.86 476.83 3.07 7,742.26 Salt Lake 112,156.06 25,770.14 18,965.36 5,315.25 3,269.64 30,023.49 San Juan 19,987.71 2,057.37 4,750.69 713.93 512.89 85,704.71 Sanpete 6,846.51 1,175.19 5,429.63 812.93 13.83 14,835.43 Sevier 9,057.70 2,011.85 7,511.56 1,091.88 35.68 16,843.33 Summit 11,492.91 4,235.71 7,758.22 1,089.37 113.35 18,666.37 Tooele 23,035.94 6,166.33 8,496.25 2,220.78 80.63 44,551.98 Uintah 21,410.76 9,447.95 9,841.48 1,869.11 122.32 123,216.17 Utah 52,088.92 12,687.43 15,374.78 3,039.53 228.00 28,840.45 Wasatch 6,214.88 1,177.55 4,150.50 622.87 6.62 12,455.42 Washington 30,195.79 5,521.59 10,856.46 1,559.14 36.33 43,866.71 Wayne 5,976.15 324.44 1,181.34 165.46 1.87 22,182.36 Weber 26,731.20 4,605.81 7,481.73 1,414.32 50.19 11,658.57
Total 549,545.76 171,983.68 178,879.23 35,418.21 26,577.91 951,678.26 Portable Point Sources 83.47 228.36 93.12 17.77 38.86 50.95
State Total 549,629.23 172,212.04 178,972.35 35,435.98 26,616.77 951,729.22
Division of Air Quality – 2016 Annual Report
26
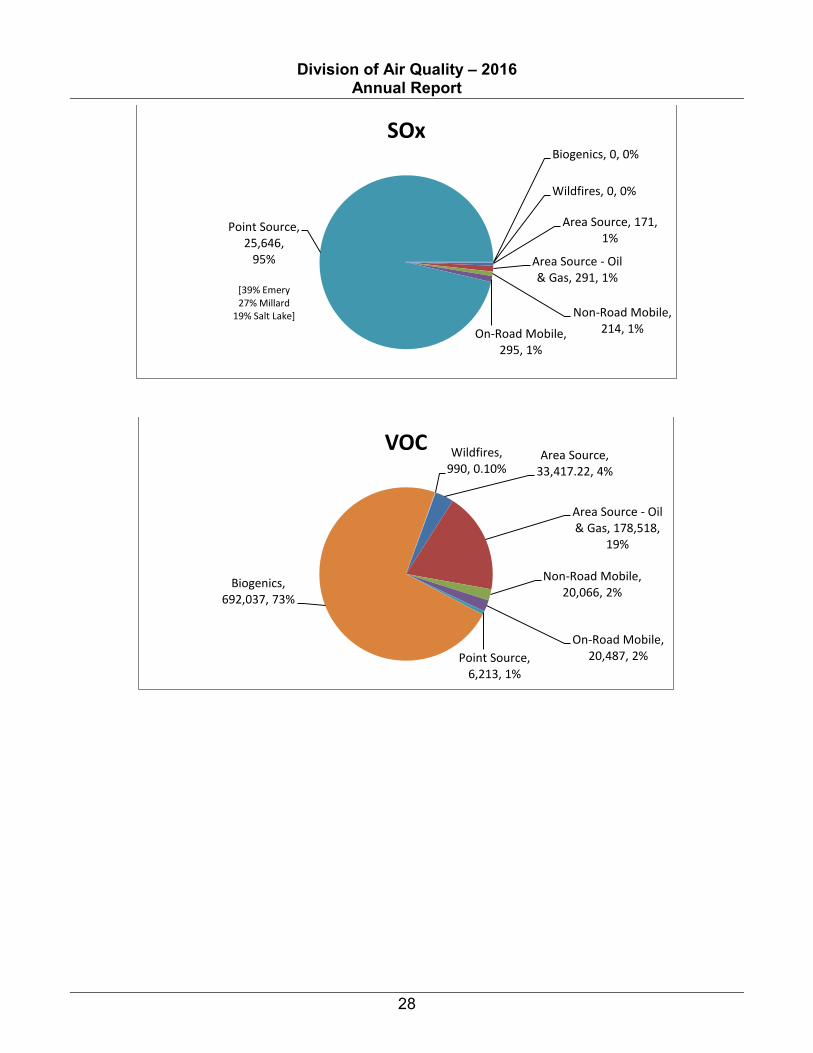
Figure 16. 2014 Triennial Emissions Inventory by Source Category – Statewide, Annual (tons/year)
Area Source, 36,713, 7%
Area Source - Oil & Gas, 15,445, 3%
Non-Road Mobile, 121,316, 22%
On-Road Mobile, 203,289, 37%
Point Source, 23,361, 4.25%
Biogenics, 143,712, 26%
Wildfires, 5,793, 1%
CO
Area Source, 13,937, 8%
Area Source - Oil & Gas, 16,404,
10%
Non-Road Mobile, 17,288, 10% On-Road Mobile,
60,952, 35%
Point Source, 63,466, 36% Biogenics, 0, 0%
Wildfires, 165, 0.10%
NOx
Division of Air Quality – 2016 Annual Report
27
Area Source, 153,057.76,
86%
[19% Ag Tilling 62% Unpaved Road
Dust]
Area Source - Oil & Gas, 790, 0.44%
Non-Road Mobile, 1,528, 1%
On-Road Mobile, 12,426, 7%
Point Source, 10,469, 6%
Biogenics, 0, 0%
Wildfires, 701, 0.39%
PM10-PRIMARY
Area Source, 22,816.19, 64%
[25% Ag Tilling
40% Unpaved Road Dust]
Area Source - Oil & Gas, 564, 2%
Non-Road Mobile, 1,449, 4%
On-Road
Mobile, 4,278, 12%
Point Source, 5,697, 16%
Biogenics, 0, 0% Wildfires, 631, 2%
PM2.5-PRIMARY
Division of Air Quality – 2016 Annual Report
28
Area Source, 171, 1%
Area Source - Oil & Gas, 291, 1%
Non-Road Mobile, 214, 1% On-Road Mobile,
295, 1%
Point Source, 25,646,
95%
[39% Emery 27% Millard
19% Salt Lake]
Biogenics, 0, 0%
Wildfires, 0, 0%
SOx
Area Source, 33,417.22, 4%
Area Source - Oil & Gas, 178,518,
19%
Non-Road Mobile, 20,066, 2%
On-Road Mobile, 20,487, 2% Point Source,
6,213, 1%
Biogenics, 692,037, 73%
Wildfires, 990, 0.10%
VOC
Division of Air Quality – 2016 Annual Report
29
Division Organization The DAQ is divided into three branches: Planning, Compliance, and Permitting. The Planning Branch is responsible for developing comprehensive plans to reduce air pollution and collecting and analyzing the data necessary to show the effectiveness of those plans. The Planning Branch is organized into three sections. The Air Monitoring Section is responsible for establishing and operating the monitoring network to gather and analyze data used to determine concentrations of ambient air pollutants, as well as meteorological conditions when those pollution concentrations occurred. The Inventory Section has the primary responsibility to collect and collate emissions inventories in order to understand the origins of the various contaminants detected in the air. This includes both historic inventories and projection inventories, reflecting current and proposed control strategies. The Technical Analysis Section refines and analyzes available emissions inventories and monitoring data, using computer models to evaluate the impacts of new and existing sources of air pollution and to understand the relationship between the emissions, meteorology, and pollutant concentrations measured in the air for past, current and future pollution episodes. The Planning Branch is also involved in identifying the air quality impacts of transportation issues, which include vehicle inspection and maintenance, clean fuels, and highway construction. The Air Quality Policy Section uses this information to develop SIPs in order to ensure that Utah’s ambient air comes into and remains in compliance with the federal health standards. Additionally, the Air Quality Policy section coordinates all of the rule-making activities of the Division. The Compliance Branch is responsible for ensuring that industries and residents comply with Utah’s air quality rules and is comprised of three sections: Major Source Compliance, Minor Source Compliance, and Air Toxics, Lead-Based Paint, and Asbestos Section (ATLAS). The Major and Minor Source Compliance Sections are responsible for ensuring that all Utah air quality regulatory requirements are met. This is done through inspections and enforcement actions. ATLAS is responsible for the regulation, under various EPA programs, of toxic air pollutants, also known as Hazardous Air Pollutants (HAPs). HAPs are those pollutants listed in the Federal Register that are known or suspected to cause cancer or other serious health problems. ATLAS is also responsible for the enforcement of federal and state regulations for preconstruction asbestos removal and a number of outreach and enforcement programs designed to reduce exposure to lead-based paint. Through the Small Business Environmental Assistance Program (SBEAP), the Compliance Branch also assists small businesses in complying with state and federal regulations, including New Source Performance Standards (NSPS), National Emission Standards for Hazardous Air Pollutants (NESHAP), New Source Review (NSR), and Utah’s air quality rules. The SBEAP can advise small businesses on permitting requirements, emission calculations, technical issues, and pollution prevention techniques. The Permitting Branch is responsible for issuing construction and operating permits to stationary sources that emit air pollutants, and is comprised of three sections: Minor Source NSR, Major Source NSR, and Operating Permits. Construction permits are issued to new or modified stationary sources of air pollution through the NSR program. Operating permits are issued on an ongoing basis through Title V of the CAA to “major” stationary sources.
Division of Air Quality – 2016 Annual Report
30
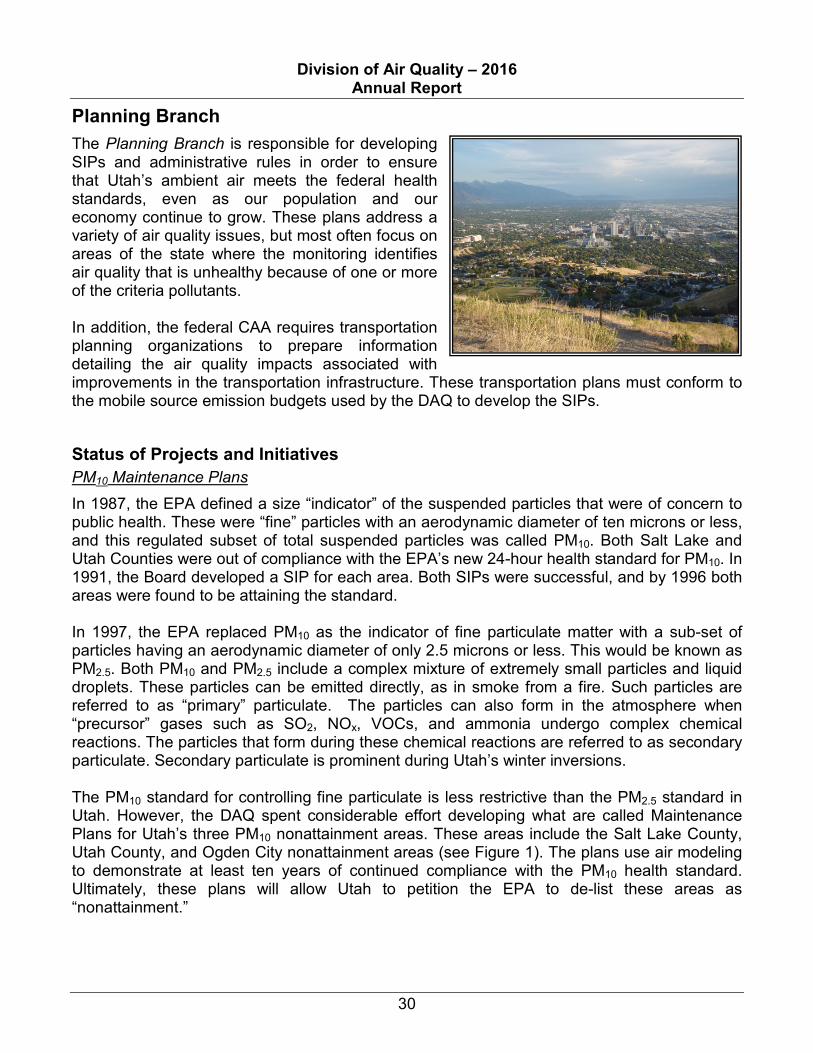
Planning Branch The Planning Branch is responsible for developing SIPs and administrative rules in order to ensure that Utah’s ambient air meets the federal health standards, even as our population and our economy continue to grow. These plans address a variety of air quality issues, but most often focus on areas of the state where the monitoring identifies air quality that is unhealthy because of one or more of the criteria pollutants. In addition, the federal CAA requires transportation planning organizations to prepare information detailing the air quality impacts associated with improvements in the transportation infrastructure. These transportation plans must conform to the mobile source emission budgets used by the DAQ to develop the SIPs.
Status of Projects and Initiatives PM10 Maintenance Plans
In 1987, the EPA defined a size “indicator” of the suspended particles that were of concern to public health. These were “fine” particles with an aerodynamic diameter of ten microns or less, and this regulated subset of total suspended particles was called PM10. Both Salt Lake and Utah Counties were out of compliance with the EPA’s new 24-hour health standard for PM10. In 1991, the Board developed a SIP for each area. Both SIPs were successful, and by 1996 both areas were found to be attaining the standard. In 1997, the EPA replaced PM10 as the indicator of fine particulate matter with a sub-set of particles having an aerodynamic diameter of only 2.5 microns or less. This would be known as PM2.5. Both PM10 and PM2.5 include a complex mixture of extremely small particles and liquid droplets. These particles can be emitted directly, as in smoke from a fire. Such particles are referred to as “primary” particulate. The particles can also form in the atmosphere when “precursor” gases such as SO2, NOx, VOCs, and ammonia undergo complex chemical reactions. The particles that form during these chemical reactions are referred to as secondary particulate. Secondary particulate is prominent during Utah’s winter inversions. The PM10 standard for controlling fine particulate is less restrictive than the PM2.5 standard in Utah. However, the DAQ spent considerable effort developing what are called Maintenance Plans for Utah’s three PM10 nonattainment areas. These areas include the Salt Lake County, Utah County, and Ogden City nonattainment areas (see Figure 1). The plans use air modeling to demonstrate at least ten years of continued compliance with the PM10 health standard. Ultimately, these plans will allow Utah to petition the EPA to de-list these areas as “nonattainment.”
Division of Air Quality – 2016 Annual Report
31
No additional emission controls were needed to demonstrate the ten years of compliance. Certainly though, the emission controls recently adopted by the Board to address PM2.5 will have a positive effect on PM10 levels. The Maintenance Plans were completed in December of 2015, and they have been forwarded to the EPA. During 2016, DAQ worked with EPA to move those plans towards approval by EPA. Revisions to Part H: Emission Limits and Operating Practices Specific to both PM2.5 and PM10 The Board took action in December of 2016 to approve minor revisions to the suite of emission limitations specific to sources identified in Utah’s SIPs for both PM2.5 and PM10 as contained in Part H of the SIP. This was undertaken to facilitate EPA’s review and approval of the Moderate Area PM2.5 SIPs completed in 2014, as well as the PM10 Maintenance Plans completed in 2015. DAQ worked to ensure consistency between these overlapping limitations. One important side effect of EPA’s pending approval of these revisions to Part H is that it will resolve discrepancies between the federally approved requirements for nine sources in Utah and their state approved requirements, and thus allow the State to issue permits for those sources under Title V of the Act. Reclassification of Utah’s PM2.5 Nonattainment Areas In December of 2016, EPA proposed to determine that each of Utah’s three nonattainment areas for PM2.5 had failed to demonstrate compliance with the 24-hour standard (35 µg/m3) as of their statutory attainment date (December 31, 2015). As a result, EPA has proposed re-classifying each of these areas from Moderate Nonattainment Areas to Serious Nonattainment Areas. Such re-classification will require Utah to revise its implementation plans. The new Serious Area Plans will reach beyond the level of emission controls determined to be “reasonably available” which are presently included in Utah’s Moderate Area SIPs, and achieve a level defined as the “best available.” Action to re-classify these areas was not unexpected. In fact, the Moderate Area SIPs for the Salt Lake City and Provo nonattainment areas demonstrated that it would be impracticable to attain by the statutory attainment date. The plan for the Logan nonattainment area did predict attainment by 2015, and were it not for a last minute inversion in 2015, Utah could have requested an extension of the attainment date. The air quality levels in the Cache Valley exceeded the criteria for petitioning EPA for an extension by one day. The Serious Area plans will be due to EPA in December of 2017, and will establish new dates by which attainment of the 24-hour standard is expected; most likely between 2019 and 2024. Inter-mountain West Data Warehouse (IWDW)
The EPA, under the National Environmental Policy Act, is mandated to document current air pollution levels and lessen current and projected adverse impacts through mitigation strategies. Localized monitoring in the inter-mountain area (western Colorado, eastern Utah, southwestern Wyoming, and northwestern New Mexico) has revealed degraded air quality in regard to ozone and NOx, leading federal and state agencies to realize more information is
Division of Air Quality – 2016 Annual Report
32
needed as energy development in the region is considered. Because of a common need for a comprehensive set of air quality assessment tools, the stakeholders—EPA Region 8, the Bureau of Land Management, the USDA Forest Service, the National Park Service and the states of Utah, Colorado, Wyoming, and New Mexico are cooperating on the following activities: Expanding air quality monitoring in the study area to establish baseline conditions, track
air quality trends, and evaluate the performance of air quality modeling systems; Creating and operating a robust, centralized data warehouse to store, manage and
share data among state and federal agencies and industry to support air quality modeling and analysis; and
Performing regional scale baseline air quality modeling of current conditions, which the
impacts from proposed future projects can be evaluated against. Utah has completed three years of air quality data collection at the Price and Fruitland monitoring sites, both funded by the IWDW. Utah is currently under contract with the IWDW to perform quarterly equipment audits at the Bureau of Land Management’s (BLM’s) new monitoring station at Escalante. In addition, air quality data from the Vernal and Roosevelt monitoring sites have been provided for the project. Other activities on the project this year include providing support to the development of emissions inventories, review of the project work plan, and participating in the project oversight committee meetings. Work conducted under the IWDW will be directly applicable to the ozone studies currently underway in the Uinta Basin. Uinta Basin Ozone
Since 2005, the National Park Service has been measuring summertime ozone at the Dinosaur National Monument located near Vernal and, beginning in 2006, at the Colorado National Monument located near Grand Junction, CO. In 2009, the EPA began measuring year-round ozone at two sites on the Ute Indian Reservation, located near Redwash and Ouray. Data collected from the two tribal sites during the winter of 2010 indicated that high ozone levels are occurring in the Basin during the middle of winter. This finding was unexpected since ozone is normally an air pollutant that is formed during the summertime when there are high temperatures and bright sunshine.
In the winter of 2010/11, the Uinta Basin Impact Mitigation Special Services District (BIMSSD) funded a study conducted by Utah State University’s Energy Dynamics Lab and the DAQ. Using data collected from 18 permanent and temporary air monitoring stations placed throughout the basin, researchers found elevated wintertime ozone concentrations throughout the basin during temperature inversion events when snow covered the ground. The highest values were found in the central basin area, with many exceeding the ozone NAAQS.
In the winters of 2012 through 2014, cooperating agencies, including the BLM, the EPA, Western Energy Alliance, and the UBIMSSD, coordinated by the DAQ, embarked on a multi-
Division of Air Quality – 2016 Annual Report
33
winter effort to study and address ozone levels in the Basin. The goal of the Uinta Basin Wintertime Ozone Study (UBWOS) was to understand how ozone is formed in the Basin during wintertime inversion conditions and to implement appropriate and effective strategies for mitigating high ozone levels in order to avoid nonattainment. Researchers from the National Oceanic and Atmospheric Administration (NOAA), several university research groups, the EPA, and the DAQ worked together to study ozone formation in the basin during wintertime inversion conditions. The study concluded that:
• Ozone formation is associated with stable meteorological conditions, snow cover, and sunshine.
• NOx comes from hot combustion sources, and the highest levels are in the oil production areas and population centers.
• VOC comes from oil and gas production with the highest levels in the gas production areas.
• There is very high year-to-year variation in ozone levels due to variation in meteorological conditions.
• Elevated ozone coincided with elevated levels of VOCs and NOx, which are the primary chemical precursors of ozone formation.
• Complex patterns of light winds within the Basin appear to produce an east-west “sloshing” of air that contributes to intra-basin mixing of ozone and ozone precursors.
• Chemical reactions during these winter episodes differ greatly from summer ozone formation in urban areas.
• Aromatic VOCs such as toluene and xylene contribute in secondary formation of wintertime ozone pollution in the Basin; therefore, VOC control measures focused on these types of VOCs will be particularly effective.
• Formaldehyde (HCHO) and other aldehydes are the dominant radical sources needed for ozone formation and are important chemical species to control.
Further information on the UBWOS and wintertime ozone in the Uinta Basin can be found on the DAQ web site at: http://www.deq.utah.gov/locations/U/uintahbasin/index.htm. Work on Uinta Basin air quality during 2015 and 2016 focused on the development of an improved emissions inventory for oil and gas production. A series of stakeholder meetings were conducted with the Western Energy Alliance, oil and gas operators, Ute Tribe, the EPA, and the BLM to agree on an inventory process. The goal is an emissions inventory that is spatially, temporally, and chemically characterized for the entire Basin. This inventory is needed to develop appropriate and effective mitigation strategies for ozone and other air pollutants that can form as a result of the Basin’s unique wintertime chemistry. The oil and gas emissions data requests were due by the end of 2015. The data received was based upon operations in the year 2014 and represented 96% of wells located in the Uintah and Duchesne counties. In 2016 the data underwent a high-level quality control analysis that required returning to the producers to request clarifications or corrections. The data has been entered into a database and shared with EPA, the Ute Tribe and participants. The resulting data identifies that the main contributors to emissions of VOCs are pneumatic controllers, fugitive emissions and tanks, and that the primary source of NOx emissions are engines. The results
Division of Air Quality – 2016 Annual Report
34
compared to the projections from previous inventories indicate much lower VOC emissions and much higher NOx emissions than anticipated. The data is still undergoing analysis and evaluation for future refinement and improvement in 2017. In 2016 a study was initiated to investigate possible sources of fugitive emissions from sources in the Uinta Basin. The Storage Tank Emissions Pilot Project (STEPP), using a $150,000 appropriation from the Utah Legislature, is a joint endeavor with DAQ, the Bingham Research Center and Tri-County Health Department to evaluate potential storage tank fugitive emissions. With cooperation from oil and gas producers, the STEPP evaluated a representative sample (448) of the 2,350 well sites located on state regulated lands for leaks from tank systems through a methodical and organized process utilizing infrared cameras, Geographic Information System equipment, and Google High-Resolution Imagery. The fieldwork was completed in late October 2016 and the data is currently being collated and evaluated. Results were shared with operators in a timely manner to allow the owners and operators to evaluate any potential fugitive emissions for repair and maintenance needs. This pilot program is the first step in providing DAQ and producers more definitive information about VOC emissions from tank storage systems, improve DAQ emission estimates in the Basin and help operators fix potential leaks. Utah Clean Diesel Program
The Utah Clean Diesel Program, a clean air initiative that started in 2008, has been a successful collaboration between state and federal agencies, county and municipal governments, community and non-profit organizations, and industry groups. Over $12 million in state and federal grants have helped 55 small businesses, 35 school districts, three government entities, and two universities purchase cleaner and more fuel efficient equipment for their operations, resulting in over 46,346 tons of emissions reductions. A new award in 2016 from the Environmental Protection Agency (EPA) for $1.2 million will fund school bus replacements and idle-reduction technologies in the Canyons, Grand, Morgan, Jordan, and Tooele school districts during 2017. Salt Lake City and Momentum Recycling received funding to assist with heavy-duty diesel vehicle replacements along with Calco Transportation for retrofitting short-haul trucks with diesel oxidation catalysts and idle reduction technologies. In addition, a 2006 diesel shuttle bus that operates on Weber State University’s campus will be converted to all-electric. The Clean Air Retrofit, Replacement, and Off-Road Technology (CARROT) Program
The CARROT program was enacted during the 2014 legislative session as a means to provide incentives for reducing emissions from small engines and heavy diesel equipment. The appropriation of $700,000 for 2016 was divided into three segments: the Grant
Division of Air Quality – 2016 Annual Report
35
Program, the School Bus Replacement Program, and the Lawn Equipment Discount and Exchange Program. In the current PM2.5 nonattainment counties, heavy–duty diesel vehicles, class 5 and higher, travel over 1.4 billion vehicle miles annually, resulting in over 20,500 tons of emissions per year. This segment of the CARROT program reduced emissions from this class of vehicles by nearly 13,000 tons over the lifetime of the equipment. Over $100,000 in grants were awarded to four entities for projects that reduced emissions from heavy-duty diesel engines, including construction equipment retrofits and idle-reduction technologies, replacement of diesel generators with new propane generators, and the replacement of farm equipment and a long-haul truck. The CARROT School Bus Replacement Program The School Bus Replacement Program provided $300,000 to eight school districts for replacing old, heavy-polluting diesel school buses for new buses that achieve the cleanest emissions standards. These efforts will reduce emissions by 89 tons over the lifetime of these buses. The Lawn Equipment Discount and Exchange Program
The Lawn Equipment Discount and Exchange Program offered 944 electric mowers and 707 electric trimmers to individuals at a discounted price and provided an additional discount for those who exchanged a gasoline-powered model. Approximately 80% of the participants scrapped their gasoline equipment, resulting in
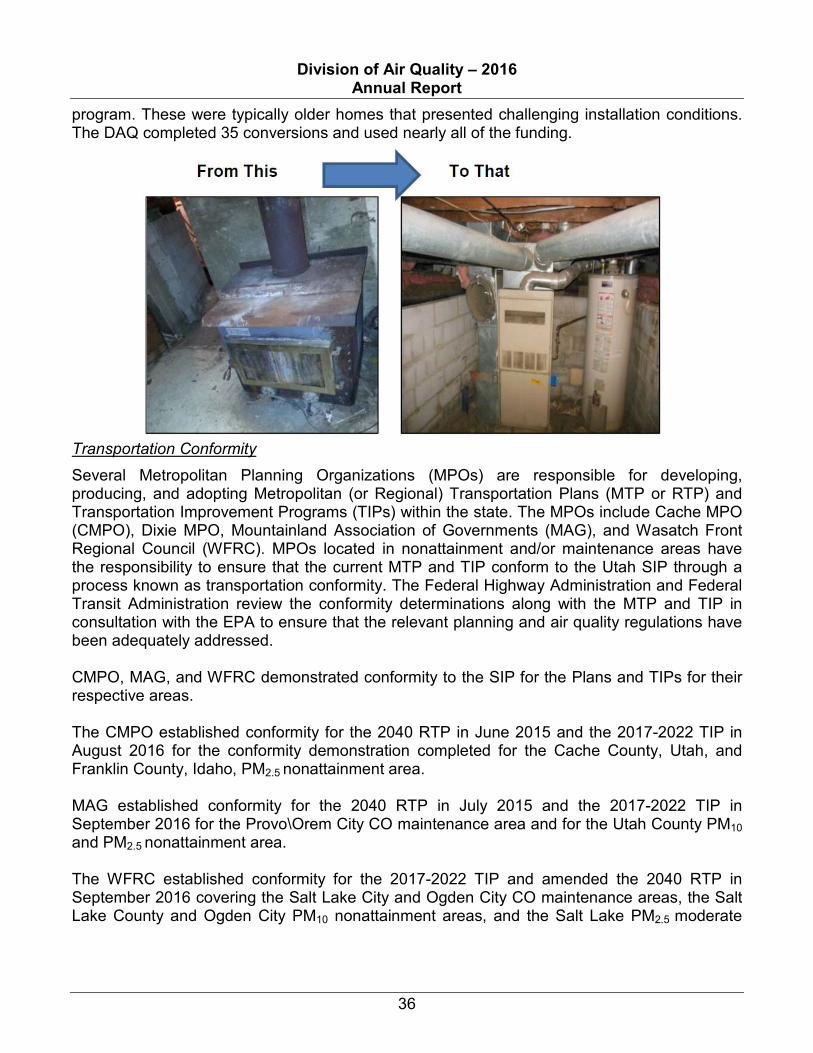
additional environmental benefits. The April 2016 discount and exchange event was a tremendous success: the registration system was overwhelmed by over 380,000 web hits in the first thirty minutes, and demand far exceeded the equipment available through legislative funding. The success of the event was widely publicized, resulting in numerous media stories, television interviews and an influx of inquiries asking when the next event would be held. The program resulted in emissions reductions equivalent to removing 424 passenger cars from Utah roads. The legislature did not appropriate funds to continue the CARROT program in FY 2017. Sole-Source Heat Conversion Program In order to improve air quality along the Wasatch Front and in Cache Valley, the 2014 Utah State Legislature provided funding to the DAQ to install clean central heating systems in homes that were heated solely by burning wood or coal and were registered with the DAQ as a “sole source residence.” Using this funding ($500,000), the State paid the entire cost to install a natural gas, propane, or electric central heating system in homes that qualified for the
Division of Air Quality – 2016 Annual Report
36
program. These were typically older homes that presented challenging installation conditions. The DAQ completed 35 conversions and used nearly all of the funding.
Transportation Conformity
Several Metropolitan Planning Organizations (MPOs) are responsible for developing, producing, and adopting Metropolitan (or Regional) Transportation Plans (MTP or RTP) and Transportation Improvement Programs (TIPs) within the state. The MPOs include Cache MPO (CMPO), Dixie MPO, Mountainland Association of Governments (MAG), and Wasatch Front Regional Council (WFRC). MPOs located in nonattainment and/or maintenance areas have the responsibility to ensure that the current MTP and TIP conform to the Utah SIP through a process known as transportation conformity. The Federal Highway Administration and Federal Transit Administration review the conformity determinations along with the MTP and TIP in consultation with the EPA to ensure that the relevant planning and air quality regulations have been adequately addressed. CMPO, MAG, and WFRC demonstrated conformity to the SIP for the Plans and TIPs for their respective areas. The CMPO established conformity for the 2040 RTP in June 2015 and the 2017-2022 TIP in August 2016 for the conformity demonstration completed for the Cache County, Utah, and Franklin County, Idaho, PM2.5 nonattainment area. MAG established conformity for the 2040 RTP in July 2015 and the 2017-2022 TIP in September 2016 for the Provo\Orem City CO maintenance area and for the Utah County PM10 and PM2.5 nonattainment area. The WFRC established conformity for the 2017-2022 TIP and amended the 2040 RTP in September 2016 covering the Salt Lake City and Ogden City CO maintenance areas, the Salt Lake County and Ogden City PM10 nonattainment areas, and the Salt Lake PM2.5 moderate
Division of Air Quality – 2016 Annual Report
37
non-attainment area including all or portions of Box Elder, Davis, Salt Lake, Weber, and Tooele Counties. Regional Haze SIP
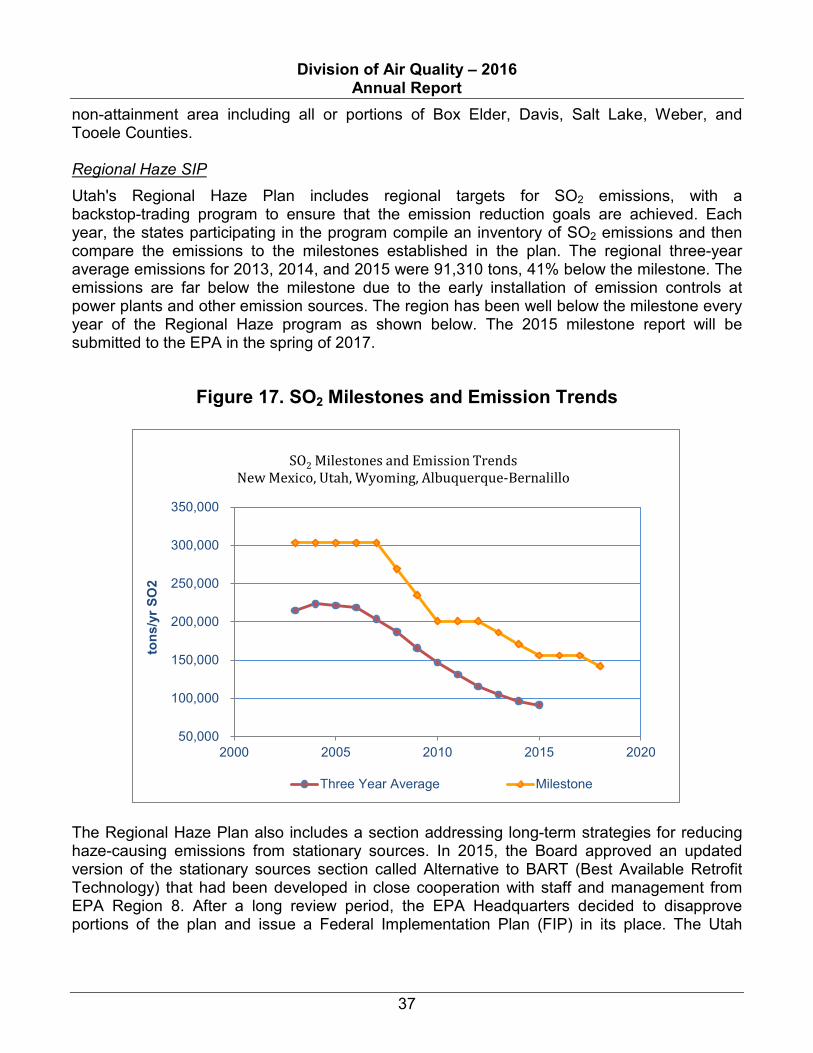
Utah's Regional Haze Plan includes regional targets for SO2 emissions, with a backstop-trading program to ensure that the emission reduction goals are achieved. Each year, the states participating in the program compile an inventory of SO2 emissions and then compare the emissions to the milestones established in the plan. The regional three-year average emissions for 2013, 2014, and 2015 were 91,310 tons, 41% below the milestone. The emissions are far below the milestone due to the early installation of emission controls at power plants and other emission sources. The region has been well below the milestone every year of the Regional Haze program as shown below. The 2015 milestone report will be submitted to the EPA in the spring of 2017.
Figure 17. SO2 Milestones and Emission Trends
The Regional Haze Plan also includes a section addressing long-term strategies for reducing haze-causing emissions from stationary sources. In 2015, the Board approved an updated version of the stationary sources section called Alternative to BART (Best Available Retrofit Technology) that had been developed in close cooperation with staff and management from EPA Region 8. After a long review period, the EPA Headquarters decided to disapprove portions of the plan and issue a Federal Implementation Plan (FIP) in its place. The Utah
50,000
100,000
150,000
200,000
250,000
300,000
350,000
2000 2005 2010 2015 2020
tons
/yr S
O2
SO2 Milestones and Emission Trends New Mexico, Utah, Wyoming, Albuquerque-Bernalillo
Three Year Average Milestone
Division of Air Quality – 2016 Annual Report
38
Attorney General’s Office, PacifiCorp, and other entities are challenging the disapproval in court. Utah Smoke Management Program
In 2012, the EPA approved Utah's Smoke Management Program, which is a key element of the Regional Haze SIP that was required under the CAA. Utah is required, under the approved plan, to manage planned burning in a manner that protects air quality and ascertains air quality impacts locally and regionally. Currently, state and federal land managers must complete multiple forms, depending on the type of planned burn. That information and subsequent planned burn data must then be transformed into a form suitable for modeling to ascertain air quality. DAQ created a web-based permitting system that automates the permitting process. The project was funded by the DAQ and state and federal land agencies that conduct planned burns in Utah. Automating the permitting process eliminates the physical application handling process and the burn data is in the system in a format that is compatible with the regional fire emissions tracking system and electronically delivered to the modelers for analysis. Utah Asthma Task Force
The Utah Asthma Task Force is a multi-agency task force to address the problem of asthma in Utah. The task force meets quarterly and has a number of projects currently underway in addition to the programs initiated under the State Asthma Plan.
Ancillary Programs Utah Air Quality Public Notifications
The DAQ provides air quality forecasting on its webpage for the current and next two days. The Air Monitoring Section (AMS) provides air pollution information based on the daily air quality status. The AMS data is used to determine the relationship of existing pollutant concentrations to the NAAQS. There is a three-tiered air quality alert system: unrestricted, voluntary action and mandatory action. This system is used to implement winter and summer controls on the use of solid fuel burning devices, fire places, and motor vehicles, and to advise the public and industrial sources to take action to reduce their pollution footprint during these events. The forecast call determines which restrictions are in place for a given county. In addition, the webpage advises the public as to current air quality conditions using the standard Air Quality Index (AQI) categories: good, moderate, unhealthy for sensitive groups, unhealthy and very unhealthy. Each advisory category listed on the webpage is accompanied by a health protection message that recommends actions affected groups can take to mitigate the effects of pollution on them and links to the AQI web site for further information. The AMS advisory is calculated for five major pollutants: ground-level ozone, particulate pollution (particulate matter), carbon monoxide, sulfur dioxide, and nitrogen dioxide. The outreach program information consolidated in the three-day forecast includes the Summer and Winter Control Programs and Choose Clean Air information.
Division of Air Quality – 2016 Annual Report
39
The DEQ is also sponsoring an electronic mail server (Listserv). Subscribers are automatically notified by e-mail when unhealthy air pollution levels are forecast throughout Utah and when action alerts are issued. The National Center for Automotive Sciences and Technology at Weber State University developed the mobile app called Utah Air for the DAQ. It provides similar information directly on smart phones and other mobile devices. The application is free and can be downloaded from both the Android and Apple app stores. As of January 2016, the application has been downloaded onto over 37,000 mobile devices. Choose Clean Air DEQ continues to emphasize the Choose Clean Air program and has developed an interactive website containing information about ways individuals can help improve air quality by making smart choices in their personal lives. The website can be found at http://www.cleanair.utah.gov/. Winter Control Program (unrestricted, voluntary action, mandatory action)
This program originated with the PM10 SIP, but was significantly strengthened in December 2012 to be much more proactive and less reactive. Now, instead of waiting until an area is exceeding a standard, action alerts are called when the DAQ meteorologists see that we are in the building stages of an inversion that will likely lead to pollution concentrations at or above the standard. The program runs annually from November through early March. In addition to the burning restrictions, residents are encouraged to drive less and are directed to information on other ways they can reduce pollution. Summer Control Program (unrestricted, voluntary action, mandatory action)
Action days are announced whenever the probability of exceeding the ozone standard is forecasted to be high. High temperature and stagnant air masses contribute to this probability. Residents are encouraged to minimize driving whenever the ozone or PM standards are approached. Vehicle Inspection/Maintenance Programs
Inspection/Maintenance (I/M) programs were adopted in the early 1980s as a required strategy to attain the ozone and carbon monoxide NAAQS. These programs were very effective in improving air quality. They have played an important role in reducing emissions that contribute to ozone and carbon monoxide. Their continued operation is necessary for the Wasatch Front to remain in attainment of these standards. The county health departments administer these programs. The most recent I/M program to be implemented in Utah is in Cache County. The program was fully implemented on January 1, 2014, and is running smoothly. Smoking Vehicles
Division of Air Quality – 2016 Annual Report
40
Vehicles emitting excessive smoke contribute to poor air quality. To promote clean air, several local health departments operate smoking vehicle education and notification programs. There were two bills passed during the 2015 General Legislative Session that help enhance the smoking vehicle programs in the state:
• HB17 clarified that visible emissions from gas or certain diesel-powered vehicles are not allowed on Utah roads.
• HB110 gave the Utah Division of Motor Vehicles the authority to suspend a vehicle’s registration if the vehicle does not meet air emissions standards.
The DAQ worked with the local health departments, Utah Division of Motor Vehicles, and Utah Highway Patrol to develop a method of enforcing these laws. People who spot a vehicle producing excessive smoke can report it through their respective county health departments: Cache County 435-792-6611 Davis County 801-546-8860 Salt Lake County 385-468-SMOG(7664) Utah County 801-851-SMOG(7664) Weber County 801-399-7140 Heavy Duty Natural Gas Vehicle Tax Credit
During the 2015 General Session, the Utah Legislature approved a new tax credit for the purchase of a heavy-duty natural gas vehicle. Heavy duty is defined in the Utah Code as a commercial category 7 or 8 vehicle. The credit is limited to an aggregate annual amount of $500,000. The credit for tax year 2015, 2016, and 2017 is $25,000 per qualified purchase; the credit for tax year 2018 is $20,000 per qualified purchase; the credit for tax year 2019 is $18,000 per qualified purchase; and the credit for tax year 2020 is $15,000 per qualified purchase. The credit went into effect retroactively on January 1, 2015. As of January 4, 2017 there have been 19 vehicles that have been approved for this tax credit, totaling $475,000. Alternative Fuel Grant Program
During the 2015 General Session, the Utah legislature established a new grant program that would enable installers to seek a grant that would lower the price of a conversion to alternative fuel technology. Previously, the grant had been available only to the individual seeking the tax credit. The bill passed, but it did not include funding. A bill (HB 87) was passed during the 2016 General Session that provided $150,000 to help fund the program. DAQ staff worked with stakeholders to develop rules that went into effect on September 8, 2016. As of January 4, 2017 DAQ has issued 2 grants totally $5,000. Utah Clean Fuel Tax Credit
The Utah Clean Fuel Tax Credit was established in 1992. The intent of this program is to provide an incentive for taxpayers to buy a clean fuel vehicle or convert their vehicles to run on
Division of Air Quality – 2016 Annual Report
41
electricity, natural gas, or propane. In order for a taxpayer to claim this nonrefundable credit, they must completely fill out tax form TC-40V and provide required documentation to the DAQ. The DAQ approved the most clean fuel tax credits for tax year 2008, with 1,523 approved credits. Since then, the number has decreased to 517 approved for tax year 2009, 551 for tax year 2010, 645 for tax year 2011, 873 for tax year 2012, 939 for tax year 2013, 937 for tax year 2014, and 242 for tax year 2015. As of January 4, 2017, there have been 19 for tax year 2016. The Utah Clean Fuel Tax Credit expired on December 31, 2016. Representative Handy has introduced a bill (HB29) for the 2017 General Session that will extend the credit. Compliance Branch The Compliance Branch is comprised of three sections: Major Source Compliance, Minor Source Compliance, and the ATLAS. These sections are responsible for ensuring compliance with all air pollution orders, permits, rules, and standards. This is accomplished through inspections, audits of stack tests and continuous emission monitoring systems (CEMS), plan and report reviews, accreditation and certification programs, compliance assistance/outreach activities, and, when necessary, enforcement actions.
Major and Minor Source Compliance The Major and Minor Source Compliance sections are responsible for ensuring compliance at more than 2,000 facilities within the state. The Major Source Compliance Section is responsible for inspections and report/plan reviews for the large facilities, audits of stack tests and continuous emission monitoring systems, and any associated enforcement. The Minor Source Compliance Section is responsible for inspections and report/plan reviews at small to medium-sized facilities, audits, stack tests, fugitive dust control, abrasive blasting, residential solid fuel burning, gasoline transport/filling station vapor recovery, open burning, and any associated enforcement.
Table 5. Major and Minor Source Compliance Summary
TASK 2016 Source Inspections 452
On-site Stack Test/CEM Audits 157
Stack Test/CEM Reviews 516
Temporary Relocations Accepted 79
Fugitive Dust Control Plans Accepted 1405
Miscellaneous Inspections 239
Complaints Received 358
VOC Inspections 0
Warning Letters 26
Division of Air Quality – 2016 Annual Report
42
Notices of Violations 2
Compliance Advisories 71
Settlements 25
Total Inspections 848
Penalties Assessed $47,851.00
Air Toxics, Lead-Based Paint, and Asbestos Section (ATLAS) ATLAS determines compliance with multiple regulations involving asbestos and lead-based paint (LBP). ATLAS is responsible for the following programs: Lead-Based Paint
Toxic Substances Control Act (TSCA) Title IV, 40 CFR Part 745 and, Utah Administrative Code (UAC) R307-840, 841, and 842. Under this program, ATLAS performs regulatory oversite of training providers, regulated projects subject to the LBP Activities Rule and the LBP Renovation, Repair, and Painting Rule, certification of individuals and firms, and lead-based paint outreach activities. Asbestos in Schools
TSCA Title II Asbestos Hazard Emergency Response Act (AHERA), 40 CFR Part 763 and, UAC R307-801-4. Under this program, ATLAS deals with the review and approval of AHERA Management Plans, performs inspections of buildings subject to AHERA, and inspections and asbestos abatement for structures subject to AHERA. Asbestos NESHAP and State Asbestos Work Practices
40 CFR Part 61, Subpart M, UAC R307-214-1 and UAC R307-801. Under this program, ATLAS deals with the certification of individuals and companies, review of asbestos project notification forms, review of demolition notification forms, review of alternative work practice requests, inspection of asbestos abatement projects, demolition of structures, and asbestos outreach activities.
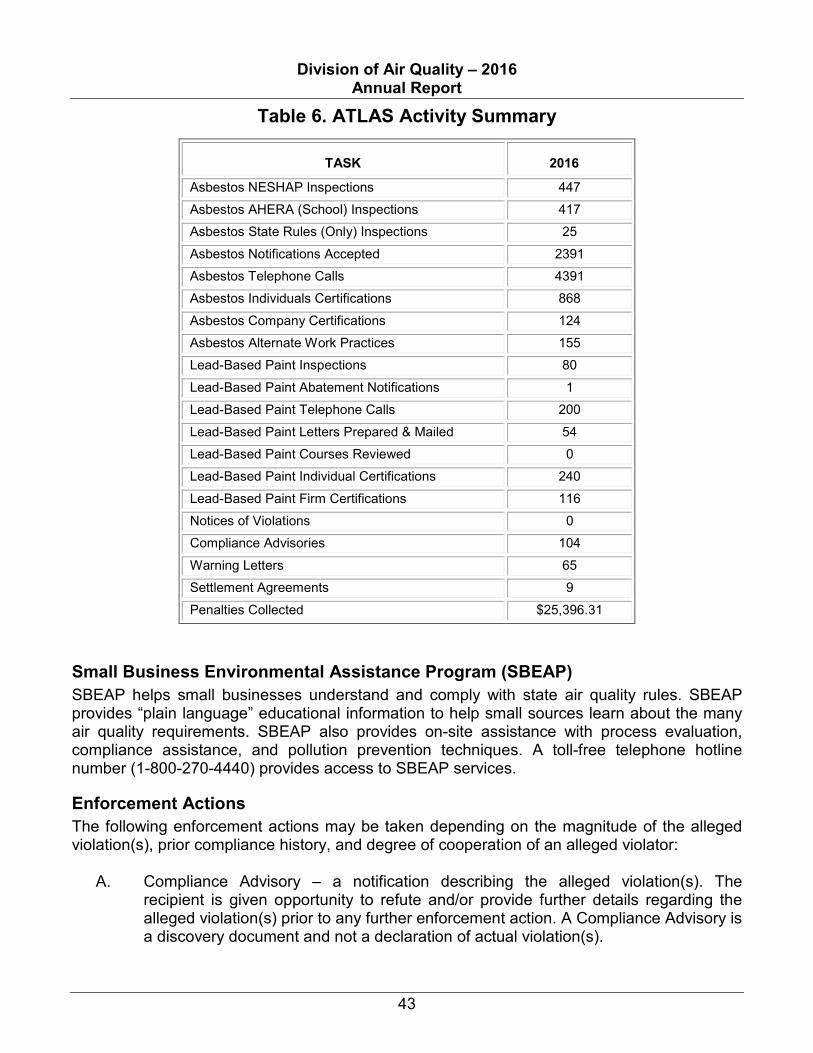
Division of Air Quality – 2016 Annual Report
43
Table 6. ATLAS Activity Summary
Small Business Environmental Assistance Program (SBEAP) SBEAP helps small businesses understand and comply with state air quality rules. SBEAP provides “plain language” educational information to help small sources learn about the many air quality requirements. SBEAP also provides on-site assistance with process evaluation, compliance assistance, and pollution prevention techniques. A toll-free telephone hotline number (1-800-270-4440) provides access to SBEAP services.
Enforcement Actions The following enforcement actions may be taken depending on the magnitude of the alleged violation(s), prior compliance history, and degree of cooperation of an alleged violator:
A. Compliance Advisory – a notification describing the alleged violation(s). The recipient is given opportunity to refute and/or provide further details regarding the alleged violation(s) prior to any further enforcement action. A Compliance Advisory is a discovery document and not a declaration of actual violation(s).
TASK
2016
Asbestos NESHAP Inspections 447
Asbestos AHERA (School) Inspections 417
Asbestos State Rules (Only) Inspections 25
Asbestos Notifications Accepted 2391
Asbestos Telephone Calls 4391
Asbestos Individuals Certifications 868
Asbestos Company Certifications 124
Asbestos Alternate Work Practices 155
Lead-Based Paint Inspections 80
Lead-Based Paint Abatement Notifications 1
Lead-Based Paint Telephone Calls 200
Lead-Based Paint Letters Prepared & Mailed 54
Lead-Based Paint Courses Reviewed 0
Lead-Based Paint Individual Certifications 240
Lead-Based Paint Firm Certifications 116
Notices of Violations 0
Compliance Advisories 104
Warning Letters 65
Settlement Agreements 9
Penalties Collected $25,396.31
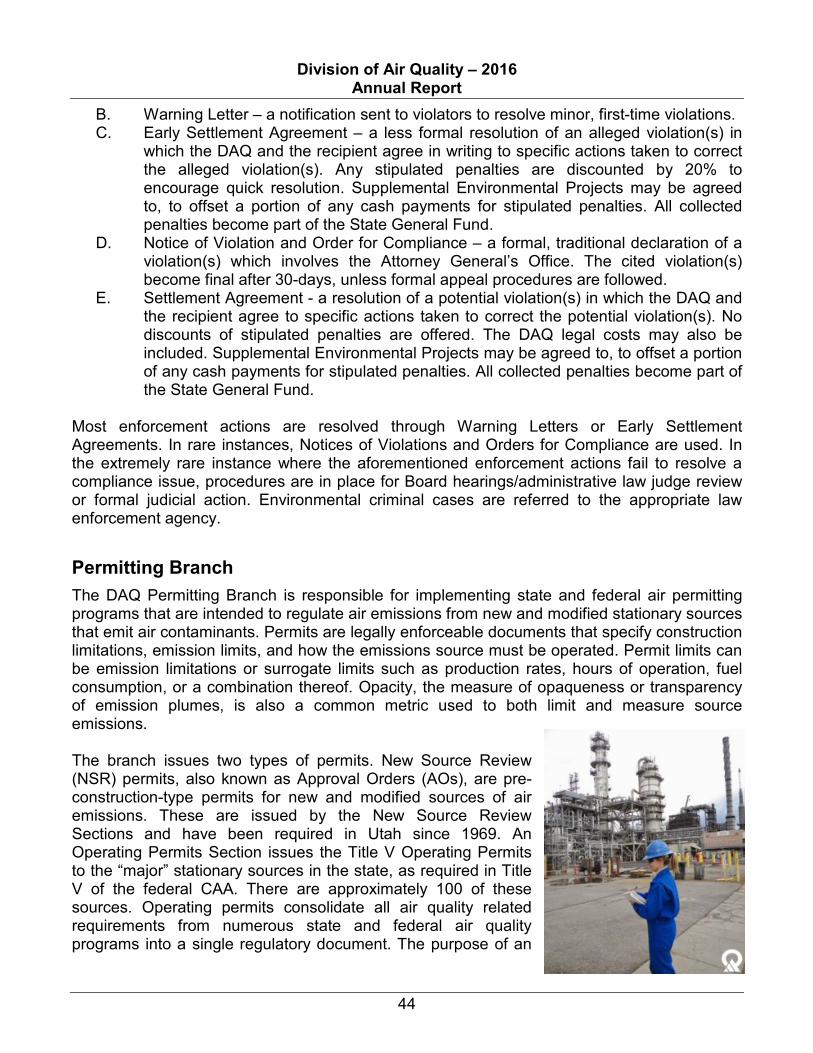
Division of Air Quality – 2016 Annual Report
44
B. Warning Letter – a notification sent to violators to resolve minor, first-time violations. C. Early Settlement Agreement – a less formal resolution of an alleged violation(s) in
which the DAQ and the recipient agree in writing to specific actions taken to correct the alleged violation(s). Any stipulated penalties are discounted by 20% to encourage quick resolution. Supplemental Environmental Projects may be agreed to, to offset a portion of any cash payments for stipulated penalties. All collected penalties become part of the State General Fund.
D. Notice of Violation and Order for Compliance – a formal, traditional declaration of a violation(s) which involves the Attorney General’s Office. The cited violation(s) become final after 30-days, unless formal appeal procedures are followed.
E. Settlement Agreement - a resolution of a potential violation(s) in which the DAQ and the recipient agree to specific actions taken to correct the potential violation(s). No discounts of stipulated penalties are offered. The DAQ legal costs may also be included. Supplemental Environmental Projects may be agreed to, to offset a portion of any cash payments for stipulated penalties. All collected penalties become part of the State General Fund.
Most enforcement actions are resolved through Warning Letters or Early Settlement Agreements. In rare instances, Notices of Violations and Orders for Compliance are used. In the extremely rare instance where the aforementioned enforcement actions fail to resolve a compliance issue, procedures are in place for Board hearings/administrative law judge review or formal judicial action. Environmental criminal cases are referred to the appropriate law enforcement agency. Permitting Branch The DAQ Permitting Branch is responsible for implementing state and federal air permitting programs that are intended to regulate air emissions from new and modified stationary sources that emit air contaminants. Permits are legally enforceable documents that specify construction limitations, emission limits, and how the emissions source must be operated. Permit limits can be emission limitations or surrogate limits such as production rates, hours of operation, fuel consumption, or a combination thereof. Opacity, the measure of opaqueness or transparency of emission plumes, is also a common metric used to both limit and measure source emissions. The branch issues two types of permits. New Source Review (NSR) permits, also known as Approval Orders (AOs), are pre-construction-type permits for new and modified sources of air emissions. These are issued by the New Source Review Sections and have been required in Utah since 1969. An Operating Permits Section issues the Title V Operating Permits to the “major” stationary sources in the state, as required in Title V of the federal CAA. There are approximately 100 of these sources. Operating permits consolidate all air quality related requirements from numerous state and federal air quality programs into a single regulatory document. The purpose of an
Division of Air Quality – 2016 Annual Report
45
operating permit is to clarify for the permit holder, as well as DAQ compliance inspectors, the wide range of requirements applicable to any regulated source by placing those requirements into one consolidated document. In addition, the branch processes a number of smaller actions such as de minimus determinations for NSR, name changes, tax exemption certificates for pollution control equipment purchases, and soil aeration approvals.
New Source Review Any new or modified source of air pollution in Utah is required to obtain an AO before it is allowed to begin construction. For areas that are not in compliance with the NAAQS, an NSR permit assures that air quality is not further degraded from the existing levels by new emission sources. In areas that are in compliance with the NAAQS, an NSR assures that new emissions do not significantly worsen air quality. These processes are outlined in both state and federal rules. The application for an AO, called a notice of intent (NOI), is reviewed to make sure that the source installs appropriate state-of-the-art emission controls. For major sources in nonattainment areas, state-of-the-art technology is known as lowest achievable emissions rate (LAER). For areas in attainment of the NAAQS and for minor sources in nonattainment areas, state-of-the-art controls are known as the best available control technology (BACT). Both LAER and BACT are case-by-case determinations of control technology for a specific source. BACT takes into account both the cost and environmental benefits of the control equipment, while LAER technology takes into account only environmental benefits. The general public and the EPA are given an opportunity to review the proposed approval order before it is issued. The Utah Air Quality Rules specify the criteria indicating which sources must obtain an AO. The New Source Review permitting program issued 373 permits. It took an average of 141 days to issue the permit from the submission of a complete application. Potential applicants are encouraged to contact the DAQ prior to submitting the necessary paperwork.
Operating Permits Congress created Title V of the CAA in 1990. This Title requires states to issue an operating permit to the larger or “major” sources of air pollution within the state. Utah developed and submitted a program in 1994 and received approval from the EPA in 1995. Operating permits are legally enforceable documents issued to air pollution sources after the source has begun to operate. A primary purpose of the permit is to consolidate the applicable requirements from the many and varied air quality programs such as the NSR, federal New Source Performance Standards (NSPS) and National Emission Standards for Hazardous Air Pollutants (NESHAP), and Maximum Available Control Technology (MACT). Like the AOs, the general public is given an opportunity to review the draft operating permits before they are issued. In addition, the EPA has up to 45 days to review the proposed operating permit. The criteria indicating which sources must obtain an operating permit are specified in R307-415 of the Utah Administrative Code (UAC). As with the NSR permit or AOs, potential applicants are encouraged to contact the DAQ prior to submitting the necessary paperwork.
Division of Air Quality – 2016 Annual Report
46
Another significant objective of the Title V program is to shift the compliance liability from the regulating agency to the permitted source. Each year, the source must certify that it is in compliance with all permit terms and conditions, or indicate non-compliance issues. False reports have criminal implications beyond the civil liabilities of other violations. In addition, sources must report the results of monitoring at least every six months. Permit provisions for monitoring, record keeping, and reporting are added or enhanced to assure compliance with the permit conditions and limits. An operating permit has a life of only five years (as opposed to the AO that does not expire. These permits, both initially and upon renewal, are complex and care must be taken to ensure that federal requirements for the Compliance Assurance Monitoring Rule (CAM) and any other new requirements (such as new MACT Standards) are included.