Embed Size (px)
Citation preview

US/UK M&A Deal MonitorQ4 2015 For future copies of this publication, please sign-up via our link at www.deloitte.co.uk/usukdealcorridor

To start a new section, hold down the apple+shift keys and click
to release this object and type the section title in the box below.
MethodologyData in the Deloitte M&A Deal Monitor are based on deal volumes and values in Thomson One Banker and Deloitte analysis. Note, deal value calculations are based on M&A deals for which value is disclosed – deal values are not disclosed for a significant proportion of M&A deals. All value and volume calculations are based on announced deals which may not be completed; value calculations are based on deals for which value is disclosed, while volume calculations are based on all announced deals whether or not value is disclosed. The Deal Monitor includes volume and value data for the most recent 10 quarters; in this edition data run from Q3 2013 to Q4 2015 inclusive.
In this publication, references to Deloitte are references to Deloitte LLP, the UK member firm of DTTL.
The Deloitte US/UK M&A Deal Monitor 1
The corridor of power 2
The ‘Wall of Money’ remains intact 8
Private Equity: The US at the forefront 9
By Sector: TMT still leads M&A flow in the corridor 11
Capital cities dominate, but regions are catching up 15
Conclusion 19
US/UK M&A Deal Corridor Executive 20
US/UK M&A Deal Corridor Sector contacts 20
Endnotes 21
Contents

To start a new section, hold down the apple+shift keys and click
to release this object and type the section title in the box below.
US/UK M&A Deal Monitor Q4 2015 1
2015 was a record breaking year for global M&A with around $4.3 trillion worth of deals announced. The M&A wave was largely led by the US, fuelled by a resurgent economy, strong consumer spending and low unemployment. This provided a massive boost in confidence and US companies announced around $1.7 trillion worth of deals, the highest in 15 years.
Deloitte is a market leading firm in this deal corridor with a differentiated scale and breadth of capabilities, serving clients who are increasingly operating at a global level.
US companies were the most active investors into Europe, having announced $125 billion worth of deals, of which $51 billion was spent on acquiring UK companies. The combined US/UK deal corridor was worth around $91 billion in 2015, underscoring the importance of this corridor for the UK.
We are delighted to present this first edition of the US/UK M&A Deal Monitor.
The Deloitte US/UK M&A Deal Monitor
Welcome to the first edition of the Deloitte US/UK M&A Deal Monitor. The US/UK M&A deal corridor is the largest bilateral cross border deal corridor in the world by value and by volume.
There are almost two US
acquisitions in the UK for every one UK
acquisition in the US
UK outbound dealshave run at approximately double the value* ofUS outbound dealsover the first three quarters of 2015.
Three out of every ten US outbound deals are backed by Private Equity.
The TMT sector is the biggest M&A arena by volume. US outbound buyers lead by numbers; UK outbound buyers lead by value.
UK outbound
US outbound
3 10
Key figures
* Where value is disclosed
Cahal DowdsUK Head of US/UK M&A Deal Corridor
Andy WilsonUS Head of US/UK M&A Deal Corridor

To start a new section, hold down the apple+shift keys and click
to release this object and type the section title in the box below.
2
The corridor of powerThe US/UK M&A deal corridor is now the largest bilateral cross border deal corridor in the world by value* and by volume
• Total deal volumes in the US/UK M&A deal corridor rose slightly in each of the last four quarters to Q4 2015, with 130 deals in the final quarter.
• UK outbound deals have run at roughly double the value of US outbound deals over the first three quarters of 2015.
• US outbound deals led by value in Q4 2015 due to the US acquisition of Visa Europe.
• Overall US outbound investors do more deals, but total disclosed value is lower.
• M&A activity has more tailwinds than headwinds: global conditions continue to support US/UK corridor deals.
The US/UK M&A deal corridor is now the largest bilateral cross-border deal corridor in the world by value and by volume. Despite rising interest rates in the US and the possibility of a modest slowing of US growth, the driver factors behind US/UK dealmaking are set to remain strong. These include the slowdown in emerging markets (EMs), tightening EM monetary conditions, and continued weakness in commodity prices which is undermining confidence in EM resource-dependent economies.
Add to that the continued outperformance of the broad economies of the US and UK, the commonality of business structures and styles between the US and UK, and the ready availability of corporate assets in both economies; these factors make it likely that the transatlantic corridor will remain the busiest and most valuable M&A market in the world. In Deloitte’s 2015 M&A trends report, one-fifth of the 2,500 US corporates and private equity firms polled expressed a preference for the UK as the place they would most like to invest abroad, while 85% of corporate respondents and 94% of private equity respondents said M&A would continue at the same rate or greater.1 In addition, the Q4 2015 Deloitte CFO Survey shows that while UK CFOs are reporting declining confidence about prospects for emerging economies and the Eurozone, they are now most confident about the prospects for UK and US growth.2
The rotation of investment appetite out of weakening EMs and into the stronger developed markets continues to drive divestments and acquisitions in the US and the UK and between the two economies. Deal value calculations provide an indication of the strength of M&A appetite in the US/UK M&A deal corridor, but can be volatile quarter to quarter due to the impact of small numbers of high value deals. Deal volumes provide a less volatile indication of trends over time and are more accurate as a significant proportion of deal values are not disclosed.
UK CFOs are now most confident about the prospects for UK and US growth
* Where value is disclosed

To start a new section, hold down the apple+shift keys and click
to release this object and type the section title in the box below.
US/UK M&A Deal Monitor Q4 2015 3
0
10
20
30
40
50
60
70
80
20
40
60
80
100
120
2015 Q42015 Q32015 Q22015 Q12014 Q42014 Q32014 Q22014 Q12013 Q42013 Q3
Figure 1. US/UK cross border M&A deals
US outbound deal volumes
Note: UK outbound – UK acquisitions into US US outbound – US acquisitions into UK
*Where value is disclosed
*Where value is disclosed** Includes Pfizer/AstraZeneca
UK outbound deal volumesUS outbound deal values* (£bn)UK outbound deal values* (£bn)
Figure 2. US/UK M&A activity 2015
UK OutboundM&A activity
US OutboundM&A activity
Value*£25.6bn
Volume176
Value*£32.7bn
Volume322
**
Deal activity in the corridor to accelerate in 2016
Total disclosed deal value is now at a 10-quarter high

To start a new section, hold down the apple+shift keys and click
to release this object and type the section title in the box below.
4
US outbound UK outbound
0
5
10
15
20
25
30
2015Q4
2015Q3
2015Q2
2015Q1
2014Q4
2014Q3
2014Q2
2014Q1
2013Q4
2013Q3
0
5
10
15
20
25
30
2015Q4
2015Q3
2015Q2
2015Q1
2014Q4
2014Q3
2014Q2
2014Q1
2013Q4
2013Q3
Less than £250m Between £250m and £5bn Greater than £5bn Less than £250m Between £250m and £5bn Greater than £5bn
Deals less than £250m constitute 81%of the total disclosed deal value dealssince Q3 2013.
US outbound
Deals less than £250m constitute 86% of the total disclosed deal value deals since Q3 2013.
UK outbound
81%86%
Figure 3. M&A deals by value
*Where value is disclosed
Despite a number of big ticket deals, activity continues to thrive in the mid market (<£250m EV) sector
M&A deals by volume and value*

To start a new section, hold down the apple+shift keys and click
to release this object and type the section title in the box below.
US/UK M&A Deal Monitor Q4 2015 5
US outbound investors are consistently doing deals at approximately double the rate of UK outbound investors. But US outbound disclosed values have been lower than UK outbound values over Q2 and Q3 2015, rising exceptionally in Q4 to $25.6 billion due largely to the $22.7 billion US acquisition of Visa Europe. Despite volatility (UK outbound values in particular fell sharply in Q1 2015), the 10-quarter trend has been for US outbound value to rise gradually and for UK outbound value to rise strongly.
In terms of the number of deals, there are almost two US acquisitions in the UK for every one UK acquisition in the US: this has been a consistent feature of every quarter over the period Q3 2013 to Q4 2015. That US companies should do more deals is unsurprising given the larger size of the US economy. However, adjusted for the relative size of the two economies UK companies have the greater appetite for cross-border acquisitions in the corridor (at $17.3 trillion US GDP is over five times greater than that of the UK, while US acquisitions in the UK are slightly less than double the number of UK acquisitions in the US).
In both directions the technology, media and telecommunications (TMT) sector accounts for by far the biggest share of deals by volume – in Q4 2015, over 26% of UK outbound acquisitions and over 27% of US outbound acquisitions were of TMT businesses. The business infrastructure and professional services (BIPS) sector is the next most active, while remaining deals were spread roughly equally over other business sectors with the exception of energy & resources, and real estate, which are less active in recent M&A activity in the corridor.
There are almost two US acquisitions in the UK for every one UK acquisition in the US
US corporate and private equity appetite for UK assets is on the rise. The focus has historically been on large scale assets where the US is a strategic growth opportunity for the target or where UK represents an opportunity to acquire scaled assets with incremental clients, differentiated technology or management strength. Additionally, expansion into the US has challenged many
UK businesses who now are looking to acquire to access the market scale and strength in the US.Katie Folwell-Davies Partner, Business Services

To start a new section, hold down the apple+shift keys and click
to release this object and type the section title in the box below.
6
Figure 4. Deal volume & value by industry since Q3 2013
41110
92
24
98121
68 33
41
47
59
63
10
16328
280
7.4
10.6
0.7
2.4
6.0
3.8
0.5
11.8
5.2
2.5
2.2
19.4
74.5**
3.4
4.0
10.3
BIPS CB E&R FSI LSHC MFG RE TMT
Deal value* ($bn)
*Where deal value is disclosed** Includes Pfizer/AstraZeneca and Pfizer/Allergan
US outbound
UK outbound – deal volume
UK outbound
US outbound – deal volume
KeyBIPS = Business, infrastructure and professional services; CB = Consumer business; E&R = Energy and resources; FSI = Financial services and insurance;LSHC = Life sciences and healthcare; MFG = Manufacturing; RE = Real estate; TMT = Technology, media and telecommunications
In 2016 we expect to see continued diversity in UK outbound activity into US
Deal volume and value* by industry since Q3 2013

To start a new section, hold down the apple+shift keys and click
to release this object and type the section title in the box below.
US/UK M&A Deal Monitor Q4 2015 7
0
20
40
60
80
100
2015Q4
2015Q3
2015Q2
2015Q1
2014Q4
2014Q3
2014Q2
2014Q1
2013Q4
2013Q3
UK outbound
Other Private Equity buy and build strategy Restructuring
US outbound
0
20
40
60
80
100
2015Q4
2015Q3
2015Q2
2015Q1
2014Q4
2014Q3
2014Q2
2014Q1
2013Q4
2013Q3
Strengthen operations Expansion of products/services Geographical expansion Increase in shareholders value
Figure 6. Deal volume by strategy
US outbound M&A in the corridor is overwhelmingly growth-focused

To start a new section, hold down the apple+shift keys and click
to release this object and type the section title in the box below.
8
• Monetary conditions combined with strong growth favour continued M&A in the corridor.
• Many companies have cash to buy revenue growth.
• The search for yield is creating alternative financing opportunities.
The range of financing options for M&A deals in the US/UK M&A deal corridor continues to grow. Many companies have cash to spend, but those that need to borrow are benefitting from the ready availability of capital from conventional and alternative sources all looking for yields higher than either sovereign debt, blue chip debt or equities can offer.
Many companies on both sides of the Atlantic are still cash rich, after a long cycle of above-average profits and below-average rates of re-investment. Rising confidence about future demand is now stimulating somewhat higher levels of internal re-investment, and boosting acquisition appetite. Companies are also under pressure from institutional shareholders to use their cash piles to grow profits and dividends through new investment.
However a very important factor in M&A activity is still the availability of debt finance, and here the universal search for yield is driving more capital into M&A financing.
The ‘Wall of Money’ remains intactCompanies that need to borrow are benefitting from the ready availability of capital from conventional and alternative sources
Borrowers are benefitting from very high levels of market liquidity and a convergence of terms between loans and bonds and between the US and UK Capital Markets. It remains to be seen whether recent equity market volatility, combined with divergence between US and
European central bank policies, may lead to cracks appearing in an overheated credit market.Fenton Burgin Partner, Head of UK Debt Advisory

To start a new section, hold down the apple+shift keys and click
to release this object and type the section title in the box below.
US/UK M&A Deal Monitor Q4 2015 9
• Three out of every 10 US outbound deals are backed by private equity.
• The share of private equity in UK outbound deals is half that in US outbound deals.
US outbound deals account for most private equity (PE)activity in the US/UK M&A deal corridor. Although the total value of PE deals is less than those by corporates, buyside PE still accounted for 257 US outbound deals over the last ten quarters, or just over 30% of all deals. PE accounted for only 16% of UK outbound deals.
The high level of US PE activity in the corridor is partly due to the size and resources of the US PE sector, and partly due to geographical restrictions on UK PE investment. PE houses in the US hold a large amount of money chasing a limited number of attractive acquisition opportunities, making investors more willing to look outside the US for targets. The UK PE market is smaller, and investment money is more likely to be geographically restricted by mandate. The result is very strong competition for good UK businesses among both US and UK PE investors. In addition the depth of the PE market in the US means that there are many sector-focused US PE firms looking to make mid-market deals on the rationale that they are uniquely able to drive value in their portfolio of businesses through their industry contacts and knowledge.
PE firms in the US frequently target UK companies that have established business operations in the US and which could grow. The most active sectors for US firms have been TMT and business infrastructure and professional services (BIPS), where a key strategy of target companies is expansion of their operations
Private Equity: The US at the forefront
in North America. PE firms with sector-specific funds (typically of up to $1.5 billion) focus primarily on mid-market deals of up to $300 million. More generalist funds tend to be active in deals of up to $600 million, also investing where there is a strong US growth story. Deals above this size are usually led by the large ‘bulge bracket’ funds that have permanent offices in the UK.
Due to the depth of the private equity market in the US, there are many sector-focused US PE firms looking to make mid-market deals. They see themselves as being able to drive value in their portfolio of businesses through their industry contacts and knowledge. Some US PE firms also see their ability to drive growth in North America as a key value lever and a means by which they can differentiate themselves from European PE funds.
The most active sectors for US firms have been TMT and business and professional services. The influx of US PE funds into the UK market is further driving pricing
and competition among PE investors (both European and US) for high-quality UK businesses. Richard Parsons Partner, Head of Private Equity Coverage

To start a new section, hold down the apple+shift keys and click
to release this object and type the section title in the box below.
10
Figure 7. Corporate & PE deals by volumeUS outbound UK outbound
Corporate backed Buyside financial sponsor backed
0
20
40
60
80
100
120
2015Q4
2015Q3
2015Q2
2015Q1
2014Q4
2014Q3
2014Q2
2014Q1
2013Q4
2013Q3
0
20
40
60
80
100
120
2015Q4
2015Q3
2015Q2
2015Q1
2014Q4
2014Q3
2014Q2
2014Q1
2013Q4
2013Q3
Three out of every 10 US outbound deals are backed by private equity

To start a new section, hold down the apple+shift keys and click
to release this object and type the section title in the box below.
US/UK M&A Deal Monitor Q4 2015 11
• The TMT sector is the biggest M&A arena by volume. US outbound buyers lead by numbers; UK outbound buyers lead by value.
• Tight US operating conditions are driving US healthcare corporates to expand UK operations.
• In manufacturing US outbound M&A leads by volume and by value.
• In financial services US buyers are augmenting existing UK portfolios.
Over 25% of M&A transactions in the US/UK M&A deal corridor involve technology, media and telecoms (TMT) companies and assets. The US and to a lesser extent the UK are home to many of the largest TMT companies, so it is not surprising that a large proportion of US/UK M&A deals are in this sector. There are more deals involving US purchases of UK TMT companies than UK acquisitions in the US (there have been 280 US outbound TMT deals in the last 10 quarters, compared to 163 UK outbound TMT deals).
Figure 8. TMT deal volume since Q3 2013
2013Q3201
5Q4
2013Q4
2014Q
22014Q1
2014Q3
2014Q4
2015Q120
15 Q220
15Q
3
US outbound
201817
16 15
2724
3
6
7
7
7
7
1
33
3
1
1
3
0
27
91
13
12
3
20
51
Technology TelecommunicationsMedia
UK outbound
2013Q3201
5Q4
2013Q4
2014Q
22014Q1
2014Q3
2014Q4
2015
Q12015 Q2
2015
Q3
1111 8
11
119
2
5
5
5
4
1
333
7 1
05
3
14
0
13
1
124
0
0
0
11
By sector: TMT still leads M&A flow in the corridor
To start a new section, hold down the apple+shift keys and click
to release this object and type the section title in the box below.
12
However, UK outbound deals have been higher value over the period – totalling $17.3 billion, compared to $15 billion for US outbound deals. The volume of deals in this sector can be attributed largely to the rapid pace of innovation and changing consumer habits: typically large TMT companies seek to acquire start-up and established businesses, which is a quicker route to growth than developing technology and media businesses in-house. Most deal activity has been in the technology sub-sector, and to a lesser extent media. There have been relatively few acquisitions of telecommunications businesses.
Most US/UK M&A deal activity in consumer business is in the food and beverages sub-sector, followed by personal health care and luxury and apparel. Although the majority of acquisitions are made by corporates there is also considerable private equity interest, although PE firms have been surprised at the willingness of corporates to pay high prices for consumer businesses.
PE firms have faced stiff competition from corporates in Consumer Business
The desire to enhance profitability is a driver for M&A ,whether this is about achieving sufficient scale of operations to remain competitive or rationalising product and brand portfolios that are no longer regarded as sufficiently profitable or core businesses. Divestments by multinationals of subsidiaries of small-to-mid-market size can create opportunities for a buyer to turn round an under-performing business by investing new capital and rejuvenating its management.
Although the majority of acquisitions are made by corporates there is also considerable private equity interest. PE firms have been surprised at the willingness of corporates to pay high prices for consumer businesses. The competition for acquisitions has pushed
up valuations, and buyers in this sector need to have a clear plan about how they will obtain a good return on their investment.
Conor Cahill Partner, Consumer Business
The TMT sector accounts for by far the biggest share of deals by volume in the corridor. The volume of deals in this sector can be attributed largely to the rapid pace of innovation and changing consumer habits. TMT companies in general consider it better to acquire other businesses than to develop products in-house. In-house development takes too long, and there is considerable
risk of being left behind by competitors who use M&A to move ahead more quickly.
Jason Richards Partner, TMT
To start a new section, hold down the apple+shift keys and click
to release this object and type the section title in the box below.
US/UK M&A Deal Monitor Q4 2015 13
The US is leading in the life sciences and healthcare (LSHC) M&A trade by volume over the last 10 quarters (68 US outbound deals compared to 41 UK outbound deals, although UK outbound disclosed deal value is higher at $8.8 billion compared to US outbound value at $7.2 billion after adjustment for the abandoned Pfizer-AstraZeneca deal). For US buyers the LSHC trade is driven by regulation, tax, and restructuring strategy. The UK is particularly attractive to US pharmaceutical corporations because its overall tax environment is supportive (including the ‘Patent Box’ tax relief system and generous R&D tax credits).
Restructuring is another driver in both directions of the US/UK M&A deal corridor – large pharmaceutical companies are attempting to focus on a smaller number of core therapeutic areas, and moving to cut back on their in-house R&D activities while acquiring smaller innovative firms that already have promising new products in early development. There is also growing interest in health care real estate, with US REITS seeking to acquire premium property in the UK at attractive yields.
In the manufacturing sector the volume of US outbound M&A is markedly higher than UK outbound investment, but as with other sectors UK outbound value is higher. Deal activity remained strong in Q4 2015, with US buyers doing 110 deals in the last 10 quarters at a total value of $5 billion compared to the $5.6 billion worth of UK outbound M&A across 63 deals. Much of the interest among UK companies in US acquisitions is in deals in the defence sub-sector.
UK is particularly attractive to US pharma
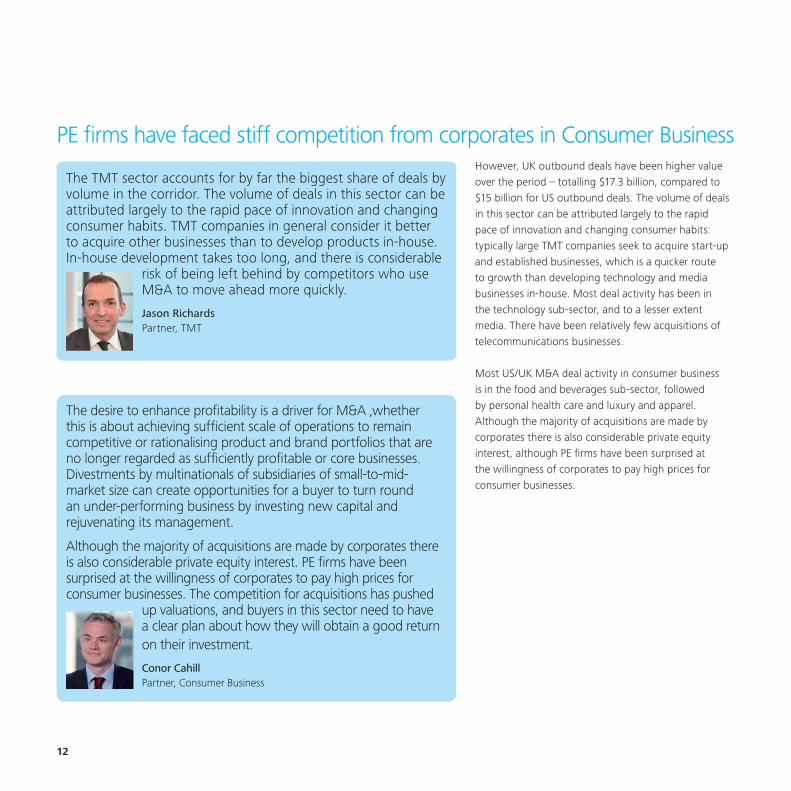
In the manufacturing sector, most US/UK M&A deals involve US buyers of UK industrial assets. This is in part due to a relatively strong US dollar, making UK targets good value for US buyers.
Much of the interest among UK companies in US acquisitions is in deals of less than £100 million, particularly in the defence sub-sector and in the Internet of Things (Industry 4.0).
Interest in M&A in the manufacturing sector remains strong. The prospects for 2016 may well depend on the strength of the
US dollar and continuing interest among US buyers to acquire assets in the UK and Europe.
Duncan Johnston Partner, Manufacturing
Large pharmaceutical companies continue to rationalise their businesses and focus on a smaller number of core therapeutic areas in which they can specialise and achieve a strong market presence or market leadership. These companies are also seeking to externalise their R&D activities and use joint ventures or licensing arrangements to obtain or develop new products. There also appears to be a tendency for large pharmaceutical companies to cut back on their in-house R&D activities, and
instead develop their product portfolio by acquiring small innovative firms that already have a new product under development
David Jones Partner, Healthcare and Life Sciences

To start a new section, hold down the apple+shift keys and click
to release this object and type the section title in the box below.
14
In the US/UK financial services M&A deal corridor, US outbound investors dominate in terms of deal volume (with 92 deals in the last 10 quarters, compared to 33 UK outbound deals ). In contrast to other sectors US outbound deal value is also higher at $28.4 billion compared to UK outbound deals worth $3.5 billion, although the US outbound figure is largely the result of the single $22.7 billion US acquisition of Visa Europe. Typically US outbound investors are acquiring UK businesses in addition to those they already own rather than entering the UK for the first time. In the banking sub-sector, there is interest from specialist US companies in UK acquisitions of credit providers: the US market is heavily regulated and US companies see opportunities for using their skills and experience to develop businesses in the UK.
In the US/UK M&A deal corridor, most deals are by US Financial Services companies acquiring additional UK targets to add to those they already own. There are not so many US acquirers entering the UK for the first time.
Banks and insurance companies are also being challenged by disruptive technology and innovative methods of operating, such as price comparison web sites for insurance, peer-to-peer insurance, telematics technology in insurance (to anticipate or avoid losses and minimise risks), peer-to-peer lending, crowdfunding, online personal trading platforms and personal
wealth platforms. As we see in the technology sector generally, innovation can be a driver of mergers and acquisitions.
Anurag Verma Partner, Financial Services
US buyers account for three times as many deals in Financial Services
To start a new section, hold down the apple+shift keys and click
to release this object and type the section title in the box below.
US/UK M&A Deal Monitor Q4 2015 15
Capital cities dominate, but regions are catching up
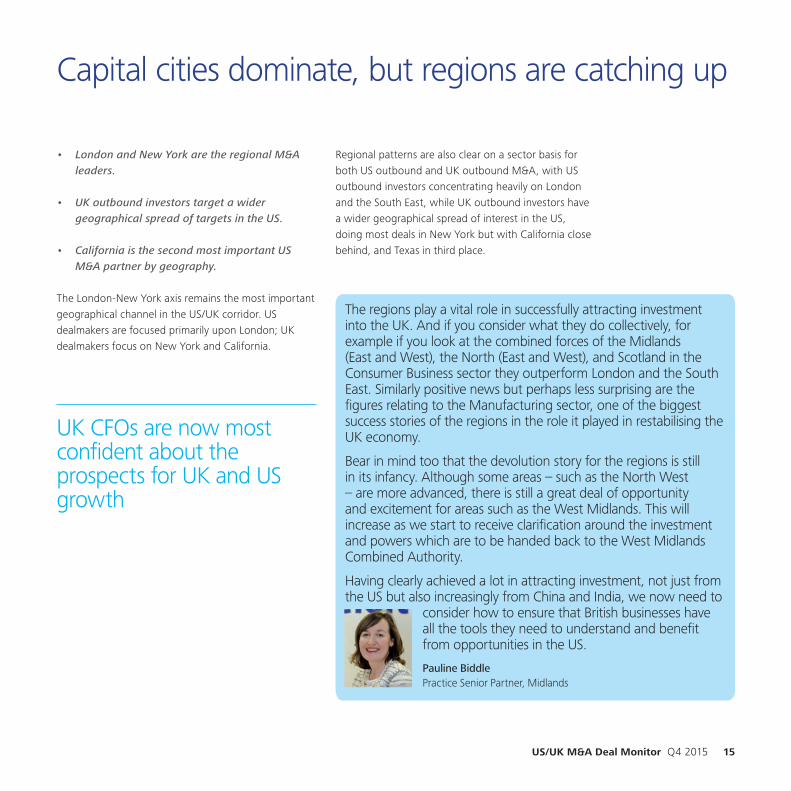
The regions play a vital role in successfully attracting investment into the UK. And if you consider what they do collectively, for example if you look at the combined forces of the Midlands (East and West), the North (East and West), and Scotland in the Consumer Business sector they outperform London and the South East. Similarly positive news but perhaps less surprising are the figures relating to the Manufacturing sector, one of the biggest success stories of the regions in the role it played in restabilising the UK economy.
Bear in mind too that the devolution story for the regions is still in its infancy. Although some areas – such as the North West – are more advanced, there is still a great deal of opportunity and excitement for areas such as the West Midlands. This will increase as we start to receive clarification around the investment and powers which are to be handed back to the West Midlands Combined Authority.
Having clearly achieved a lot in attracting investment, not just from the US but also increasingly from China and India, we now need to
consider how to ensure that British businesses have all the tools they need to understand and benefit from opportunities in the US.
Pauline Biddle Practice Senior Partner, Midlands
• London and New York are the regional M&A leaders.
• UK outbound investors target a wider geographical spread of targets in the US.
• California is the second most important US M&A partner by geography.
The London-New York axis remains the most important geographical channel in the US/UK corridor. US dealmakers are focused primarily upon London; UK dealmakers focus on New York and California.
Regional patterns are also clear on a sector basis for both US outbound and UK outbound M&A, with US outbound investors concentrating heavily on London and the South East, while UK outbound investors have a wider geographical spread of interest in the US, doing most deals in New York but with California close behind, and Texas in third place.
UK CFOs are now most confident about the prospects for UK and US growth

To start a new section, hold down the apple+shift keys and click
to release this object and type the section title in the box below.
16
UK outbound US outbound
UK OutboundUS Outbound
Figure 9. UK outbound and US outbound
0 60 120 180 240 300
BIPS CB E&R FSI LSHC MFG RE TMT BIPS
London
South East
East
Scotland
South West
North West
Yorkshire and the Humber
East Midlands
Wales
North East
Northern Ireland
West Midlands
Offshore
0 60 120 180 240 300
London
South East
East
Scotland
South West
North West
Yorkshire and the Humber
East Midlands
Wales
North East
Northern Ireland
West Midlands
Offshore
CB E&R FSI LSHC MFG RE TMT
KeyBIPS = Business, infrastructure and professional services; CB = Consumer business; E&R = Energy and resources; FSI = Financial services and insurance;LSHC = Life sciences and healthcare; MFG = Manufacturing; RE = Real estate; TMT = Technology, media and telecommunications
Offshore 1
West Midlands 25
Northern Ireland 8
North East 8
Wales 11
East Midlands 31
Yorkshire and the Humber 34
North West 51
South West 33
Scotland 49
East 54
South East 146
London 262
Offshore 1
West Midlands 2
Northern Ireland 2
North East 0
Wales 4
East Midlands 6
Yorkshire and the Humber 12
North West 12
South West 17
Scotland 18
East 29
South East 73
London 240
US outbound investors are concentrating heavily on London and the South East

To start a new section, hold down the apple+shift keys and click
to release this object and type the section title in the box below.
US/UK M&A Deal Monitor Q4 2015 17
Overall technology, media and telecommunications (TMT) deals make up the largest part of US outbound transactions with deals in the sector running at over double the next most active sector (business infrastructure and professional services). In both cases these deals are heavily concentrated in London although there have been a significant number of TMT deals in the south-east of England excluding London, reflecting a secondary concentration of TMT companies along the M4 and M3 industrial corridors.
The east of England has also seen deals in both TMT and life sciences and healthcare, while most US outbound deals in manufacturing have been in the Midlands and northern England.
There have been a significant number of TMT deals in the south-east of England excluding London, reflecting a secondary concentration of TMT companies along the M4 and M3 industrial corridors

To start a new section, hold down the apple+shift keys and click
to release this object and type the section title in the box below.
18
US outbound UK outboundFigure 10. US outbound and UK outbound
0 40 80 120 160 200 0 40 80 120 160 200
UK Outbound – Target IndustryUS Outbound – Target Industry
BIPS CB E&R FSI LSHC MFG RE TMT BIPS CB E&R FSI LSHC MFG RE TMT
KeyBIPS = Business, infrastructure and professional services; CB = Consumer business; E&R = Energy and resources; FSI = Financial services and insurance;LSHC = Life sciences and healthcare; Mfg = Manufacturing; RE = Real estate; TMT = Technology, media and telecommunications
Others 94 Virginia 10
North Carolina 10Delaware 10
D. of Columbia 10Washington 11
Colorado 11 Wisconsin 13
Missouri 13Minnesota 13 Michigan 13Maryland 13
Ohio 18Pennsylvania 19
Georgia 25 Florida 27
New Jersey 28Connecticut 33
Massachusetts 40Texas 49
Illinois 58California 131
New York 185
OthersVirginia
North CarolinaDelaware
D. of ColumbiaWashington
ColoradoWisconsin
MissouriMinnesota
MichiganMaryland
OhioPennsylvania
GeorgiaFlorida
New JerseyConnecticut
MassachusettsTexas
IllinoisCaliforniaNew York
OthersVirginia
North CarolinaDelaware
D. of ColumbiaWashington
ColoradoWisconsin
MissouriMinnesota
MichiganMaryland
OhioPennsylvania
GeorgiaFlorida
New JerseyConnecticut
MassachusettsTexas
IllinoisCaliforniaNew York
Others 102 Virginia 13
North Carolina 19Delaware 13
D. of Columbia 0Washington 0Colorado 0 Wisconsin 0Missouri 0Minnesota 0 Michigan 0Maryland 0
Ohio 16Pennsylvania 13
Georgia 0Florida 20
New Jersey 0Connecticut 14
Massachusetts 26Texas 37
Illinois 15California 83
New York 61
New York and eastern states account for the majority of inbound and outbound deals but tech rich California is close behind

To start a new section, hold down the apple+shift keys and click
to release this object and type the section title in the box below.
US/UK M&A Deal Monitor Q4 2015 19
• Total disclosed deal value is now at a 10-quarter high.
• Global conditions will continue to drive US/UK M&A.
The UK/US M&A deal corridor shows exceptional appetite for deal making on both sides of the Atlantic. Over the last 10 quarters the overall trend has been for the disclosed value of deals by UK acquirers to rise strongly. US investors have done more deals; but UK investors have done bigger deals, and the volume of their acquisitions has also risen. In the most recent quarter the disclosed value of total deal making reached a 10-quarter high.
Private equity firms continue to play a large role in driving US/UK M&A, especially for US outbound deals where PE accounts for around a third of all transactions. But the most important driver factor is the macro-economic environment: the relative strength of the US and UK economies and the continued ready availability of funding coupled with relatively low returns in financial investment are all driving the growth in US/UK transactions.
Conclusions

To start a new section, hold down the apple+shift keys and click
to release this object and type the section title in the box below.
20
US/UK M&A Deal Corridor Executive Cahal DowdsPartner, Advisory Corporate Finance+44 (0) 131 535 [email protected]
Chris HyamsPartner, Transaction Services+44 (0) 20 7007 [email protected]
Jason ArmstrongPartner, Restructuring Services+44 (0) 20 7007 [email protected]
Liam BoylePartner, Quality and Risk Management+44 (0) 131 535 [email protected]
Mark PacittiPartner, Advisory Corporate Finance+44 (0) 20 7303 [email protected]
Fenton BurginPartner, Debt Advisory +44 (0) 20 7303 [email protected]
Paul WiszniewskiPartner, Transaction Services+44 (0) 20 7007 [email protected]
Anthony DugganPartner, Real Estate+44 (0) 20 7303 [email protected]
Richard ParsonsPartner, Advisory Corporate Finance+44 (0) 20 7303 [email protected]
Stuart GeddiePartner, Business Valuation Services+44 (0) 20 7007 [email protected]
Andrew GrimstonePartner, Restructuring Services+44 (0) 20 7007 [email protected]
Matt BathamPartner, International M&A Tax+44 (0) 20 7007 [email protected]
US/UK M&A Deal Corridor Sector contactsJason RichardsPartner, TMT +44 (0) 20 7007 [email protected]
Katie Folwell-DaviesPartner, Business Services+44 (0) 20 7007 [email protected]
Duncan JohnstonPartner, Manufacturing+44 (0) 20 7303 [email protected]
David JonesPartner, Healthcare and Life Sciences+44 (0) 20 7007 [email protected]
Conor CahillPartner, Consumer Business+44 (0) 20 7007 [email protected]

To start a new section, hold down the apple+shift keys and click
to release this object and type the section title in the box below.
US/UK M&A Deal Monitor Q4 2015 21US/UK M&A Deal Monitor Q4 2015 21
Endnotes
1. M&A Trends Report 2015, Deloitte US2. The Deloitte CFO Survey: 2015 Q4, Deloitte UK

To start a new section, hold down the apple+shift keys and click
to release this object and type the section title in the box below.
22
Notes

To start a new section, hold down the apple+shift keys and click
to release this object and type the section title in the box below.
US/UK M&A Deal Monitor Q4 2015 23
Notes

To start a new section, hold down the apple+shift keys and click
to release this object and type the section title in the box below.
24
Notes

US/UK M&A Deal Monitor Q4 2015 25

Deloitte refers to one or more of Deloitte Touche Tohmatsu Limited (“DTTL”), a UK private company limited by guarantee, and its network of member firms, each of which is a legally separate and independent entity. Please see www.deloitte.co.uk/about for a detailed description of the legal structure of DTTL and its member firms.
Deloitte LLP is the United Kingdom member firm of DTTL.
This publication has been written in general terms and therefore cannot be relied on to cover specific situations; application of the principles set out will depend upon the particular circumstances involved and we recommend that you obtain professional advice before acting or refraining from acting on any of the contents of this publication. Deloitte LLP would be pleased to advise readers on how to apply the principles set out in this publication to their specific circumstances. Deloitte LLP accepts no duty of care or liability for any loss occasioned to any person acting or refraining from action as a result of any material in this publication.
© 2016 Deloitte LLP. All rights reserved.
Deloitte LLP is a limited liability partnership registered in England and Wales with registered number OC303675 and its registered office at 2 New Street Square, London EC4A 3BZ, United Kingdom. Tel: +44 (0) 20 7936 3000 Fax: +44 (0) 20 7583 1198.
Designed and produced by The Creative Studio at Deloitte, London. J4687