Embed Size (px)
Citation preview
This report (including any attachments) is a confidential and classified document. The publication or distribution of this report or
the information contained herein must not be disclosed without the written approval of the author.
Light-duty transportation GHG challenges and opportunities
07.13.2016
Hyundai-Kia America Technical Center, Inc. (HATCI)
Powertrain – Fuel Economy Development
Steven Sherman
This report (including any attachments) is a confidential and classified document. The publication or distribution of this report or the information contained herein must not be disclosed without the written approval of the author.
Introduction 1
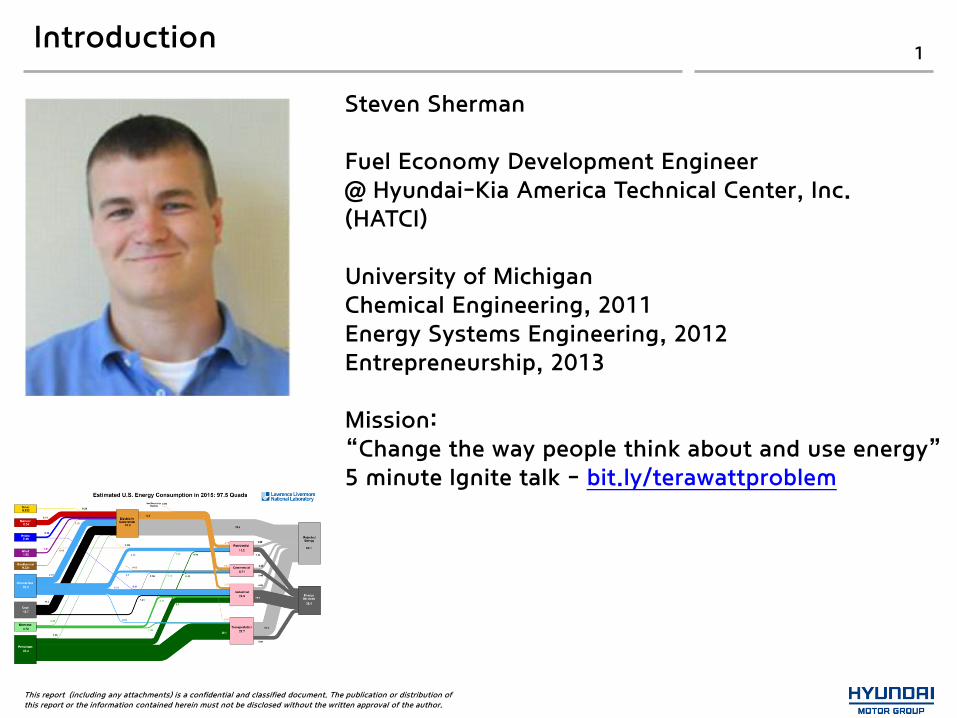
Steven Sherman Fuel Economy Development Engineer @ Hyundai-Kia America Technical Center, Inc. (HATCI) University of Michigan Chemical Engineering, 2011 Energy Systems Engineering, 2012 Entrepreneurship, 2013 Mission: “Change the way people think about and use energy” 5 minute Ignite talk - bit.ly/terawattproblem

This report (including any attachments) is a confidential and classified document. The publication or distribution of this report or the information contained herein must not be disclosed without the written approval of the author.
HATCI 2
As one of Hyundai Motor Group’s (HMG) ten centers focused on research and development (R&D), Hyundai America Technical Center, Inc. (HATCI) was established in 1986 in Ann Arbor, Michigan. HATCI is HMG’s design, technology and engineering headquarters for North America.
This report (including any attachments) is a confidential and classified document. The publication or distribution of this report or the information contained herein must not be disclosed without the written approval of the author.
Purpose 3
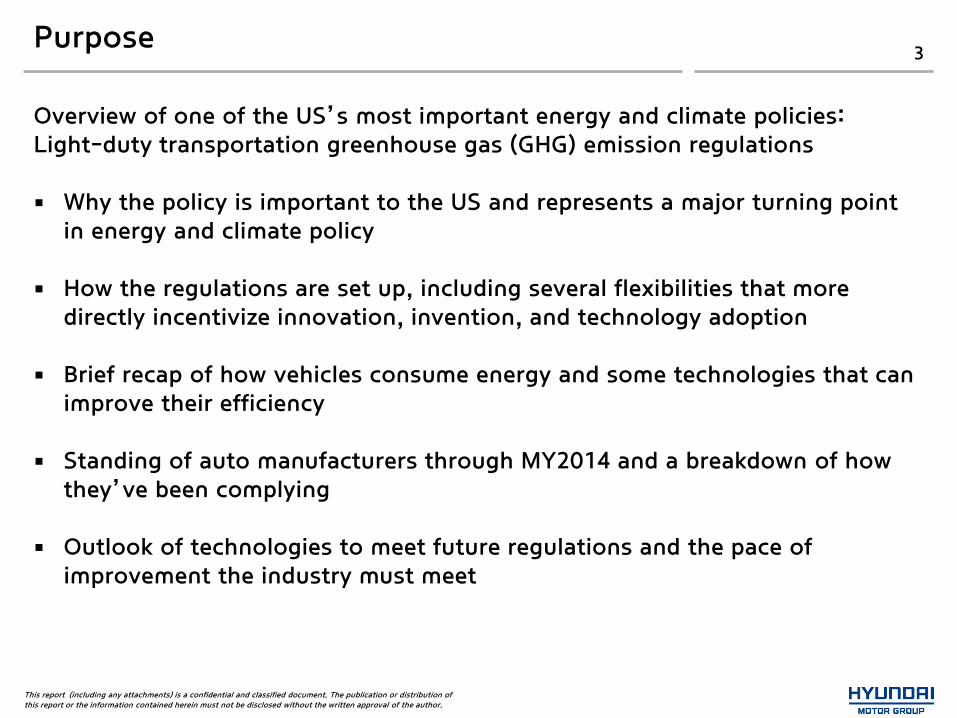
Overview of one of the US’s most important energy and climate policies: Light-duty transportation greenhouse gas (GHG) emission regulations Why the policy is important to the US and represents a major turning point
in energy and climate policy
How the regulations are set up, including several flexibilities that more directly incentivize innovation, invention, and technology adoption
Brief recap of how vehicles consume energy and some technologies that can improve their efficiency
Standing of auto manufacturers through MY2014 and a breakdown of how they’ve been complying
Outlook of technologies to meet future regulations and the pace of improvement the industry must meet
This report (including any attachments) is a confidential and classified document. The publication or distribution of this report or the information contained herein must not be disclosed without the written approval of the author.
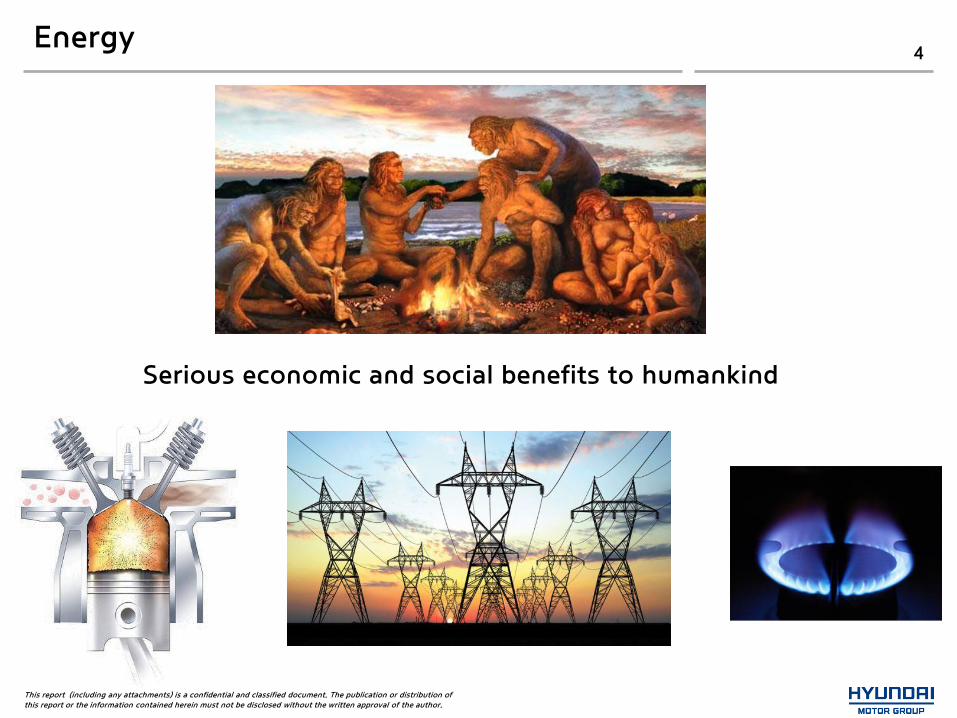
Energy 4
Serious economic and social benefits to humankind
This report (including any attachments) is a confidential and classified document. The publication or distribution of this report or the information contained herein must not be disclosed without the written approval of the author.
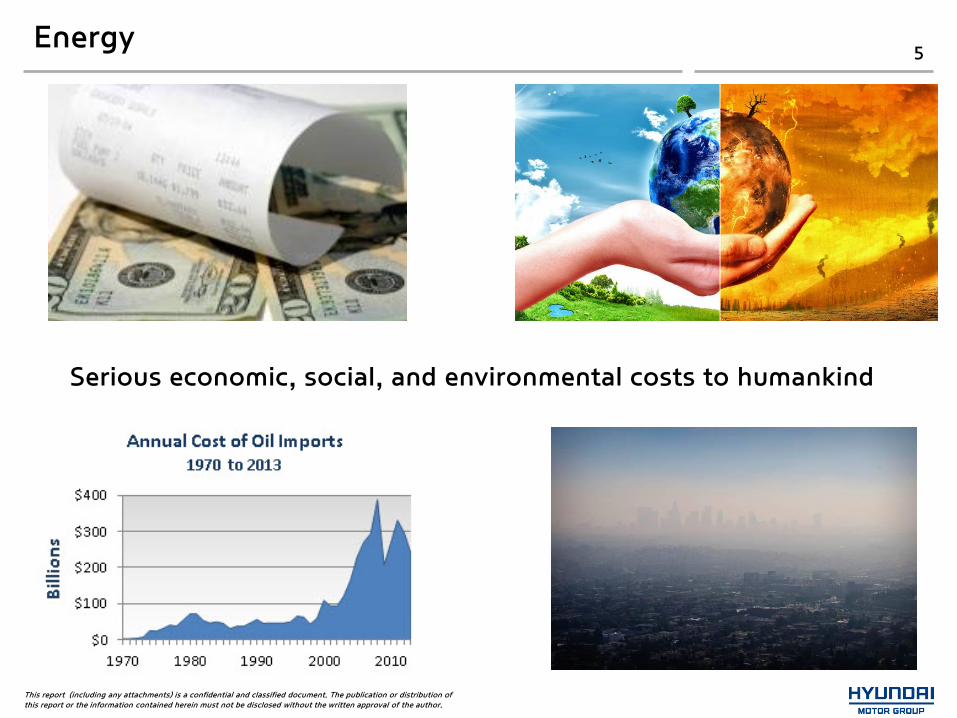
Energy 5
Serious economic, social, and environmental costs to humankind
This report (including any attachments) is a confidential and classified document. The publication or distribution of this report or the information contained herein must not be disclosed without the written approval of the author.
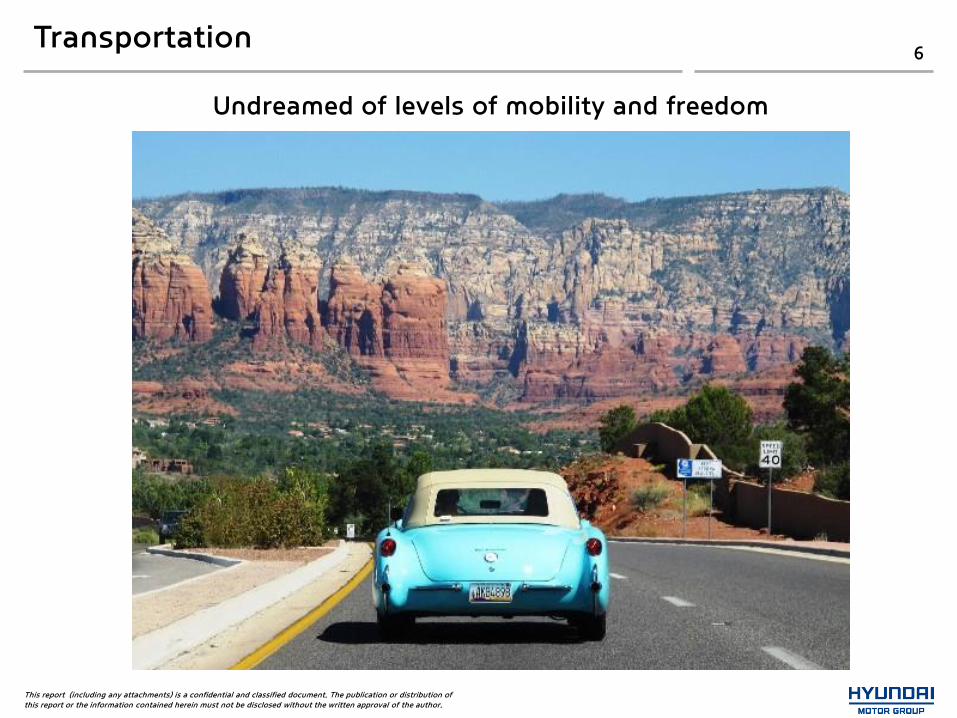
Transportation 6
Undreamed of levels of mobility and freedom
This report (including any attachments) is a confidential and classified document. The publication or distribution of this report or the information contained herein must not be disclosed without the written approval of the author.
Transportation 7
Some serious side effects
Safety: 1.2M roadway fatalities worldwide, ~33,000 in US each year
Energy: 95%+ dependent on oil
Environment: 1/3 of US GHG emissions
Congestion: Traffic delays costing $100B+ per year
Parking: Land use, delays, cost
Infrastructure: Aging and costly
This report (including any attachments) is a confidential and classified document. The publication or distribution of this report or the information contained herein must not be disclosed without the written approval of the author.
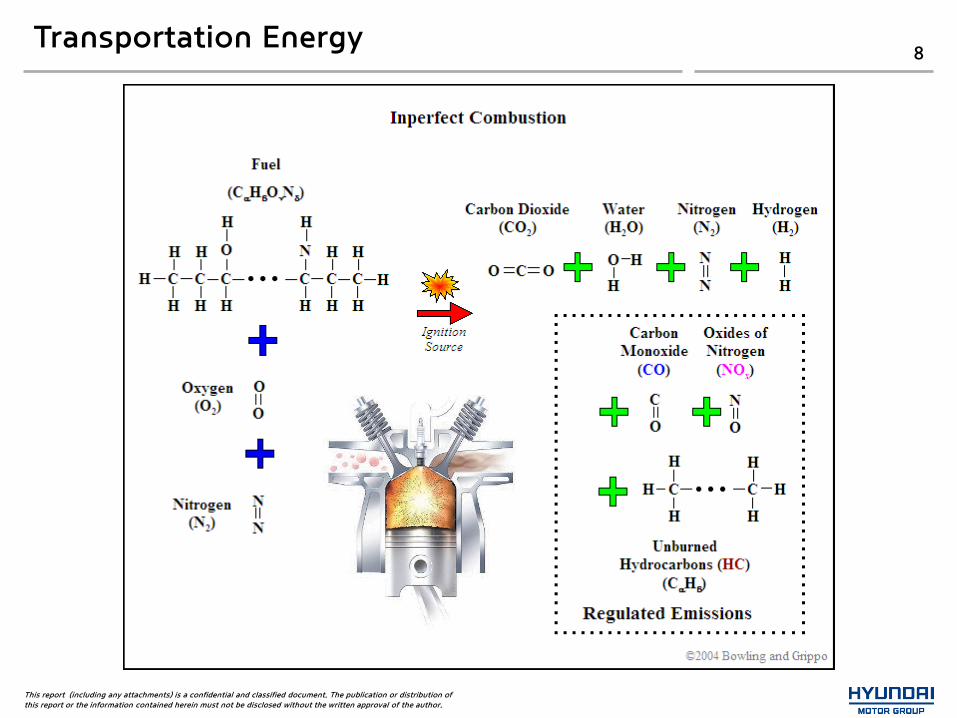
Transportation Energy 8
This report (including any attachments) is a confidential and classified document. The publication or distribution of this report or the information contained herein must not be disclosed without the written approval of the author.
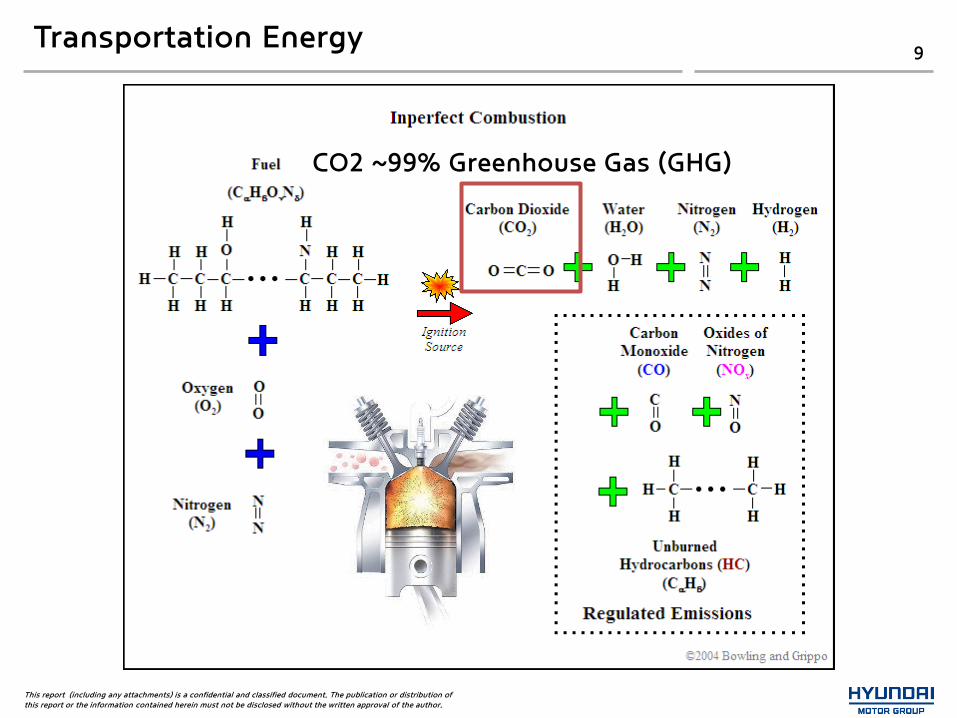
Transportation Energy 9
CO2 ~99% Greenhouse Gas (GHG)
This report (including any attachments) is a confidential and classified document. The publication or distribution of this report or the information contained herein must not be disclosed without the written approval of the author.
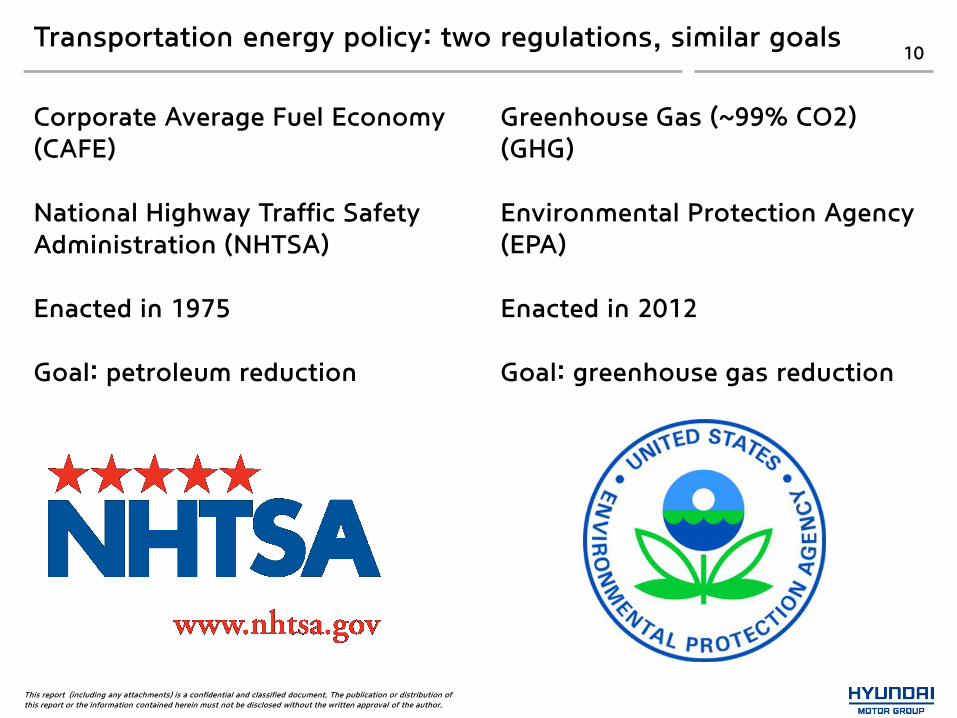
Transportation energy policy: two regulations, similar goals 10
Corporate Average Fuel Economy (CAFE) National Highway Traffic Safety Administration (NHTSA) Enacted in 1975 Goal: petroleum reduction
Greenhouse Gas (~99% CO2) (GHG) Environmental Protection Agency (EPA) Enacted in 2012 Goal: greenhouse gas reduction
This report (including any attachments) is a confidential and classified document. The publication or distribution of this report or the information contained herein must not be disclosed without the written approval of the author.
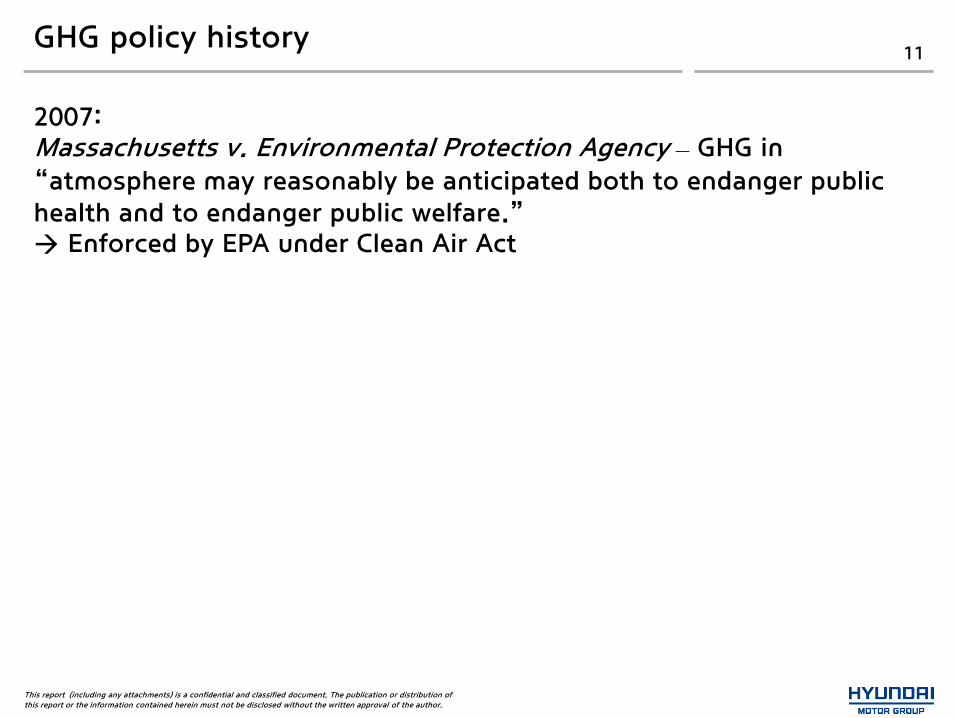
GHG policy history 11
2007: Massachusetts v. Environmental Protection Agency – GHG in
“atmosphere may reasonably be anticipated both to endanger public health and to endanger public welfare.” Enforced by EPA under Clean Air Act
This report (including any attachments) is a confidential and classified document. The publication or distribution of this report or the information contained herein must not be disclosed without the written approval of the author.
GHG policy history 12
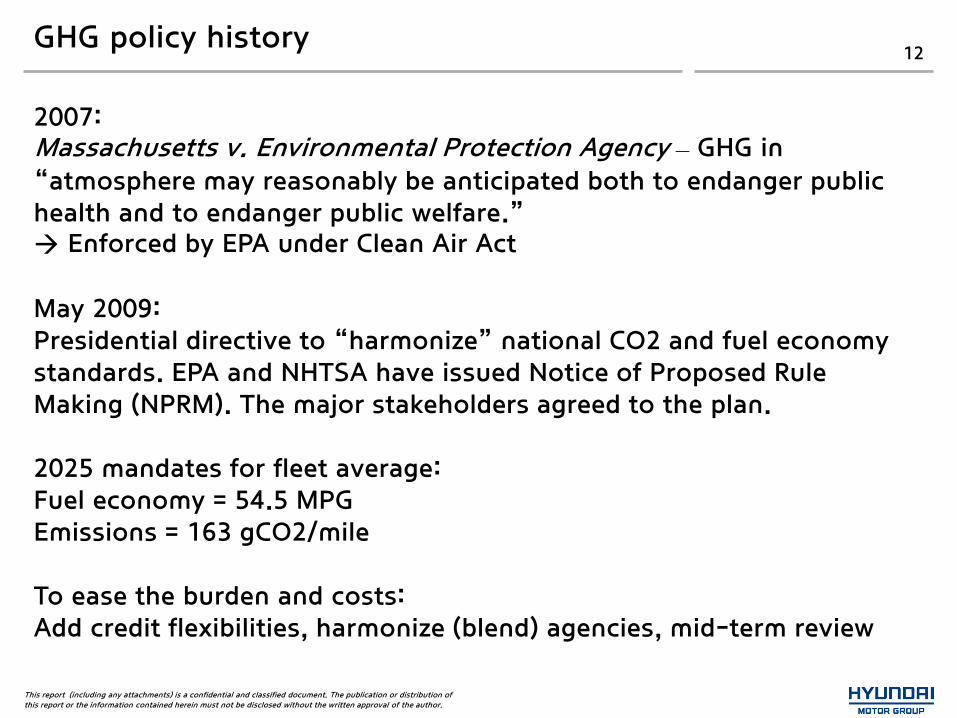
2007: Massachusetts v. Environmental Protection Agency – GHG in
“atmosphere may reasonably be anticipated both to endanger public health and to endanger public welfare.” Enforced by EPA under Clean Air Act May 2009: Presidential directive to “harmonize” national CO2 and fuel economy standards. EPA and NHTSA have issued Notice of Proposed Rule Making (NPRM). The major stakeholders agreed to the plan. 2025 mandates for fleet average: Fuel economy = 54.5 MPG Emissions = 163 gCO2/mile To ease the burden and costs: Add credit flexibilities, harmonize (blend) agencies, mid-term review
This report (including any attachments) is a confidential and classified document. The publication or distribution of this report or the information contained herein must not be disclosed without the written approval of the author.
CAFE regulation history 13
17.0
22.0
27.0
32.0
37.0
42.0
47.0
52.0
57.0
Co
rpo
rate
Avera
ge F
uel Eco
no
my [
MP
G]
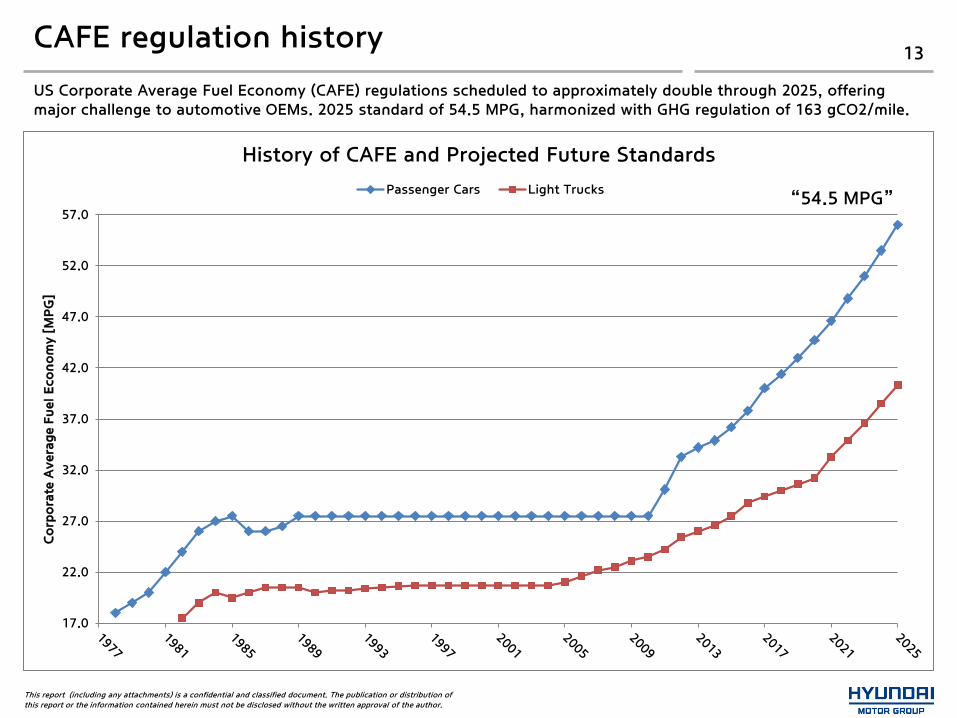
History of CAFE and Projected Future Standards
Passenger Cars Light Trucks“54.5 MPG”
US Corporate Average Fuel Economy (CAFE) regulations scheduled to approximately double through 2025, offering major challenge to automotive OEMs. 2025 standard of 54.5 MPG, harmonized with GHG regulation of 163 gCO2/mile.
This report (including any attachments) is a confidential and classified document. The publication or distribution of this report or the information contained herein must not be disclosed without the written approval of the author.
GHG regulation history 14
295
286
276
263
250 243
232
222
213
199
190
180
171 163
140
190
240
290
340
2010 2012 2014 2016 2018 2020 2022 2024 2026
GH
G s
tan
dard
s [g
CO
2/m
ile]
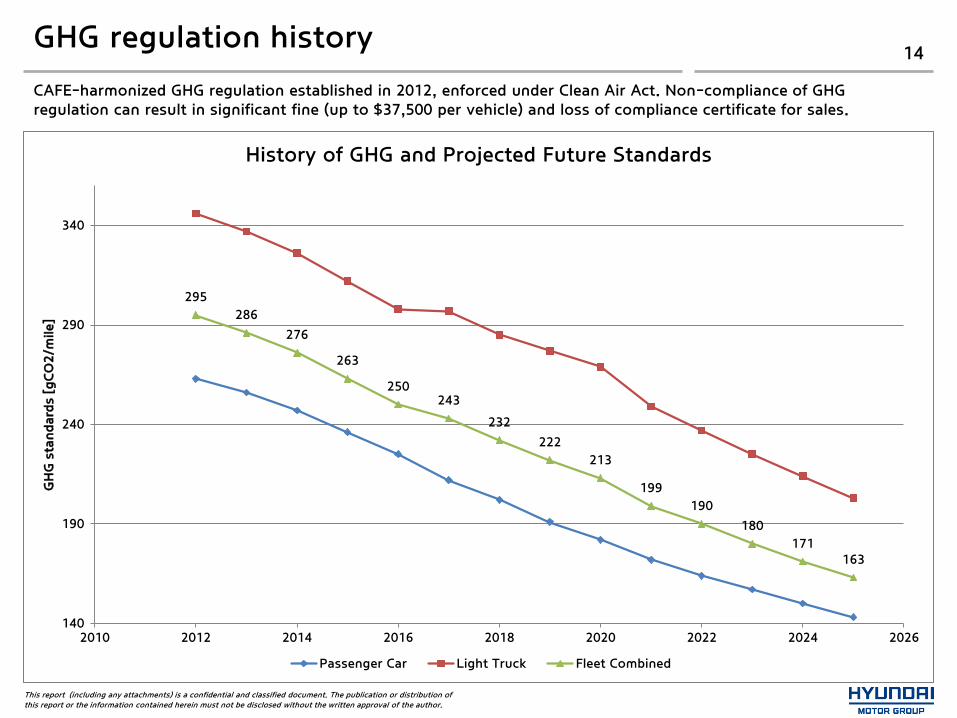
History of GHG and Projected Future Standards
Passenger Car Light Truck Fleet Combined
CAFE-harmonized GHG regulation established in 2012, enforced under Clean Air Act. Non-compliance of GHG regulation can result in significant fine (up to $37,500 per vehicle) and loss of compliance certificate for sales.
This report (including any attachments) is a confidential and classified document. The publication or distribution of this report or the information contained herein must not be disclosed without the written approval of the author.
GHG rule structure 15
This report (including any attachments) is a confidential and classified document. The publication or distribution of this report or the information contained herein must not be disclosed without the written approval of the author.
GHG rule structure 16
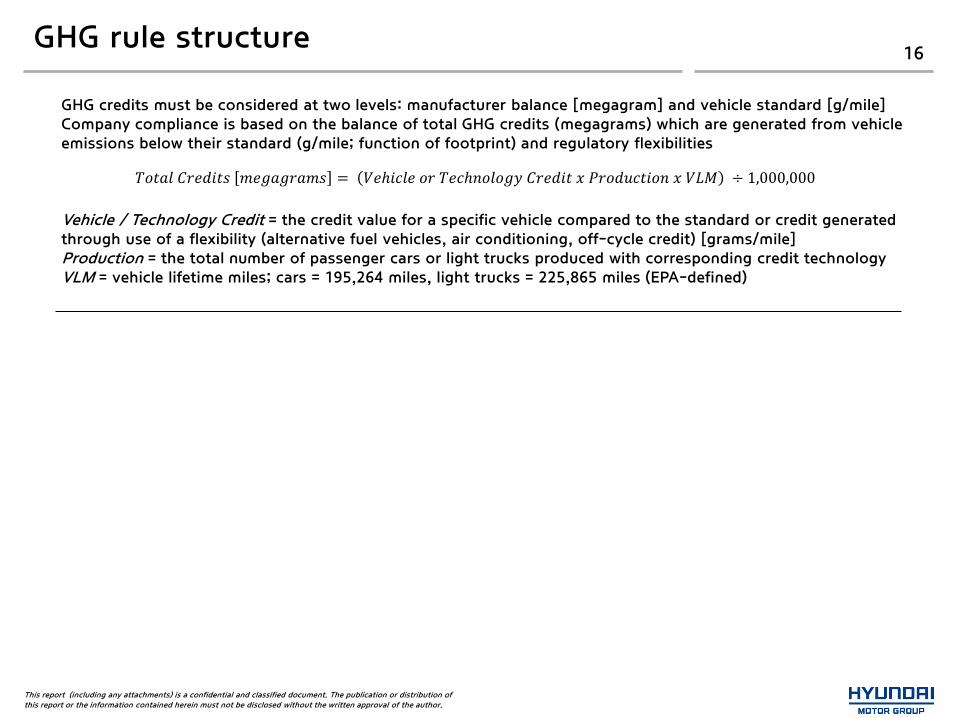
GHG credits must be considered at two levels: manufacturer balance [megagram] and vehicle standard [g/mile] Company compliance is based on the balance of total GHG credits (megagrams) which are generated from vehicle emissions below their standard (g/mile; function of footprint) and regulatory flexibilities Vehicle / Technology Credit = the credit value for a specific vehicle compared to the standard or credit generated through use of a flexibility (alternative fuel vehicles, air conditioning, off-cycle credit) [grams/mile] Production = the total number of passenger cars or light trucks produced with corresponding credit technology VLM = vehicle lifetime miles; cars = 195,264 miles, light trucks = 225,865 miles (EPA-defined)
𝑇𝑜𝑡𝑎𝑙 𝐶𝑟𝑒𝑑𝑖𝑡𝑠 𝑚𝑒𝑔𝑎𝑔𝑟𝑎𝑚𝑠 = 𝑉𝑒ℎ𝑖𝑐𝑙𝑒 𝑜𝑟 𝑇𝑒𝑐ℎ𝑛𝑜𝑙𝑜𝑔𝑦 𝐶𝑟𝑒𝑑𝑖𝑡 𝑥 𝑃𝑟𝑜𝑑𝑢𝑐𝑡𝑖𝑜𝑛 𝑥 𝑉𝐿𝑀 ÷ 1,000,000

This report (including any attachments) is a confidential and classified document. The publication or distribution of this report or the information contained herein must not be disclosed without the written approval of the author.
GHG rule structure 17
GHG credits must be considered at two levels: manufacturer balance [megagram] and vehicle standard [g/mile] Company compliance is based on the balance of total GHG credits (megagrams) which are generated from vehicle emissions below their standard (g/mile; function of footprint) and regulatory flexibilities Vehicle / Technology Credit = the credit value for a specific vehicle compared to the standard or credit generated through use of a flexibility (alternative fuel vehicles, air conditioning, off-cycle credit) [grams/mile] Production = the total number of passenger cars or light trucks produced with corresponding credit technology VLM = vehicle lifetime miles; cars = 195,264 miles, light trucks = 225,865 miles (EPA-defined)
Example (Vehicle): MY2019 Truck has 2-cycle tailpipe emissions of 315 g/mile Target CO2 standard for MY2019 is 300 g/mile Assume production of 50,000 units
300 − 315 𝑔
𝑚𝑖𝑙𝑒 𝑥 50,000 𝑡𝑟𝑢𝑐𝑘 𝑥 225,865
𝑚𝑖𝑙𝑒𝑠
𝑡𝑟𝑢𝑐𝑘 ÷ 1,000,000 = −169,400 𝑚𝑒𝑔𝑎𝑔𝑟𝑎𝑚𝑠
Example (Technology): ISG (start-stop) is applied on next generation Car Engine idle start-stop has an off-cycle menu credit value of 2.5 g/mile Assume production of 100,000 units
2.5 𝑔
𝑚𝑖𝑙𝑒 𝑥 100,000 𝑐𝑎𝑟𝑠 𝑥 195,264
𝑚𝑖𝑙𝑒𝑠
𝑐𝑎𝑟 ÷ 1,000,000 = +48,816 𝑚𝑒𝑔𝑎𝑔𝑟𝑎𝑚𝑠
𝑇𝑜𝑡𝑎𝑙 𝐶𝑟𝑒𝑑𝑖𝑡𝑠 𝑚𝑒𝑔𝑎𝑔𝑟𝑎𝑚𝑠 = 𝑉𝑒ℎ𝑖𝑐𝑙𝑒 𝑜𝑟 𝑇𝑒𝑐ℎ𝑛𝑜𝑙𝑜𝑔𝑦 𝐶𝑟𝑒𝑑𝑖𝑡 𝑥 𝑃𝑟𝑜𝑑𝑢𝑐𝑡𝑖𝑜𝑛 𝑥 𝑉𝐿𝑀 ÷ 1,000,000

This report (including any attachments) is a confidential and classified document. The publication or distribution of this report or the information contained herein must not be disclosed without the written approval of the author.
GHG rule structure 18
Number of flexibilities included in GHG regulation rulemaking: ① Footprint-based targets; separate car and truck standards; fleet averaging ② Banked early credits; alternative fuel vehicles; air-conditioning (direct, indirect); off-cycle ③ Credit trading between OEMs ④ Carry-forward of deficit
①
②
③
④
This report (including any attachments) is a confidential and classified document. The publication or distribution of this report or the information contained herein must not be disclosed without the written approval of the author.
GHG rule structure – 2-cycle tailpipe 19
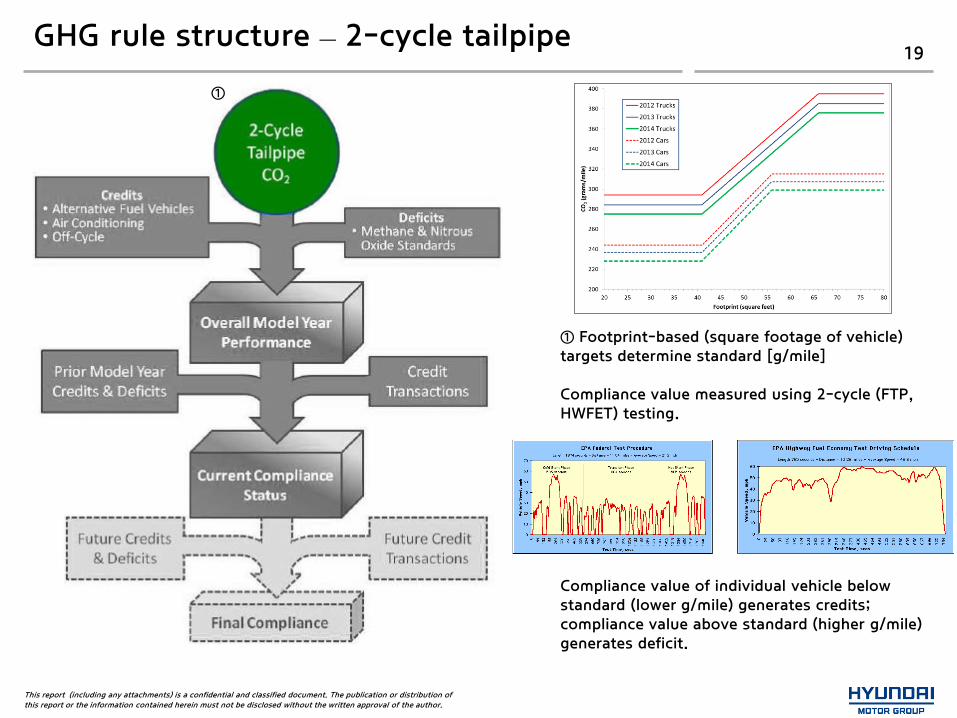
① Footprint-based (square footage of vehicle) targets determine standard [g/mile] Compliance value measured using 2-cycle (FTP, HWFET) testing. Compliance value of individual vehicle below standard (lower g/mile) generates credits; compliance value above standard (higher g/mile) generates deficit.
①
This report (including any attachments) is a confidential and classified document. The publication or distribution of this report or the information contained herein must not be disclosed without the written approval of the author.
GHG rule structure – 2-cycle tailpipe 20
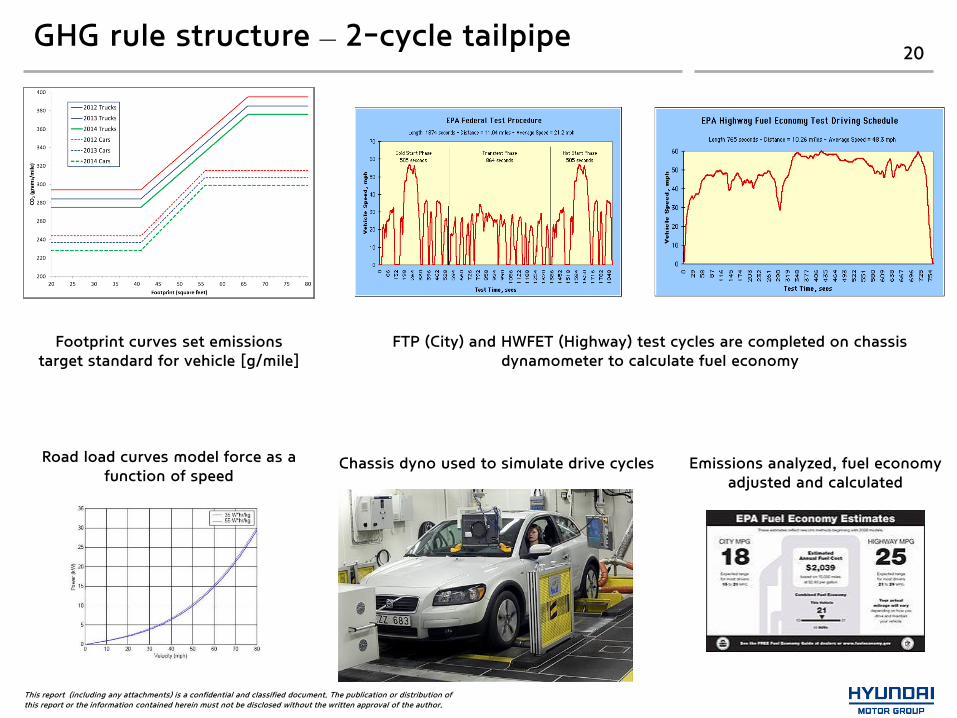
Footprint curves set emissions target standard for vehicle [g/mile]
FTP (City) and HWFET (Highway) test cycles are completed on chassis dynamometer to calculate fuel economy
Road load curves model force as a function of speed
Chassis dyno used to simulate drive cycles Emissions analyzed, fuel economy adjusted and calculated

This report (including any attachments) is a confidential and classified document. The publication or distribution of this report or the information contained herein must not be disclosed without the written approval of the author.
GHG rule structure – 2-cycle tailpipe 21

This report (including any attachments) is a confidential and classified document. The publication or distribution of this report or the information contained herein must not be disclosed without the written approval of the author.
GHG rule structure – 2-cycle tailpipe 22
2-cycle tailpipe standards are the core of GHG emission standards Engine Efficiency Improvements: Cylinder Deactivation – up to 5% Turbocharging – up to 8% Gasoline Direct Injection – 1% Variable Timing & Lift – 3-4%
This report (including any attachments) is a confidential and classified document. The publication or distribution of this report or the information contained herein must not be disclosed without the written approval of the author.
GHG rule structure – 2-cycle tailpipe 23
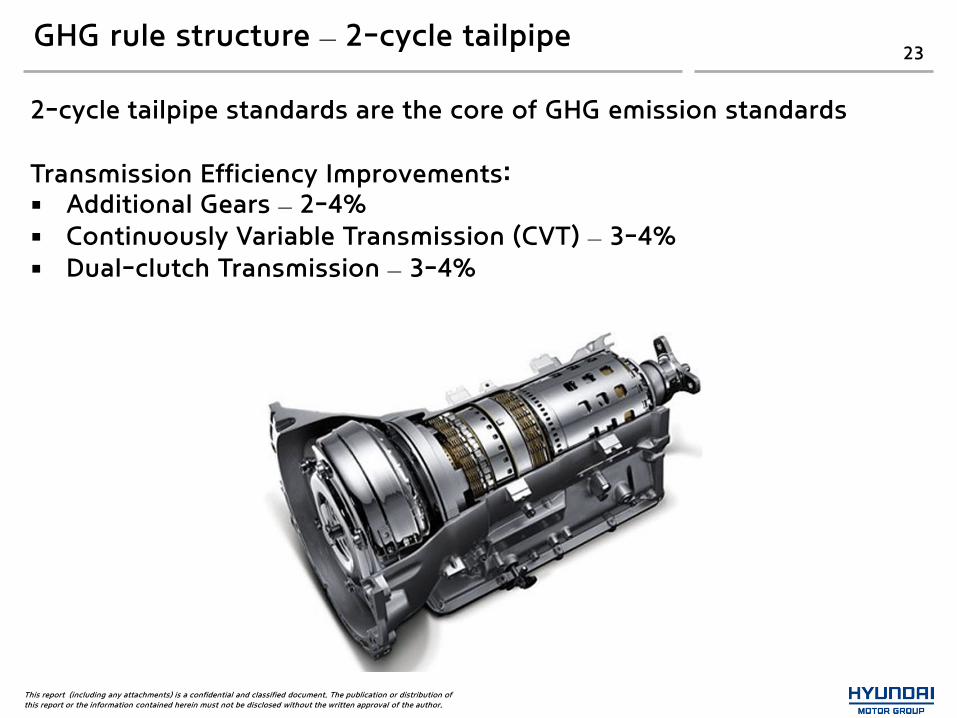
2-cycle tailpipe standards are the core of GHG emission standards Transmission Efficiency Improvements: Additional Gears – 2-4% Continuously Variable Transmission (CVT) – 3-4% Dual-clutch Transmission – 3-4%
This report (including any attachments) is a confidential and classified document. The publication or distribution of this report or the information contained herein must not be disclosed without the written approval of the author.
GHG rule structure – 2-cycle tailpipe 24
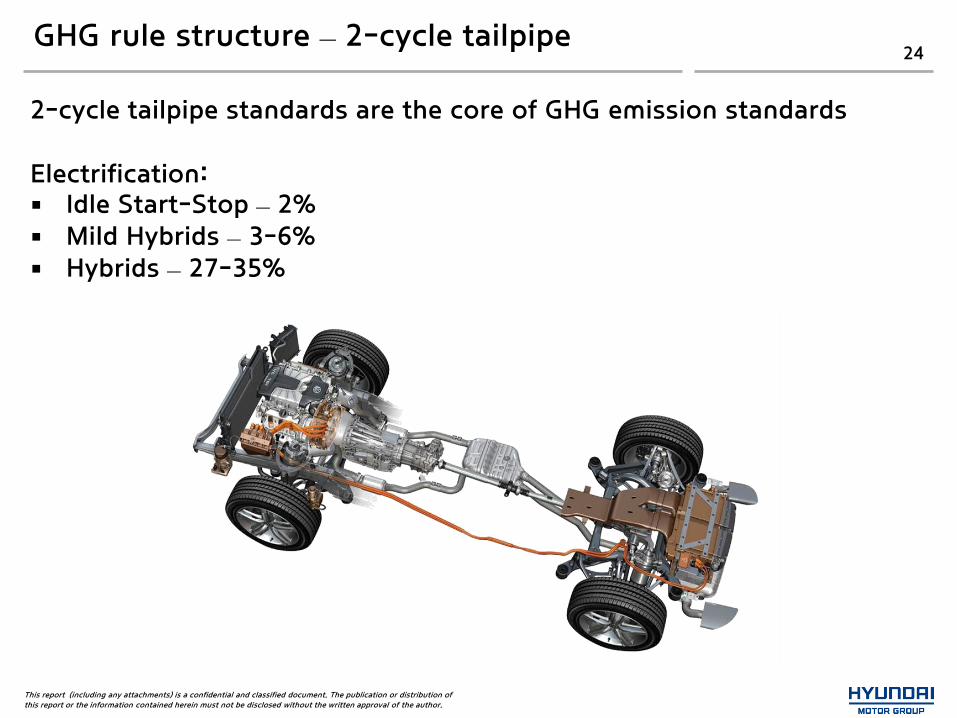
2-cycle tailpipe standards are the core of GHG emission standards Electrification: Idle Start-Stop – 2% Mild Hybrids – 3-6% Hybrids – 27-35%
This report (including any attachments) is a confidential and classified document. The publication or distribution of this report or the information contained herein must not be disclosed without the written approval of the author.
GHG rule structure – 2-cycle tailpipe 25
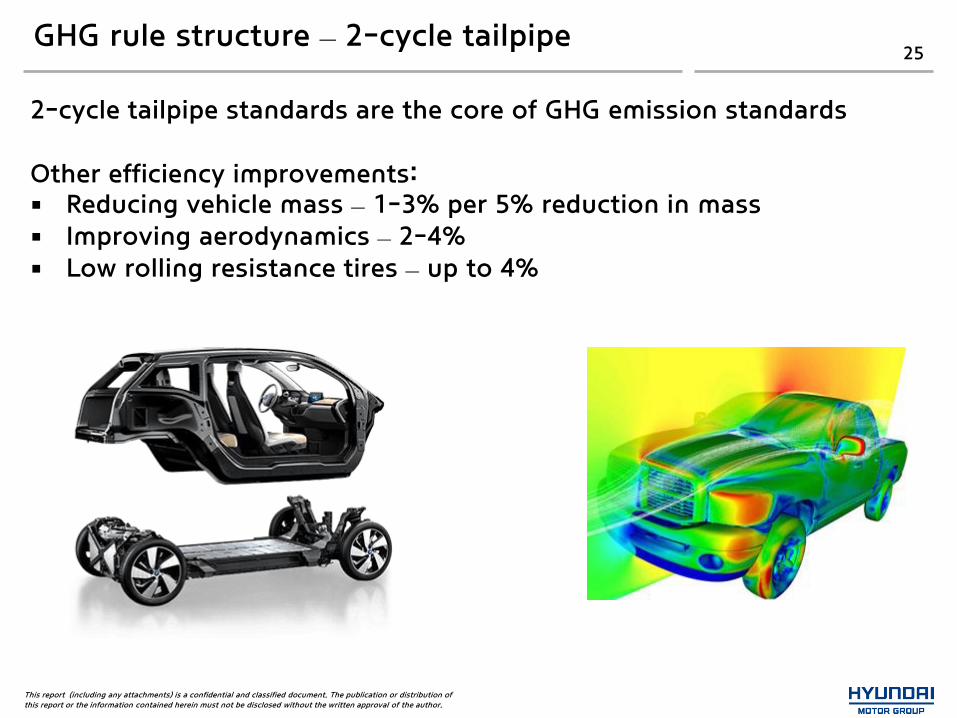
2-cycle tailpipe standards are the core of GHG emission standards Other efficiency improvements: Reducing vehicle mass – 1-3% per 5% reduction in mass Improving aerodynamics – 2-4% Low rolling resistance tires – up to 4%

This report (including any attachments) is a confidential and classified document. The publication or distribution of this report or the information contained herein must not be disclosed without the written approval of the author.
Technology adoption rates 26
0%
10%
20%
30%
40%
50%
60%
70%
80%
90%
100%
0 5 10 15 20 25 30 35 40
Lig
ht
Du
ty T
ech
no
logy P
en
etr
ati
on
[%
]
Years after first significant use
Technology penetration rates since first year of use
Variable Valve Timing
Multi-Valve
Lockup
Front-Wheel Drive
Fuel Injection
Start-Stop
Gasoline Direct Injection
Cylinder Deactivation
Gasoline Hybrid
Turbocharging

This report (including any attachments) is a confidential and classified document. The publication or distribution of this report or the information contained herein must not be disclosed without the written approval of the author.
Technology adoption rates 27
0%
5%
10%
15%
20%
25%
30%
35%
40%
45%
50%
0 2 4 6 8 10 12 14 16 18 20
Lig
ht
Du
ty T
ech
no
logy P
en
etr
ati
on
[%
]
Years after first significant use
Technology penetration rates since first year of use
Start-Stop
Gasoline Direct Injection
Cylinder Deactivation
Gasoline Hybrid
Turbocharging
This report (including any attachments) is a confidential and classified document. The publication or distribution of this report or the information contained herein must not be disclosed without the written approval of the author.
GHG rule structure – credit flexibilities 28
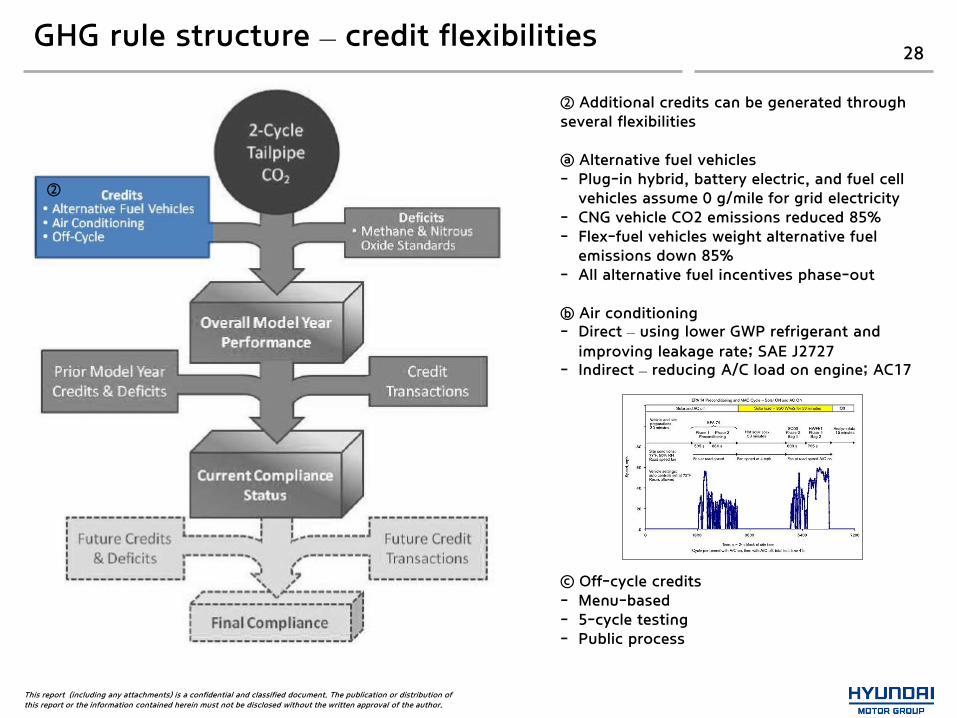
② Additional credits can be generated through several flexibilities ⓐ Alternative fuel vehicles - Plug-in hybrid, battery electric, and fuel cell
vehicles assume 0 g/mile for grid electricity - CNG vehicle CO2 emissions reduced 85% - Flex-fuel vehicles weight alternative fuel
emissions down 85% - All alternative fuel incentives phase-out ⓑ Air conditioning - Direct – using lower GWP refrigerant and
improving leakage rate; SAE J2727 - Indirect – reducing A/C load on engine; AC17 ⓒ Off-cycle credits - Menu-based - 5-cycle testing - Public process
②

This report (including any attachments) is a confidential and classified document. The publication or distribution of this report or the information contained herein must not be disclosed without the written approval of the author.
GHG rule structure – Alternative Fuel Vehicles 29
ⓐ Alternative fuel vehicles
- Plug-in hybrid, battery electric, and fuel cell vehicles assume 0 g/mile for grid electricity
- CNG vehicle CO2 emissions reduced 85%
- Flex-fuel vehicles (E85, biodiesel) weight alternative fuel emissions down 85%
- All alternative fuel incentives phase-out (FFV by MY16)
This report (including any attachments) is a confidential and classified document. The publication or distribution of this report or the information contained herein must not be disclosed without the written approval of the author.
GHG rule structure – Air Conditioning (Direct, Leakage) 30
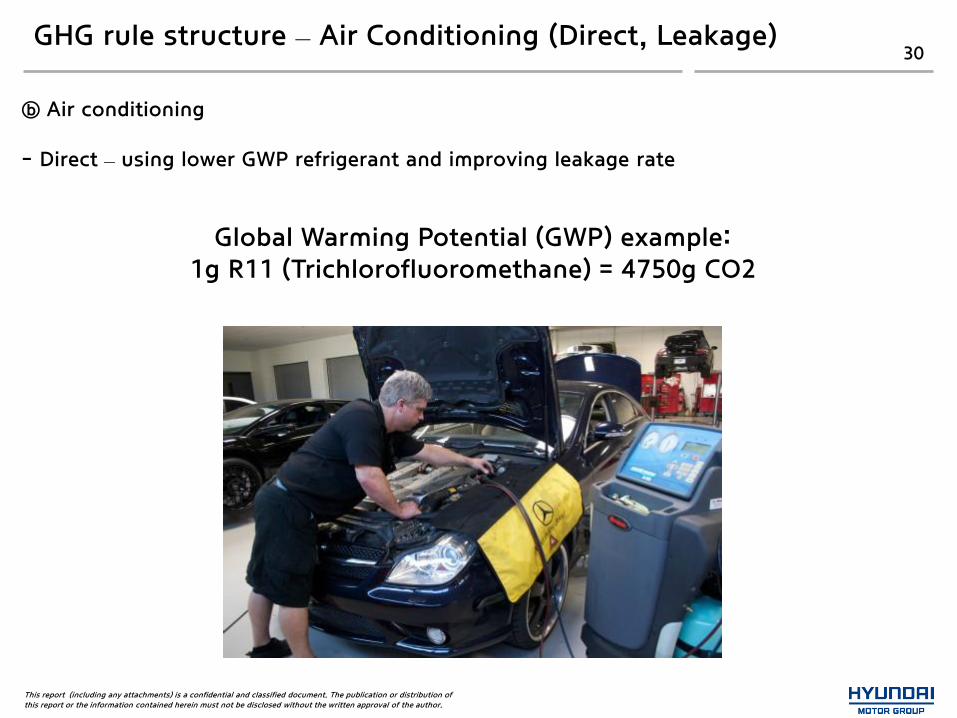
ⓑ Air conditioning - Direct – using lower GWP refrigerant and improving leakage rate
Global Warming Potential (GWP) example: 1g R11 (Trichlorofluoromethane) = 4750g CO2
This report (including any attachments) is a confidential and classified document. The publication or distribution of this report or the information contained herein must not be disclosed without the written approval of the author.
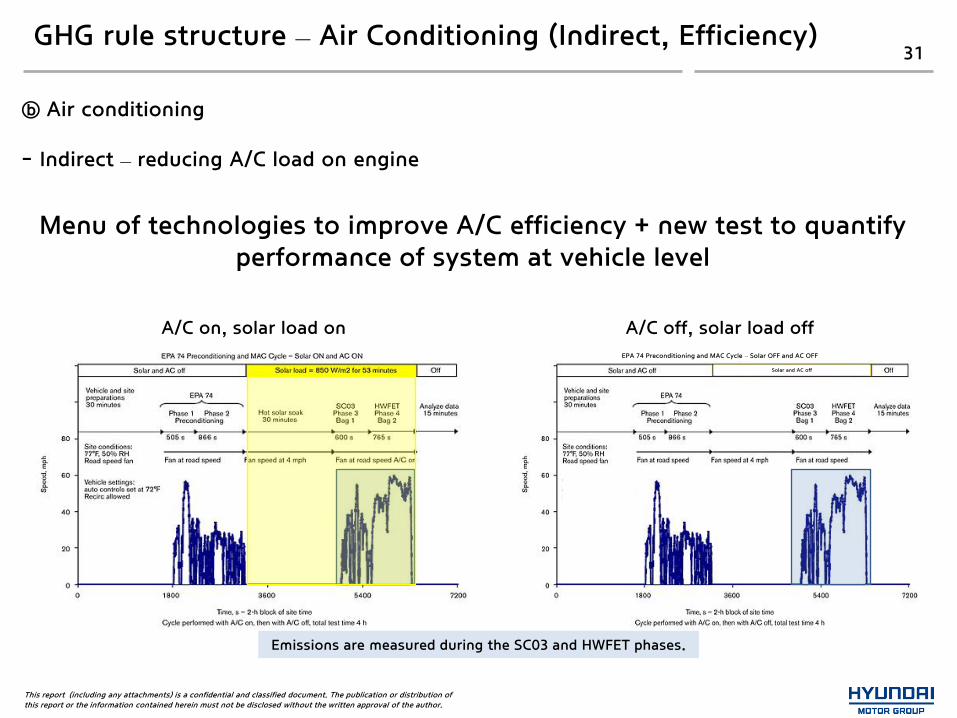
GHG rule structure – Air Conditioning (Indirect, Efficiency) 31
ⓑ Air conditioning - Indirect – reducing A/C load on engine
Emissions are measured during the SC03 and HWFET phases.
A/C on, solar load on A/C off, solar load off EPA 74 Preconditioning and MAC Cycle – Solar OFF and AC OFF
Solar and AC off
Menu of technologies to improve A/C efficiency + new test to quantify performance of system at vehicle level
This report (including any attachments) is a confidential and classified document. The publication or distribution of this report or the information contained herein must not be disclosed without the written approval of the author.
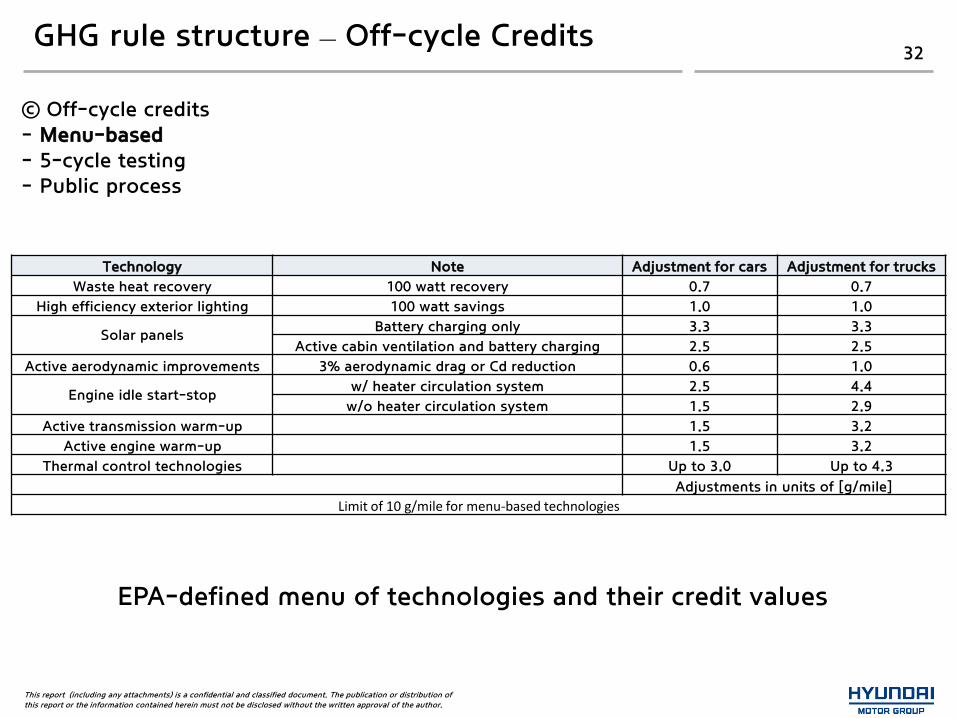
GHG rule structure – Off-cycle Credits 32
ⓒ Off-cycle credits - Menu-based - 5-cycle testing - Public process
Technology Note Adjustment for cars Adjustment for trucks
Waste heat recovery 100 watt recovery 0.7 0.7
High efficiency exterior lighting 100 watt savings 1.0 1.0
Solar panels Battery charging only 3.3 3.3
Active cabin ventilation and battery charging 2.5 2.5
Active aerodynamic improvements 3% aerodynamic drag or Cd reduction 0.6 1.0
Engine idle start-stop w/ heater circulation system 2.5 4.4
w/o heater circulation system 1.5 2.9
Active transmission warm-up 1.5 3.2
Active engine warm-up 1.5 3.2
Thermal control technologies Up to 3.0 Up to 4.3
Adjustments in units of [g/mile]
Limit of 10 g/mile for menu-based technologies
EPA-defined menu of technologies and their credit values

This report (including any attachments) is a confidential and classified document. The publication or distribution of this report or the information contained herein must not be disclosed without the written approval of the author.
GHG rule structure – Off-cycle Credits 33
ⓒ Off-cycle credits - Menu-based - 5-cycle testing - Public process
US06 (Aggressive)
SC03 (95F, A/C)
Cold FTP (20F)
FTP (City, cold start)
HWFET (Highway)

This report (including any attachments) is a confidential and classified document. The publication or distribution of this report or the information contained herein must not be disclosed without the written approval of the author.
GHG rule structure – Off-cycle Credits 34
ⓒ Off-cycle credits - Menu-based - 5-cycle testing - Public process
Discussion with and petition to EPA, including input from public comments, for technologies that have ‘real-world’ benefits either above
their menu values or that are not on the off-cycle menu
This report (including any attachments) is a confidential and classified document. The publication or distribution of this report or the information contained herein must not be disclosed without the written approval of the author.
GHG rule structure 35
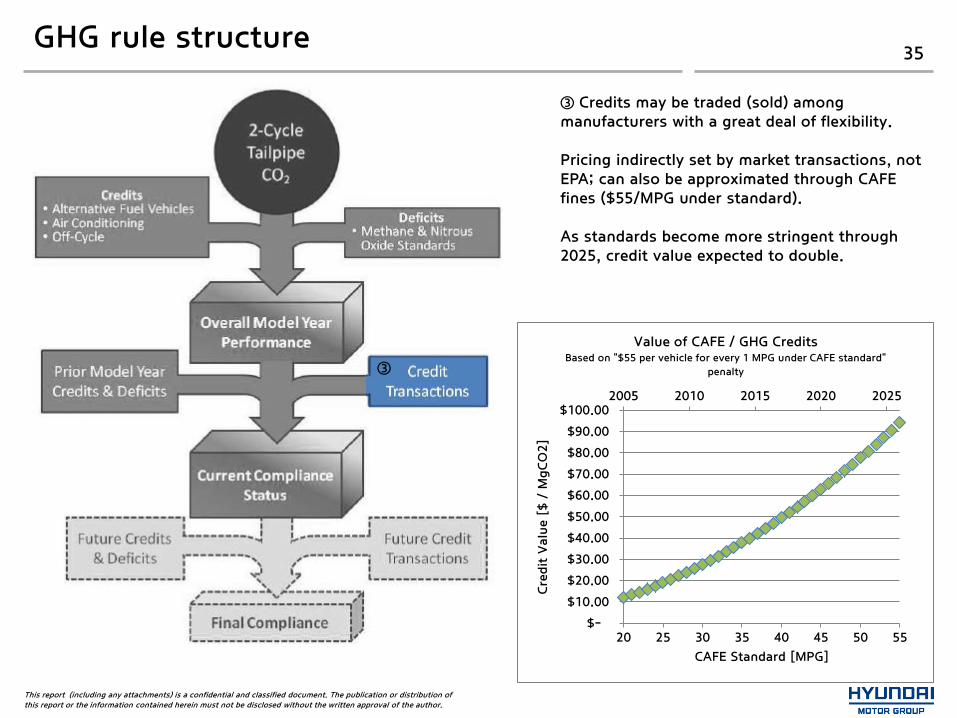
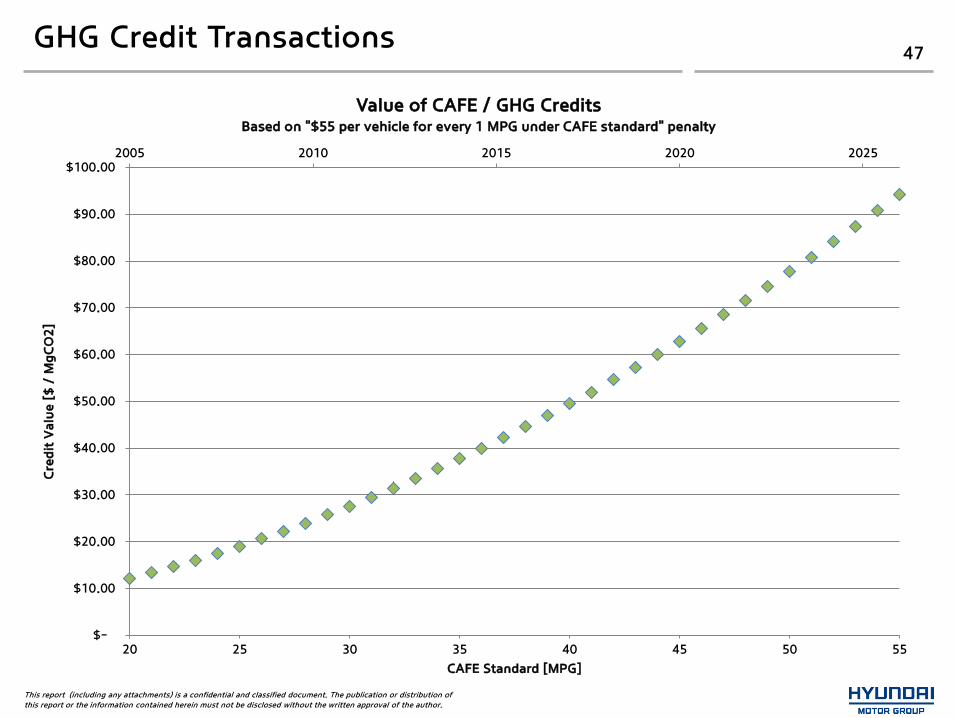
③ Credits may be traded (sold) among manufacturers with a great deal of flexibility. Pricing indirectly set by market transactions, not EPA; can also be approximated through CAFE fines ($55/MPG under standard). As standards become more stringent through 2025, credit value expected to double.
③
2005 2010 2015 2020 2025
20
25
30
35
40
45
50
55
$-
$10.00
$20.00
$30.00
$40.00
$50.00
$60.00
$70.00
$80.00
$90.00
$100.00
20 25 30 35 40 45 50 55
Cre
dit
Valu
e [
$ /
MgC
O2]
CAFE Standard [MPG]
Value of CAFE / GHG Credits Based on "$55 per vehicle for every 1 MPG under CAFE standard"
penalty
This report (including any attachments) is a confidential and classified document. The publication or distribution of this report or
the information contained herein must not be disclosed without the written approval of the author.
36 MY14 Manufacturer GHG Performance CONFIDENTIAL
RESTRICTED 36
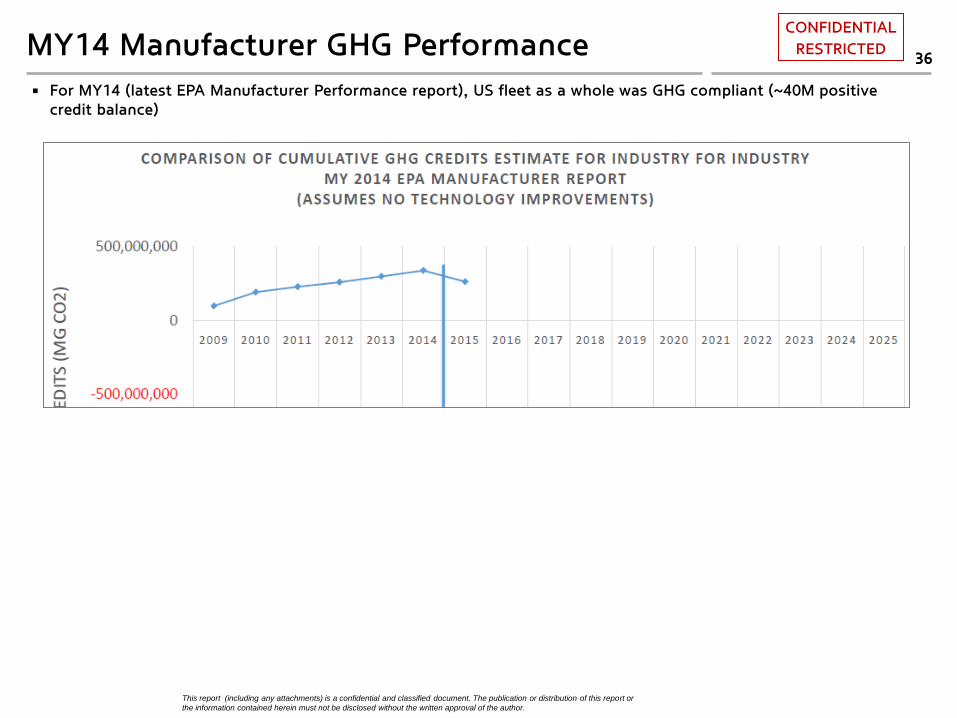
For MY14 (latest EPA Manufacturer Performance report), US fleet as a whole was GHG compliant (~40M positive credit balance)
This report (including any attachments) is a confidential and classified document. The publication or distribution of this report or
the information contained herein must not be disclosed without the written approval of the author.
37 MY14 Manufacturer GHG Performance CONFIDENTIAL
RESTRICTED 37
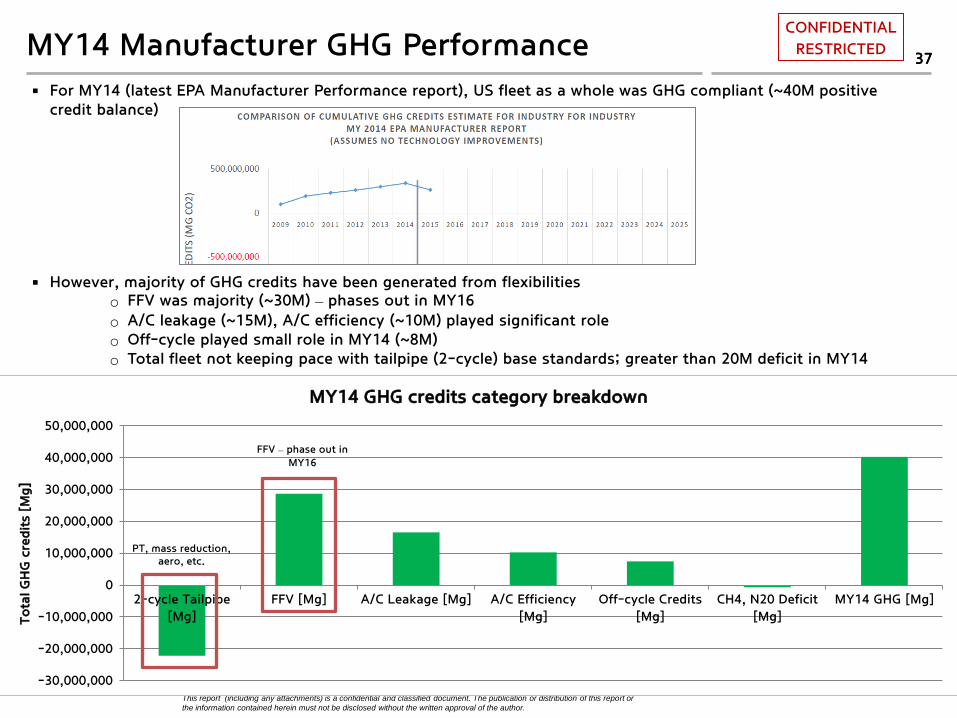
For MY14 (latest EPA Manufacturer Performance report), US fleet as a whole was GHG compliant (~40M positive credit balance)
However, majority of GHG credits have been generated from flexibilities
o FFV was majority (~30M) – phases out in MY16 o A/C leakage (~15M), A/C efficiency (~10M) played significant role o Off-cycle played small role in MY14 (~8M) o Total fleet not keeping pace with tailpipe (2-cycle) base standards; greater than 20M deficit in MY14
-30,000,000
-20,000,000
-10,000,000
0
10,000,000
20,000,000
30,000,000
40,000,000
50,000,000
2-cycle Tailpipe
[Mg]
FFV [Mg] A/C Leakage [Mg] A/C Efficiency
[Mg]
Off-cycle Credits
[Mg]
CH4, N20 Deficit
[Mg]
MY14 GHG [Mg]
To
tal G
HG
cre
dit
s [M
g]
MY14 GHG credits category breakdown
PT, mass reduction, aero, etc.
FFV – phase out in
MY16
This report (including any attachments) is a confidential and classified document. The publication or distribution of this report or the information contained herein must not be disclosed without the written approval of the author.
81,2
71,8
23
39,2
33,0
10
30,3
80,0
22
27,5
09,0
54
19,7
27,3
64
17,8
10,7
33
13,7
59,5
76
10,2
36,7
11
9,8
19,0
76
7,1
60,0
86
1,5
32,5
64
1,3
33,2
67
0%
10%
20%
30%
40%
50%
60%
70%
80%
90%
100%
0
10,000,000
20,000,000
30,000,000
40,000,000
50,000,000
60,000,000
70,000,000
80,000,000
90,000,000
100,000,000
Toyota Honda GM Ford Hyundai Nissan Fiat
Chrysler
Subaru Kia Mazda BMW Mitsubishi
GH
G c
redit
s carr
ied t
o M
Y15 [
Mg G
HG
]
OEM MY15 GHG standings (industry top half)
MY14 Manufacturer GHG Performance 38
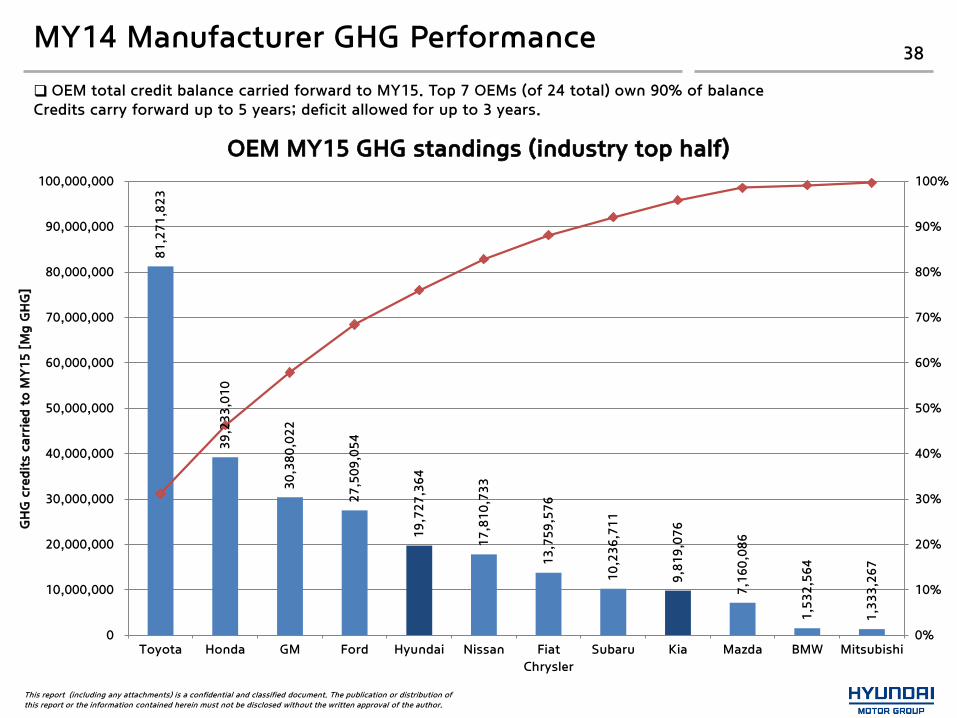
OEM total credit balance carried forward to MY15. Top 7 OEMs (of 24 total) own 90% of balance Credits carry forward up to 5 years; deficit allowed for up to 3 years.
This report (including any attachments) is a confidential and classified document. The publication or distribution of this report or the information contained herein must not be disclosed without the written approval of the author.
(2,000,000)
0
2,000,000
4,000,000
6,000,000
8,000,000
10,000,000
12,000,000
Cre
dit
s gen
era
ted in
MY
14 [
Mg G
HG
]
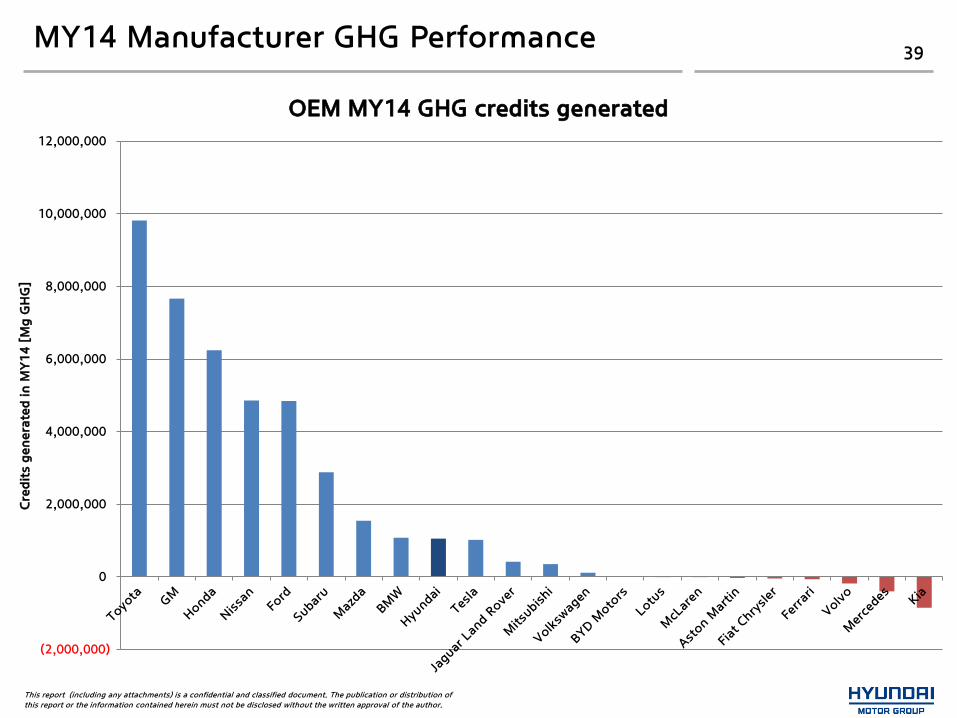
OEM MY14 GHG credits generated
MY14 Manufacturer GHG Performance 39

This report (including any attachments) is a confidential and classified document. The publication or distribution of this report or the information contained herein must not be disclosed without the written approval of the author.
(40)
(30)
(20)
(10)
-
10
20
30
40
50
60
70
Cre
dit
s gen
era
ted in
MY
14 [
Mg G
HG
/ v
eh
icle
]
OEM MY14 credits generated per production volume
MY14 Manufacturer GHG Performance 40
This report (including any attachments) is a confidential and classified document. The publication or distribution of this report or the information contained herein must not be disclosed without the written approval of the author.
MY14 Manufacturer GHG Performance - breakdown 41
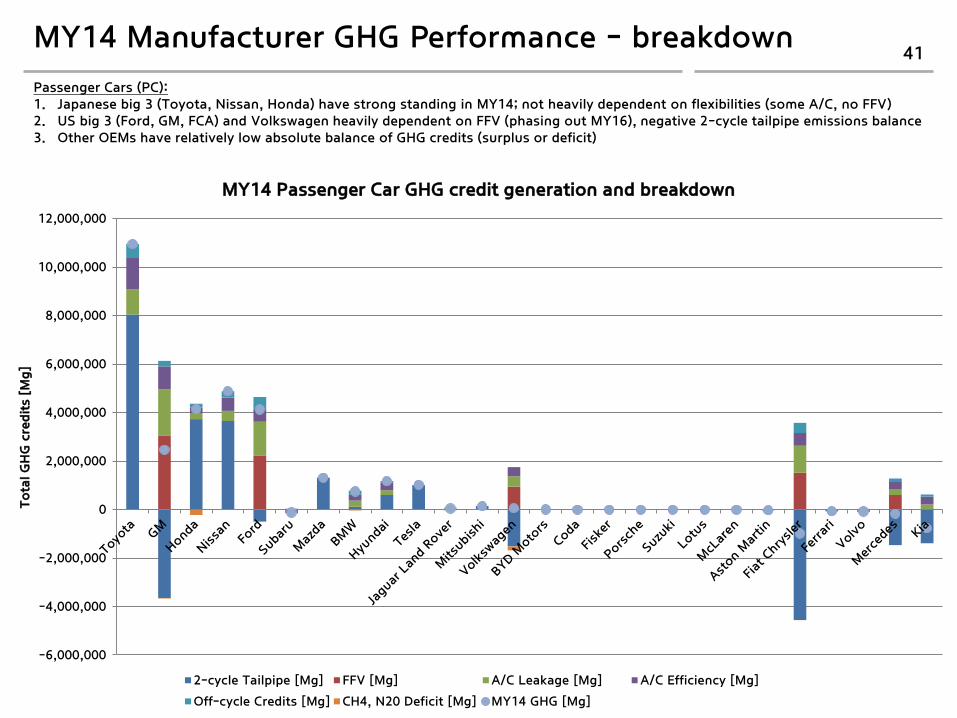
Passenger Cars (PC): 1. Japanese big 3 (Toyota, Nissan, Honda) have strong standing in MY14; not heavily dependent on flexibilities (some A/C, no FFV) 2. US big 3 (Ford, GM, FCA) and Volkswagen heavily dependent on FFV (phasing out MY16), negative 2-cycle tailpipe emissions balance 3. Other OEMs have relatively low absolute balance of GHG credits (surplus or deficit)
-6,000,000
-4,000,000
-2,000,000
0
2,000,000
4,000,000
6,000,000
8,000,000
10,000,000
12,000,000
To
tal G
HG
cre
dit
s [M
g]
MY14 Passenger Car GHG credit generation and breakdown
2-cycle Tailpipe [Mg] FFV [Mg] A/C Leakage [Mg] A/C Efficiency [Mg]
Off-cycle Credits [Mg] CH4, N20 Deficit [Mg] MY14 GHG [Mg]

This report (including any attachments) is a confidential and classified document. The publication or distribution of this report or the information contained herein must not be disclosed without the written approval of the author.
MY14 Manufacturer GHG Performance - breakdown 42
Light Trucks (LT): 1. US big 3 (Ford, GM, FCA) heavily dependent on FFV (phasing out MY16), negative 2-cycle tailpipe emissions balance 2. Toyota also using FFV flexibility for LT compliance, negative 2-cycle tailpipe emissions balance 3. Subaru taking advantage of LT classification 4. Other OEMs have relatively low absolute balance of GHG credits (surplus or deficit)
-15,000,000
-10,000,000
-5,000,000
0
5,000,000
10,000,000
15,000,000
To
tal G
HG
cre
dit
s [M
g]
MY14 Light Truck GHG credit generation and breakdown
2-cycle Tailpipe [Mg] FFV [Mg] A/C Leakage [Mg] A/C Efficiency [Mg]
Off-cycle Credits [Mg] CH4, N20 Deficit [Mg] MY14 GHG [Mg]
This report (including any attachments) is a confidential and classified document. The publication or distribution of this report or the information contained herein must not be disclosed without the written approval of the author.
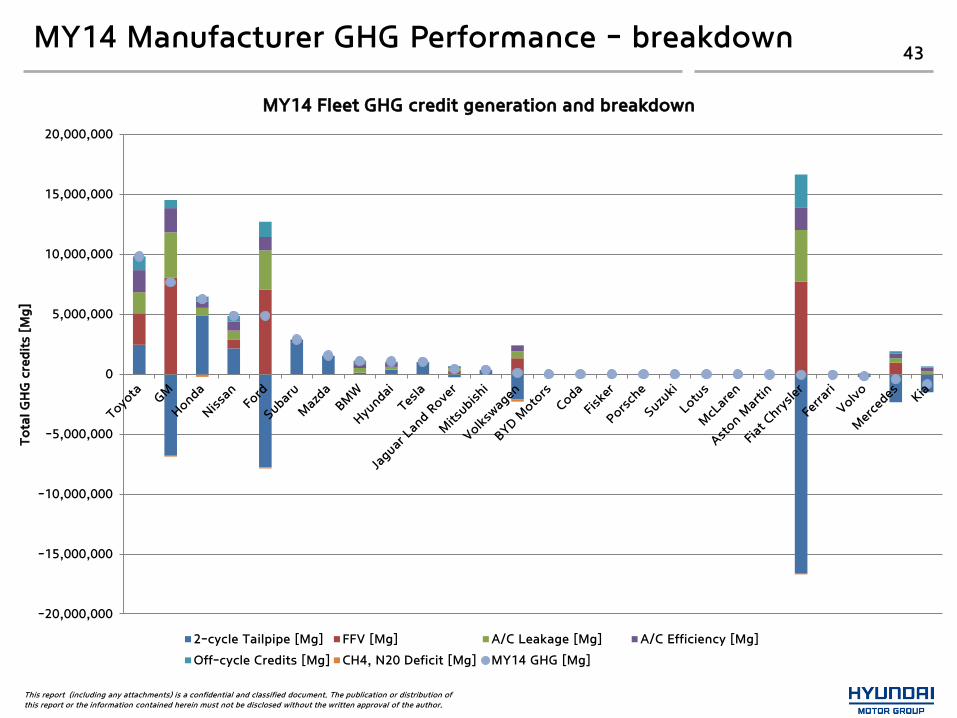
MY14 Manufacturer GHG Performance - breakdown 43
-20,000,000
-15,000,000
-10,000,000
-5,000,000
0
5,000,000
10,000,000
15,000,000
20,000,000
To
tal G
HG
cre
dit
s [M
g]
MY14 Fleet GHG credit generation and breakdown
2-cycle Tailpipe [Mg] FFV [Mg] A/C Leakage [Mg] A/C Efficiency [Mg]
Off-cycle Credits [Mg] CH4, N20 Deficit [Mg] MY14 GHG [Mg]
This report (including any attachments) is a confidential and classified document. The publication or distribution of this report or the information contained herein must not be disclosed without the written approval of the author.
2,7
21,3
11
2,3
34,2
34
2,1
93,4
50
2,0
94,7
42
1,4
46,1
65
1,3
25,6
34
590,6
10
548,3
61
536,3
87
465,8
96
379,3
26
370,4
38
296,1
59
0%
10%
20%
30%
40%
50%
60%
70%
80%
90%
100%
-
500,000
1,000,000
1,500,000
2,000,000
2,500,000
3,000,000
MY12-14 OEM production (industry top half)
MY12 MY13 MY14 Cumulative Production [%]
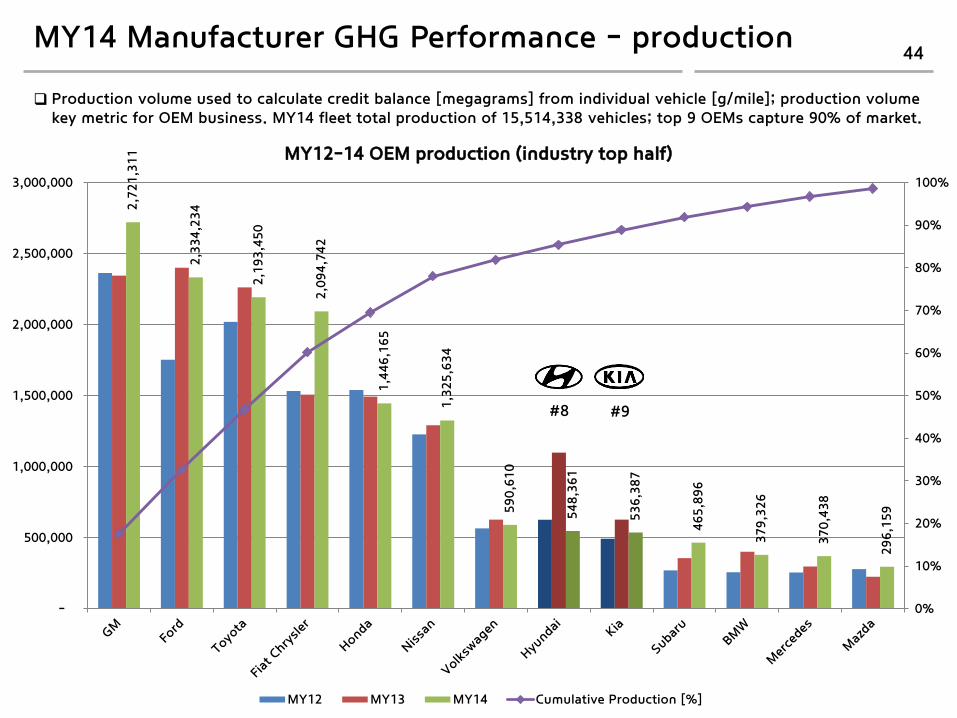
MY14 Manufacturer GHG Performance - production 44
#8 #9
Production volume used to calculate credit balance [megagrams] from individual vehicle [g/mile]; production volume key metric for OEM business. MY14 fleet total production of 15,514,338 vehicles; top 9 OEMs capture 90% of market.

This report (including any attachments) is a confidential and classified document. The publication or distribution of this report or the information contained herein must not be disclosed without the written approval of the author.
MY14 GHG credit flexibilities – Off-cycle credits 45
9.8%
0.0%
15.0%
2.1%
9.6%
50.7%
8.7%
14.2%
23.2%
5.5%
43.0%
0.0% 0.0%
10.0%
20.0%
30.0%
40.0%
50.0%
60.0%
MY14 GHG off-cycle credit menu technologies by production adoption
Significant adoption: Solar glass / glazing, high efficiency exterior lighting, active engine warmup, active transmission warmup, passive cabin ventilation
Some adoption: Grill shutters, active cabin ventilation, active seat ventilation, solar reflective surface coating, engine idle stop-start
Industry has not adopted 2 technologies to significant scale: ride height adjustment, solar panels
This report (including any attachments) is a confidential and classified document. The publication or distribution of this report or the information contained herein must not be disclosed without the written approval of the author.
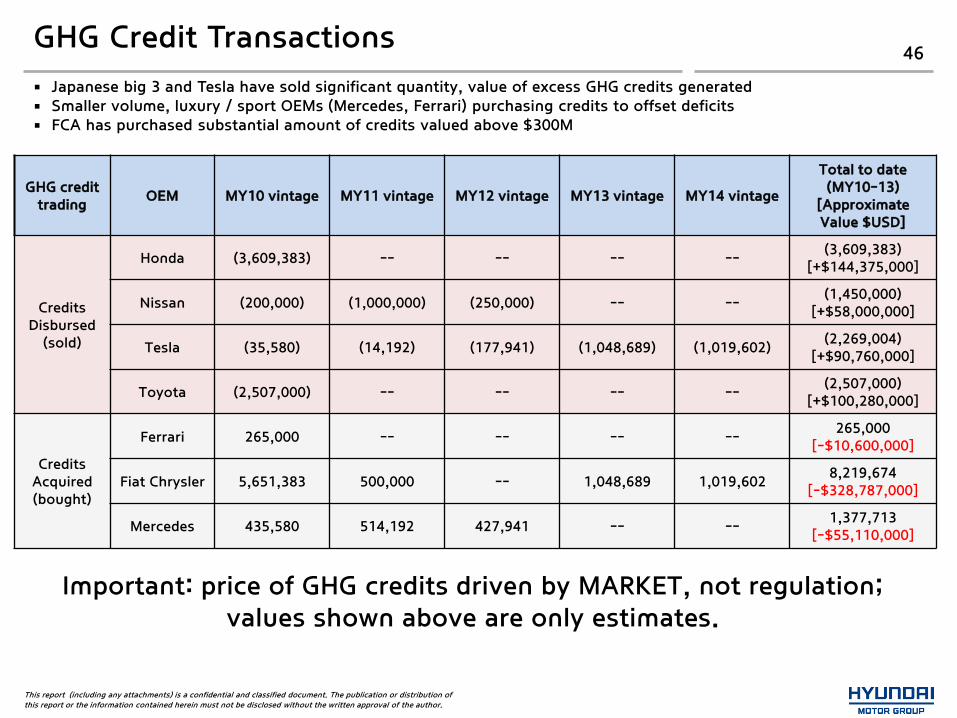
GHG Credit Transactions 46
GHG credit trading
OEM MY10 vintage MY11 vintage MY12 vintage MY13 vintage MY14 vintage
Total to date (MY10-13)
[Approximate Value $USD]
Credits Disbursed
(sold)
Honda (3,609,383) -- -- -- -- (3,609,383)
[+$144,375,000]
Nissan (200,000) (1,000,000) (250,000) -- -- (1,450,000)
[+$58,000,000]
Tesla (35,580) (14,192) (177,941) (1,048,689) (1,019,602) (2,269,004)
[+$90,760,000]
Toyota (2,507,000) -- -- -- -- (2,507,000)
[+$100,280,000]
Credits Acquired (bought)
Ferrari 265,000 -- -- -- -- 265,000
[-$10,600,000]
Fiat Chrysler 5,651,383 500,000 -- 1,048,689 1,019,602 8,219,674
[-$328,787,000]
Mercedes 435,580 514,192 427,941 -- -- 1,377,713
[-$55,110,000]
Japanese big 3 and Tesla have sold significant quantity, value of excess GHG credits generated Smaller volume, luxury / sport OEMs (Mercedes, Ferrari) purchasing credits to offset deficits FCA has purchased substantial amount of credits valued above $300M
Important: price of GHG credits driven by MARKET, not regulation; values shown above are only estimates.
This report (including any attachments) is a confidential and classified document. The publication or distribution of this report or the information contained herein must not be disclosed without the written approval of the author.
GHG Credit Transactions 47
2005 2010 2015 2020 2025
20
25
30
35
40
45
50
55
$-
$10.00
$20.00
$30.00
$40.00
$50.00
$60.00
$70.00
$80.00
$90.00
$100.00
20 25 30 35 40 45 50 55
Cre
dit
Valu
e [
$ /
MgC
O2]
CAFE Standard [MPG]
Value of CAFE / GHG Credits Based on "$55 per vehicle for every 1 MPG under CAFE standard" penalty
This report (including any attachments) is a confidential and classified document. The publication or distribution of this report or the information contained herein must not be disclosed without the written approval of the author.
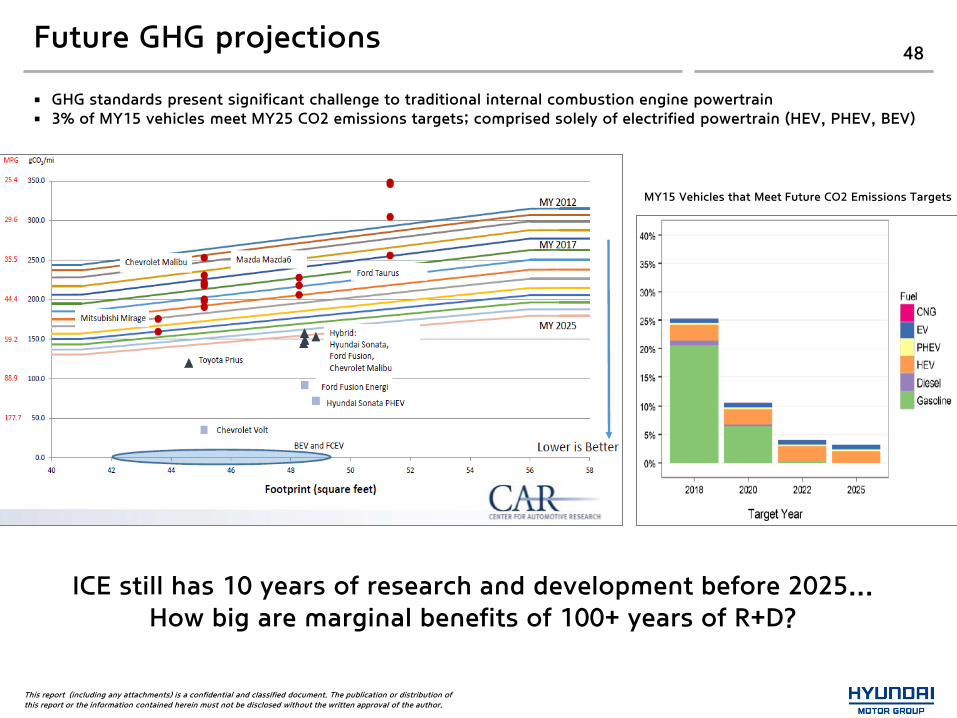
Future GHG projections 48
GHG standards present significant challenge to traditional internal combustion engine powertrain 3% of MY15 vehicles meet MY25 CO2 emissions targets; comprised solely of electrified powertrain (HEV, PHEV, BEV)
MY15 Vehicles that Meet Future CO2 Emissions Targets
ICE still has 10 years of research and development before 2025... How big are marginal benefits of 100+ years of R+D?
This report (including any attachments) is a confidential and classified document. The publication or distribution of this report or the information contained herein must not be disclosed without the written approval of the author.
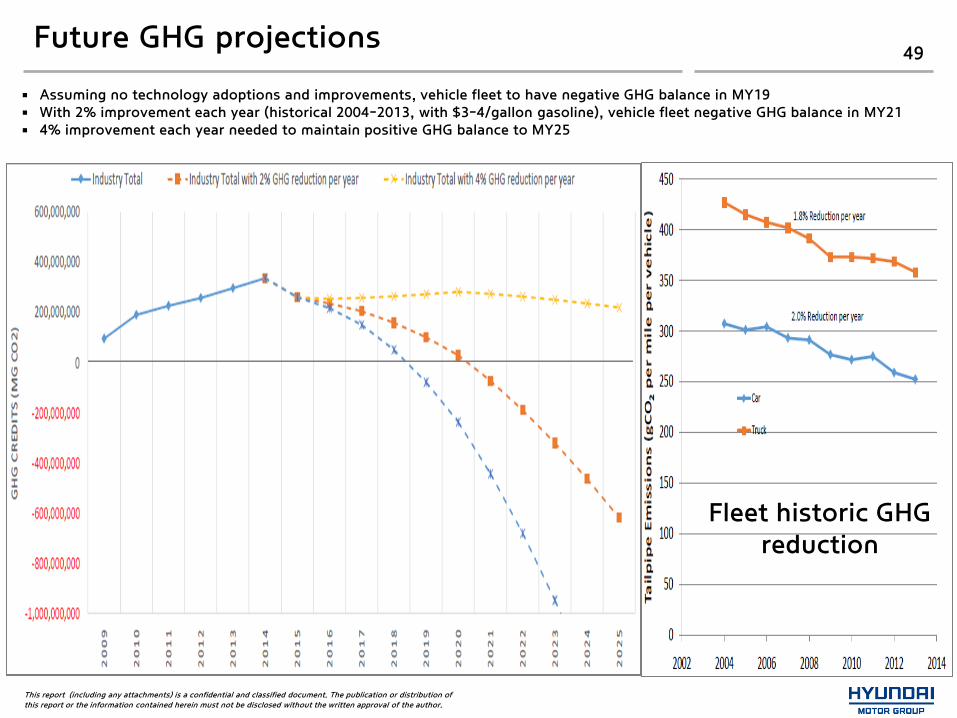
Future GHG projections 49
Assuming no technology adoptions and improvements, vehicle fleet to have negative GHG balance in MY19 With 2% improvement each year (historical 2004-2013, with $3-4/gallon gasoline), vehicle fleet negative GHG balance in MY21 4% improvement each year needed to maintain positive GHG balance to MY25
Fleet historic GHG reduction

This report (including any attachments) is a confidential and classified document. The publication or distribution of this report or the information contained herein must not be disclosed without the written approval of the author.
Future GHG projections (CAFE perspective) 50
Looking at CAFE – 0.65 MPG/year fleet improvement for 7 years (2008~2015) 1.8 MPG/year needed for next 10 years – 280% faster rate of technology deployment, adoption than historically seen
2025
2025 CAFE = 54.5 MPG (43.6 adjusted)
Historic: 0.65 MPG/year
Future: 1.8 MPG/year
280% increase required for future fuel economy regulations
This report (including any attachments) is a confidential and classified document. The publication or distribution of this report or the information contained herein must not be disclosed without the written approval of the author.
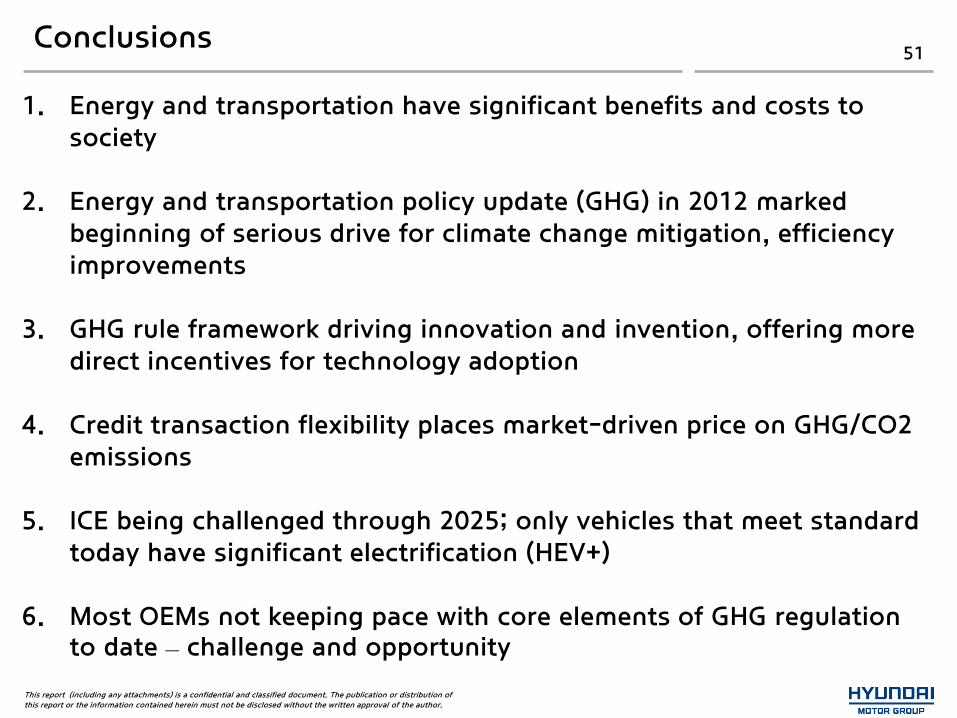
Conclusions 51
1. Energy and transportation have significant benefits and costs to society
2. Energy and transportation policy update (GHG) in 2012 marked beginning of serious drive for climate change mitigation, efficiency improvements
3. GHG rule framework driving innovation and invention, offering more direct incentives for technology adoption
4. Credit transaction flexibility places market-driven price on GHG/CO2 emissions
5. ICE being challenged through 2025; only vehicles that meet standard today have significant electrification (HEV+)
6. Most OEMs not keeping pace with core elements of GHG regulation to date – challenge and opportunity
This report (including any attachments) is a confidential and classified document. The publication or distribution of this report or the information contained herein must not be disclosed without the written approval of the author.
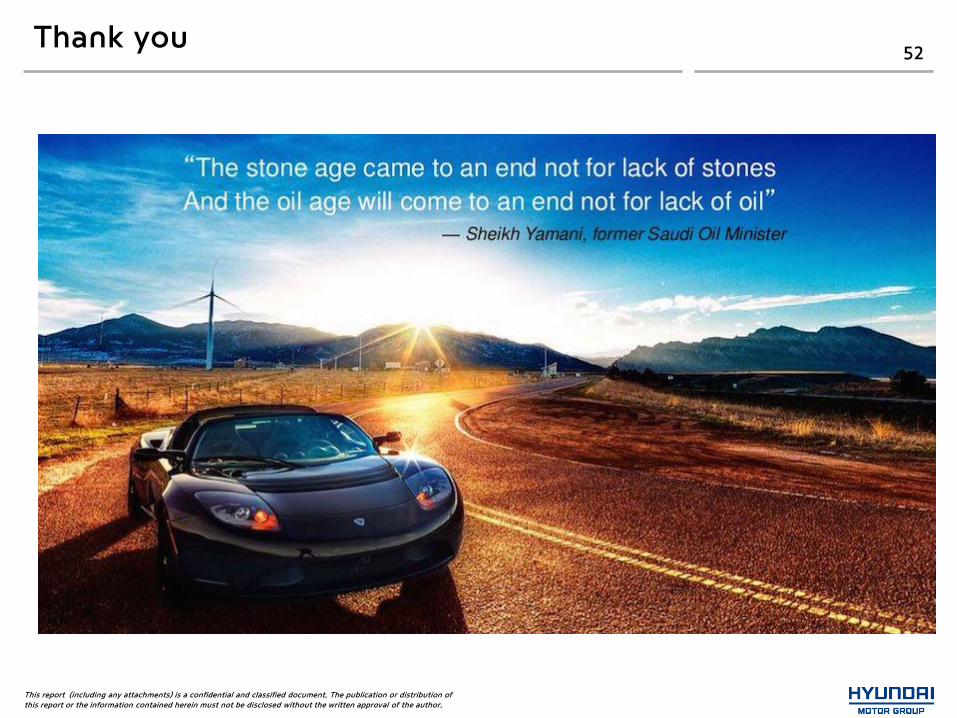
Thank you 52

This report (including any attachments) is a confidential and classified document. The publication or distribution of this report or the information contained herein must not be disclosed without the written approval of the author.
Thank you 53
“Fire made us human, fossil fuels made us modern, but now we need a new fire that makes us safe, secure, healthy and durable.” - Amory Lovins