Embed Size (px)
Citation preview
1
Computer lab:
1. Introduction to Matlab and SAMM
• Using Matlab to generate a phase space plot
• Using SAMM to generate a phase space plot
2. Introduction to GUI programming in Matlab
• Setting up a Graphical User Interface
• Customising controls
3. Optimisation routines in Matlab
USPAS Fort Collins, June 2013Design of Electron Storage and Damping Rings
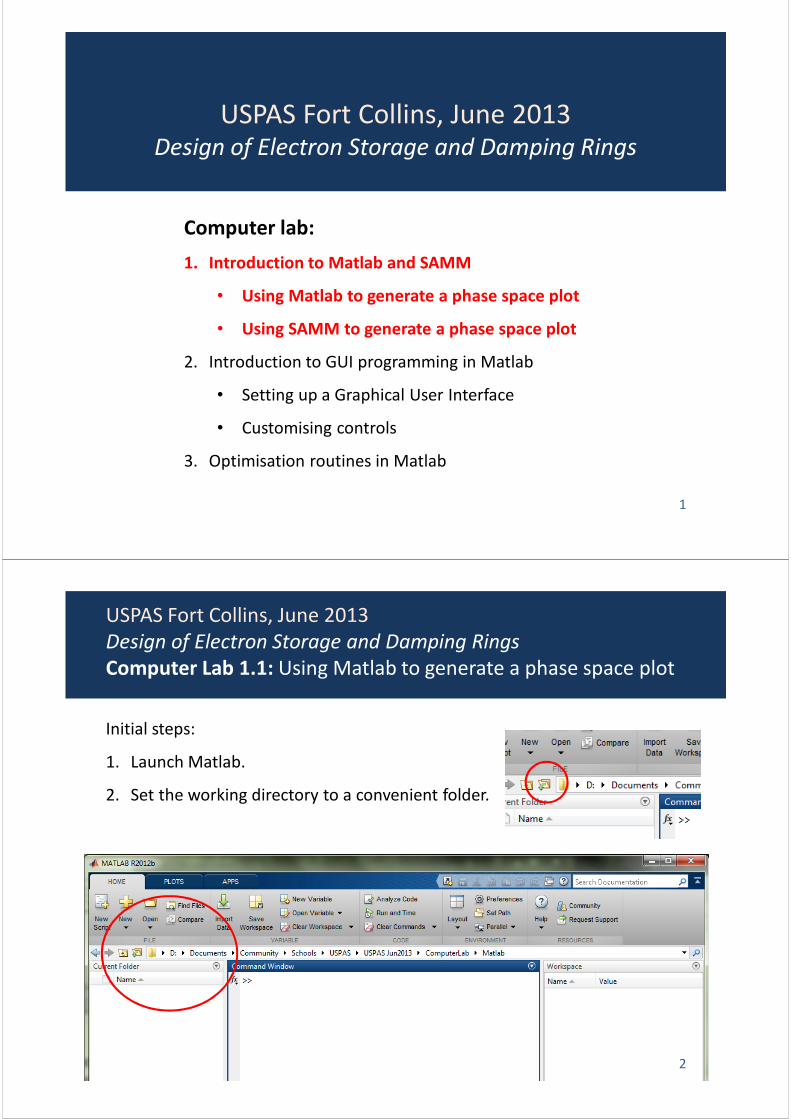
Initial steps:
1. Launch Matlab.
2. Set the working directory to a convenient folder.
2
USPAS Fort Collins, June 2013
Design of Electron Storage and Damping Rings
Computer Lab 1.1: Using Matlab to generate a phase space plot
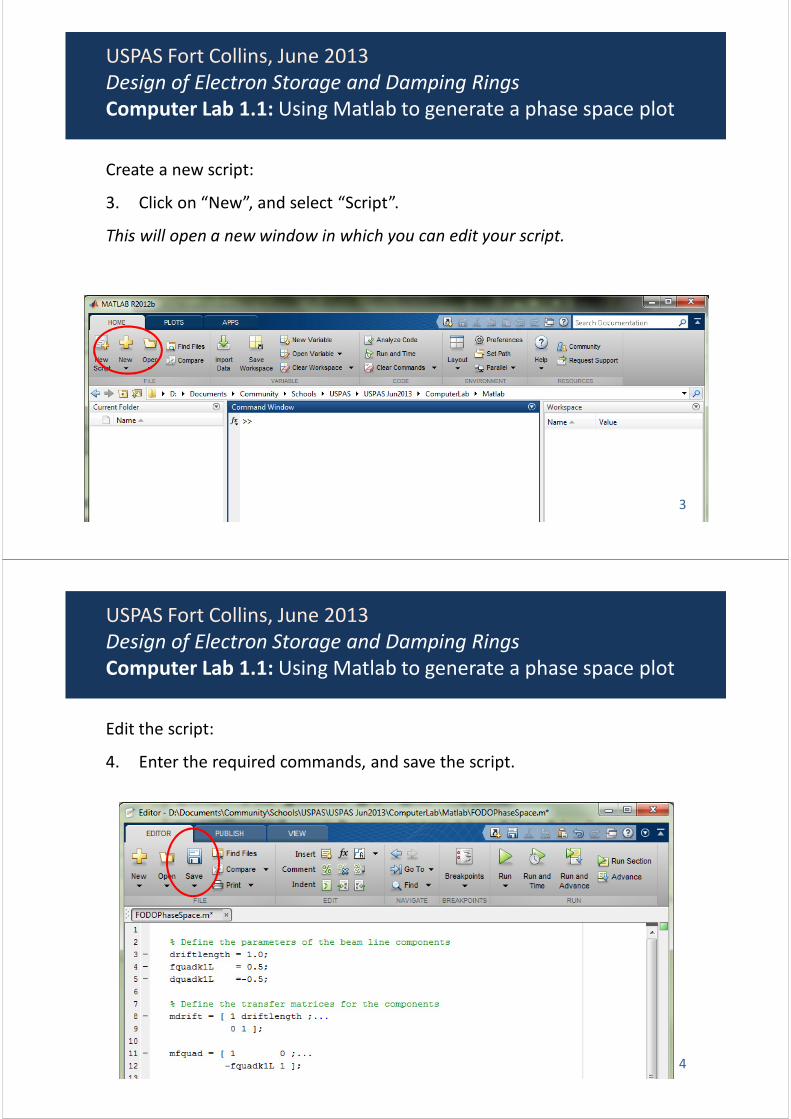
Create a new script:
3. Click on “New”, and select “Script”.
This will open a new window in which you can edit your script.
3
USPAS Fort Collins, June 2013
Design of Electron Storage and Damping Rings
Computer Lab 1.1: Using Matlab to generate a phase space plot
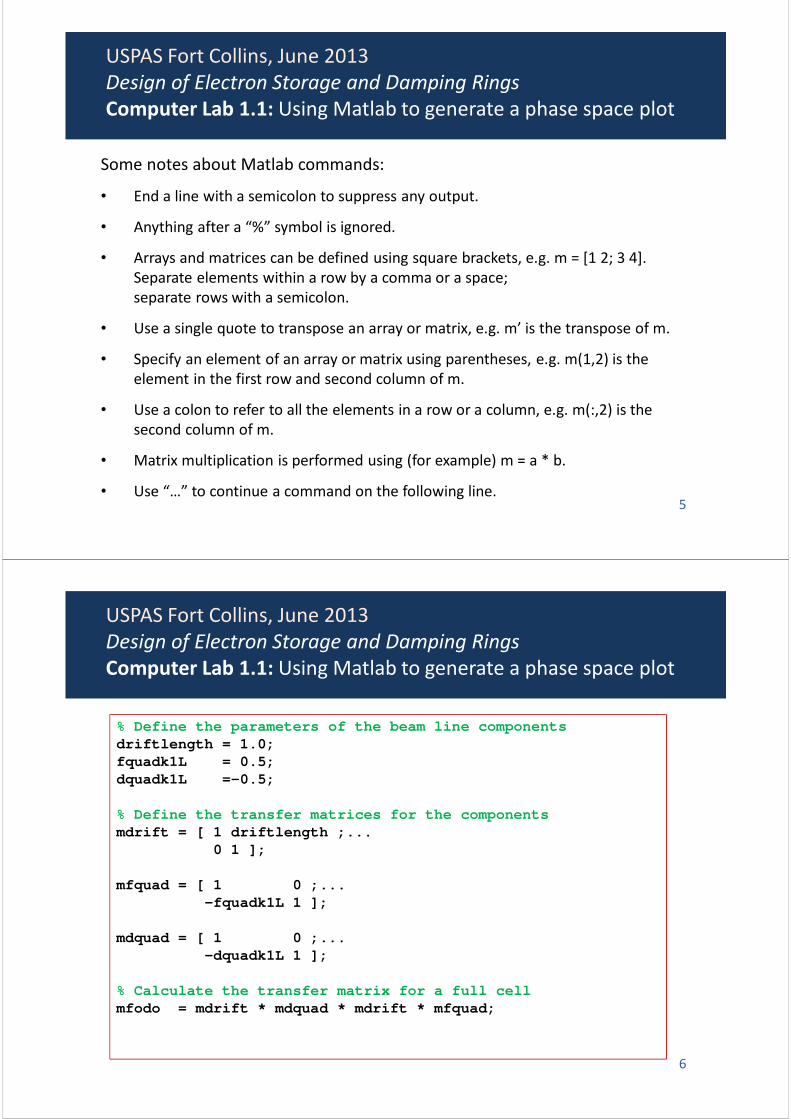
Edit the script:
4. Enter the required commands, and save the script.
4
USPAS Fort Collins, June 2013
Design of Electron Storage and Damping Rings
Computer Lab 1.1: Using Matlab to generate a phase space plot
Some notes about Matlab commands:
• End a line with a semicolon to suppress any output.
• Anything after a “%” symbol is ignored.
• Arrays and matrices can be defined using square brackets, e.g. m = [1 2; 3 4].
Separate elements within a row by a comma or a space;
separate rows with a semicolon.
• Use a single quote to transpose an array or matrix, e.g. m’ is the transpose of m.
• Specify an element of an array or matrix using parentheses, e.g. m(1,2) is the
element in the first row and second column of m.
• Use a colon to refer to all the elements in a row or a column, e.g. m(:,2) is the
second column of m.
• Matrix multiplication is performed using (for example) m = a * b.
• Use “…” to continue a command on the following line.5
USPAS Fort Collins, June 2013
Design of Electron Storage and Damping Rings
Computer Lab 1.1: Using Matlab to generate a phase space plot
% Define the parameters of the beam line components
driftlength = 1.0;
fquadk1L = 0.5;
dquadk1L =-0.5;
% Define the transfer matrices for the components
mdrift = [ 1 driftlength ;...
0 1 ];
mfquad = [ 1 0 ;...
-fquadk1L 1 ];
mdquad = [ 1 0 ;...
-dquadk1L 1 ];
% Calculate the transfer matrix for a full cell
mfodo = mdrift * mdquad * mdrift * mfquad;
6
USPAS Fort Collins, June 2013
Design of Electron Storage and Damping Rings
Computer Lab 1.1: Using Matlab to generate a phase space plot
% Set up a data structure to record the tracking data
psx = zeros(2,100);
% Define the starting point in phase space
psx(:,1) = [0.01 0]';
% Track multiple times through the cell
for n = 2:100
psx(:,n) = mfodo * psx(:,n-1);
end
7
USPAS Fort Collins, June 2013
Design of Electron Storage and Damping Rings
Computer Lab 1.1: Using Matlab to generate a phase space plot
% Create a new figure
figure;
% Plot the tracking results
plot(psx(1,:),psx(2,:),'.k');
% Label the axes
xlabel('x')
ylabel('p_x')
8
USPAS Fort Collins, June 2013
Design of Electron Storage and Damping Rings
Computer Lab 1.1: Using Matlab to generate a phase space plot
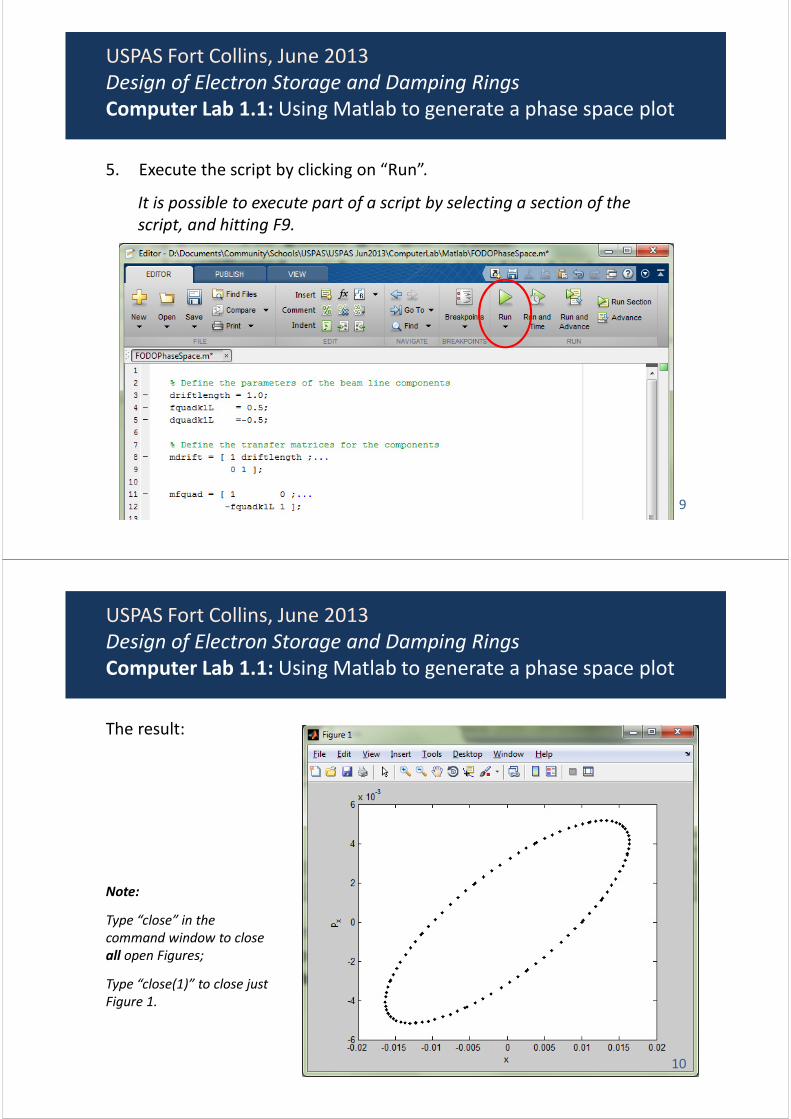
5. Execute the script by clicking on “Run”.
It is possible to execute part of a script by selecting a section of the
script, and hitting F9.
9
USPAS Fort Collins, June 2013
Design of Electron Storage and Damping Rings
Computer Lab 1.1: Using Matlab to generate a phase space plot
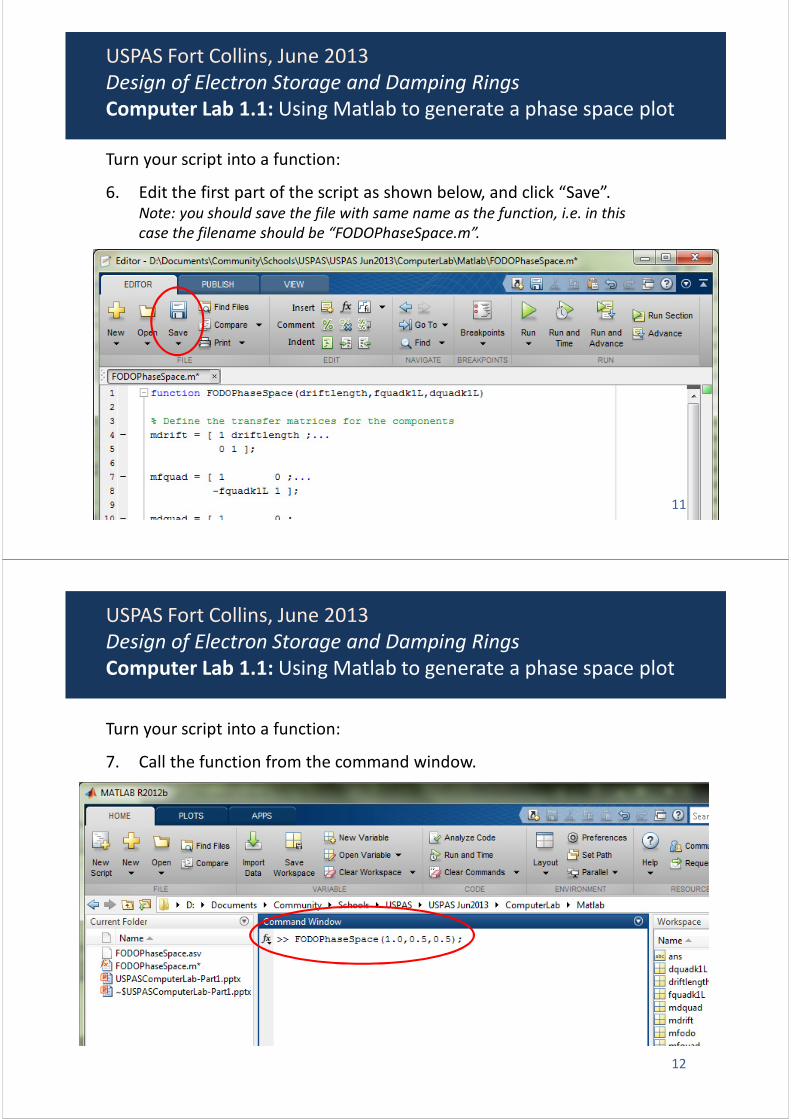
The result:
Note:
Type “close” in the
command window to close
all open Figures;
Type “close(1)” to close just
Figure 1.
10
USPAS Fort Collins, June 2013
Design of Electron Storage and Damping Rings
Computer Lab 1.1: Using Matlab to generate a phase space plot
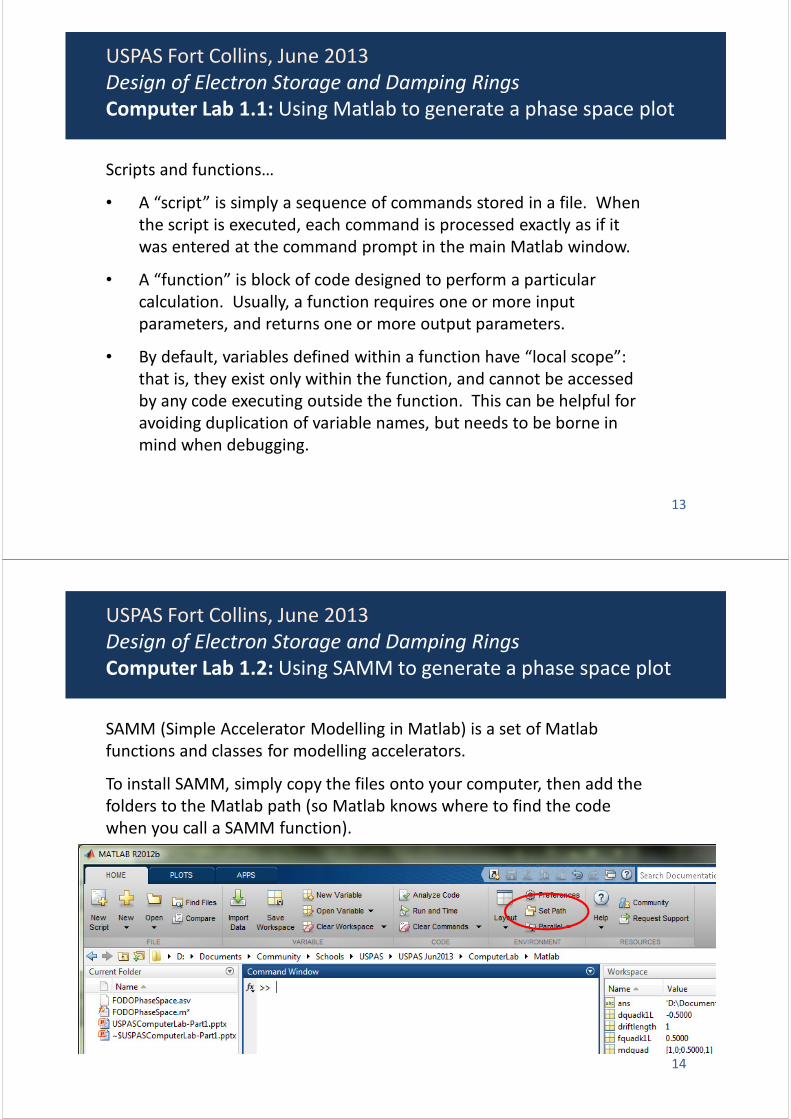
Turn your script into a function:
6. Edit the first part of the script as shown below, and click “Save”.
Note: you should save the file with same name as the function, i.e. in this
case the filename should be “FODOPhaseSpace.m”.
11
USPAS Fort Collins, June 2013
Design of Electron Storage and Damping Rings
Computer Lab 1.1: Using Matlab to generate a phase space plot
Turn your script into a function:
7. Call the function from the command window.
12
USPAS Fort Collins, June 2013
Design of Electron Storage and Damping Rings
Computer Lab 1.1: Using Matlab to generate a phase space plot
Scripts and functions…
• A “script” is simply a sequence of commands stored in a file. When
the script is executed, each command is processed exactly as if it
was entered at the command prompt in the main Matlab window.
• A “function” is block of code designed to perform a particular
calculation. Usually, a function requires one or more input
parameters, and returns one or more output parameters.
• By default, variables defined within a function have “local scope”:
that is, they exist only within the function, and cannot be accessed
by any code executing outside the function. This can be helpful for
avoiding duplication of variable names, but needs to be borne in
mind when debugging.
13
USPAS Fort Collins, June 2013
Design of Electron Storage and Damping Rings
Computer Lab 1.1: Using Matlab to generate a phase space plot
SAMM (Simple Accelerator Modelling in Matlab) is a set of Matlab
functions and classes for modelling accelerators.
To install SAMM, simply copy the files onto your computer, then add the
folders to the Matlab path (so Matlab knows where to find the code
when you call a SAMM function).
14
USPAS Fort Collins, June 2013
Design of Electron Storage and Damping Rings
Computer Lab 1.2: Using SAMM to generate a phase space plot
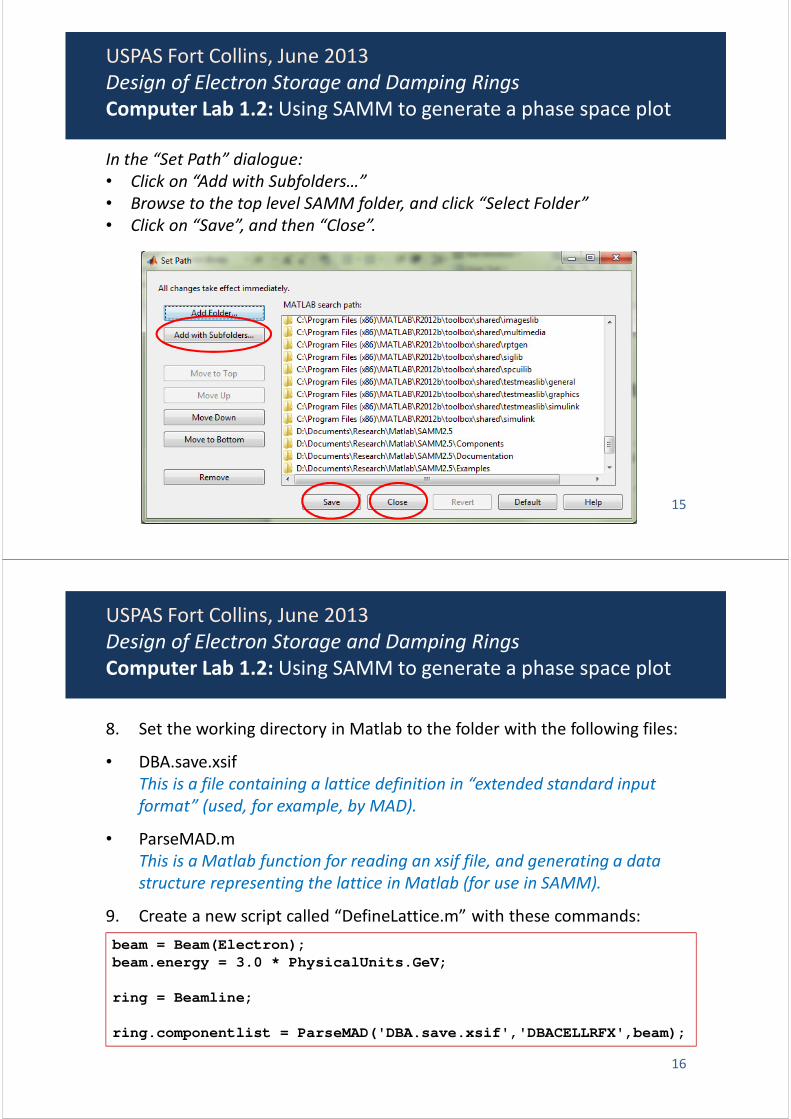
In the “Set Path” dialogue:
• Click on “Add with Subfolders…”
• Browse to the top level SAMM folder, and click “Select Folder”
• Click on “Save”, and then “Close”.
15
USPAS Fort Collins, June 2013
Design of Electron Storage and Damping Rings
Computer Lab 1.2: Using SAMM to generate a phase space plot
8. Set the working directory in Matlab to the folder with the following files:
• DBA.save.xsif
This is a file containing a lattice definition in “extended standard input
format” (used, for example, by MAD).
• ParseMAD.m
This is a Matlab function for reading an xsif file, and generating a data
structure representing the lattice in Matlab (for use in SAMM).
9. Create a new script called “DefineLattice.m” with these commands:
16
beam = Beam(Electron);
beam.energy = 3.0 * PhysicalUnits.GeV;
ring = Beamline;
ring.componentlist = ParseMAD('DBA.save.xsif','DBACELLRFX',beam);
USPAS Fort Collins, June 2013
Design of Electron Storage and Damping Rings
Computer Lab 1.2: Using SAMM to generate a phase space plot
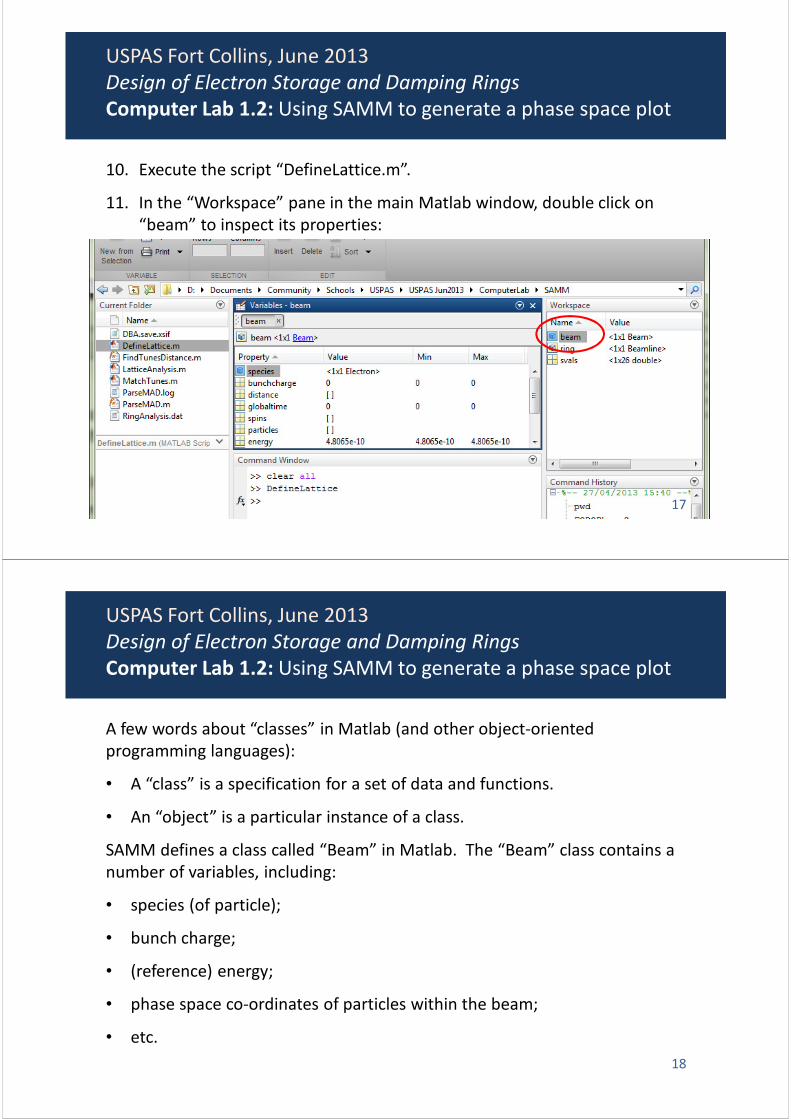
10. Execute the script “DefineLattice.m”.
11. In the “Workspace” pane in the main Matlab window, double click on
“beam” to inspect its properties:
17
USPAS Fort Collins, June 2013
Design of Electron Storage and Damping Rings
Computer Lab 1.2: Using SAMM to generate a phase space plot
A few words about “classes” in Matlab (and other object-oriented
programming languages):
• A “class” is a specification for a set of data and functions.
• An “object” is a particular instance of a class.
SAMM defines a class called “Beam” in Matlab. The “Beam” class contains a
number of variables, including:
• species (of particle);
• bunch charge;
• (reference) energy;
• phase space co-ordinates of particles within the beam;
• etc.
18
USPAS Fort Collins, June 2013
Design of Electron Storage and Damping Rings
Computer Lab 1.2: Using SAMM to generate a phase space plot
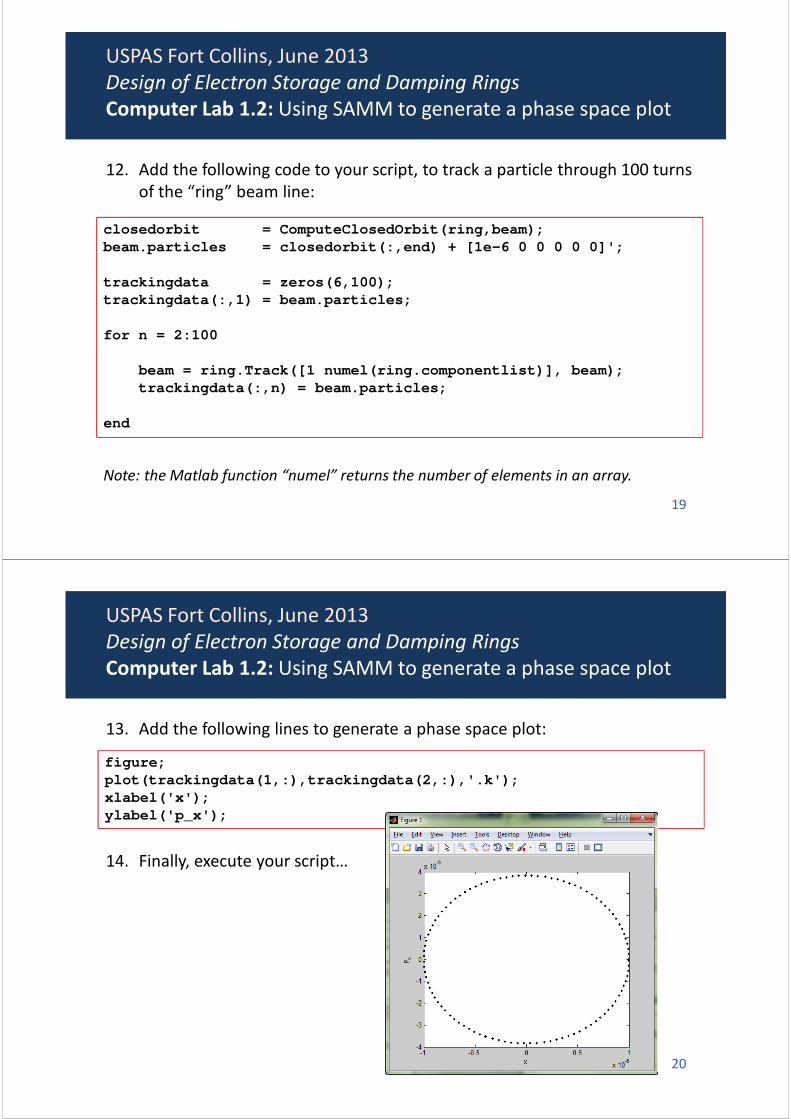
12. Add the following code to your script, to track a particle through 100 turns
of the “ring” beam line:
19
closedorbit = ComputeClosedOrbit(ring,beam);
beam.particles = closedorbit(:,end) + [1e-6 0 0 0 0 0]';
trackingdata = zeros(6,100);
trackingdata(:,1) = beam.particles;
for n = 2:100
beam = ring.Track([1 numel(ring.componentlist)], beam);
trackingdata(:,n) = beam.particles;
end
Note: the Matlab function “numel” returns the number of elements in an array.
USPAS Fort Collins, June 2013
Design of Electron Storage and Damping Rings
Computer Lab 1.2: Using SAMM to generate a phase space plot
13. Add the following lines to generate a phase space plot:
14. Finally, execute your script…
20
figure;
plot(trackingdata(1,:),trackingdata(2,:),'.k');
xlabel('x');
ylabel('p_x');
USPAS Fort Collins, June 2013
Design of Electron Storage and Damping Rings
Computer Lab 1.2: Using SAMM to generate a phase space plot
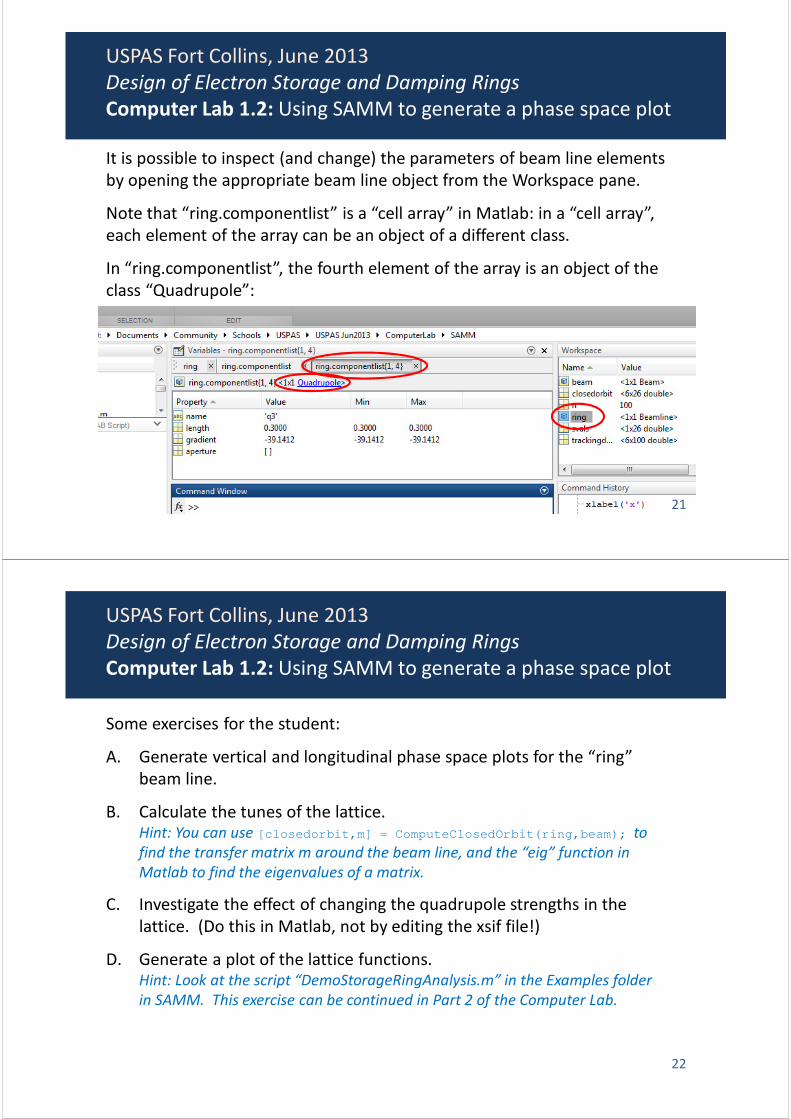
It is possible to inspect (and change) the parameters of beam line elements
by opening the appropriate beam line object from the Workspace pane.
Note that “ring.componentlist” is a “cell array” in Matlab: in a “cell array”,
each element of the array can be an object of a different class.
In “ring.componentlist”, the fourth element of the array is an object of the
class “Quadrupole”:
21
USPAS Fort Collins, June 2013
Design of Electron Storage and Damping Rings
Computer Lab 1.2: Using SAMM to generate a phase space plot
Some exercises for the student:
A. Generate vertical and longitudinal phase space plots for the “ring”
beam line.
B. Calculate the tunes of the lattice.
Hint: You can use [closedorbit,m] = ComputeClosedOrbit(ring,beam); to
find the transfer matrix m around the beam line, and the “eig” function in
Matlab to find the eigenvalues of a matrix.
C. Investigate the effect of changing the quadrupole strengths in the
lattice. (Do this in Matlab, not by editing the xsif file!)
D. Generate a plot of the lattice functions.
Hint: Look at the script “DemoStorageRingAnalysis.m” in the Examples folder
in SAMM. This exercise can be continued in Part 2 of the Computer Lab.
22
USPAS Fort Collins, June 2013
Design of Electron Storage and Damping Rings
Computer Lab 1.2: Using SAMM to generate a phase space plot