Embed Size (px)
Citation preview
Enterprise Storage
Universal Storage Platform V Architecture and Performance Guidelines
A White Paper
By
Alan Benway Senior Performance Consultant
Performance Measurements Group
Hitachi Data Systems Technical Operations Santa Clara CA 5050
June 11, 2007
Copyright 2007 Hitachi Data Systems Corporation, ALL RIGHTS RESERVED
Hitachi Data Systems Confidential For Internal Use and Distribution to Authorized Parties Only
- 1 -
Table of Contents I. Introduction .................................................................................................................... 2
II. Overview of Changes .................................................................................................... 3 Software ..................................................................................................................................... 3 Hardware ................................................................................................................................... 4
III. Dynamic Provisioning................................................................................................. 5 Traditional server volume management ................................................................................. 5 Traditional USP storage volume management....................................................................... 6 Dynamic Provisioning............................................................................................................... 8
HDP Pools............................................................................................................................................. 8 Pool Pages........................................................................................................................................... 10 Pool Expansion ................................................................................................................................... 12 Pool Sizes............................................................................................................................................ 14 HDP Volumes ..................................................................................................................................... 16 Miscellaneous Details ......................................................................................................................... 17 HDP and Program Products Compatibility ......................................................................................... 18
IV. USP V Architecture ................................................................................................... 19 Processor Upgrade .................................................................................................................. 20 Logic Box Layout .................................................................................................................... 20 Overview of Packages ............................................................................................................. 22 Front-End-Directors ............................................................................................................... 22
FED FC-16 port Options..................................................................................................................... 22 FED FC-8 port, ESCON, FICON Options.......................................................................................... 23
Back-end Directors ................................................................................................................. 23 BED Options....................................................................................................................................... 23
USP V: HDU and BED Associations by Frame.................................................................... 24 USP: HDU and BED Associations by Frame........................................................................ 25 HDU Switched Loop Details................................................................................................... 27
V. USP V FED Details..................................................................................................... 29 Open Fibre 8-Port Package .................................................................................................... 29 Open Fibre 16-Port Package .................................................................................................. 30 ESCON 8-port Package .......................................................................................................... 31 FICON 8-port package ........................................................................................................... 32
VI. USP V BED Disk Controller Details......................................................................... 34 Back-End Director Details ..................................................................................................... 34 Back-End Disk Organization ................................................................................................. 35
VII. USP V Product Models ............................................................................................ 37 Small Configuration................................................................................................................ 37
Hitachi Data Systems Confidential For Internal Use and Distribution to Authorized Parties Only
- 2 -
Midsize Configuration ............................................................................................................ 38 Large Configuration ............................................................................................................... 39
VIII. Special Performance Tests ..................................................................................... 40 Database Test Comparison .................................................................................................... 40 DP-VOL Performance ............................................................................................................ 40
IX. RAID10 (2d+2d) Back-end Scalability Tests ............................................................ 41 Test Methodology.................................................................................................................... 41 Random I/O Transactions ...................................................................................................... 42 Sequential I/O Throughput .................................................................................................... 43
X. RAID5 (3d+1p) Back-end Scalability Tests................................................................ 45 Test Methodology.................................................................................................................... 46 Random I/O Transactions ...................................................................................................... 46 Sequential I/O Throughput .................................................................................................... 47
XI. RAID5 (7d+1p) Back-end Scalability Tests .............................................................. 51 Test Methodology.................................................................................................................... 51 Random I/O Transactions ...................................................................................................... 52 Sequential I/O Throughput .................................................................................................... 52
XII. RAID6 (6d+2p) Back-end Scalability Tests ............................................................ 56 Test Methodology.................................................................................................................... 56 Random I/O Transactions ...................................................................................................... 57 Sequential I/O Throughput .................................................................................................... 57
XIII. RAID10 (2d+2d) AMS500 Virtualization Tests..................................................... 61 Universal Volume Manager ................................................................................................... 61 Test Overview.......................................................................................................................... 62 Test Methodology.................................................................................................................... 62 Random Workloads ................................................................................................................ 63 Sequential Workloads............................................................................................................. 63
XIV. RAID10 (2d+2d) Single Array Group LUN scalability tests. ................................ 64 Test Methodology.................................................................................................................... 64 Random Workloads ................................................................................................................ 65 Sequential Workloads............................................................................................................. 69
XV. RAID5 (3d+1p) Single Array Group LUN scalability tests..................................... 71 Test Methodology.................................................................................................................... 71 Random Workloads ................................................................................................................ 72
Hitachi Data Systems Confidential For Internal Use and Distribution to Authorized Parties Only
- 3 -
Hitachi Data Systems Confidential For Internal Use and Distribution to Authorized Parties Only
- 4 -
Sequential Workloads............................................................................................................. 76 XV. RAID10 (2d+2d) HDP Tests..................................................................................... 79
Test Methodology.................................................................................................................... 79 Random Workloads Comparisons......................................................................................... 80 Sequential Workloads Comparisons ..................................................................................... 84
XVI. Summary.................................................................................................................. 87
APPENDIX 1. USP V (Frames, HDUs, and Parity Groups)......................................... 88
APPENDIX 2. USP (Frames, HDUs, and Parity Groups). ........................................... 89
APPENDIX 3. Open Systems RAID Mechanisms.......................................................... 90
APPENDIX 4. Mainframe 3390x and Open-x RAID Mechanisms............................... 93
APPENDIX 5. Concatenated Array Groups................................................................... 97
CONTRIBUTIONS Gil Rangel Director of Performance Measurement Group Ron-an Lee Performance Consultant, PMG, HDP Tests James Byun Performance Consultant, PMG, RAID tests Michael Netsvetayev Performance Consultant, PMG, AMS500 tests Jean-Francois Masse (HDP Pool sizing) Solutions Architect, Solutions Development, GSS Larry Korbus (HDP details) Director, Product Management (HDP, UVM, VPM, HTSM)
Hitachi Data Systems Confidential For Internal Use and Distribution to Authorized Parties Only
- 1 -
I. Introduction This document covers the new architectural and software features of the Universal Storage Platform V (USP V). These features are covered in detail in the following sections. This document is not intended to cover any aspects of program products, databases, customer specific environments, or new features available by the second general release. Areas not covered by this document include:
TrueCopy/Shadow Image/Universal Replicator – Disaster Recovery Solutions
Host - Logical Volume Management – General Guidelines HDLM – General Guidelines Universal Volume Management (UVM) – General Guidelines for Data
Lifecycle Management (DLM) Virtual Partition Management (VPM) – General Guidelines for Workload
Management Oracle – General Guidelines for RAID Level Selection Microsoft Exchange – General Guidelines for RAID Level Selection
This document is intended to familiarize Hitachi Data Systems’ sales personnel, technical support staff, customers, and value-added resellers with the new software and architectural features of the USP V. The users that will benefit from this document are those who already possess an in depth knowledge of the TagmaStore USP architecture and performance capabilities. Throughout this paper the terminology used by Hitachi Data Systems - not the factory - will be used. For instance, Hitachi calls this new system “RAID 600” while HDS has named it “USP V”. Some other storage terminology is used differently in the documentation or by users in the field as well. Here are some definitions as used in this paper:
• Array Group – the set of 1 or 2 Parity Groups used to form a single Array Group. When 2 Parity Groups are used (as RAID10 4d+4d, RAID5 7d+1p, RAID6 6d+2p), there is a specific, fixed, location association between the 2 Parity Groups used. Note: Although Storage Navigator and the SVP GUI imply that a RAID10 4d+4d is a concatenation of two 2d+2d Parity Groups, it is not. There is a single stripe across 4 pairs of mirrored disks.
• BED – Back-end Director package; the pair of Disk Adapter (DKA) PCBs used to attach disks to the storage system.
• Concatenated Array Groups – 2 or 4 Array Groups configured as RAID5 7d+1p used in a combination of alternating RAID stripes. Sometimes called “VDEV Disperse”. See Appendix 5 for more details.
• DP-VOL – a Dynamic Provisioning Volume, the Virtual Volume from an HDP Pool.
• FED – Front-end Director package; the pair of Channel Adapter (CHA) PCBs used to attach hosts to the storage system.
• LDEV (Logical Device) – a volume created from the space within a particular Array Group. It is a partition from that Array Group’s raw space.
Hitachi Data Systems Confidential For Internal Use and Distribution to Authorized Parties Only
- 2 -
• LUN (Logical Unit Number) – the host-visible identifier assigned by the user to an LDEV when it is made visible to a host port.
• LUSE (Logical Unit Size Expansion) – A concatenation of 2 or more LDEVs that are then presented to a host as a LUN.
• Parity Group – the 4-disk upgrade package that goes into a specific set of disk slots and then takes on a fixed name (such as Parity Group 10-2). This term is often used instead of Array Group, although they aren’t the same thing.
II. Overview of Changes Expanding on the proven and superior USP technology, the USP V offers a new level of Enterprise Storage, capable of meeting the most demanding of workloads while maintaining great flexibility. The USP V offers higher performance, higher reliability, and greater flexibility than any competitive offering in existence today. These are the new products and features that distinguish the USP V from the USP:
Software o Hitachi Dynamic Provisioning (HDP) management feature.
Hardware o Enhanced Shared Memory system (up to 32GB and 256 paths @
150MB/s). o Faster 800MHz RISC processors on FEDs (Channel Adapters) and
BEDs (Disk Adapters). o Faster BED 4Gbit back-end disk loops. o Switched Loop back-end. o Half-sized PCBs used now (except for Shared Memory PCBs),
allowing for more flexible configuration choices. Software The USP V software includes Hitachi Dynamic Provisioning, a major new Open Systems feature that will allow storage managers and system administrators to more efficiently plan and allocate storage to users or applications. This new feature provides for two new capabilities: thin provisioning and enhanced volume performance. The HDP feature provides for the creation of one or more HDP Pools of physical space (multiple LDEVs from multiple Array Groups of any RAID level), and for the establishment of HDP Virtual Volumes that are connected to individual HDP Pools. Thin provisioning comes from the creation of Virtual Volumes of a user-specified logical size without any corresponding physical space. Actual physical space (as 42MB Pool pages) is only assigned to a Virtual Volume by the HDP software from the connected HDP Pool as that volume’s logical space is written to over time. A volume does not have any Pool pages assigned to it when it is first created. Technically, it never does – the pages are “loaned out” from its connected Pool to that virtual volume until it is reformatted and deleted. At that point all of its assigned pages are returned to the Pool to the Free Page List.
Hitachi Data Systems Confidential For Internal Use and Distribution to Authorized Parties Only
- 3 -
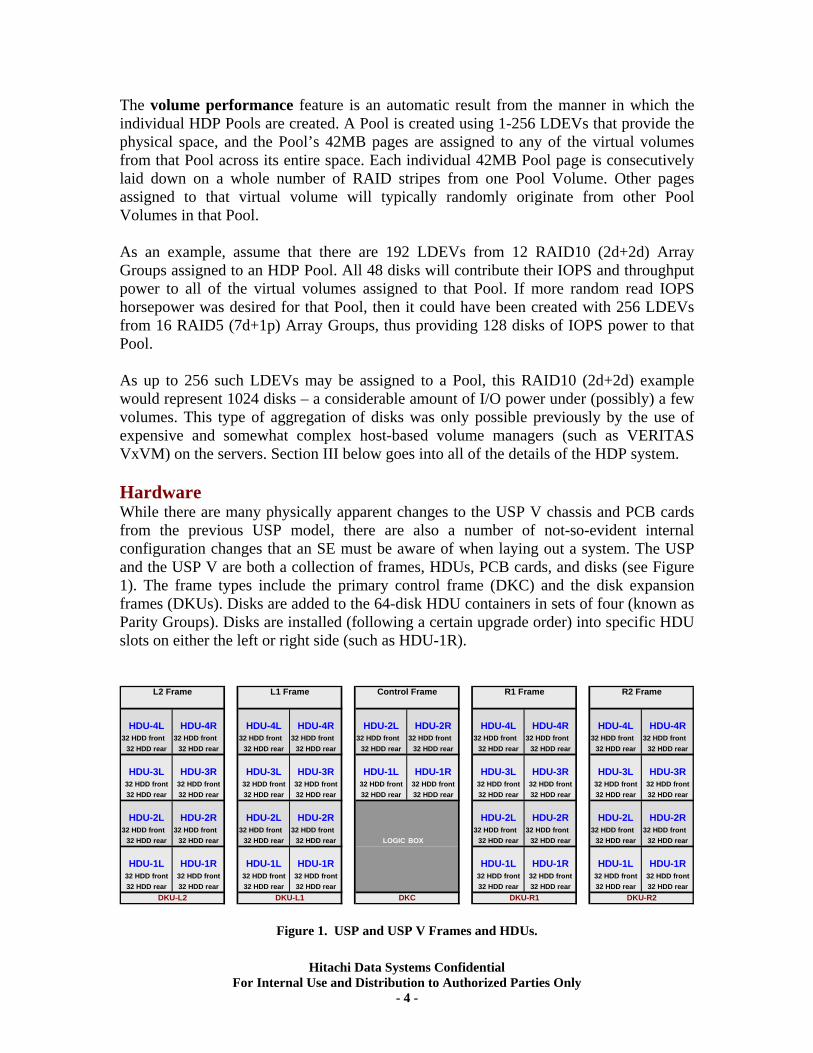
The volume performance feature is an automatic result from the manner in which the individual HDP Pools are created. A Pool is created using 1-256 LDEVs that provide the physical space, and the Pool’s 42MB pages are assigned to any of the virtual volumes from that Pool across its entire space. Each individual 42MB Pool page is consecutively laid down on a whole number of RAID stripes from one Pool Volume. Other pages assigned to that virtual volume will typically randomly originate from other Pool Volumes in that Pool. As an example, assume that there are 192 LDEVs from 12 RAID10 (2d+2d) Array Groups assigned to an HDP Pool. All 48 disks will contribute their IOPS and throughput power to all of the virtual volumes assigned to that Pool. If more random read IOPS horsepower was desired for that Pool, then it could have been created with 256 LDEVs from 16 RAID5 (7d+1p) Array Groups, thus providing 128 disks of IOPS power to that Pool. As up to 256 such LDEVs may be assigned to a Pool, this RAID10 (2d+2d) example would represent 1024 disks – a considerable amount of I/O power under (possibly) a few volumes. This type of aggregation of disks was only possible previously by the use of expensive and somewhat complex host-based volume managers (such as VERITAS VxVM) on the servers. Section III below goes into all of the details of the HDP system. Hardware While there are many physically apparent changes to the USP V chassis and PCB cards from the previous USP model, there are also a number of not-so-evident internal configuration changes that an SE must be aware of when laying out a system. The USP and the USP V are both a collection of frames, HDUs, PCB cards, and disks (see Figure 1). The frame types include the primary control frame (DKC) and the disk expansion frames (DKUs). Disks are added to the 64-disk HDU containers in sets of four (known as Parity Groups). Disks are installed (following a certain upgrade order) into specific HDU slots on either the left or right side (such as HDU-1R).
HDU-4L HDU-4R HDU-4L HDU-4R HDU-2L HDU-2R HDU-4L HDU-4R HDU-4L HDU-4R32 HDD front 32 HDD front 32 HDD front 32 HDD front 32 HDD front 32 HDD front 32 HDD front 32 HDD front 32 HDD front 32 HDD front
32 HDD rear 32 HDD rear 32 HDD rear 32 HDD rear 32 HDD rear 32 HDD rear 32 HDD rear 32 HDD rear 32 HDD rear 32 HDD rear
HDU-3L HDU-3R HDU-3L HDU-3R HDU-1L HDU-1R HDU-3L HDU-3R HDU-3L HDU-3R32 HDD front 32 HDD front 32 HDD front 32 HDD front 32 HDD front 32 HDD front 32 HDD front 32 HDD front 32 HDD front 32 HDD front32 HDD rear 32 HDD rear 32 HDD rear 32 HDD rear 32 HDD rear 32 HDD rear 32 HDD rear 32 HDD rear 32 HDD rear 32 HDD rear
HDU-2L HDU-2R HDU-2L HDU-2R HDU-2L HDU-2R HDU-2L HDU-2R32 HDD front 32 HDD front 32 HDD front 32 HDD front 32 HDD front 32 HDD front 32 HDD front 32 HDD front
32 HDD rear 32 HDD rear 32 HDD rear 32 HDD rear LOGIC BOX 32 HDD rear 32 HDD rear 32 HDD rear 32 HDD rear
HDU-1L HDU-1R HDU-1L HDU-1R HDU-1L HDU-1R HDU-1L HDU-1R32 HDD front 32 HDD front 32 HDD front 32 HDD front 32 HDD front 32 HDD front 32 HDD front 32 HDD front32 HDD rear 32 HDD rear 32 HDD rear 32 HDD rear 32 HDD rear 32 HDD rear 32 HDD rear 32 HDD rear
R2 FrameL2 Frame L1 Frame Control Frame R1 Frame
DKU-R1 DKU-R2DKU-L2 DKU-L1 DKC
Figure 1. USP and USP V Frames and HDUs.
Hitachi Data Systems Confidential For Internal Use and Distribution to Authorized Parties Only
- 4 -
Logic boards are installed in the front and rear slots in the Logic Box in the Control Frame. The logic board types (for both USP and USP V) include these packages (each a pair of PCBs):
• CSWs – Cache Switch • CMAs – Cache Memory • SMAs – Shared Memory • FEDs – Front-end Directors (or Channel Adapters) • BEDs – Back-end Directors (or Disk Adapters)
The USP V’s new half-sized PCBs (now with upper and lower slots in the Logic Box, described later) allow for a less costly, more incremental expansion of a system. For instance, there were typically 4-6 FED packages installed in a USP600, and they could be a mixture of Open Fibre, ESCON, FICON, and iSCSI. However, this gave you a large number of ports of a single type that you may not need, with a substantial reduction of other port types that you may need to maximize. With the new half-sized cards, you can have 8 FED packages (or up to 16 at the expense of disk BED packages), using any mixture of the interface types as before. Now, as there are half as many ports per board, smaller numbers of lesser used port types may be installed. Packages are still installed as pairs of PCB cards just as with the USP. Other physical USP V changes include:
• The associations between some BEDs and HDUs have changed • The associations between FEDs, BEDs, and the CSWs are different. • The locations of 50% of the named Parity Groups have shifted around.
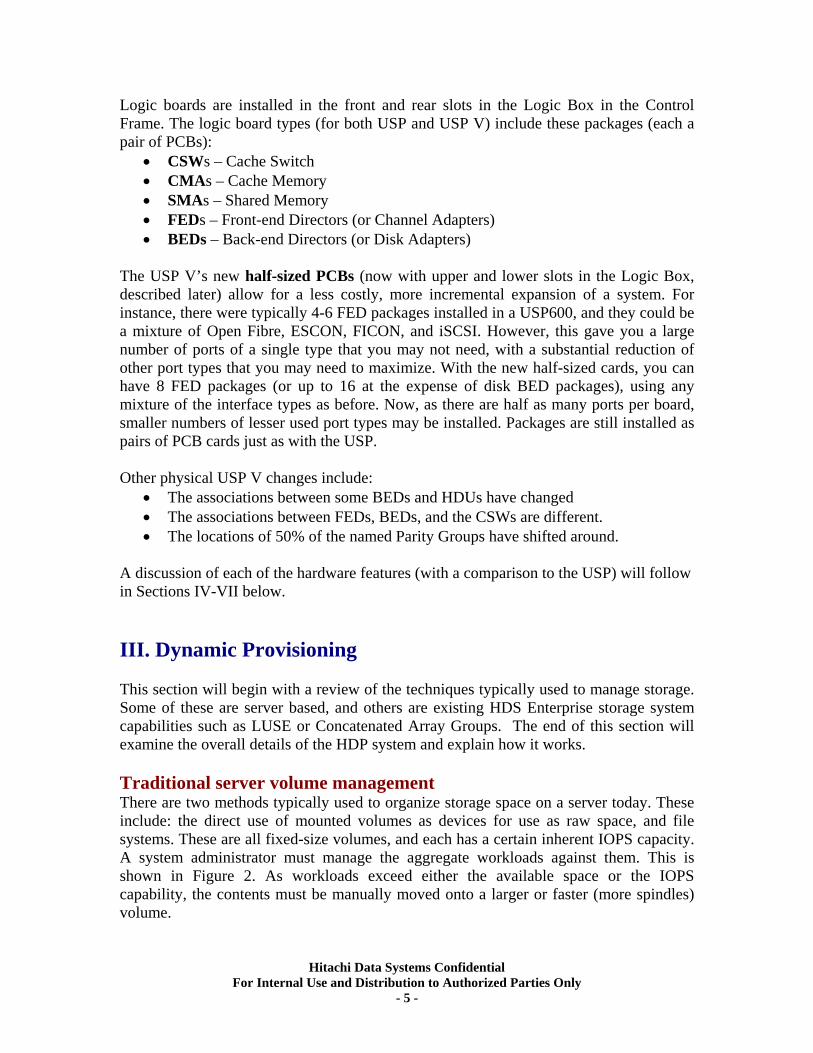
A discussion of each of the hardware features (with a comparison to the USP) will follow in Sections IV-VII below. III. Dynamic Provisioning This section will begin with a review of the techniques typically used to manage storage. Some of these are server based, and others are existing HDS Enterprise storage system capabilities such as LUSE or Concatenated Array Groups. The end of this section will examine the overall details of the HDP system and explain how it works. Traditional server volume management There are two methods typically used to organize storage space on a server today. These include: the direct use of mounted volumes as devices for use as raw space, and file systems. These are all fixed-size volumes, and each has a certain inherent IOPS capacity. A system administrator must manage the aggregate workloads against them. This is shown in Figure 2. As workloads exceed either the available space or the IOPS capability, the contents must be manually moved onto a larger or faster (more spindles) volume.
Hitachi Data Systems Confidential For Internal Use and Distribution to Authorized Parties Only
- 5 -
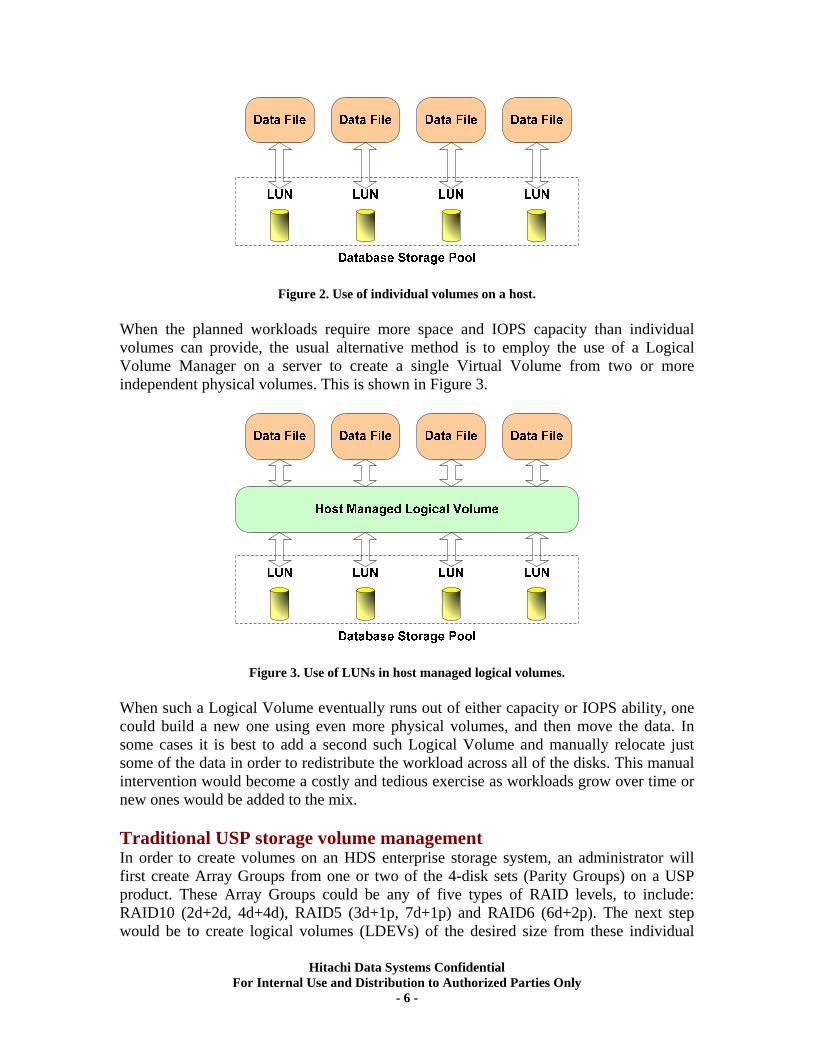
Figure 2. Use of individual volumes on a host. When the planned workloads require more space and IOPS capacity than individual volumes can provide, the usual alternative method is to employ the use of a Logical Volume Manager on a server to create a single Virtual Volume from two or more independent physical volumes. This is shown in Figure 3.
Figure 3. Use of LUNs in host managed logical volumes. When such a Logical Volume eventually runs out of either capacity or IOPS ability, one could build a new one using even more physical volumes, and then move the data. In some cases it is best to add a second such Logical Volume and manually relocate just some of the data in order to redistribute the workload across all of the disks. This manual intervention would become a costly and tedious exercise as workloads grow over time or new ones would be added to the mix. Traditional USP storage volume management In order to create volumes on an HDS enterprise storage system, an administrator will first create Array Groups from one or two of the 4-disk sets (Parity Groups) on a USP product. These Array Groups could be any of five types of RAID levels, to include: RAID10 (2d+2d, 4d+4d), RAID5 (3d+1p, 7d+1p) and RAID6 (6d+2p). The next step would be to create logical volumes (LDEVs) of the desired size from these individual
Hitachi Data Systems Confidential For Internal Use and Distribution to Authorized Parties Only
- 6 -
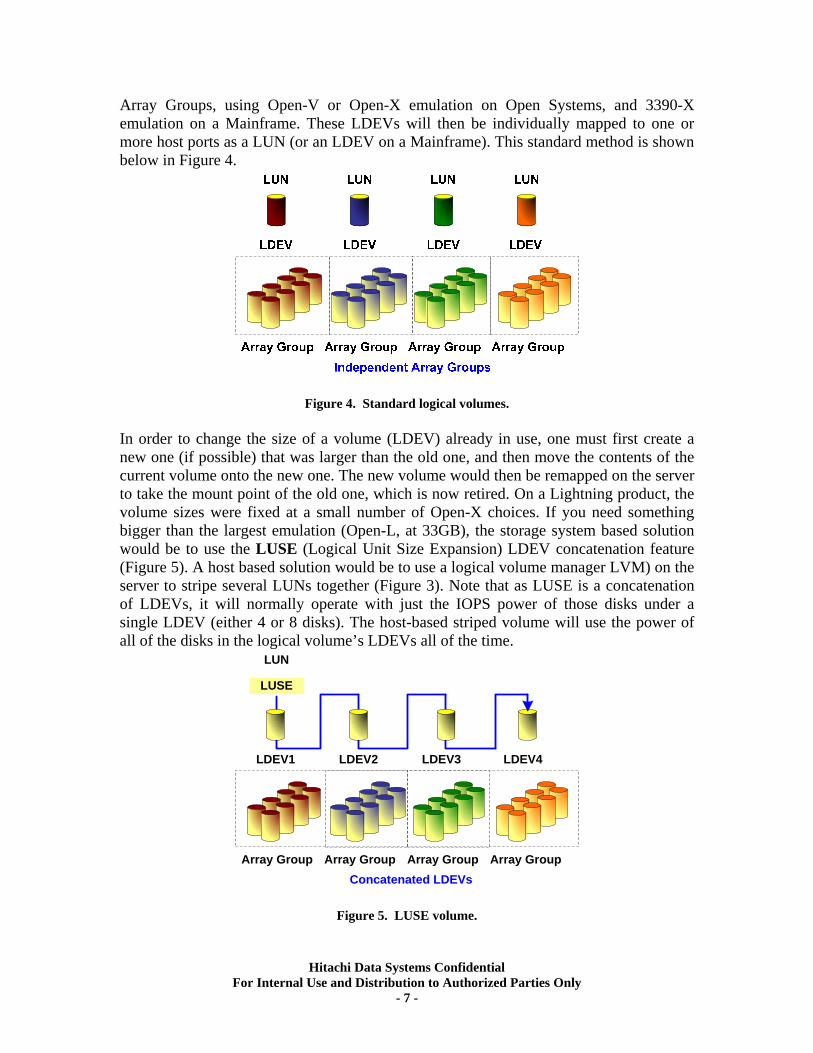
Array Groups, using Open-V or Open-X emulation on Open Systems, and 3390-X emulation on a Mainframe. These LDEVs will then be individually mapped to one or more host ports as a LUN (or an LDEV on a Mainframe). This standard method is shown below in Figure 4.
Figure 4. Standard logical volumes. In order to change the size of a volume (LDEV) already in use, one must first create a new one (if possible) that was larger than the old one, and then move the contents of the current volume onto the new one. The new volume would then be remapped on the server to take the mount point of the old one, which is now retired. On a Lightning product, the volume sizes were fixed at a small number of Open-X choices. If you need something bigger than the largest emulation (Open-L, at 33GB), the storage system based solution would be to use the LUSE (Logical Unit Size Expansion) LDEV concatenation feature (Figure 5). A host based solution would be to use a logical volume manager LVM) on the server to stripe several LUNs together (Figure 3). Note that as LUSE is a concatenation of LDEVs, it will normally operate with just the IOPS power of those disks under a single LDEV (either 4 or 8 disks). The host-based striped volume will use the power of all of the disks in the logical volume’s LDEVs all of the time.
Array GroupArray GroupArray Group
LUSE
Array Group
LDEV4LDEV3LDEV2LDEV1
Concatenated LDEVs
LUN
Figure 5. LUSE volume.
Hitachi Data Systems Confidential For Internal Use and Distribution to Authorized Parties Only
- 7 -
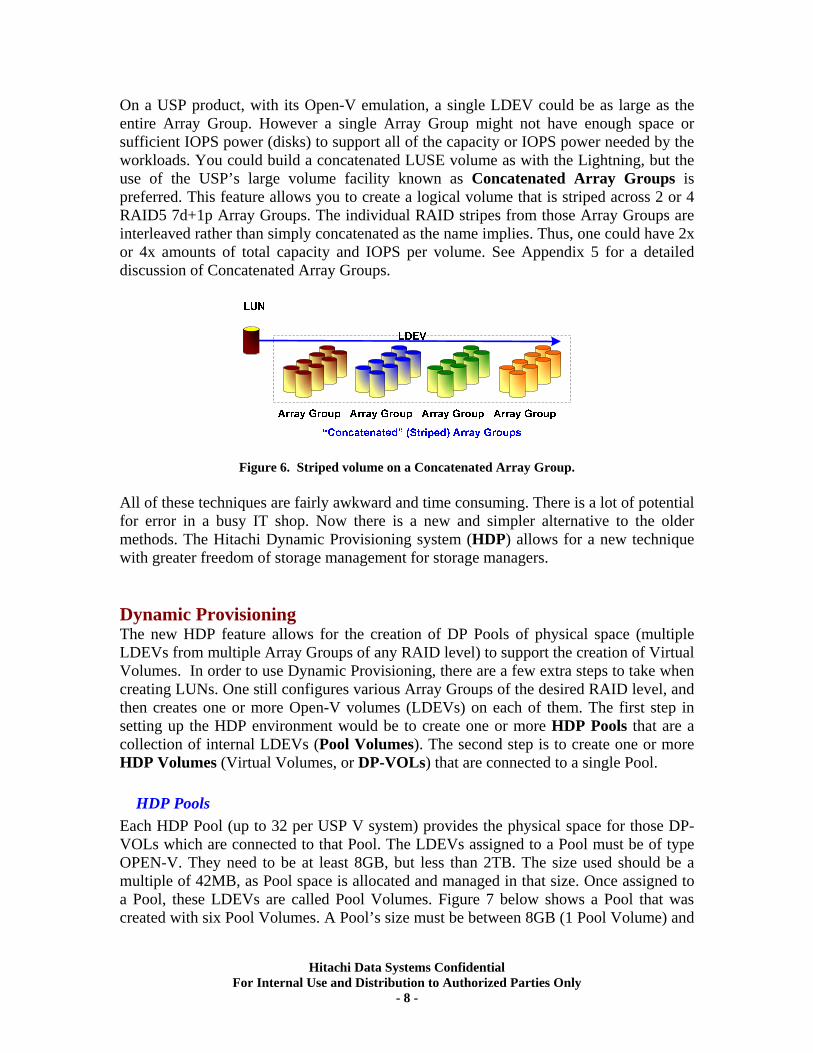
On a USP product, with its Open-V emulation, a single LDEV could be as large as the entire Array Group. However a single Array Group might not have enough space or sufficient IOPS power (disks) to support all of the capacity or IOPS power needed by the workloads. You could build a concatenated LUSE volume as with the Lightning, but the use of the USP’s large volume facility known as Concatenated Array Groups is preferred. This feature allows you to create a logical volume that is striped across 2 or 4 RAID5 7d+1p Array Groups. The individual RAID stripes from those Array Groups are interleaved rather than simply concatenated as the name implies. Thus, one could have 2x or 4x amounts of total capacity and IOPS per volume. See Appendix 5 for a detailed discussion of Concatenated Array Groups.
Figure 6. Striped volume on a Concatenated Array Group. All of these techniques are fairly awkward and time consuming. There is a lot of potential for error in a busy IT shop. Now there is a new and simpler alternative to the older methods. The Hitachi Dynamic Provisioning system (HDP) allows for a new technique with greater freedom of storage management for storage managers. Dynamic Provisioning The new HDP feature allows for the creation of DP Pools of physical space (multiple LDEVs from multiple Array Groups of any RAID level) to support the creation of Virtual Volumes. In order to use Dynamic Provisioning, there are a few extra steps to take when creating LUNs. One still configures various Array Groups of the desired RAID level, and then creates one or more Open-V volumes (LDEVs) on each of them. The first step in setting up the HDP environment would be to create one or more HDP Pools that are a collection of internal LDEVs (Pool Volumes). The second step is to create one or more HDP Volumes (Virtual Volumes, or DP-VOLs) that are connected to a single Pool.
HDP Pools Each HDP Pool (up to 32 per USP V system) provides the physical space for those DP-VOLs which are connected to that Pool. The LDEVs assigned to a Pool must be of type OPEN-V. They need to be at least 8GB, but less than 2TB. The size used should be a multiple of 42MB, as Pool space is allocated and managed in that size. Once assigned to a Pool, these LDEVs are called Pool Volumes. Figure 7 below shows a Pool that was created with six Pool Volumes. A Pool’s size must be between 8GB (1 Pool Volume) and
Hitachi Data Systems Confidential For Internal Use and Distribution to Authorized Parties Only
- 8 -
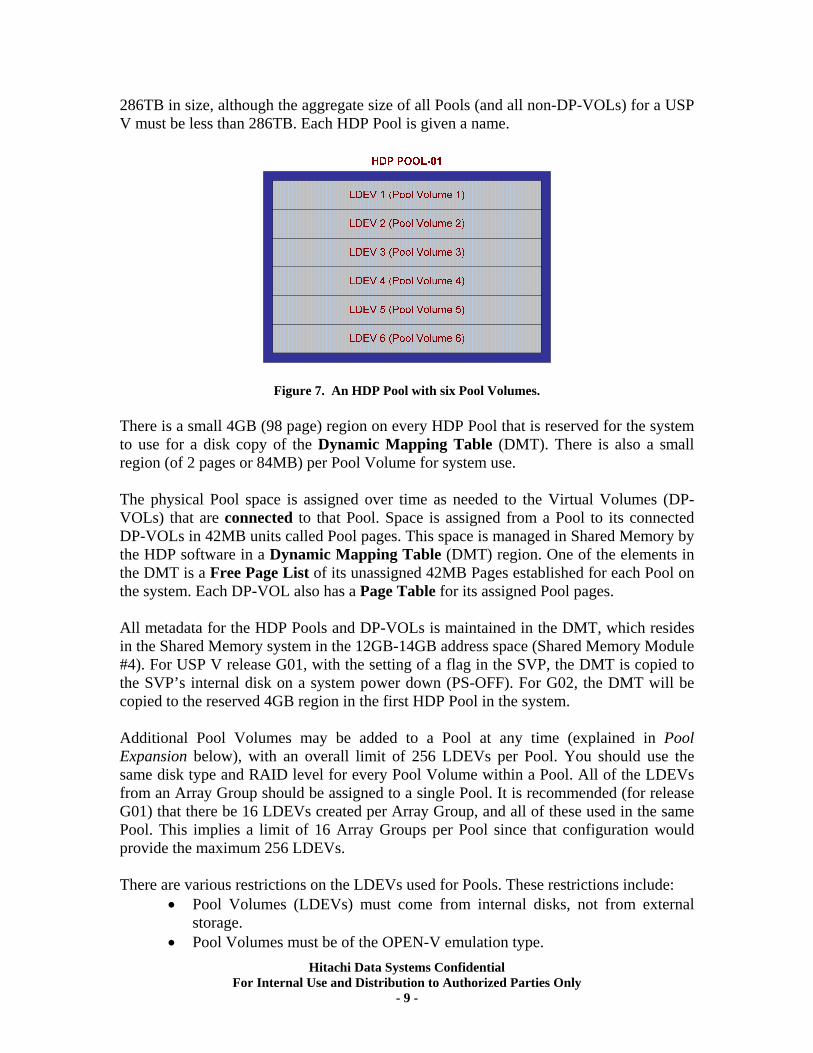
286TB in size, although the aggregate size of all Pools (and all non-DP-VOLs) for a USP V must be less than 286TB. Each HDP Pool is given a name.
Figure 7. An HDP Pool with six Pool Volumes. There is a small 4GB (98 page) region on every HDP Pool that is reserved for the system to use for a disk copy of the Dynamic Mapping Table (DMT). There is also a small region (of 2 pages or 84MB) per Pool Volume for system use. The physical Pool space is assigned over time as needed to the Virtual Volumes (DP-VOLs) that are connected to that Pool. Space is assigned from a Pool to its connected DP-VOLs in 42MB units called Pool pages. This space is managed in Shared Memory by the HDP software in a Dynamic Mapping Table (DMT) region. One of the elements in the DMT is a Free Page List of its unassigned 42MB Pages established for each Pool on the system. Each DP-VOL also has a Page Table for its assigned Pool pages. All metadata for the HDP Pools and DP-VOLs is maintained in the DMT, which resides in the Shared Memory system in the 12GB-14GB address space (Shared Memory Module #4). For USP V release G01, with the setting of a flag in the SVP, the DMT is copied to the SVP’s internal disk on a system power down (PS-OFF). For G02, the DMT will be copied to the reserved 4GB region in the first HDP Pool in the system. Additional Pool Volumes may be added to a Pool at any time (explained in Pool Expansion below), with an overall limit of 256 LDEVs per Pool. You should use the same disk type and RAID level for every Pool Volume within a Pool. All of the LDEVs from an Array Group should be assigned to a single Pool. It is recommended (for release G01) that there be 16 LDEVs created per Array Group, and all of these used in the same Pool. This implies a limit of 16 Array Groups per Pool since that configuration would provide the maximum 256 LDEVs.
There are various restrictions on the LDEVs used for Pools. These restrictions include:
• Pool Volumes (LDEVs) must come from internal disks, not from external storage.
• Pool Volumes must be of the OPEN-V emulation type. Hitachi Data Systems Confidential
For Internal Use and Distribution to Authorized Parties Only - 9 -
• You cannot remove a Pool Volume from an HDP Pool without deleting the entire Pool (first disconnecting all of its DP-VOLs volumes) from the USP V system.
• An LDEV may not be uninstalled from the system if it is a Pool Volume. In order to do so, all of the assigned DP-VOLs must be formatted and disconnected from that Pool and then the Pool must be deleted.
• Each LDEV must be RAID formatted (scrubbed) before being assigned to a Pool (you don’t format a Pool).
• A LUSE volume can not be used as a Pool Volume. • All Array Groups that are members of a Pool must be assigned to the same
cache partition (CLPR). Hence, all associated DP-VOLs will also be assigned to the same VPM cache partition. However, the Array Groups for other Pools may be assigned to different cache partitions.
• There can be a maximum of 256 Pool Volumes assigned to an HDP Pool.
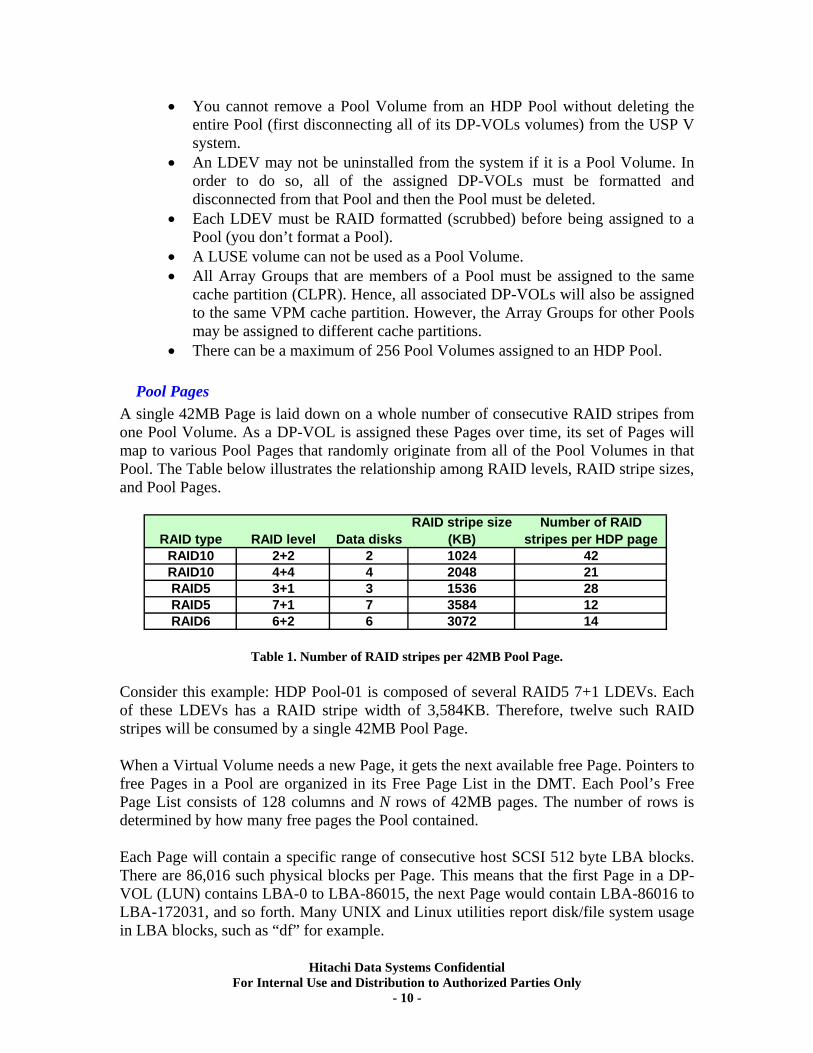
Pool Pages A single 42MB Page is laid down on a whole number of consecutive RAID stripes from one Pool Volume. As a DP-VOL is assigned these Pages over time, its set of Pages will map to various Pool Pages that randomly originate from all of the Pool Volumes in that Pool. The Table below illustrates the relationship among RAID levels, RAID stripe sizes, and Pool Pages.
RAID type RAID level Data disksRAID stripe size
(KB)Number of RAID
stripes per HDP pageRAID10 2+2 2 1024 42RAID10 4+4 4 2048 21RAID5 3+1 3 1536 28RAID5 7+1 7 3584 12RAID6 6+2 6 3072 14
Table 1. Number of RAID stripes per 42MB Pool Page.
Consider this example: HDP Pool-01 is composed of several RAID5 7+1 LDEVs. Each of these LDEVs has a RAID stripe width of 3,584KB. Therefore, twelve such RAID stripes will be consumed by a single 42MB Pool Page. When a Virtual Volume needs a new Page, it gets the next available free Page. Pointers to free Pages in a Pool are organized in its Free Page List in the DMT. Each Pool’s Free Page List consists of 128 columns and N rows of 42MB pages. The number of rows is determined by how many free pages the Pool contained. Each Page will contain a specific range of consecutive host SCSI 512 byte LBA blocks. There are 86,016 such physical blocks per Page. This means that the first Page in a DP-VOL (LUN) contains LBA-0 to LBA-86015, the next Page would contain LBA-86016 to LBA-172031, and so forth. Many UNIX and Linux utilities report disk/file system usage in LBA blocks, such as “df” for example.
Hitachi Data Systems Confidential For Internal Use and Distribution to Authorized Parties Only
- 10 -
If a DP-VOL is used for a file system, and the file system block size is 8KB, then there will be 5,376 such file system blocks per Page (each consuming 16 LBA blocks). The first time one of the blocks mapped to a Page is written to, the following sequence occurs: a Page will be removed from the Free Page List, that Page will be mapped in to that DP-VOLs Page Table, and then the block(s) will be written. Note that, for this example, the application must write new blocks using a stride of at least 5,376 blocks in
rder to rapidly generate new Page assignment requests.
down through LDEV02 to LDEV06. This initial organization is own in Figure 8.
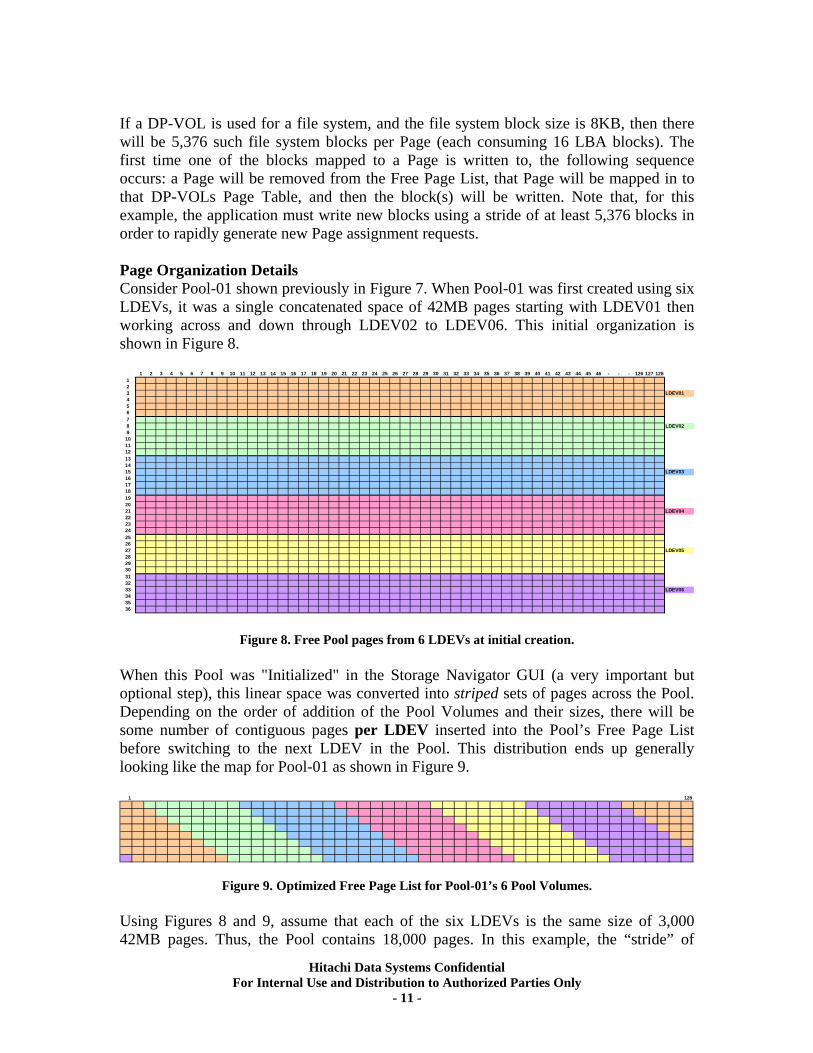
o Page Organization Details Consider Pool-01 shown previously in Figure 7. When Pool-01 was first created using six LDEVs, it was a single concatenated space of 42MB pages starting with LDEV01 then working across andsh
1 2 3 4 5 6 7 8 9 10 11 12 13 14 15 16 17 18 19 20 21 22 23 24 25 26 27 28 29 30 31 32 33 34 35 36 37 38 39 40 41 42 43 44 45 46 - - - 126 127 128123 LDEV0145678 LDEV029101112131415 LDEV03161718192021 LDEV04222324252627 LDEV05282930313233 LDEV06343536
Figure 8. Free Pool pages from 6 LDEVs at initial creation.
distribution ends up generally oking like the map for Pool-01 as shown in Figure 9.
When this Pool was "Initialized" in the Storage Navigator GUI (a very important but optional step), this linear space was converted into striped sets of pages across the Pool. Depending on the order of addition of the Pool Volumes and their sizes, there will be some number of contiguous pages per LDEV inserted into the Pool’s Free Page List before switching to the next LDEV in the Pool. Thislo
1 128
Figure 9. Optimized Free Page List for Pool-01’s 6 Pool Volumes. Using Figures 8 and 9, assume that each of the six LDEVs is the same size of 3,000 42MB pages. Thus, the Pool contains 18,000 pages. In this example, the “stride” of
Hitachi Data Systems Confidential For Internal Use and Distribution to Authorized Parties Only
- 11 -
consecutive pages per LDEV could be 128 * (LDEV pages / Pool Pages), or 128 * (3000/18,000) = 21 pages (whole number only) per LDEV. In other words, the Free Page List will begin with a few pages from LDEV01, then 21 pages from LDEV02 and so forth back to LDEV01 until each row of 128 Page columns is complete. This pattern repeats by finishing the previous 21 page sequence where it left off in the previous row, then continues the full 21 page mapping sequence with the next LDEV. The result is a “slanted” striping effect across the Pool Volumes. The number of initial pages mapped at the very beginning (automatically chosen by the HDP software) determines the degree of slant. Pool Pages will be sequentially removed from the Free Page List and be assigned to
e next DP-VOL as needed.
3,000 pages each providing 36,000 Pool Pages, the stride would be 10 ages per LDEV.
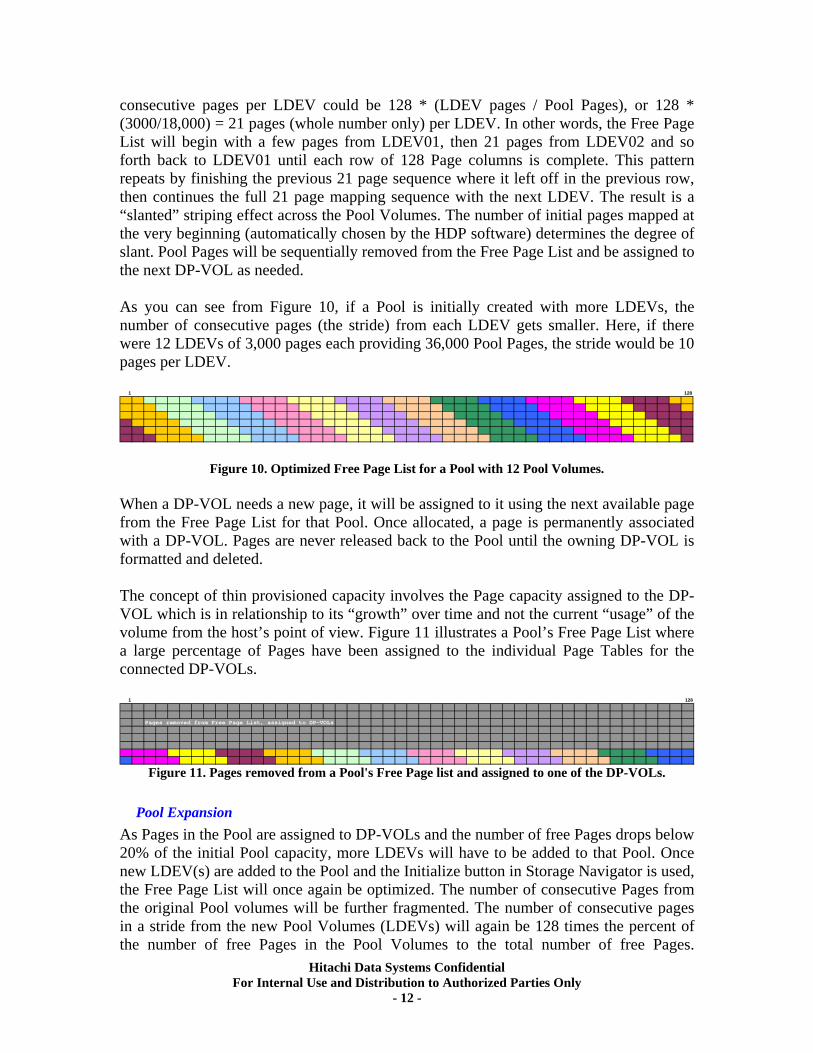
th As you can see from Figure 10, if a Pool is initially created with more LDEVs, the number of consecutive pages (the stride) from each LDEV gets smaller. Here, if there were 12 LDEVs ofp
1 128
Figure 10. Optimized Free Page List for a Pool with 12 Pool Volumes.
are never released back to the Pool until the owning DP-VOL is rmatted and deleted.
Pages have been assigned to the individual Page Tables for the onnected DP-VOLs.
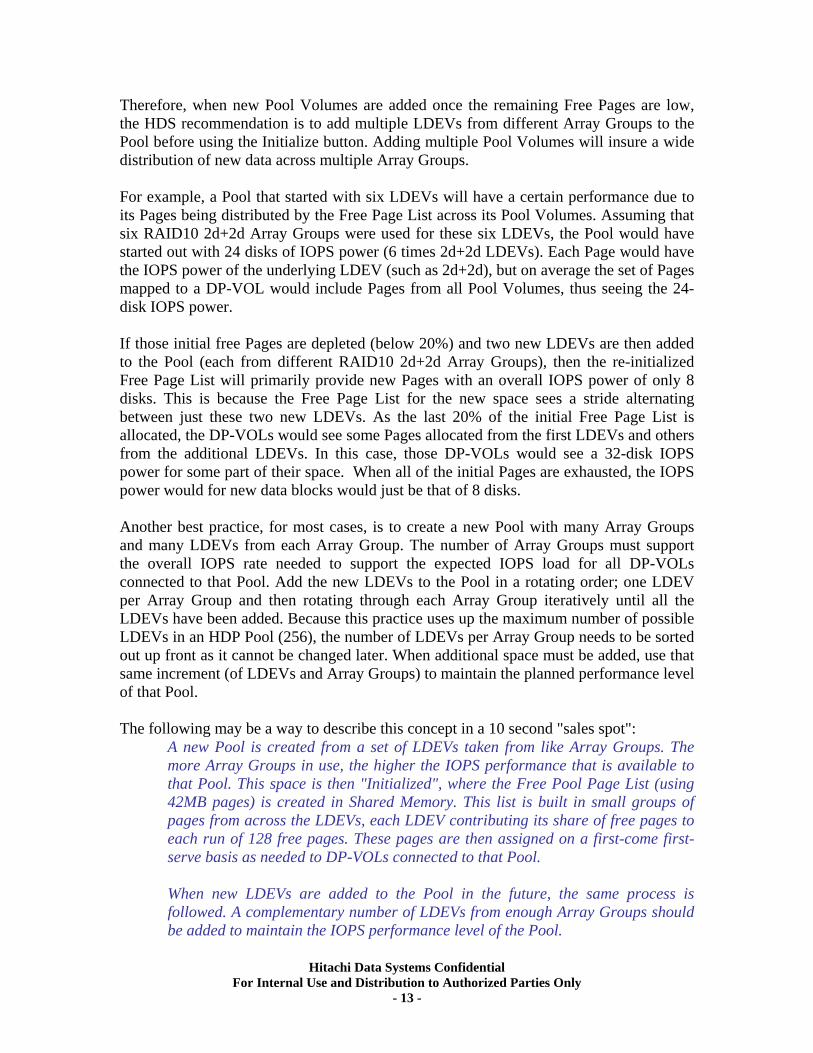
When a DP-VOL needs a new page, it will be assigned to it using the next available page from the Free Page List for that Pool. Once allocated, a page is permanently associated with a DP-VOL. Pages fo The concept of thin provisioned capacity involves the Page capacity assigned to the DP-VOL which is in relationship to its “growth” over time and not the current “usage” of the volume from the host’s point of view. Figure 11 illustrates a Pool’s Free Page List where a large percentage of c
1 128
Pages removed from Free Page List, assigned to DP-VOLs
Figure 11. Pages removed from a Pool's Free Page list and assigned to one of the DP-VOLs.
Pool Expansion
As Pages in the Pool are assigned to DP-VOLs and the number of free Pages drops below 20% of the initial Pool capacity, more LDEVs will have to be added to that Pool. Once new LDEV(s) are added to the Pool and the Initialize button in Storage Navigator is used, the Free Page List will once again be optimized. The number of consecutive Pages from the original Pool volumes will be further fragmented. The number of consecutive pages in a stride from the new Pool Volumes (LDEVs) will again be 128 times the percent of the number of free Pages in the Pool Volumes to the total number of free Pages.
Hitachi Data Systems Confidential For Internal Use and Distribution to Authorized Parties Only
- 12 -
Therefore, when new Pool Volumes are added once the remaining Free Pages are low, the HDS recommendation is to add multiple LDEVs from different Array Groups to the Pool before using the Initialize button. Adding multiple Pool Volumes will insure a wide istribution of new data across multiple Array Groups.
OL would include Pages from all Pool Volumes, thus seeing the 24-isk IOPS power.
s are exhausted, the IOPS wer would for new data blocks would just be that of 8 disks.
maintain the planned performance level that Pool.
The fol
on a first-come first-rve basis as needed to DP-VOLs connected to that Pool.
ray Groups should be added to maintain the IOPS performance level of the Pool.
d For example, a Pool that started with six LDEVs will have a certain performance due to its Pages being distributed by the Free Page List across its Pool Volumes. Assuming that six RAID10 2d+2d Array Groups were used for these six LDEVs, the Pool would have started out with 24 disks of IOPS power (6 times 2d+2d LDEVs). Each Page would have the IOPS power of the underlying LDEV (such as 2d+2d), but on average the set of Pages mapped to a DP-Vd If those initial free Pages are depleted (below 20%) and two new LDEVs are then added to the Pool (each from different RAID10 2d+2d Array Groups), then the re-initialized Free Page List will primarily provide new Pages with an overall IOPS power of only 8 disks. This is because the Free Page List for the new space sees a stride alternating between just these two new LDEVs. As the last 20% of the initial Free Page List is allocated, the DP-VOLs would see some Pages allocated from the first LDEVs and others from the additional LDEVs. In this case, those DP-VOLs would see a 32-disk IOPS power for some part of their space. When all of the initial Pagepo Another best practice, for most cases, is to create a new Pool with many Array Groups and many LDEVs from each Array Group. The number of Array Groups must support the overall IOPS rate needed to support the expected IOPS load for all DP-VOLs connected to that Pool. Add the new LDEVs to the Pool in a rotating order; one LDEV per Array Group and then rotating through each Array Group iteratively until all the LDEVs have been added. Because this practice uses up the maximum number of possible LDEVs in an HDP Pool (256), the number of LDEVs per Array Group needs to be sorted out up front as it cannot be changed later. When additional space must be added, use that same increment (of LDEVs and Array Groups) toof
lowing may be a way to describe this concept in a 10 second "sales spot": A new Pool is created from a set of LDEVs taken from like Array Groups. The more Array Groups in use, the higher the IOPS performance that is available to that Pool. This space is then "Initialized", where the Free Pool Page List (using 42MB pages) is created in Shared Memory. This list is built in small groups of pages from across the LDEVs, each LDEV contributing its share of free pages to each run of 128 free pages. These pages are then assignedse When new LDEVs are added to the Pool in the future, the same process is followed. A complementary number of LDEVs from enough Ar
Hitachi Data Systems Confidential For Internal Use and Distribution to Authorized Parties Only
- 13 -
an HDP Pool, in number of Pages, can be calculated using the following pro u
1.
ages in the volume.
for system management purposes. s in Pool:
= (Σ PVPagesn) – 98
o be the “first” Pool. The Backup function is not enabled in G01 support.
a between the arrows after the
decimal point (round down to nearest integer).
zes should be a multiple of 42MB in order to reduce small amounts of wasted space.
ecome Pool volumes. Multiple Array Groups
ups should complement the anticipated IO load to
a Page was selected to evenly map to all RAID types (refer back to Table 1).
Pool Sizes The size of
ced re. Number of Pages in a Pool Volume: PVPages = (↓ (↓number of 512 byte blocks in pool-VOL ÷ 512↓) / 168↓) - 2 By dividing the volume’s number of 512 byte blocks by 512, then truncating thisvalue to be an integer, you get the number of 256KB units in the volume. Whendividing this result by 168, you get the number of 42MB pYou then subtract “2” for the Pool volume’s system area. Note: There are 2 Pages per Volume used
2. Total Number of Usable PageTtlPagesNotes:
• There are 98 Pages (4GB) reserved from each Pool for HDP Shared Memory backup purposes. The HDP’s Shared Memory DMT backup at power down is not done to each Pool but only to the Pool considered t
Note: ↓ means: truncate the result of the formul
All of the capacity in the Pool is managed as 42MB Page units. This includes the HDP Shared Memory DMT backup and system management areas. Individual Pool volume si Additional recommendations:
• All space in an Array Group should be allocated to LDEVs (16 currently recommended) which will bshould be defined to a Pool.
• The number of Array Grothe associated DP-VOLs.
• The RAID level should be the same for all Pool Volumes in a Pool. The RAID level should be consistent with the write performance level desired for the DP-VOLs associated with the Pool. The RAID Level does not influence the sizing calculation (above) since the size of
Hitachi Data Systems Confidential For Internal Use and Distribution to Authorized Parties Only
- 14 -
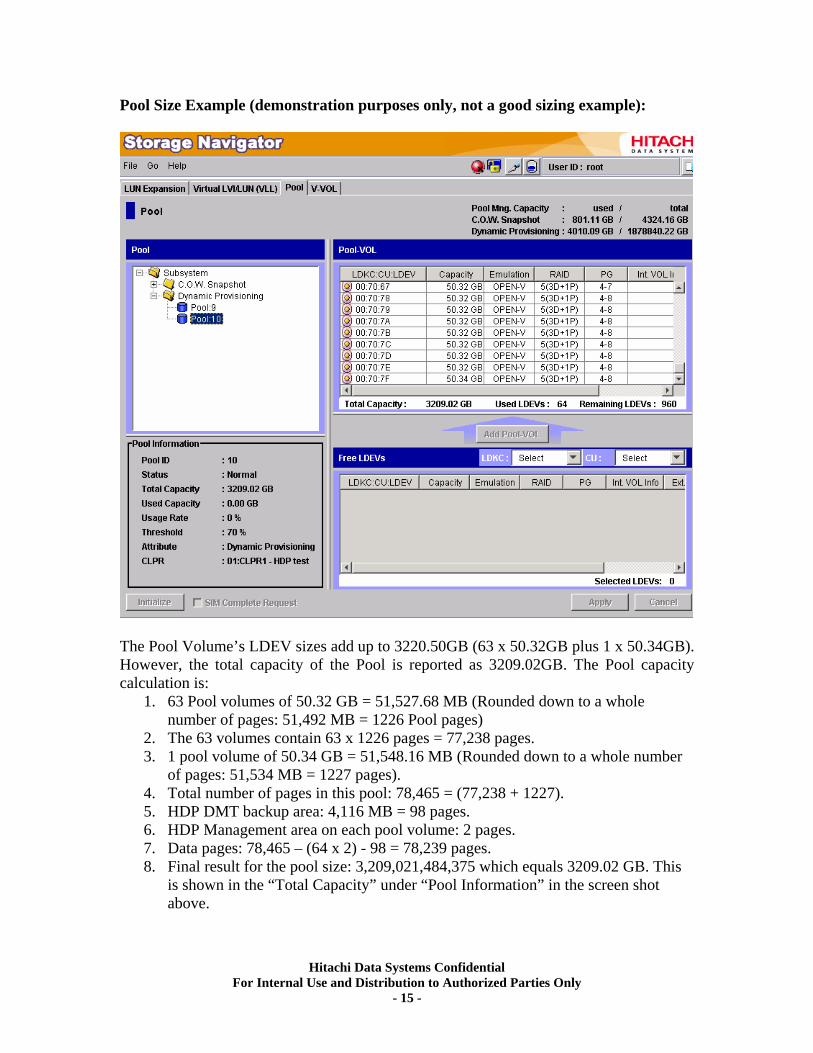
Pool Size Example (demonstration purposes only, not a good sizing example):
The Pool Volume’s LDEV sizes add up to 3220.50GB (63 x 50.32GB plus 1 x 50.34GB). However, the total capacity of the Pool is reported as 3209.02GB. The Pool capacity calculation is:
1. 63 Pool volumes of 50.32 GB = 51,527.68 MB (Rounded down to a whole number of pages: 51,492 MB = 1226 Pool pages)
2. The 63 volumes contain 63 x 1226 pages = 77,238 pages. 3. 1 pool volume of 50.34 GB = 51,548.16 MB (Rounded down to a whole number
of pages: 51,534 MB = 1227 pages). 4. Total number of pages in this pool: 78,465 = (77,238 + 1227). 5. HDP DMT backup area: 4,116 MB = 98 pages. 6. HDP Management area on each pool volume: 2 pages. 7. Data pages: 78,465 – (64 x 2) - 98 = 78,239 pages. 8. Final result for the pool size: 3,209,021,484,375 which equals 3209.02 GB. This
is shown in the “Total Capacity” under “Pool Information” in the screen shot above.
Hitachi Data Systems Confidential For Internal Use and Distribution to Authorized Parties Only
- 15 -
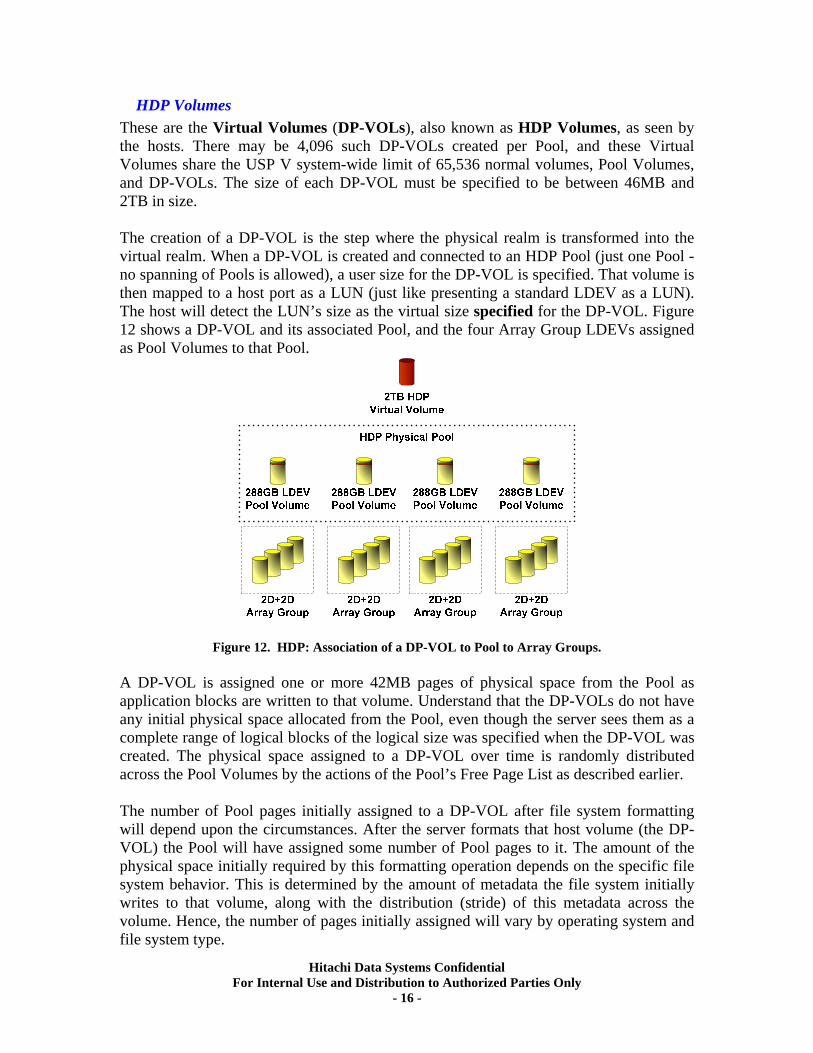
HDP Volumes These are the Virtual Volumes (DP-VOLs), also known as HDP Volumes, as seen by the hosts. There may be 4,096 such DP-VOLs created per Pool, and these Virtual Volumes share the USP V system-wide limit of 65,536 normal volumes, Pool Volumes, and DP-VOLs. The size of each DP-VOL must be specified to be between 46MB and 2TB in size. The creation of a DP-VOL is the step where the physical realm is transformed into the virtual realm. When a DP-VOL is created and connected to an HDP Pool (just one Pool - no spanning of Pools is allowed), a user size for the DP-VOL is specified. That volume is then mapped to a host port as a LUN (just like presenting a standard LDEV as a LUN). The host will detect the LUN’s size as the virtual size specified for the DP-VOL. Figure 12 shows a DP-VOL and its associated Pool, and the four Array Group LDEVs assigned as Pool Volumes to that Pool.
Figure 12. HDP: Association of a DP-VOL to Pool to Array Groups. A DP-VOL is assigned one or more 42MB pages of physical space from the Pool as application blocks are written to that volume. Understand that the DP-VOLs do not have any initial physical space allocated from the Pool, even though the server sees them as a complete range of logical blocks of the logical size was specified when the DP-VOL was created. The physical space assigned to a DP-VOL over time is randomly distributed across the Pool Volumes by the actions of the Pool’s Free Page List as described earlier. The number of Pool pages initially assigned to a DP-VOL after file system formatting will depend upon the circumstances. After the server formats that host volume (the DP-VOL) the Pool will have assigned some number of Pool pages to it. The amount of the physical space initially required by this formatting operation depends on the specific file system behavior. This is determined by the amount of metadata the file system initially writes to that volume, along with the distribution (stride) of this metadata across the volume. Hence, the number of pages initially assigned will vary by operating system and file system type.
Hitachi Data Systems Confidential For Internal Use and Distribution to Authorized Parties Only
- 16 -
A Page assigned to a DP-VOL maps into that volume’s Page Table, which is a table of pointers. These pointers are used to map between the host’s virtual LBA references and the actual blocks within assigned Pages. Each Page will contain a specific range of consecutive host LBA blocks. The Page Table presents a contiguous space of 42MB segments to the volume that start at beginning of the DP-VOL (byte 0). A DP-VOL whose size is not a whole number of 42MB Pages can acquire a Page that will be only partially used at the highest address range for that DP-VOL. There will normally be several DP-VOLs connected to a single HDP Pool. As each DP-VOL begins receiving writes from the servers, the physical Pool assignments to the DP-VOLs will grow. As these DP-VOLs consume Pool Pages over time, the Pool’s Free Space Threshold can be reached and the storage administrator will receive an alert telling him to add additional Pool Volumes to that Pool. The amount of physical space a DP-VOL can acquire over time will be limited by the DP-VOL size (up to 2TB) when it was defined. The sum of all the virtual sizes of those DP-VOLs connected to a Pool, rounded up to an integral number of Pages, will be the maximum physical Pool size required over time. There are various restrictions on DP-VOLs. These restrictions include:
1. A DP-VOL may only be associated with one Pool. 2. A DP-VOL must be formatted before being deleted. This clears stale data from
the Pages before they are released back to the Page Free List. Pages are only released from a DP-VOL when the association to the HDP Pool is deleted.
3. DP-VOLs must be OPEN-V emulation. Mainframe emulations are not supported. 4. There can be 4,096 DP-VOLs assigned to an HDP Pool. 5. A DP-VOL can range from 46MB to 2TB in size.
Miscellaneous Details
The configuration of HDP Pools and Volumes is done via Storage Navigator. This is also how the physical space usage per Pool is monitored. There are two Pool Free Space thresholds: a user specified threshold between 5%-95% plus the fixed threshold at 80%. Both of these thresholds are used as the triggers for the low Pool space notifications. If more than 2TB of space is required for a single host volume, then multiple DP-VOLs may be used in the ordinary fashion by a volume manager on the server to create a single large striped Logical Volume. Note that if these DP-VOLs come from different Pools, then the active disk count will increase as well as the space. If the DP-VOLs are all from the same Pool, then only the usable capacity will increase. If a host read is posted to an area of the DP-VOL that does not yet have physical space (no blocks have been written there yet), the HDP Dynamic Mapping Table will direct the read to a special “Null Page”. New Pool pages to cover that region will not be allocated from the Free Page List since it was a Read. If a Write is posted to an area of the DP-VOL which does not yet have physical space, and the Pool has completely run out of space, the host will get a “Write Protect” error. During the “out of space” condition, all
Hitachi Data Systems Confidential For Internal Use and Distribution to Authorized Parties Only
- 17 -
Read operations specifying an area of a DP-VOL without an assigned Page will now return an “Illegal Request” error rather than the “Null Page”. These error conditions will be cleared once additional physical Pool Volume space has been added to that Pool or some DP-VOLs are formatted and disconnected from the Pool, thereby freeing up some Pages. The use of HDP may cause up to a 20% increase in port processor (MP) overhead for reads or writes to the DP-VOL area with physical pages allocated from the Pool. When a Write to a DP-VOL causes a physical Page allocation from the Pool, there may be up to an 80% overhead factor for the host port processor for that one operation.
HDP and Program Products Compatibility A DP-VOL (DP-VOL) cannot be used with the TrueCopy, TrueCopy Asynchronous, Universal Replicator, Copy-on-Write Snapshot, Flash Access, LUSE or Volume Migration products. DP-VOLs do work with Shadow Image, LUN Security, CVS, Server Priority Manager, Data Retention, and Virtual Partition Manager.
Hitachi Data Systems Confidential For Internal Use and Distribution to Authorized Parties Only
- 18 -
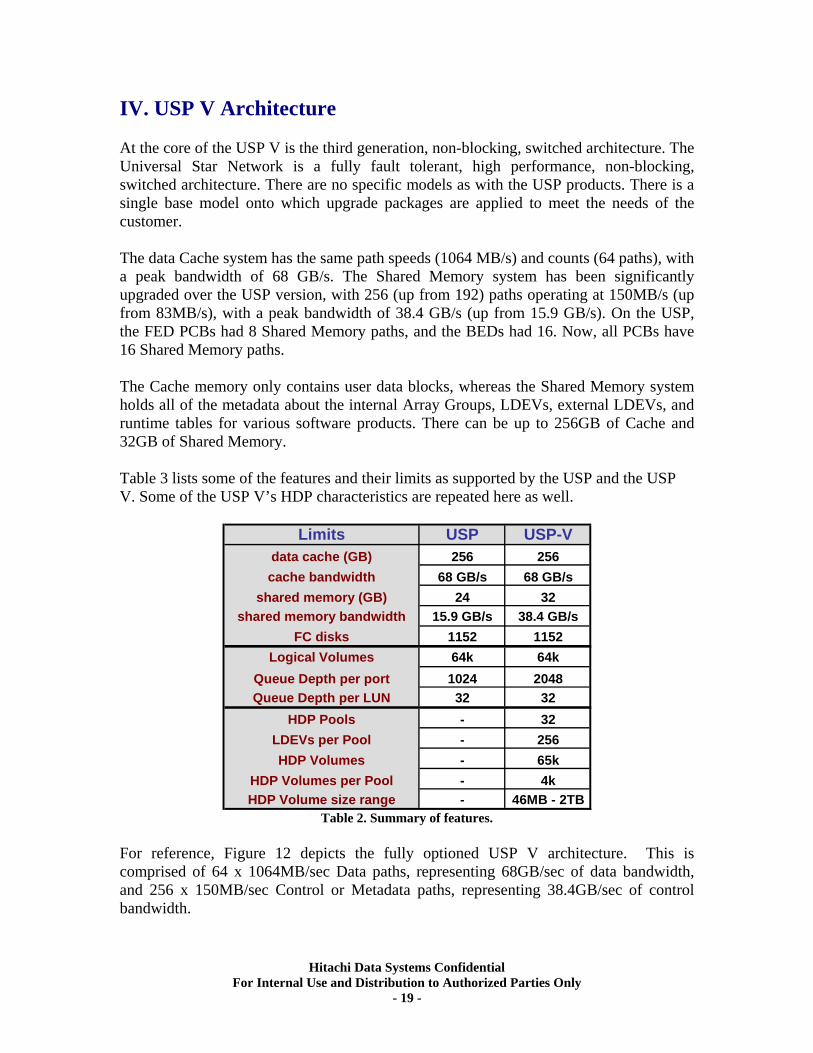
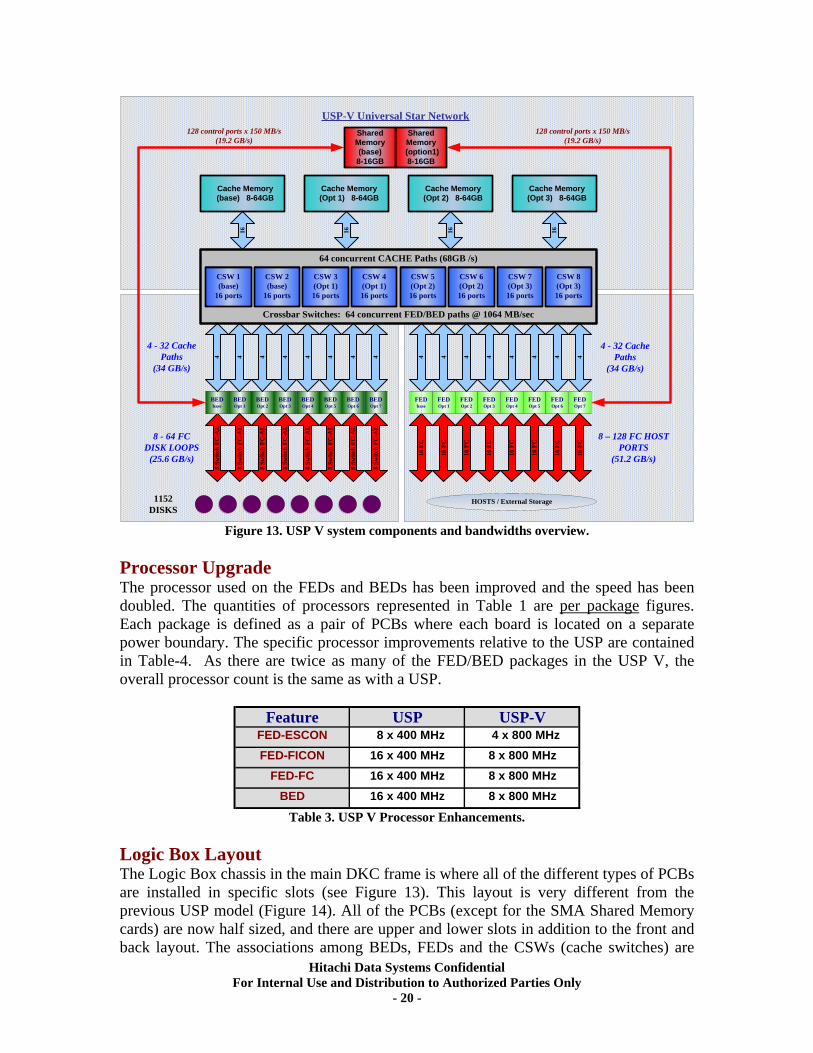
IV. USP V Architecture At the core of the USP V is the third generation, non-blocking, switched architecture. The Universal Star Network is a fully fault tolerant, high performance, non-blocking, switched architecture. There are no specific models as with the USP products. There is a single base model onto which upgrade packages are applied to meet the needs of the customer. The data Cache system has the same path speeds (1064 MB/s) and counts (64 paths), with a peak bandwidth of 68 GB/s. The Shared Memory system has been significantly upgraded over the USP version, with 256 (up from 192) paths operating at 150MB/s (up from 83MB/s), with a peak bandwidth of 38.4 GB/s (up from 15.9 GB/s). On the USP, the FED PCBs had 8 Shared Memory paths, and the BEDs had 16. Now, all PCBs have 16 Shared Memory paths. The Cache memory only contains user data blocks, whereas the Shared Memory system holds all of the metadata about the internal Array Groups, LDEVs, external LDEVs, and runtime tables for various software products. There can be up to 256GB of Cache and 32GB of Shared Memory. Table 3 lists some of the features and their limits as supported by the USP and the USP V. Some of the USP V’s HDP characteristics are repeated here as well.
Limits USP USP-Vdata cache (GB)cache bandwidth
shared memory (GB)shared memory bandwidth
FC disksLogical Volumes
Queue Depth per portQueue Depth per LUN
HDP PoolsLDEVs per PoolHDP Volumes
HDP Volumes per PoolHDP Volume size range
256 25668 GB/s 68 GB/s
24 3215.9 GB/s 38.4 GB/s
1152 115264k 64k1024 2048
32 32- 32- 256- 65k- 4k- 46MB - 2TB
Table 2. Summary of features. For reference, Figure 12 depicts the fully optioned USP V architecture. This is comprised of 64 x 1064MB/sec Data paths, representing 68GB/sec of data bandwidth, and 256 x 150MB/sec Control or Metadata paths, representing 38.4GB/sec of control bandwidth.
Hitachi Data Systems Confidential For Internal Use and Distribution to Authorized Parties Only
- 19 -
4
8 Sw
itch
FC-A
L
16 F
C
HOSTS / External Storage
USP-V Universal Star Network
1152 DISKS
128 control ports x 150 MB/s(19.2 GB/s)
128 control ports x 150 MB/s(19.2 GB/s)
Shared Memory(base) 8-16GB
Shared Memory
(option1) 8-16GB
8 - 64 FCDISK LOOPS
(25.6 GB/s)
8 – 128 FC HOST PORTS
(51.2 GB/s)
4 - 32 Cache Paths
(34 GB/s)
4 - 32 Cache Paths
(34 GB/s)
16
Cache Memory (base) 8-64GB
16
Cache Memory (Opt 1) 8-64GB
16
Cache Memory (Opt 2) 8-64GB
Cache Memory (Opt 3) 8-64GB
16
FEDOpt 1
FEDOpt 2
FEDOpt 3
FEDOpt 4
FEDOpt 5
FEDOpt 6
FEDOpt 7
16 F
C
16 F
C
16 F
C
16 F
C
16 F
C
16 F
C
16 F
C
4 4 4 4 4 4 4
FEDbase
BEDbase
BEDOpt 1
BEDOpt 2
BEDOpt 3
BEDOpt 4
BEDOpt 5
BEDOpt 6
BEDOpt 7
8 Sw
itch
FC-A
L
8 Sw
itch
FC-A
L
8 Sw
itch
FC-A
L
8 Sw
itch
FC-A
L
8 Sw
itch
FC-A
L
8 Sw
itch
FC-A
L
8 Sw
itch
FC-A
L
4 4 4 4 4 4 4 4
CSW 1 (base)
16 ports
CSW 2 (base)
16 ports
CSW 3 (Opt 1)16 ports
CSW 4 (Opt 1)16 ports
CSW 5 (Opt 2)16 ports
CSW 6 (Opt 2)16 ports
CSW 7 (Opt 3)16 ports
64 concurrent CACHE Paths (68GB /s)
Crossbar Switches: 64 concurrent FED/BED paths @ 1064 MB/sec
CSW 8 (Opt 3)16 ports
Figure 13. USP V system components and bandwidths overview.
Processor Upgrade The processor used on the FEDs and BEDs has been improved and the speed has been doubled. The quantities of processors represented in Table 1 are per package figures. Each package is defined as a pair of PCBs where each board is located on a separate power boundary. The specific processor improvements relative to the USP are contained in Table-4. As there are twice as many of the FED/BED packages in the USP V, the overall processor count is the same as with a USP.
Feature USP USP-VFED-ESCONFED-FICON
FED-FCBED
8 x 400 MHz 4 x 800 MHz16 x 400 MHz 8 x 800 MHz16 x 400 MHz 8 x 800 MHz16 x 400 MHz 8 x 800 MHz
Table 3. USP V Processor Enhancements. Logic Box Layout The Logic Box chassis in the main DKC frame is where all of the different types of PCBs are installed in specific slots (see Figure 13). This layout is very different from the previous USP model (Figure 14). All of the PCBs (except for the SMA Shared Memory cards) are now half sized, and there are upper and lower slots in addition to the front and back layout. The associations among BEDs, FEDs and the CSWs (cache switches) are
Hitachi Data Systems Confidential For Internal Use and Distribution to Authorized Parties Only
- 20 -
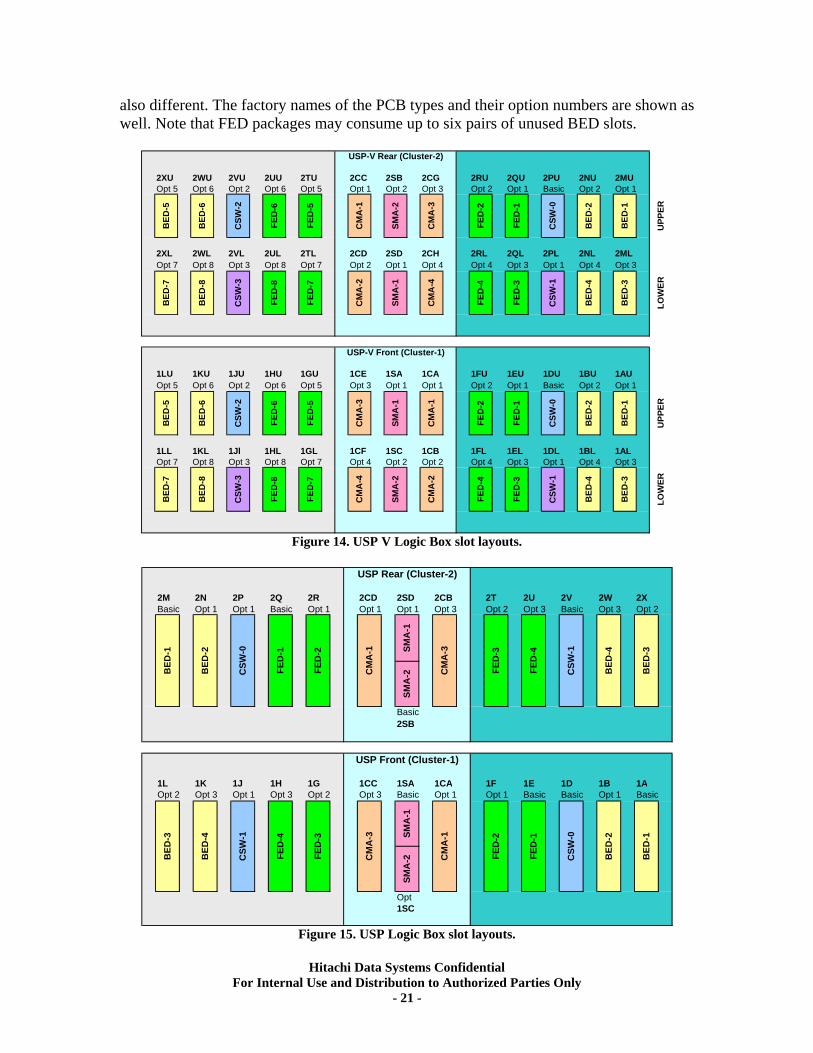
also different. The factory names of the PCB types and their option numbers are shown as well. Note that FED packages may consume up to six pairs of unused BED slots.
2XU 2WU 2VU 2UU 2TU 2CC 2SB 2CG 2RU 2QU 2PU 2NU 2MUOpt 5 Opt 6 Opt 2 Opt 6 Opt 5 Opt 1 Opt 2 Opt 3 Opt 2 Opt 1 Basic Opt 2 Opt 1
2XL 2WL 2VL 2UL 2TL 2CD 2SD 2CH 2RL 2QL 2PL 2NL 2MLOpt 7 Opt 8 Opt 3 Opt 8 Opt 7 Opt 2 Opt 1 Opt 4 Opt 4 Opt 3 Opt 1 Opt 4 Opt 3
1LU 1KU 1JU 1HU 1GU 1CE 1SA 1CA 1FU 1EU 1DU 1BU 1AUOpt 5 Opt 6 Opt 2 Opt 6 Opt 5 Opt 3 Opt 1 Opt 1 Opt 2 Opt 1 Basic Opt 2 Opt 1
1LL 1KL 1Jl 1HL 1GL 1CF 1SC 1CB 1FL 1EL 1DL 1BL 1ALOpt 7 Opt 8 Opt 3 Opt 8 Opt 7 Opt 4 Opt 2 Opt 2 Opt 4 Opt 3 Opt 1 Opt 4 Opt 3
LOW
ER
USP-V Rear (Cluster-2)
USP-V Front (Cluster-1)
UPP
ERU
PPER
LOW
ER
BED
-1B
ED-1
FED
-4
FED
-3
CSW
-1
BED
-3
FED
-2
FED
-1
CSW
-0
BED
-2
FED
-4
FED
-3
CSW
-1
BED
-4B
ED-4
BED
-3
FED
-2
FED
-1
CSW
-0
BED
-2
CM
A-3
SMA
-1
CM
A-1
CM
A-4
SMA
-2
CM
A-2
CM
A-1
SMA
-2
CM
A-3
CM
A-2
SMA
-1
CM
A-4
FED
-5
BED
-7
BED
-8
CSW
-3
FED
-8
FED
-7
BED
-5
BED
-6
CSW
-2
FED
-6
FED
-5
BED
-7
BED
-8
CSW
-3
FED
-8
FED
-7
BED
-5
BED
-6
CSW
-2
FED
-6
Figure 14. USP V Logic Box slot layouts.
2M 2N 2P 2Q 2R 2CD 2SD 2CB 2T 2U 2V 2W 2XBasic Opt 1 Opt 1 Basic Opt 1 Opt 1 Opt 1 Opt 3 Opt 2 Opt 3 Basic Opt 3 Opt 2
Basic2SB
1L 1K 1J 1H 1G 1CC 1SA 1CA 1F 1E 1D 1B 1AOpt 2 Opt 3 Opt 1 Opt 3 Opt 2 Opt 3 Basic Opt 1 Opt 1 Basic Basic Opt 1 Basic
Opt1SC
BED
-1
CM
A-3
CM
A-1
SMA
-2SM
A-2
BED
-3
BED
-2
SMA
-1
BED
-3
BED
-4
CSW
-1
FED
-4
FED
-3
FED
-2
FED
-1
CSW
-0SMA
-1
USP Rear (Cluster-2)
USP Front (Cluster-1)
CM
A-1
CM
A-3
FED
-3
FED
-4
CSW
-1
BED
-4
FED
-2
BED
-1
BED
-2
CSW
-0
FED
-1
Figure 15. USP Logic Box slot layouts.
Hitachi Data Systems Confidential For Internal Use and Distribution to Authorized Parties Only
- 21 -
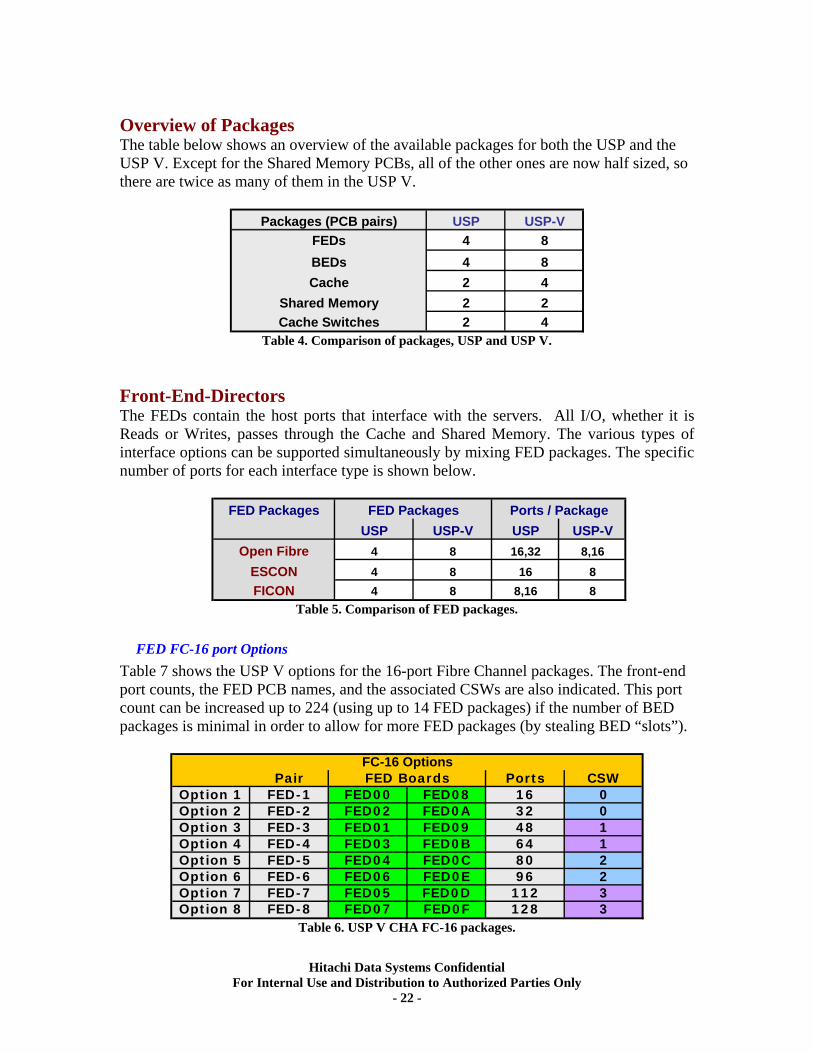
Overview of Packages The table below shows an overview of the available packages for both the USP and the USP V. Except for the Shared Memory PCBs, all of the other ones are now half sized, so there are twice as many of them in the USP V.
Packages (PCB pairs) USP USP-VFEDs 4 8BEDs 4 8Cache 2 4
Shared Memory 2 2Cache Switches 2 4
Table 4. Comparison of packages, USP and USP V. Front-End-Directors The FEDs contain the host ports that interface with the servers. All I/O, whether it is Reads or Writes, passes through the Cache and Shared Memory. The various types of interface options can be supported simultaneously by mixing FED packages. The specific number of ports for each interface type is shown below.
FED PackagesUSP USP-V USP USP-V
4 8 16,32 8,164 8 16 84 8 8,16 8
FED Packages Ports / Package
Open FibreESCONFICON
Table 5. Comparison of FED packages.
FED FC-16 port Options Table 7 shows the USP V options for the 16-port Fibre Channel packages. The front-end port counts, the FED PCB names, and the associated CSWs are also indicated. This port count can be increased up to 224 (using up to 14 FED packages) if the number of BED packages is minimal in order to allow for more FED packages (by stealing BED “slots”).
Pair Ports CSWOption 1 FED-1 FED00 FED08 16 0Option 2 FED-2 FED02 FED0A 32 0Option 3 FED-3 FED01 FED09 48 1Option 4 FED-4 FED03 FED0B 64 1Option 5 FED-5 FED04 FED0C 80 2Option 6 FED-6 FED06 FED0E 96 2Option 7 FED-7 FED05 FED0D 112 3Option 8 FED-8 FED07 FED0F 128 3
FED BoardsFC-16 Options
Table 6. USP V CHA FC-16 packages.
Hitachi Data Systems Confidential
For Internal Use and Distribution to Authorized Parties Only - 22 -
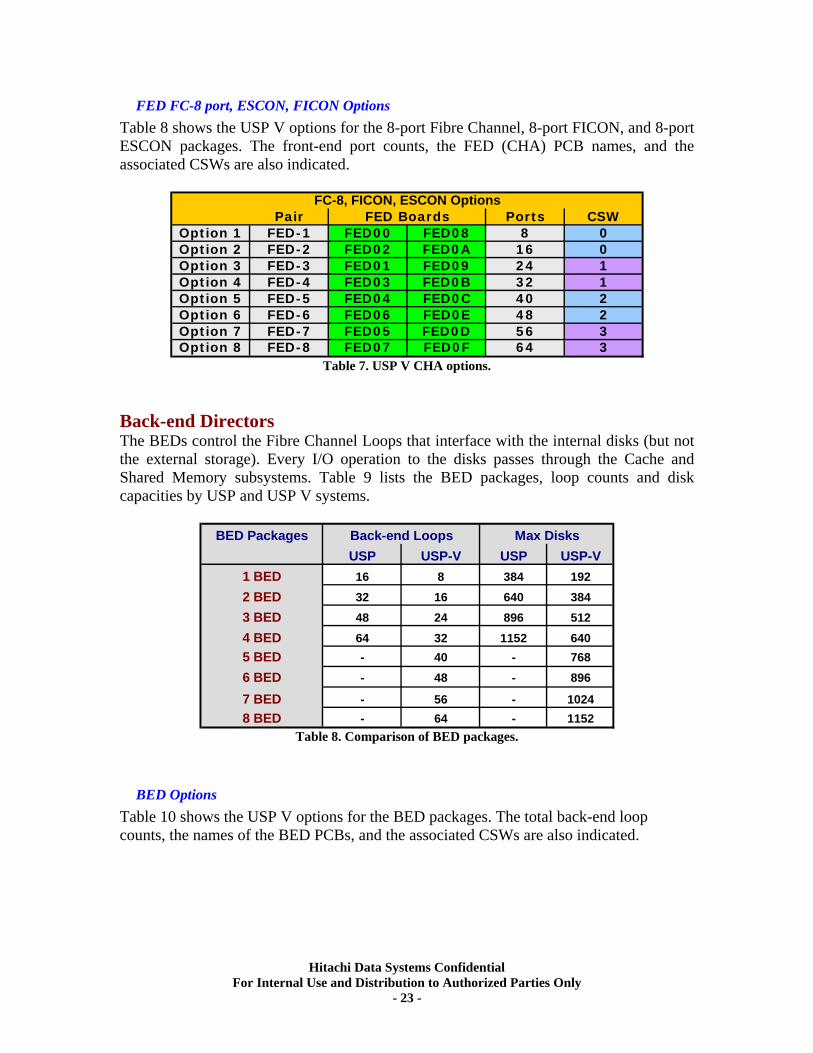
FED FC-8 port, ESCON, FICON Options Table 8 shows the USP V options for the 8-port Fibre Channel, 8-port FICON, and 8-port ESCON packages. The front-end port counts, the FED (CHA) PCB names, and the associated CSWs are also indicated.
Pair Ports CSWOption 1 FED-1 FED00 FED08 8 0Option 2 FED-2 FED02 FED0A 16 0Option 3 FED-3 FED01 FED09 24 1Option 4 FED-4 FED03 FED0B 32 1Option 5 FED-5 FED04 FED0C 40 2Option 6 FED-6 FED06 FED0E 48 2Option 7 FED-7 FED05 FED0D 56 3Option 8 FED-8 FED07 FED0F 64 3
FED BoardsFC-8, FICON, ESCON Options
Table 7. USP V CHA options.
Back-end Directors The BEDs control the Fibre Channel Loops that interface with the internal disks (but not the external storage). Every I/O operation to the disks passes through the Cache and Shared Memory subsystems. Table 9 lists the BED packages, loop counts and disk capacities by USP and USP V systems.
BED PackagesUSP USP-V USP USP-V
16 8 384 19232 16 640 38448 24 896 51264 32 1152 640- 40 - 768- 48 - 896
- 56 - 1024- 64 - 1152
Back-end Loops Max Disks
1 BED2 BED3 BED4 BED5 BED6 BED7 BED8 BED
Table 8. Comparison of BED packages.
BED Options Table 10 shows the USP V options for the BED packages. The total back-end loop counts, the names of the BED PCBs, and the associated CSWs are also indicated.
Hitachi Data Systems Confidential For Internal Use and Distribution to Authorized Parties Only
- 23 -
Pair Loops CSWOption 1 BED-1 BED10 BED18 8 0Option 2 BED-2 BED12 BED1A 16 0Option 3 BED-3 BED11 BED19 24 1Option 4 BED-4 BED13 BED1B 32 1Option 5 BED-5 BED14 BED1C 40 2Option 6 BED-6 BED16 BED1E 48 2Option 7 BED-7 BED15 BED1D 56 3Option 8 BED-8 BED17 BED1F 64 3
BED OptionsBED Boards
Table 9. USP V BED packages.
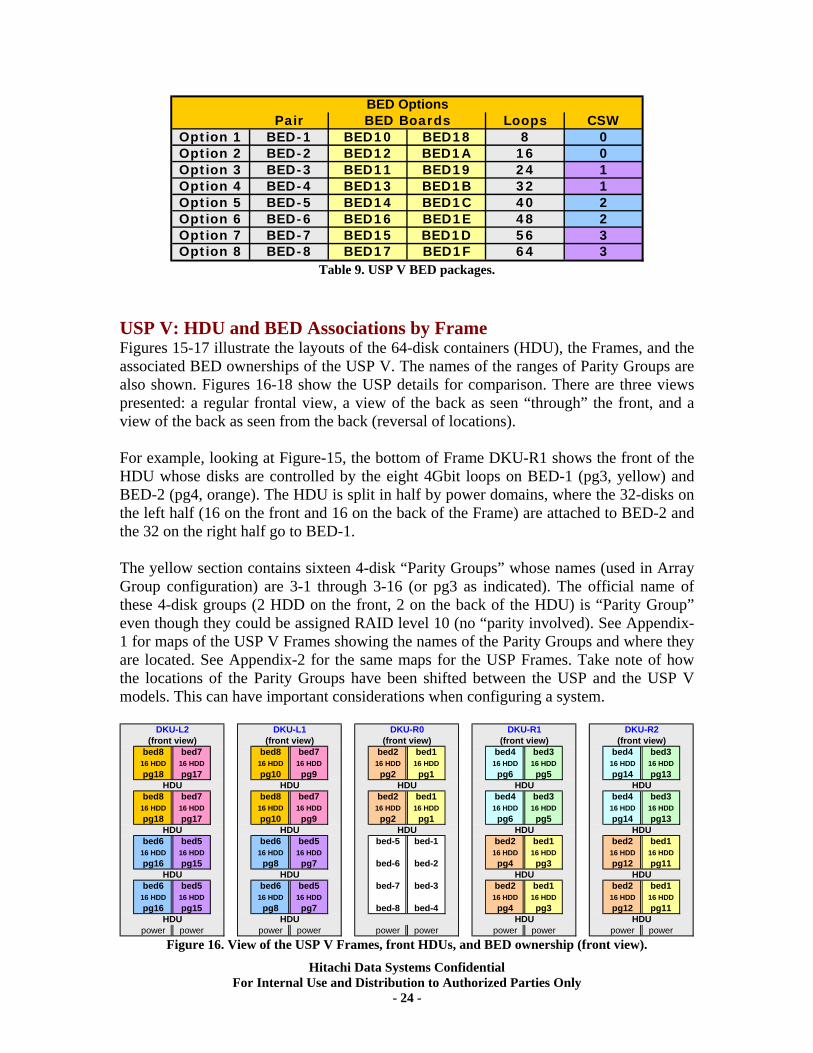
USP V: HDU and BED Associations by Frame Figures 15-17 illustrate the layouts of the 64-disk containers (HDU), the Frames, and the associated BED ownerships of the USP V. The names of the ranges of Parity Groups are also shown. Figures 16-18 show the USP details for comparison. There are three views presented: a regular frontal view, a view of the back as seen “through” the front, and a view of the back as seen from the back (reversal of locations). For example, looking at Figure-15, the bottom of Frame DKU-R1 shows the front of the HDU whose disks are controlled by the eight 4Gbit loops on BED-1 (pg3, yellow) and BED-2 (pg4, orange). The HDU is split in half by power domains, where the 32-disks on the left half (16 on the front and 16 on the back of the Frame) are attached to BED-2 and the 32 on the right half go to BED-1. The yellow section contains sixteen 4-disk “Parity Groups” whose names (used in Array Group configuration) are 3-1 through 3-16 (or pg3 as indicated). The official name of these 4-disk groups (2 HDD on the front, 2 on the back of the HDU) is “Parity Group” even though they could be assigned RAID level 10 (no “parity involved). See Appendix-1 for maps of the USP V Frames showing the names of the Parity Groups and where they are located. See Appendix-2 for the same maps for the USP Frames. Take note of how the locations of the Parity Groups have been shifted between the USP and the USP V models. This can have important considerations when configuring a system.
bed8 bed7 bed8 bed7 bed2 bed1 bed4 bed3 bed4 bed316 HDD 16 HDD 16 HDD 16 HDD 16 HDD 16 HDD 16 HDD 16 HDD 16 HDD 16 HDDpg18 pg17 pg10 pg9 pg2 pg1 pg6 pg5 pg14 pg13
bed8 bed7 bed8 bed7 bed2 bed1 bed4 bed3 bed4 bed316 HDD 16 HDD 16 HDD 16 HDD 16 HDD 16 HDD 16 HDD 16 HDD 16 HDD 16 HDDpg18 pg17 pg10 pg9 pg2 pg1 pg6 pg5 pg14 pg13
bed6 bed5 bed6 bed5 bed-5 bed-1 bed2 bed1 bed2 bed116 HDD 16 HDD 16 HDD 16 HDD 16 HDD 16 HDD 16 HDD 16 HDDpg16 pg15 pg8 pg7 bed-6 bed-2 pg4 pg3 pg12 pg11
bed6 bed5 bed6 bed5 bed-7 bed-3 bed2 bed1 bed2 bed116 HDD 16 HDD 16 HDD 16 HDD 16 HDD 16 HDD 16 HDD 16 HDDpg16 pg15 pg8 pg7 bed-8 bed-4 pg4 pg3 pg12 pg11
power power power power power power power power power power
DKU-L2
HDU
HDU
DKU-L1
HDU
HDU
HDU HDU
HDU HDU
DKU-R0
HDU
DKU-R1
HDU
HDU HDU
(front view) (front view) (front view) (front view)(front view)DKU-R2
HDU
HDUHDU
HDU
HDU HDU
Figure 16. View of the USP V Frames, front HDUs, and BED ownership (front view).
Hitachi Data Systems Confidential For Internal Use and Distribution to Authorized Parties Only
- 24 -
bed8 bed7 bed8 bed7 bed2 bed1 bed4 bed3 bed4 bed316 HDD 16 HDD 16 HDD 16 HDD 16 HDD 16 HDD 16 HDD 16 HDD 16 HDD 16 HDDpg18 pg17 pg10 pg9 pg2 pg1 pg6 pg5 pg14 pg13
bed8 bed7 bed8 bed7 bed2 bed1 bed4 bed3 bed4 bed316 HDD 16 HDD 16 HDD 16 HDD 16 HDD 16 HDD 16 HDD 16 HDD 16 HDD 16 HDDpg18 pg17 pg10 pg9 pg2 pg1 pg6 pg5 pg14 pg13
bed6 bed5 bed6 bed5 bed-5 bed-1 bed2 bed1 bed2 bed116 HDD 16 HDD 16 HDD 16 HDD 16 HDD 16 HDD 16 HDD 16 HDDpg16 pg15 pg8 pg7 bed-6 bed-2 pg4 pg3 pg12 pg11
bed6 bed5 bed6 bed5 bed-7 bed-3 bed2 bed1 bed2 bed116 HDD 16 HDD 16 HDD 16 HDD 16 HDD 16 HDD 16 HDD 16 HDDpg16 pg15 pg8 pg7 bed-8 bed-4 pg4 pg3 pg12 pg11
power power power power power power power power power power
HDU
HDU
HDU
HDUHDU
HDU
HDU
DKU-R2DKU-L2 DKU-L1 DKU-R0(rear view)(rear view)
DKU-R1(rear view) (rear view) (rear view)
HDU HDU HDU HDU
HDU HDU HDU
HDU HDU
HDU HDU
Figure 17. View of the USP V Frames, rear HDUs, and BED ownership (front looking through view).
bed3 bed4 bed3 bed4 bed1 bed2 bed7 bed8 bed7 bed816 HDD 16 HDD 16 HDD 16 HDD 16 HDD 16 HDD 16 HDD 16 HDD 16 HDD 16 HDDpg13 pg14 pg5 pg6 pg1 pg2 pg9 pg10 pg17 pg18
bed3 bed4 bed3 bed4 bed1 bed2 bed7 bed8 bed7 bed816 HDD 16 HDD 16 HDD 16 HDD 16 HDD 16 HDD 16 HDD 16 HDD 16 HDD 16 HDDpg13 pg14 pg5 pg6 pg1 pg2 pg9 pg10 pg17 pg18
bed1 bed2 bed1 bed2 bed-5 bed-1 bed5 bed6 bed5 bed616 HDD 16 HDD 16 HDD 16 HDD 16 HDD 16 HDD 16 HDD 16 HDDpg11 pg12 pg3 pg4 bed-6 bed-2 pg7 pg8 pg15 pg16
bed1 bed2 bed1 bed2 bed-7 bed-3 bed5 bed6 bed5 bed616 HDD 16 HDD 16 HDD 16 HDD 16 HDD 16 HDD 16 HDD 16 HDDpg11 pg12 pg3 pg4 bed-8 bed-4 pg7 pg8 pg15 pg16
power power power power power power power power power power
HDU
DKU-L2(rear facing view)(rear facing view)
HDU
HDU
HDU
HDU
HDU HDU HDUHDU
HDU
HDU
HDU
DKU-R2 DKU-R1 DKU-R0 DKU-L1(rear facing view) (rear facing view) (rear facing view)
HDU HDU HDU
HDU HDU
HDU
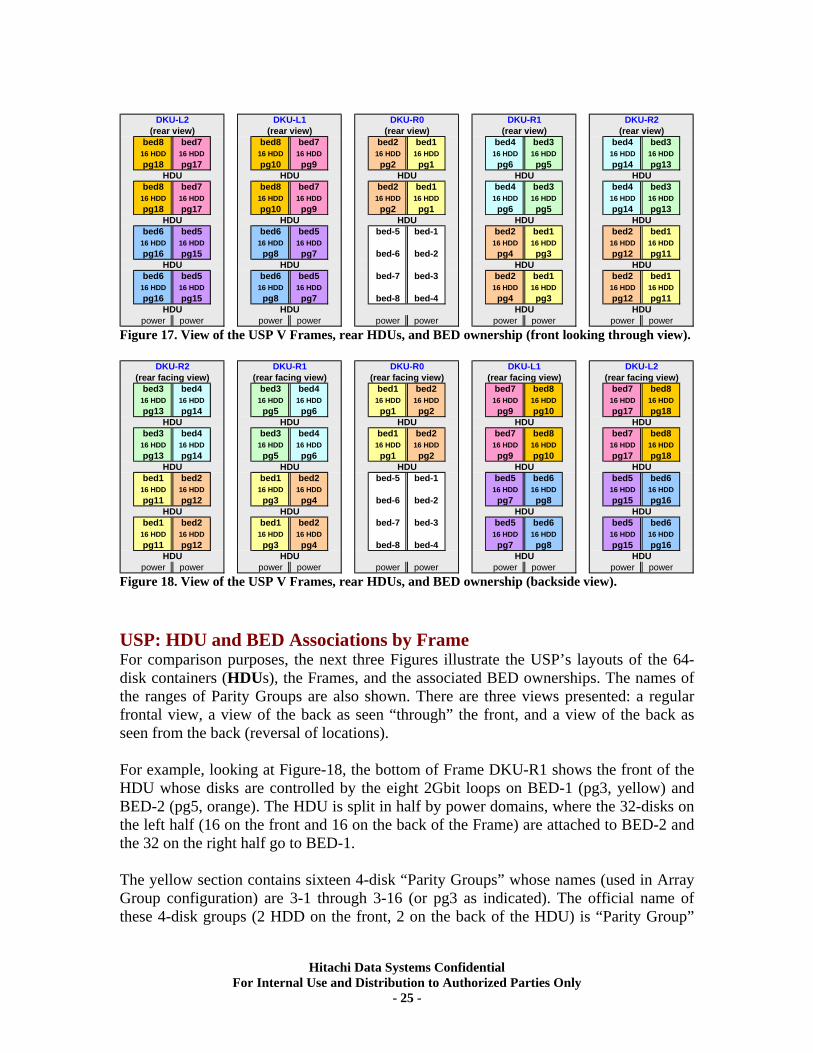
Figure 18. View of the USP V Frames, rear HDUs, and BED ownership (backside view). USP: HDU and BED Associations by Frame For comparison purposes, the next three Figures illustrate the USP’s layouts of the 64-disk containers (HDUs), the Frames, and the associated BED ownerships. The names of the ranges of Parity Groups are also shown. There are three views presented: a regular frontal view, a view of the back as seen “through” the front, and a view of the back as seen from the back (reversal of locations). For example, looking at Figure-18, the bottom of Frame DKU-R1 shows the front of the HDU whose disks are controlled by the eight 2Gbit loops on BED-1 (pg3, yellow) and BED-2 (pg5, orange). The HDU is split in half by power domains, where the 32-disks on the left half (16 on the front and 16 on the back of the Frame) are attached to BED-2 and the 32 on the right half go to BED-1. The yellow section contains sixteen 4-disk “Parity Groups” whose names (used in Array Group configuration) are 3-1 through 3-16 (or pg3 as indicated). The official name of these 4-disk groups (2 HDD on the front, 2 on the back of the HDU) is “Parity Group”
Hitachi Data Systems Confidential For Internal Use and Distribution to Authorized Parties Only
- 25 -
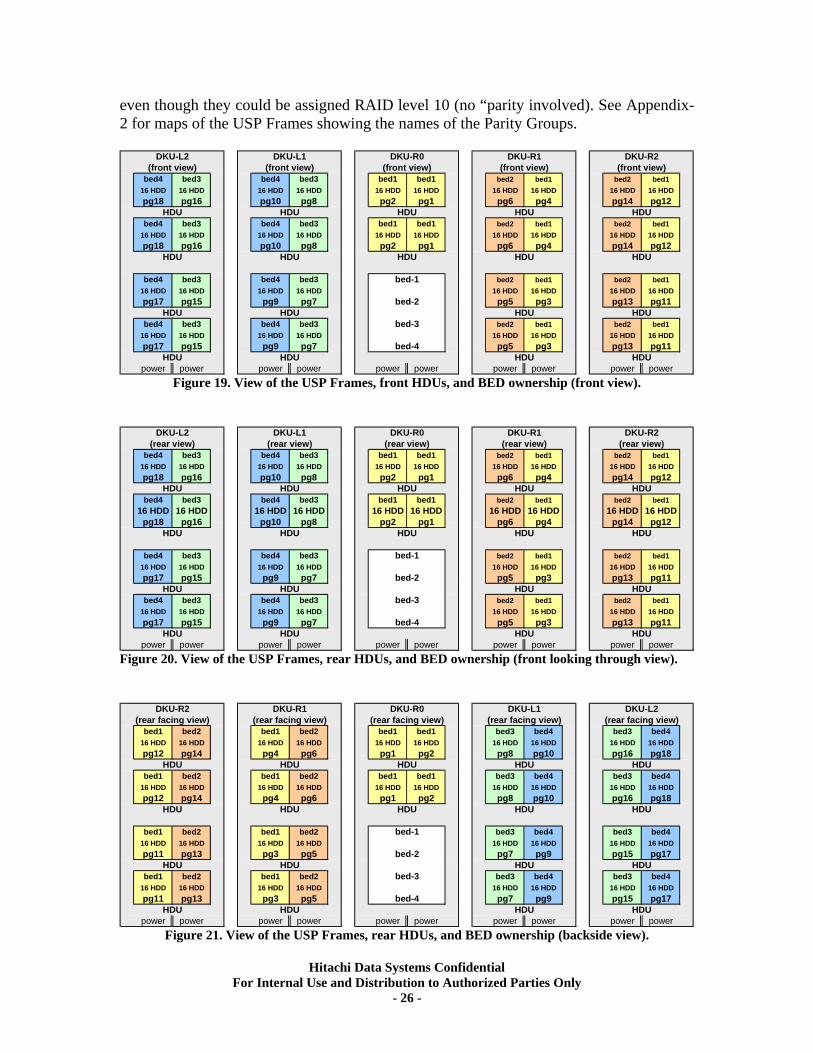
even though they could be assigned RAID level 10 (no “parity involved). See Appendix-2 for maps of the USP Frames showing the names of the Parity Groups.
bed4 bed3 bed4 bed3 bed1 bed1 bed2 bed1 bed2 bed116 HDD 16 HDD 16 HDD 16 HDD 16 HDD 16 HDD 16 HDD 16 HDD 16 HDD 16 HDDpg18 pg16 pg10 pg8 pg2 pg1 pg6 pg4 pg14 pg12
bed4 bed3 bed4 bed3 bed1 bed1 bed2 bed1 bed2 bed116 HDD 16 HDD 16 HDD 16 HDD 16 HDD 16 HDD 16 HDD 16 HDD 16 HDD 16 HDDpg18 pg16 pg10 pg8 pg2 pg1 pg6 pg4 pg14 pg12
bed4 bed3 bed4 bed3 bed2 bed1 bed2 bed116 HDD 16 HDD 16 HDD 16 HDD 16 HDD 16 HDD 16 HDD 16 HDDpg17 pg15 pg9 pg7 pg5 pg3 pg13 pg11
bed4 bed3 bed4 bed3 bed2 bed1 bed2 bed116 HDD 16 HDD 16 HDD 16 HDD 16 HDD 16 HDD 16 HDD 16 HDDpg17 pg15 pg9 pg7 pg5 pg3 pg13 pg11
power power power power power power power power power power
DKU-R2
HDU
HDU
(front view) (front view) (front view) (front view)(front view)DKU-R0
HDU
DKU-L2
HDU
HDU
DKU-L1
HDU
HDU
HDU HDU
DKU-R1
HDU
HDU
bed-1
bed-2
bed-3
bed-4
HDU HDU
HDU HDU HDU HDU HDU
Figure 19. View of the USP Frames, front HDUs, and BED ownership (front view).
bed4 bed3 bed4 bed3 bed1 bed1 bed2 bed1 bed2 bed116 HDD 16 HDD 16 HDD 16 HDD 16 HDD 16 HDD 16 HDD 16 HDD 16 HDD 16 HDDpg18 pg16 pg10 pg8 pg2 pg1 pg6 pg4 pg14 pg12
bed4 bed3 bed4 bed3 bed1 bed1 bed2 bed1 bed2 bed116 HDD 16 HDD 16 HDD 16 HDD 16 HDD 16 HDD 16 HDD 16 HDD 16 HDD 16 HDD
pg18 pg16 pg10 pg8 pg2 pg1 pg6 pg4 pg14 pg12
bed4 bed3 bed4 bed3 bed2 bed1 bed2 bed116 HDD 16 HDD 16 HDD 16 HDD 16 HDD 16 HDD 16 HDD 16 HDDpg17 pg15 pg9 pg7 pg5 pg3 pg13 pg11
bed4 bed3 bed4 bed3 bed2 bed1 bed2 bed116 HDD 16 HDD 16 HDD 16 HDD 16 HDD 16 HDD 16 HDD 16 HDDpg17 pg15 pg9 pg7 pg5 pg3 pg13 pg11
power power power power power power power power power power
HDU
HDU HDU HDU HDU
HDU HDU HDU HDU
DKU-R2(rear view) (rear view) (rear view) (rear view)(rear view)
DKU-L2 DKU-L1 DKU-R0 DKU-R1
bed-1
bed-2
bed-4
HDU
bed-3HDU HDU HDU
HDU HDU HDU HDU
HDU
Figure 20. View of the USP Frames, rear HDUs, and BED ownership (front looking through view).
bed1 bed2 bed1 bed2 bed1 bed1 bed3 bed4 bed3 bed416 HDD 16 HDD 16 HDD 16 HDD 16 HDD 16 HDD 16 HDD 16 HDD 16 HDD 16 HDDpg12 pg14 pg4 pg6 pg1 pg2 pg8 pg10 pg16 pg18
bed1 bed2 bed1 bed2 bed1 bed1 bed3 bed4 bed3 bed416 HDD 16 HDD 16 HDD 16 HDD 16 HDD 16 HDD 16 HDD 16 HDD 16 HDD 16 HDDpg12 pg14 pg4 pg6 pg1 pg2 pg8 pg10 pg16 pg18
bed1 bed2 bed1 bed2 bed3 bed4 bed3 bed416 HDD 16 HDD 16 HDD 16 HDD 16 HDD 16 HDD 16 HDD 16 HDDpg11 pg13 pg3 pg5 pg7 pg9 pg15 pg17
bed1 bed2 bed1 bed2 bed3 bed4 bed3 bed416 HDD 16 HDD 16 HDD 16 HDD 16 HDD 16 HDD 16 HDD 16 HDDpg11 pg13 pg3 pg5 pg7 pg9 pg15 pg17
power power power power power power power power power power
HDU
HDU HDU HDU HDU
HDU HDU HDU HDU
bed-1
DKU-R2 DKU-R1 DKU-R0 DKU-L1
bed-4
bed-3
(rear facing view) (rear facing view)
bed-2
HDU
DKU-L2(rear facing view) (rear facing view) (rear facing view)
HDU HDU HDU HDU
HDU HDU HDU HDU
Figure 21. View of the USP Frames, rear HDUs, and BED ownership (backside view).
Hitachi Data Systems Confidential For Internal Use and Distribution to Authorized Parties Only
- 26 -
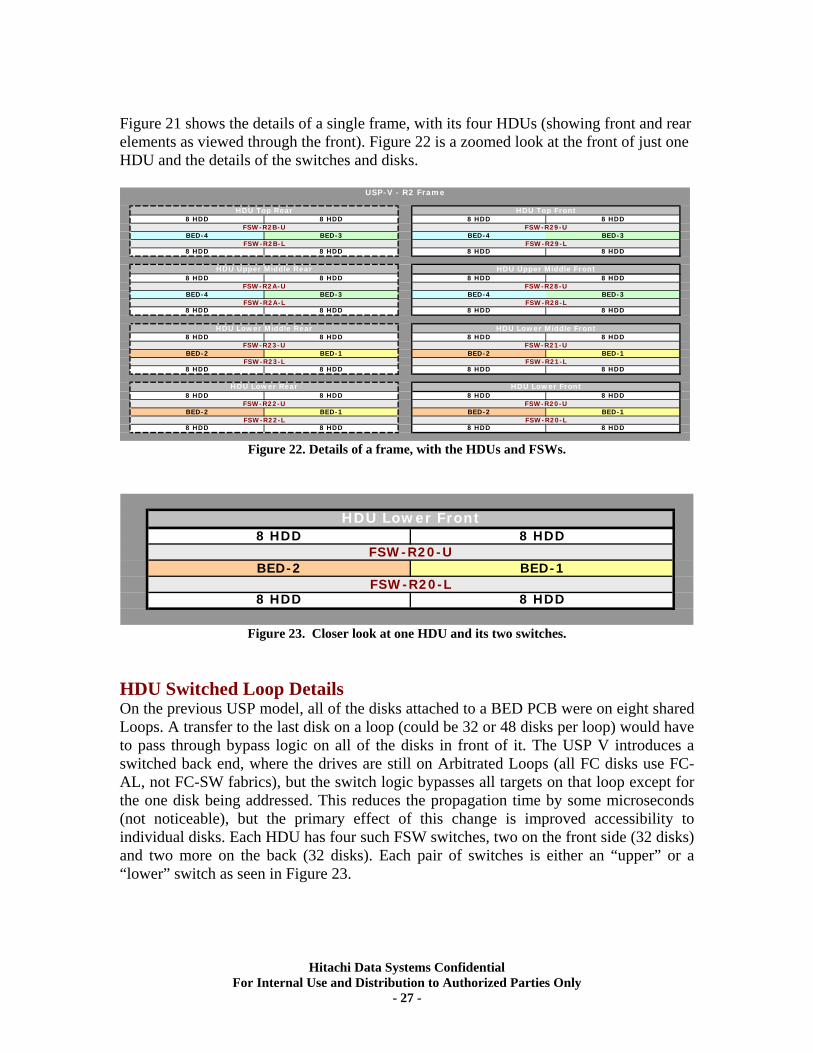
Figure 21 shows the details of a single frame, with its four HDUs (showing front and rear elements as viewed through the front). Figure 22 is a zoomed look at the front of just one HDU and the details of the switches and disks.
HDU Upper Middle Front
HDU Lower FrontHDU Lower Rear
HDU Upper Middle Rear8 HDD 8 HDD 8 HDD 8 HDD
8 HDD 8 HDD
8 HDD 8 HDD 8 HDD 8 HDD
USP-V - R2 Frame
HDU Top Rear HDU Top Front
FSW-R2B-U FSW-R29-U
FSW-R2B-L FSW-R29-L
FSW-R2A-U FSW-R28-U
FSW-R2A-L FSW-R28-L
FSW-R23-U FSW-R21-U
FSW-R23-L FSW-R21-L
FSW-R22-U FSW-R20-U
FSW-R22-L FSW-R20-L
BED-4 BED-3 BED-4 BED-3
8 HDD 8 HDD 8 HDD 8 HDD
BED-4 BED-3 BED-4 BED-3
HDU Lower Middle Rear HDU Lower Middle Front
8 HDD 8 HDD
8 HDD 8 HDD 8 HDD 8 HDD
BED-2 BED-1BED-2 BED-1
8 HDD 8 HDD 8 HDD 8 HDD
8 HDD 8 HDD 8 HDD 8 HDD
8 HDD 8 HDD 8 HDD 8 HDD
BED-2 BED-1BED-2 BED-1
Figure 22. Details of a frame, with the HDUs and FSWs.
HDU Lower Front8 HDD 8 HDD
FSW-R20-U
FSW-R20-L8 HDD 8 HDD
BED-2 BED-1
Figure 23. Closer look at one HDU and its two switches.
HDU Switched Loop Details On the previous USP model, all of the disks attached to a BED PCB were on eight shared Loops. A transfer to the last disk on a loop (could be 32 or 48 disks per loop) would have to pass through bypass logic on all of the disks in front of it. The USP V introduces a switched back end, where the drives are still on Arbitrated Loops (all FC disks use FC-AL, not FC-SW fabrics), but the switch logic bypasses all targets on that loop except for the one disk being addressed. This reduces the propagation time by some microseconds (not noticeable), but the primary effect of this change is improved accessibility to individual disks. Each HDU has four such FSW switches, two on the front side (32 disks) and two more on the back (32 disks). Each pair of switches is either an “upper” or a “lower” switch as seen in Figure 23.
Hitachi Data Systems Confidential For Internal Use and Distribution to Authorized Parties Only
- 27 -
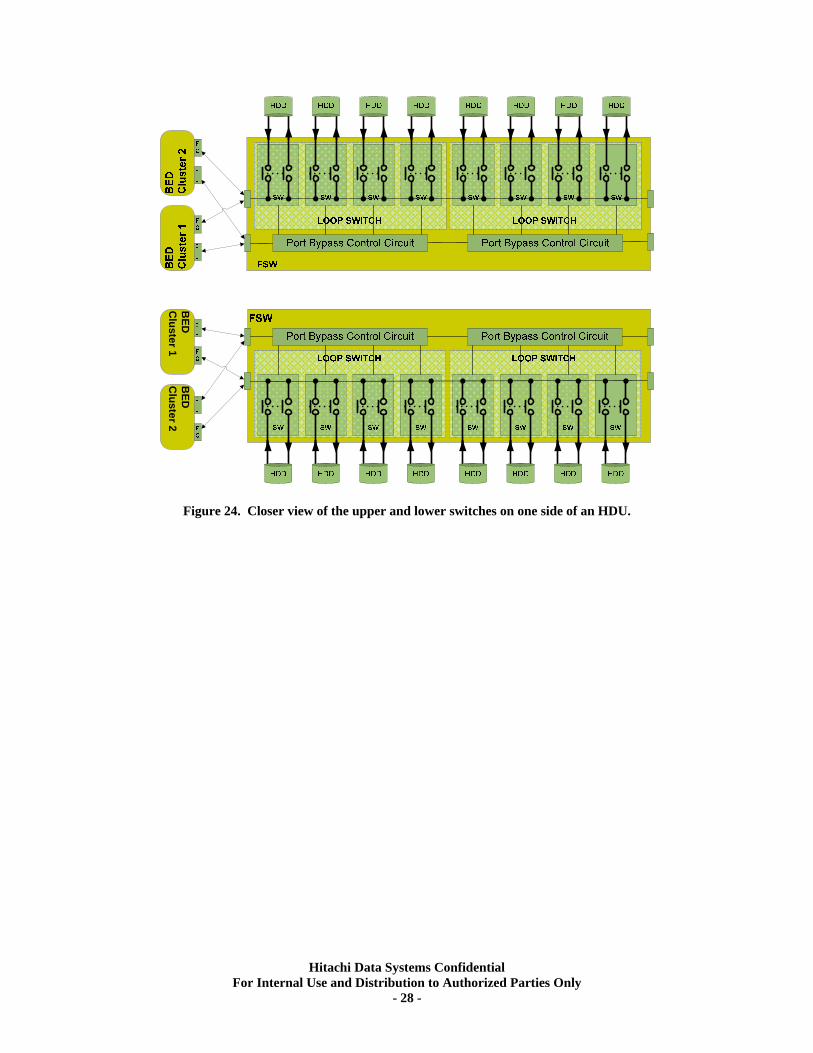
BED
C
luster 2B
ED
Cluster 1
Figure 24. Closer view of the upper and lower switches on one side of an HDU.
Hitachi Data Systems Confidential For Internal Use and Distribution to Authorized Parties Only
- 28 -
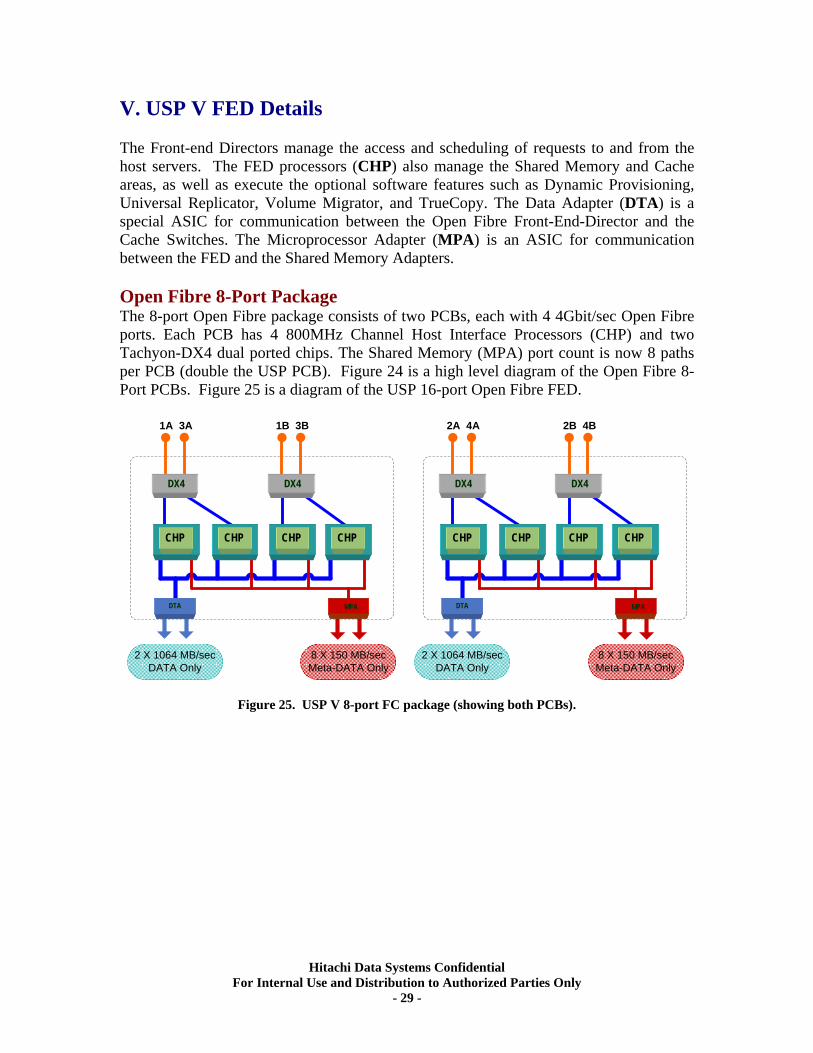
V. USP V FED Details The Front-end Directors manage the access and scheduling of requests to and from the host servers. The FED processors (CHP) also manage the Shared Memory and Cache areas, as well as execute the optional software features such as Dynamic Provisioning, Universal Replicator, Volume Migrator, and TrueCopy. The Data Adapter (DTA) is a special ASIC for communication between the Open Fibre Front-End-Director and the Cache Switches. The Microprocessor Adapter (MPA) is an ASIC for communication between the FED and the Shared Memory Adapters. Open Fibre 8-Port Package The 8-port Open Fibre package consists of two PCBs, each with 4 4Gbit/sec Open Fibre ports. Each PCB has 4 800MHz Channel Host Interface Processors (CHP) and two Tachyon-DX4 dual ported chips. The Shared Memory (MPA) port count is now 8 paths per PCB (double the USP PCB). Figure 24 is a high level diagram of the Open Fibre 8-Port PCBs. Figure 25 is a diagram of the USP 16-port Open Fibre FED.
1A 3A
2 X 1064 MB/secDATA Only
8 X 150 MB/secMeta-DATA Only
DX4 DX4
CHPCHPCHPCHP
DTAMPA
1B 3B
DTA
2A 4A
2 X 1064 MB/secDATA Only
8 X 150 MB/secMeta-DATA Only
DX4 DX4
CHPCHPCHPCHP
DTAMPA
2B 4B
DTA
Figure 25. USP V 8-port FC package (showing both PCBs).
Hitachi Data Systems Confidential For Internal Use and Distribution to Authorized Parties Only
- 29 -
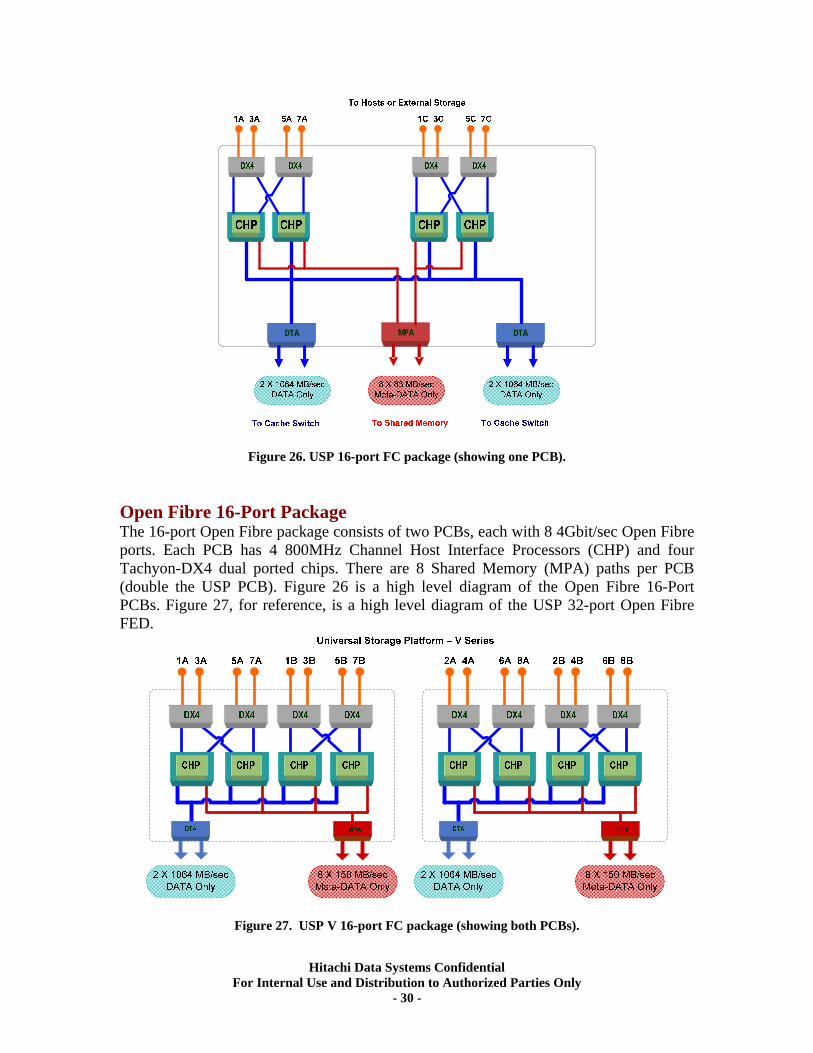
MPA DTADTADTADTA
Figure 26. USP 16-port FC package (showing one PCB). Open Fibre 16-Port Package The 16-port Open Fibre package consists of two PCBs, each with 8 4Gbit/sec Open Fibre ports. Each PCB has 4 800MHz Channel Host Interface Processors (CHP) and four Tachyon-DX4 dual ported chips. There are 8 Shared Memory (MPA) paths per PCB (double the USP PCB). Figure 26 is a high level diagram of the Open Fibre 16-Port PCBs. Figure 27, for reference, is a high level diagram of the USP 32-port Open Fibre FED.
Figure 27. USP V 16-port FC package (showing both PCBs).
Hitachi Data Systems Confidential For Internal Use and Distribution to Authorized Parties Only
- 30 -
TagmaStore Universal Storage Platform
MPA DTADTADTADTA
400MHz
400MHz
CHP 400MHz
400MHz
CHP 400MHz
400MHz
CHP 400MHz
400MHz
CHP 400MHz
400MHz
CHP 400MHz
400MHz
CHP 400MHz
400MHz
CHP 400MHz
400MHz
CHP
DX4 DX4 DX4 DX4 DX4 DX4 DX4 DX4
1A 3A 5A 7A 1B 3B 5B 7B 1C 3C 5C 7C 1D 3D 5D 7D
2 X 1064 MB/secDATA Only
8 X 83 MB/secMeta-DATA Only
2 X 1064 MB/secDATA Only
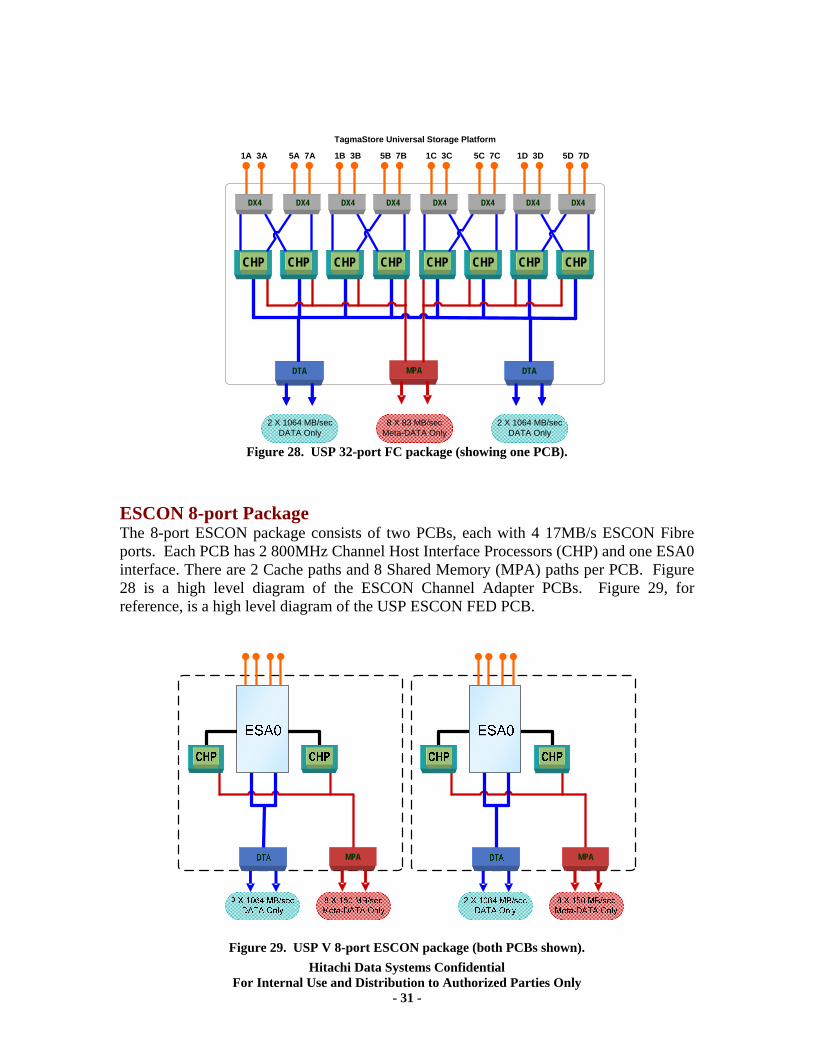
Figure 28. USP 32-port FC package (showing one PCB). ESCON 8-port Package The 8-port ESCON package consists of two PCBs, each with 4 17MB/s ESCON Fibre ports. Each PCB has 2 800MHz Channel Host Interface Processors (CHP) and one ESA0 interface. There are 2 Cache paths and 8 Shared Memory (MPA) paths per PCB. Figure 28 is a high level diagram of the ESCON Channel Adapter PCBs. Figure 29, for reference, is a high level diagram of the USP ESCON FED PCB.
MPA MPA
Figure 29. USP V 8-port ESCON package (both PCBs shown). Hitachi Data Systems Confidential
For Internal Use and Distribution to Authorized Parties Only - 31 -
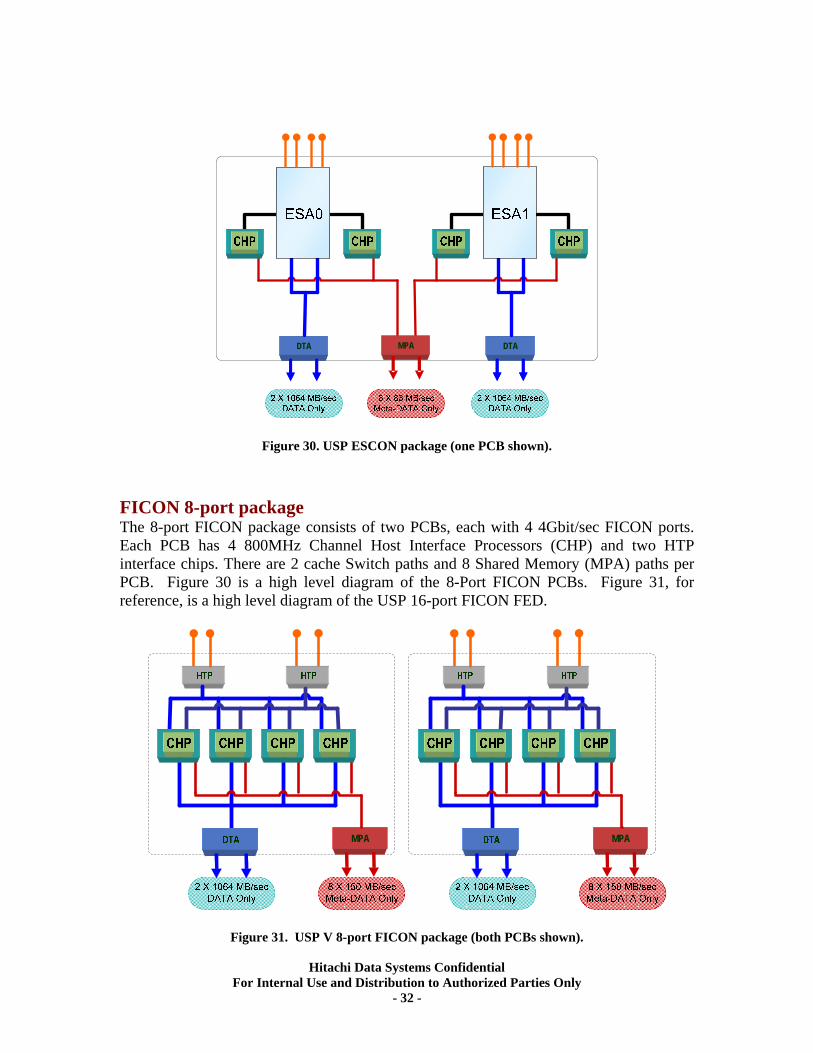
DTADTA DTADTAMPA
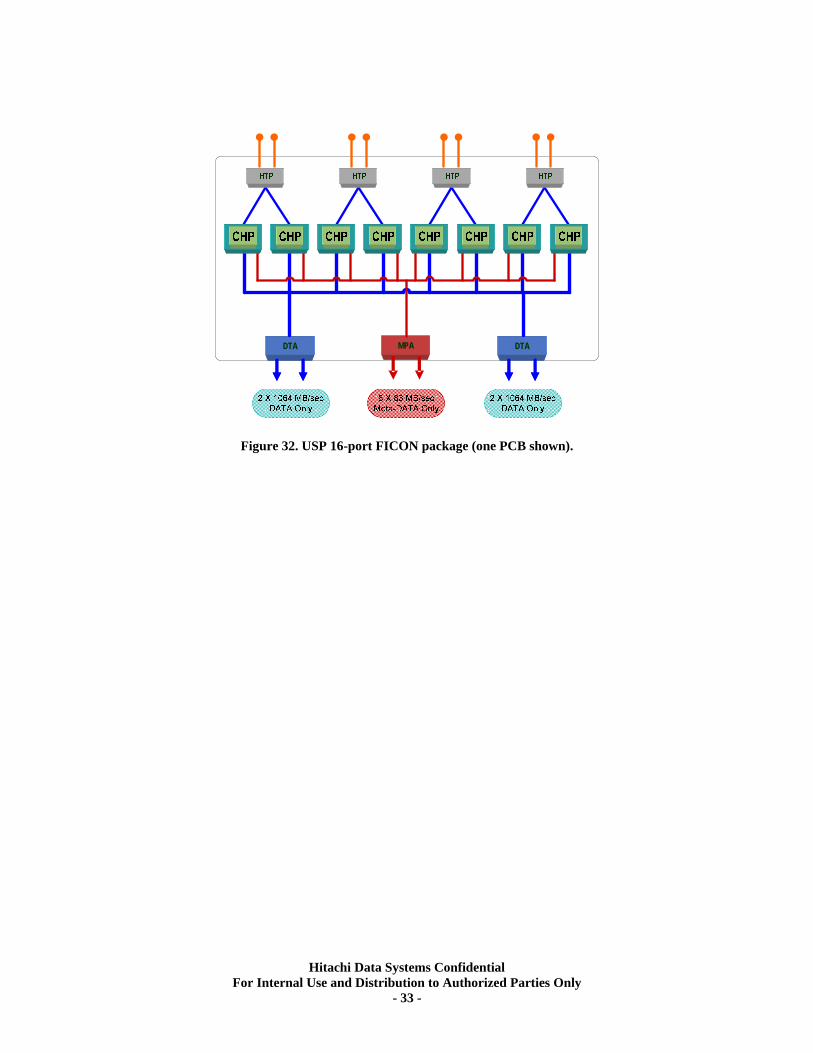
Figure 30. USP ESCON package (one PCB shown). FICON 8-port package The 8-port FICON package consists of two PCBs, each with 4 4Gbit/sec FICON ports. Each PCB has 4 800MHz Channel Host Interface Processors (CHP) and two HTP interface chips. There are 2 cache Switch paths and 8 Shared Memory (MPA) paths per PCB. Figure 30 is a high level diagram of the 8-Port FICON PCBs. Figure 31, for reference, is a high level diagram of the USP 16-port FICON FED.
MPA MPA
Figure 31. USP V 8-port FICON package (both PCBs shown).
Hitachi Data Systems Confidential For Internal Use and Distribution to Authorized Parties Only
- 32 -
MPA DTADTADTADTA
Figure 32. USP 16-port FICON package (one PCB shown).
Hitachi Data Systems Confidential For Internal Use and Distribution to Authorized Parties Only
- 33 -
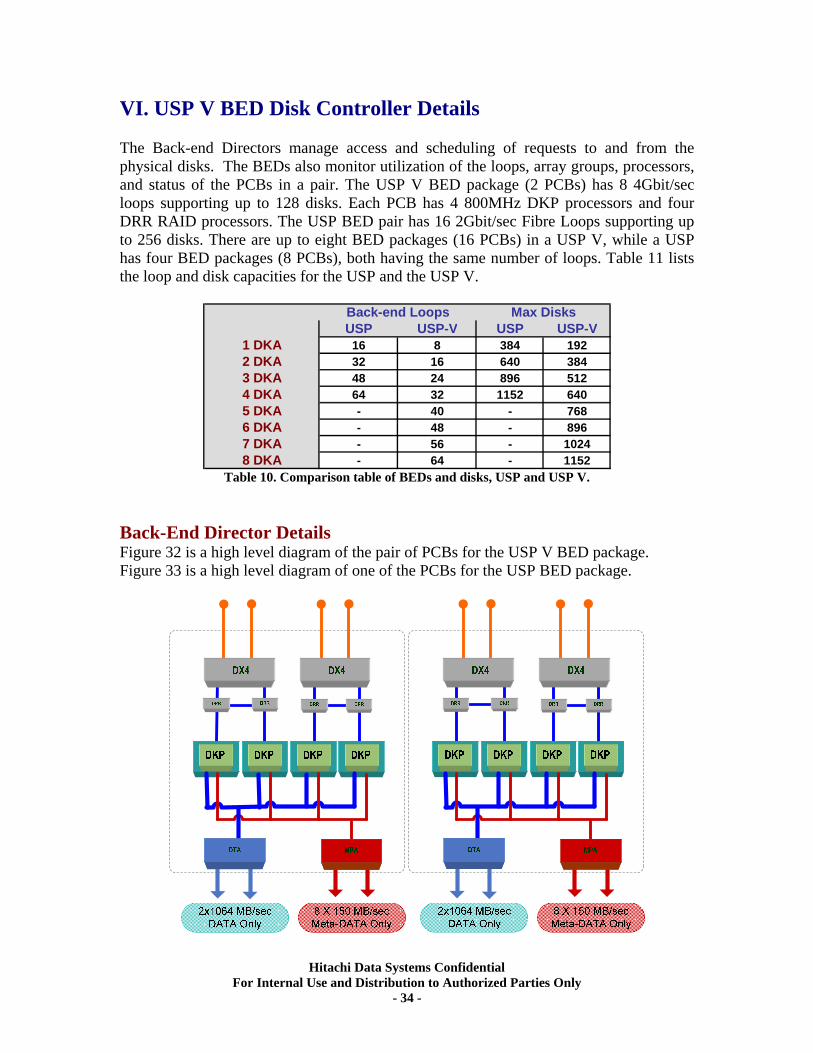
VI. USP V BED Disk Controller Details The Back-end Directors manage access and scheduling of requests to and from the physical disks. The BEDs also monitor utilization of the loops, array groups, processors, and status of the PCBs in a pair. The USP V BED package (2 PCBs) has 8 4Gbit/sec loops supporting up to 128 disks. Each PCB has 4 800MHz DKP processors and four DRR RAID processors. The USP BED pair has 16 2Gbit/sec Fibre Loops supporting up to 256 disks. There are up to eight BED packages (16 PCBs) in a USP V, while a USP has four BED packages (8 PCBs), both having the same number of loops. Table 11 lists the loop and disk capacities for the USP and the USP V.
USP USP-V USP USP-V1 DKA 16 8 384 1922 DKA 32 16 640 3843 DKA 48 24 896 5124 DKA 64 32 1152 6405 DKA - 40 - 7686 DKA - 48 - 8967 DKA - 56 - 10248 DKA - 64 - 1152
Back-end Loops Max Disks
Table 10. Comparison table of BEDs and disks, USP and USP V.
Back-End Director Details Figure 32 is a high level diagram of the pair of PCBs for the USP V BED package. Figure 33 is a high level diagram of one of the PCBs for the USP BED package.
Hitachi Data Systems Confidential For Internal Use and Distribution to Authorized Parties Only
- 34 -
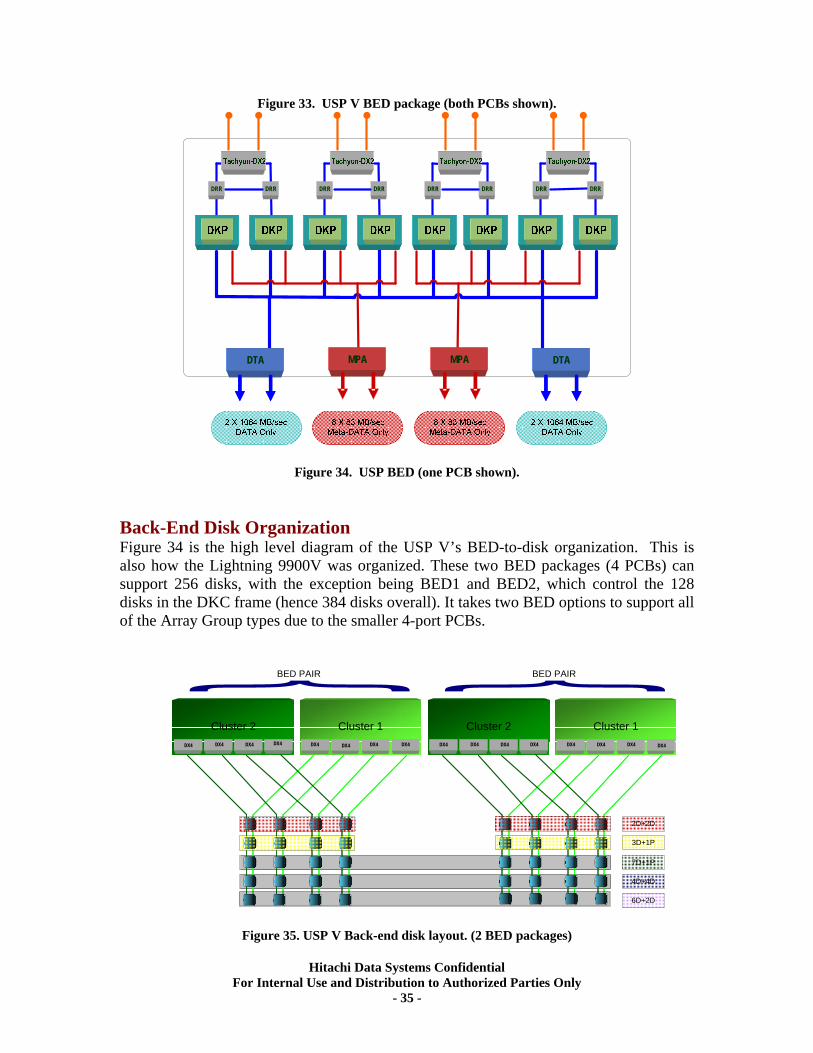
Figure 33. USP V BED package (both PCBs shown).
DRR DRRDRR DRRDRR DRRDRR DRR
DTADTA DTADTAMPAMPA
Figure 34. USP BED (one PCB shown). Back-End Disk Organization Figure 34 is the high level diagram of the USP V’s BED-to-disk organization. This is also how the Lightning 9900V was organized. These two BED packages (4 PCBs) can support 256 disks, with the exception being BED1 and BED2, which control the 128 disks in the DKC frame (hence 384 disks overall). It takes two BED options to support all of the Array Group types due to the smaller 4-port PCBs.
Cluster 2 Cluster 1
3D+1P
2D+2D
Cluster 2 Cluster 1
BED PAIR
DX4
7D+1P
4D+4D
DX4 DX4DX4DX4DX4DX4DX4DX4 DX4DX4DX4 DX4DX4DX4DX4
6D+2D
BED PAIR
Figure 35. USP V Back-end disk layout. (2 BED packages)
Hitachi Data Systems Confidential For Internal Use and Distribution to Authorized Parties Only
- 35 -
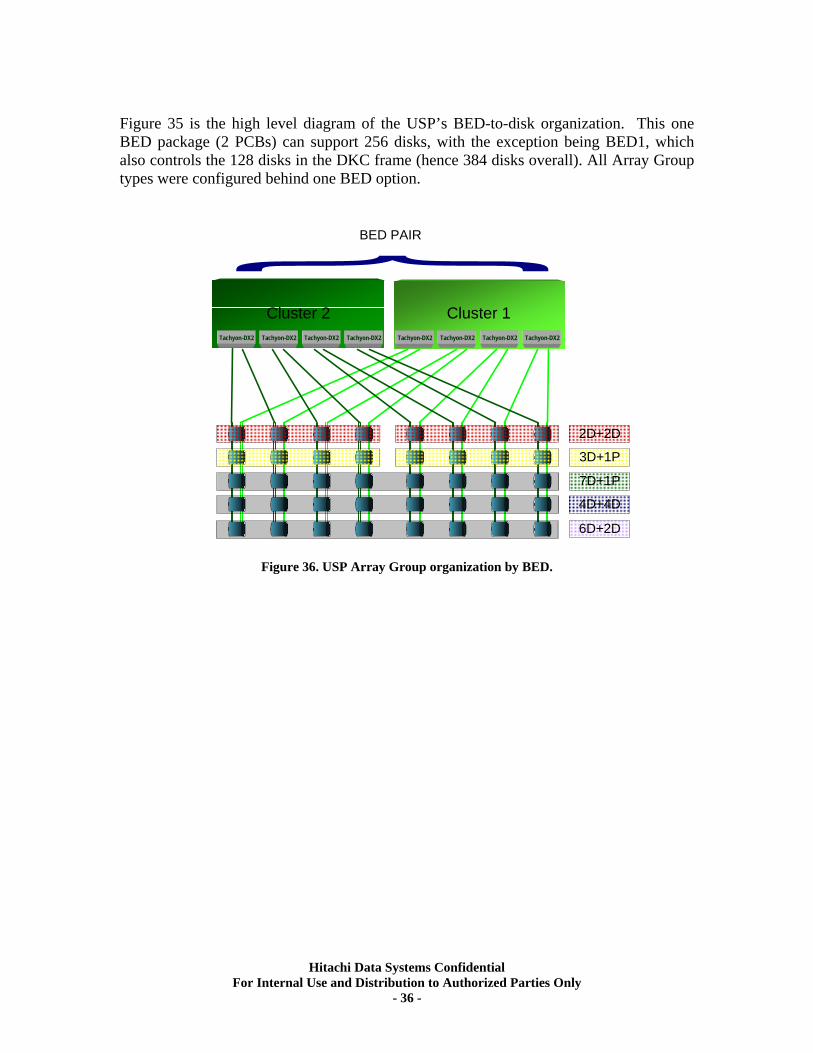
Figure 35 is the high level diagram of the USP’s BED-to-disk organization. This one BED package (2 PCBs) can support 256 disks, with the exception being BED1, which also controls the 128 disks in the DKC frame (hence 384 disks overall). All Array Group types were configured behind one BED option.
BED PAIR
Tachyon-DX2 Tachyon-DX2 Tachyon-DX2 Tachyon-DX2
Cluster 2Tachyon-DX2 Tachyon-DX2 Tachyon-DX2 Tachyon-DX2
Cluster 1
2D+2D
3D+1P
7D+1P
4D+4D
6D+2D
Figure 36. USP Array Group organization by BED.
Hitachi Data Systems Confidential For Internal Use and Distribution to Authorized Parties Only
- 36 -
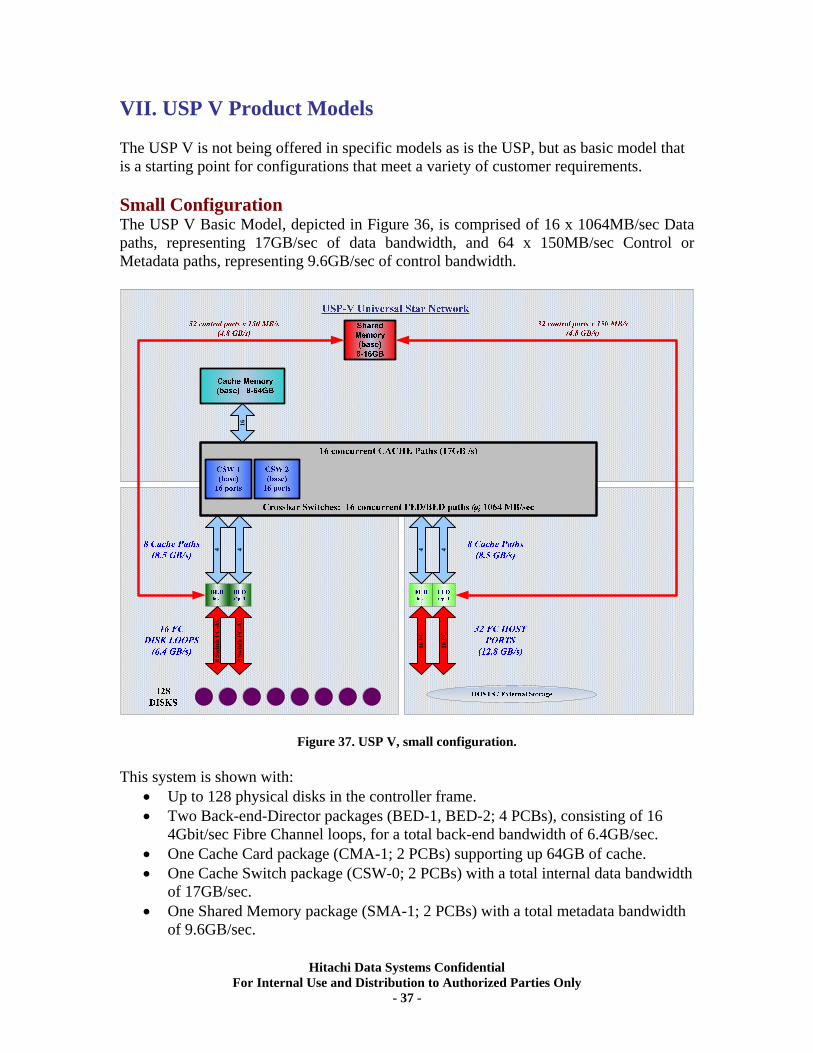
VII. USP V Product Models The USP V is not being offered in specific models as is the USP, but as basic model that is a starting point for configurations that meet a variety of customer requirements. Small Configuration The USP V Basic Model, depicted in Figure 36, is comprised of 16 x 1064MB/sec Data paths, representing 17GB/sec of data bandwidth, and 64 x 150MB/sec Control or Metadata paths, representing 9.6GB/sec of control bandwidth.
4
8 Sw
itch
FC-A
L
16 F
C
16
16 F
C4
8 Sw
itch
FC-A
L
4 4
Figure 37. USP V, small configuration. This system is shown with:
• Up to 128 physical disks in the controller frame. • Two Back-end-Director packages (BED-1, BED-2; 4 PCBs), consisting of 16
4Gbit/sec Fibre Channel loops, for a total back-end bandwidth of 6.4GB/sec. • One Cache Card package (CMA-1; 2 PCBs) supporting up 64GB of cache. • One Cache Switch package (CSW-0; 2 PCBs) with a total internal data bandwidth
of 17GB/sec. • One Shared Memory package (SMA-1; 2 PCBs) with a total metadata bandwidth
of 9.6GB/sec.
Hitachi Data Systems Confidential For Internal Use and Distribution to Authorized Parties Only
- 37 -
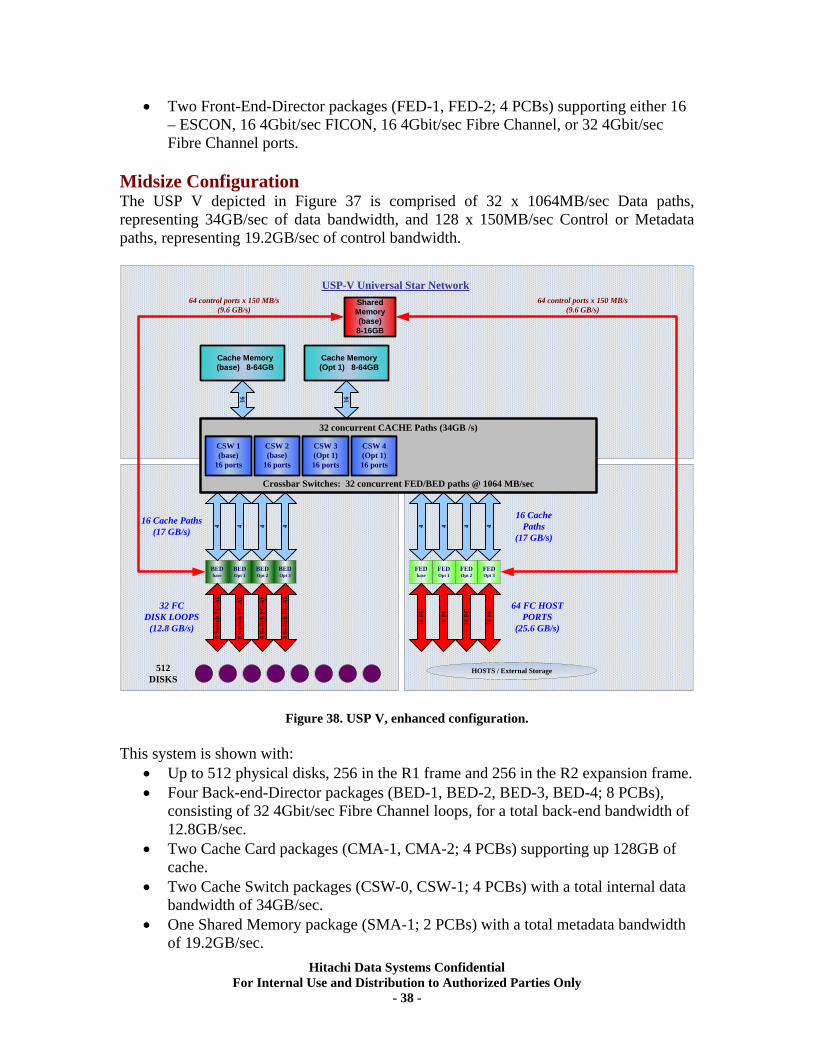
• Two Front-End-Director packages (FED-1, FED-2; 4 PCBs) supporting either 16 – ESCON, 16 4Gbit/sec FICON, 16 4Gbit/sec Fibre Channel, or 32 4Gbit/sec Fibre Channel ports.
Midsize Configuration The USP V depicted in Figure 37 is comprised of 32 x 1064MB/sec Data paths, representing 34GB/sec of data bandwidth, and 128 x 150MB/sec Control or Metadata paths, representing 19.2GB/sec of control bandwidth.
4
8 Sw
itch
FC-A
L
16 F
C
HOSTS / External Storage
USP-V Universal Star Network
512 DISKS
64 control ports x 150 MB/s(9.6 GB/s)
64 control ports x 150 MB/s(9.6 GB/s)
Shared Memory(base) 8-16GB
32 FCDISK LOOPS
(12.8 GB/s)
64 FC HOST PORTS
(25.6 GB/s)
16 Cache Paths(17 GB/s)
16 Cache Paths
(17 GB/s)
16
Cache Memory (base) 8-64GB
Cache Memory (Opt 1) 8-64GB
16
FEDOpt 1
FEDOpt 2
FEDOpt 3
16 F
C
16 F
C
16 F
C
4 4 4
FEDbase
BEDbase
BEDOpt 1
BEDOpt 2
BEDOpt 3
8 Sw
itch
FC-A
L
8 Sw
itch
FC-A
L
8 Sw
itch
FC-A
L
4 4 4 4
CSW 1 (base)
16 ports
CSW 2 (base)
16 ports
CSW 3 (Opt 1)16 ports
CSW 4 (Opt 1)16 ports
32 concurrent CACHE Paths (34GB /s)
Crossbar Switches: 32 concurrent FED/BED paths @ 1064 MB/sec
Figure 38. USP V, enhanced configuration. This system is shown with:
• Up to 512 physical disks, 256 in the R1 frame and 256 in the R2 expansion frame. • Four Back-end-Director packages (BED-1, BED-2, BED-3, BED-4; 8 PCBs),
consisting of 32 4Gbit/sec Fibre Channel loops, for a total back-end bandwidth of 12.8GB/sec.
• Two Cache Card packages (CMA-1, CMA-2; 4 PCBs) supporting up 128GB of cache.
• Two Cache Switch packages (CSW-0, CSW-1; 4 PCBs) with a total internal data bandwidth of 34GB/sec.
• One Shared Memory package (SMA-1; 2 PCBs) with a total metadata bandwidth of 19.2GB/sec.
Hitachi Data Systems Confidential For Internal Use and Distribution to Authorized Parties Only
- 38 -
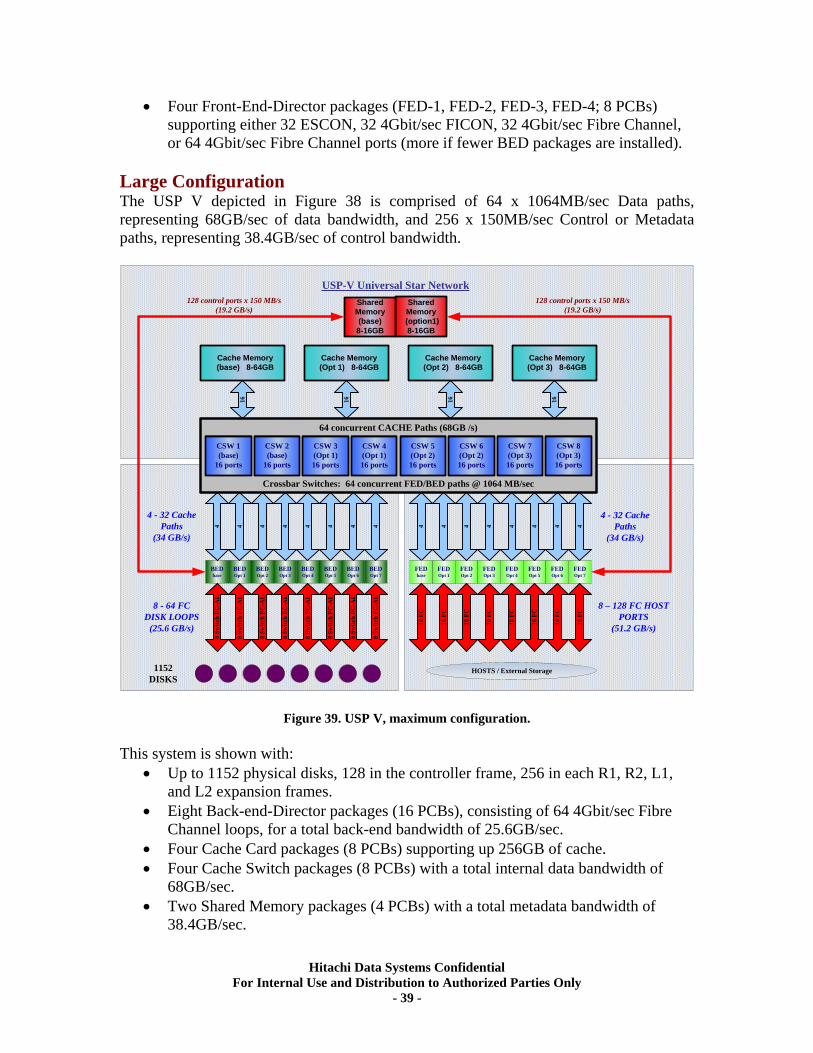
• Four Front-End-Director packages (FED-1, FED-2, FED-3, FED-4; 8 PCBs) supporting either 32 ESCON, 32 4Gbit/sec FICON, 32 4Gbit/sec Fibre Channel, or 64 4Gbit/sec Fibre Channel ports (more if fewer BED packages are installed).
Large Configuration The USP V depicted in Figure 38 is comprised of 64 x 1064MB/sec Data paths, representing 68GB/sec of data bandwidth, and 256 x 150MB/sec Control or Metadata paths, representing 38.4GB/sec of control bandwidth.
4
8 Sw
itch
FC-A
L
16 F
C
HOSTS / External Storage
USP-V Universal Star Network
1152 DISKS
128 control ports x 150 MB/s(19.2 GB/s)
128 control ports x 150 MB/s(19.2 GB/s)
Shared Memory(base) 8-16GB
Shared Memory
(option1) 8-16GB
8 - 64 FCDISK LOOPS
(25.6 GB/s)
8 – 128 FC HOST PORTS
(51.2 GB/s)
4 - 32 Cache Paths
(34 GB/s)
4 - 32 Cache Paths
(34 GB/s)
16
Cache Memory (base) 8-64GB
16
Cache Memory (Opt 1) 8-64GB
16
Cache Memory (Opt 2) 8-64GB
Cache Memory (Opt 3) 8-64GB
16
FEDOpt 1
FEDOpt 2
FEDOpt 3
FEDOpt 4
FEDOpt 5
FEDOpt 6
FEDOpt 7
16 F
C
16 F
C
16 F
C
16 F
C
16 F
C
16 F
C
16 F
C
4 4 4 4 4 4 4
FEDbase
BEDbase
BEDOpt 1
BEDOpt 2
BEDOpt 3
BEDOpt 4
BEDOpt 5
BEDOpt 6
BEDOpt 7
8 Sw
itch
FC-A
L
8 Sw
itch
FC-A
L
8 Sw
itch
FC-A
L
8 Sw
itch
FC-A
L
8 Sw
itch
FC-A
L
8 Sw
itch
FC-A
L
8 Sw
itch
FC-A
L
4 4 4 4 4 4 4 4
CSW 1 (base)
16 ports
CSW 2 (base)
16 ports
CSW 3 (Opt 1)16 ports
CSW 4 (Opt 1)16 ports
CSW 5 (Opt 2)16 ports
CSW 6 (Opt 2)16 ports
CSW 7 (Opt 3)16 ports
64 concurrent CACHE Paths (68GB /s)
Crossbar Switches: 64 concurrent FED/BED paths @ 1064 MB/sec
CSW 8 (Opt 3)16 ports
Figure 39. USP V, maximum configuration. This system is shown with:
• Up to 1152 physical disks, 128 in the controller frame, 256 in each R1, R2, L1, and L2 expansion frames.
• Eight Back-end-Director packages (16 PCBs), consisting of 64 4Gbit/sec Fibre Channel loops, for a total back-end bandwidth of 25.6GB/sec.
• Four Cache Card packages (8 PCBs) supporting up 256GB of cache. • Four Cache Switch packages (8 PCBs) with a total internal data bandwidth of
68GB/sec. • Two Shared Memory packages (4 PCBs) with a total metadata bandwidth of
38.4GB/sec.
Hitachi Data Systems Confidential For Internal Use and Distribution to Authorized Parties Only
- 39 -
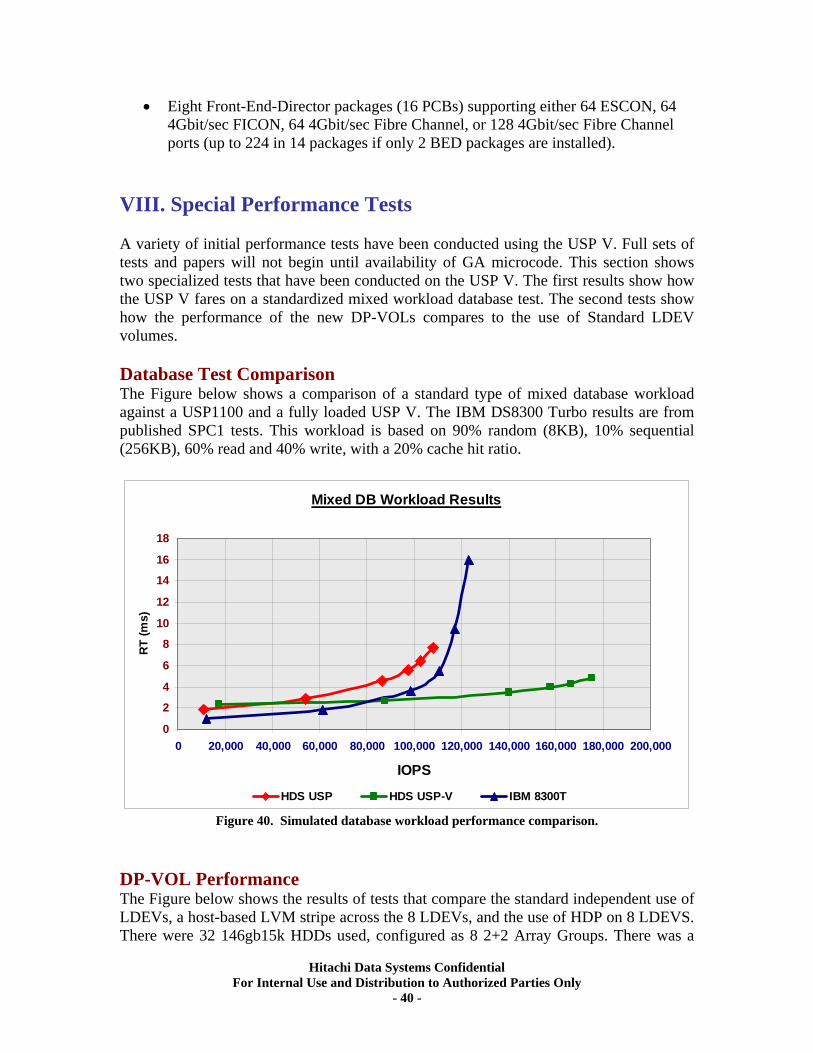
• Eight Front-End-Director packages (16 PCBs) supporting either 64 ESCON, 64 4Gbit/sec FICON, 64 4Gbit/sec Fibre Channel, or 128 4Gbit/sec Fibre Channel ports (up to 224 in 14 packages if only 2 BED packages are installed).
VIII. Special Performance Tests A variety of initial performance tests have been conducted using the USP V. Full sets of tests and papers will not begin until availability of GA microcode. This section shows two specialized tests that have been conducted on the USP V. The first results show how the USP V fares on a standardized mixed workload database test. The second tests show how the performance of the new DP-VOLs compares to the use of Standard LDEV volumes. Database Test Comparison The Figure below shows a comparison of a standard type of mixed database workload against a USP1100 and a fully loaded USP V. The IBM DS8300 Turbo results are from published SPC1 tests. This workload is based on 90% random (8KB), 10% sequential (256KB), 60% read and 40% write, with a 20% cache hit ratio.
Mixed DB Workload Results
0
2
4
6
8
10
12
14
16
18
0 20,000 40,000 60,000 80,000 100,000 120,000 140,000 160,000 180,000 200,000
IOPS
RT (m
s)
HDS USP HDS USP-V IBM 8300T
Figure 40. Simulated database workload performance comparison. DP-VOL Performance The Figure below shows the results of tests that compare the standard independent use of LDEVs, a host-based LVM stripe across the 8 LDEVs, and the use of HDP on 8 LDEVS. There were 32 146gb15k HDDs used, configured as 8 2+2 Array Groups. There was a
Hitachi Data Systems Confidential For Internal Use and Distribution to Authorized Parties Only
- 40 -
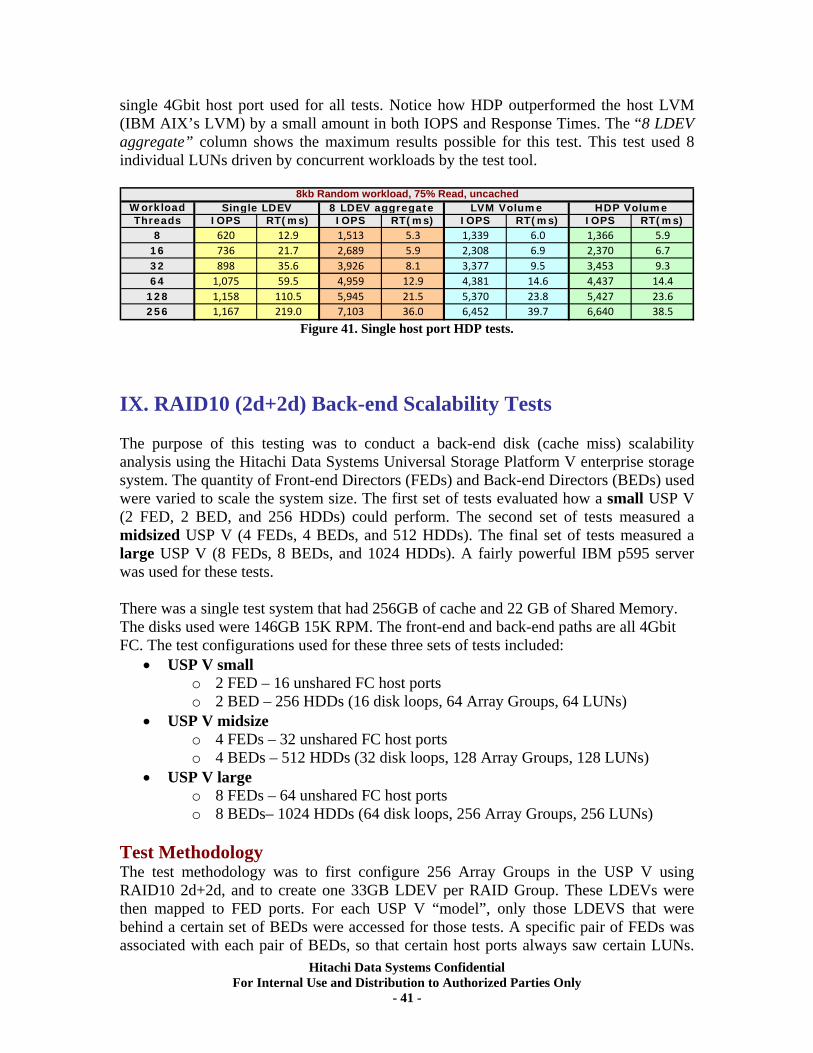
single 4Gbit host port used for all tests. Notice how HDP outperformed the host LVM (IBM AIX’s LVM) by a small amount in both IOPS and Response Times. The “8 LDEV aggregate” column shows the maximum results possible for this test. This test used 8 individual LUNs driven by concurrent workloads by the test tool.
WorkloadThreads IOPS RT(ms) IOPS RT(ms) IOPS RT(ms) IOPS RT(ms)
8 620 12.9 1,513 5.3 1,339 6.0 1,366 5.916 736 21.7 2,689 5.9 2,308 6.9 2,370 6.732 898 35.6 3,926 8.1 3,377 9.5 3,453 9.364 1,075 59.5 4,959 12.9 4,381 14.6 4,437 14.4
128 1,158 110.5 5,945 21.5 5,370 23.8 5,427 23.6256 1,167 219.0 7,103 36.0 6,452 39.7 6,640 38.5
8kb Random workload, 75% Read, uncachedSingle LDEV 8 LDEV aggregate LVM Volume HDP Volume
Figure 41. Single host port HDP tests.
IX. RAID10 (2d+2d) Back-end Scalability Tests The purpose of this testing was to conduct a back-end disk (cache miss) scalability analysis using the Hitachi Data Systems Universal Storage Platform V enterprise storage system. The quantity of Front-end Directors (FEDs) and Back-end Directors (BEDs) used were varied to scale the system size. The first set of tests evaluated how a small USP V (2 FED, 2 BED, and 256 HDDs) could perform. The second set of tests measured a midsized USP V (4 FEDs, 4 BEDs, and 512 HDDs). The final set of tests measured a large USP V (8 FEDs, 8 BEDs, and 1024 HDDs). A fairly powerful IBM p595 server was used for these tests. There was a single test system that had 256GB of cache and 22 GB of Shared Memory. The disks used were 146GB 15K RPM. The front-end and back-end paths are all 4Gbit FC. The test configurations used for these three sets of tests included:
• USP V small o 2 FED – 16 unshared FC host ports o 2 BED – 256 HDDs (16 disk loops, 64 Array Groups, 64 LUNs)
• USP V midsize o 4 FEDs – 32 unshared FC host ports o 4 BEDs – 512 HDDs (32 disk loops, 128 Array Groups, 128 LUNs)
• USP V large o 8 FEDs – 64 unshared FC host ports o 8 BEDs– 1024 HDDs (64 disk loops, 256 Array Groups, 256 LUNs)
Test Methodology The test methodology was to first configure 256 Array Groups in the USP V using RAID10 2d+2d, and to create one 33GB LDEV per RAID Group. These LDEVs were then mapped to FED ports. For each USP V “model”, only those LDEVS that were behind a certain set of BEDs were accessed for those tests. A specific pair of FEDs was associated with each pair of BEDs, so that certain host ports always saw certain LUNs.
Hitachi Data Systems Confidential For Internal Use and Distribution to Authorized Parties Only
- 41 -
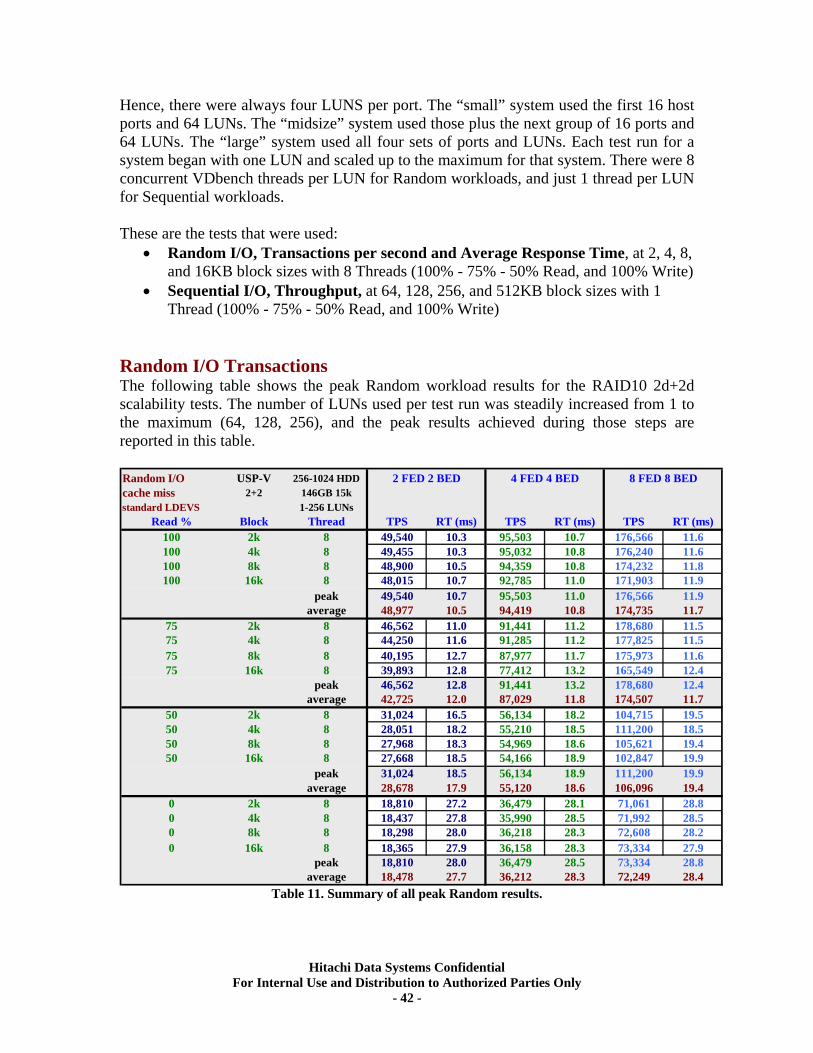
Hence, there were always four LUNS per port. The “small” system used the first 16 host ports and 64 LUNs. The “midsize” system used those plus the next group of 16 ports and 64 LUNs. The “large” system used all four sets of ports and LUNs. Each test run for a system began with one LUN and scaled up to the maximum for that system. There were 8 concurrent VDbench threads per LUN for Random workloads, and just 1 thread per LUN for Sequential workloads. These are the tests that were used:
• Random I/O, Transactions per second and Average Response Time, at 2, 4, 8, and 16KB block sizes with 8 Threads (100% - 75% - 50% Read, and 100% Write)
• Sequential I/O, Throughput, at 64, 128, 256, and 512KB block sizes with 1 Thread (100% - 75% - 50% Read, and 100% Write)
Random I/O Transactions The following table shows the peak Random workload results for the RAID10 2d+2d scalability tests. The number of LUNs used per test run was steadily increased from 1 to the maximum (64, 128, 256), and the peak results achieved during those steps are reported in this table. Random I/Ocache missstandard LDEVS
48,977 10.5 94,419 10.8 174,735 11.7
42,725 12.0 87,029 11.8 174,507 11.7
28,678 17.9 55,120 18.6 106,096 19.4
18,478 27.7 36,212 28.3 72,249 28.4
USP-V 256-1024 HDD2+2 146GB 15k
1-256 LUNsRead % Block Thread TPS RT (ms) TPS RT (ms) TPS RT (ms)
100 2k 8 49,540 10.3 95,503 10.7 176,566 11.6100 4k 8 49,455 10.3 95,032 10.8 176,240 11.6100 8k 8 48,900 10.5 94,359 10.8 174,232 11.8100 16k 8 48,015 10.7 92,785 11.0 171,903 11.9
peak 49,540 10.7 95,503 11.0 176,566 11.9average
75 2k 8 46,562 11.0 91,441 11.2 178,680 11.575 4k 8 44,250 11.6 91,285 11.2 177,825 11.575 8k 8 40,195 12.7 87,977 11.7 175,973 11.675 16k 8 39,893 12.8 77,412 13.2 165,549 12.4
peak 46,562 12.8 91,441 13.2 178,680 12.4average
50 2k 8 31,024 16.5 56,134 18.2 104,715 19.550 4k 8 28,051 18.2 55,210 18.5 111,200 18.550 8k 8 27,968 18.3 54,969 18.6 105,621 19.450 16k 8 27,668 18.5 54,166 18.9 102,847 19.9
peak 31,024 18.5 56,134 18.9 111,200 19.9average
0 2k 8 18,810 27.2 36,479 28.1 71,061 28.80 4k 8 18,437 27.8 35,990 28.5 71,992 28.50 8k 8 18,298 28.0 36,218 28.3 72,608 28.20 16k 8 18,365 27.9 36,158 28.3 73,334 27.9
peak 18,810 28.0 36,479 28.5 73,334 28.8average
2 FED 2 BED 4 FED 4 BED 8 FED 8 BED
Table 11. Summary of all peak Random results.
Hitachi Data Systems Confidential For Internal Use and Distribution to Authorized Parties Only
- 42 -
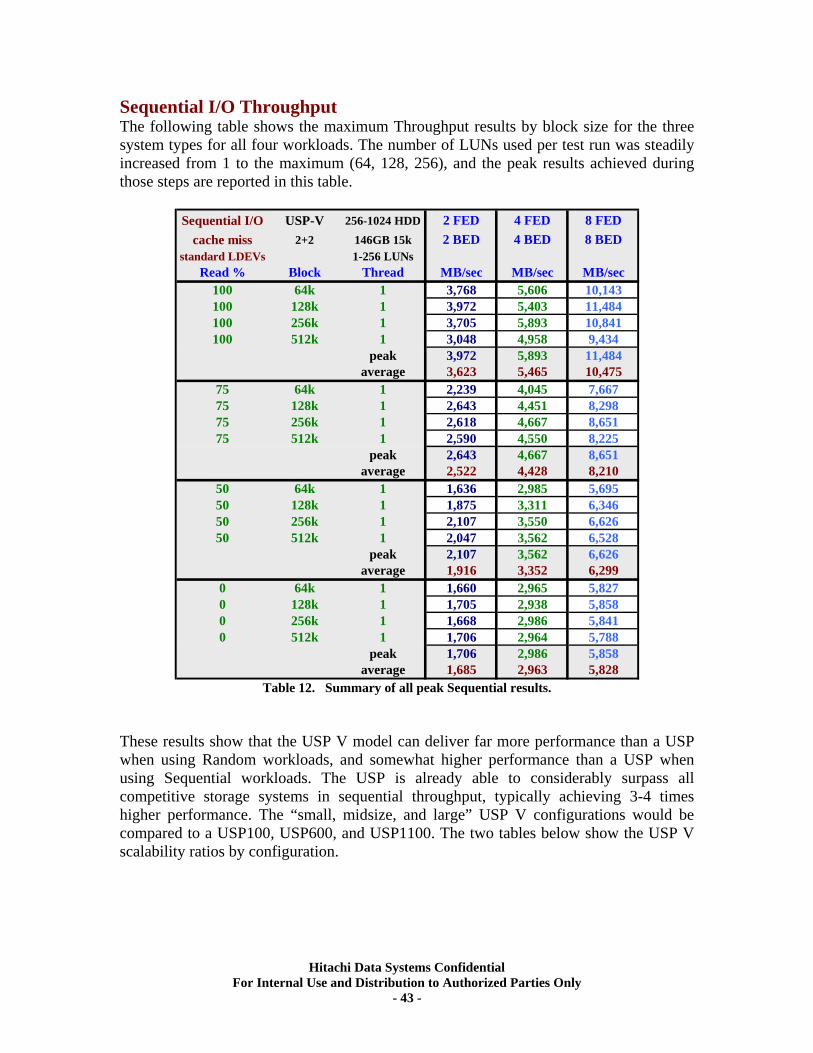
Sequential I/O Throughput The following table shows the maximum Throughput results by block size for the three system types for all four workloads. The number of LUNs used per test run was steadily increased from 1 to the maximum (64, 128, 256), and the peak results achieved during those steps are reported in this table.
Sequential I/Ocache miss
standard LDEVs
USP-V 256-1024 HDD 2 FED 4 FED 8 FED2+2 146GB 15k 2 BED 4 BED 8 BED
1-256 LUNsRead % Block Thread MB/sec MB/sec MB/sec
100 64k 1 3,768 5,606 10,143100 128k 1 3,972 5,403 11,484100 256k 1 3,705 5,893 10,841100 512k 1 3,048 4,958 9,434
peak 3,972 5,893 11,484average
75 64k 1 2,239 4,045 7,66775 128k 1 2,643 4,451 8,29875 256k 1 2,618 4,667 8,65175 512k 1 2,590 4,550 8,225
peak 2,643 4,667 8,651average
50 64k 1 1,636 2,985 5,69550 128k 1 1,875 3,311 6,34650 256k 1 2,107 3,550 6,62650 512k 1 2,047 3,562 6,528
peak 2,107 3,562 6,626average
0 64k 1 1,660 2,965 5,8270 128k 1 1,705 2,938 5,8580 256k 1 1,668 2,986 5,8410 512k 1 1,706 2,964 5,788
peak 1,706 2,986 5,858average
3,623 5,465 10,475
2,522 4,428 8,210
1,916 3,352 6,299
1,685 2,963 5,828 Table 12. Summary of all peak Sequential results.
These results show that the USP V model can deliver far more performance than a USP when using Random workloads, and somewhat higher performance than a USP when using Sequential workloads. The USP is already able to considerably surpass all competitive storage systems in sequential throughput, typically achieving 3-4 times higher performance. The “small, midsize, and large” USP V configurations would be compared to a USP100, USP600, and USP1100. The two tables below show the USP V scalability ratios by configuration.
Hitachi Data Systems Confidential For Internal Use and Distribution to Authorized Parties Only
- 43 -
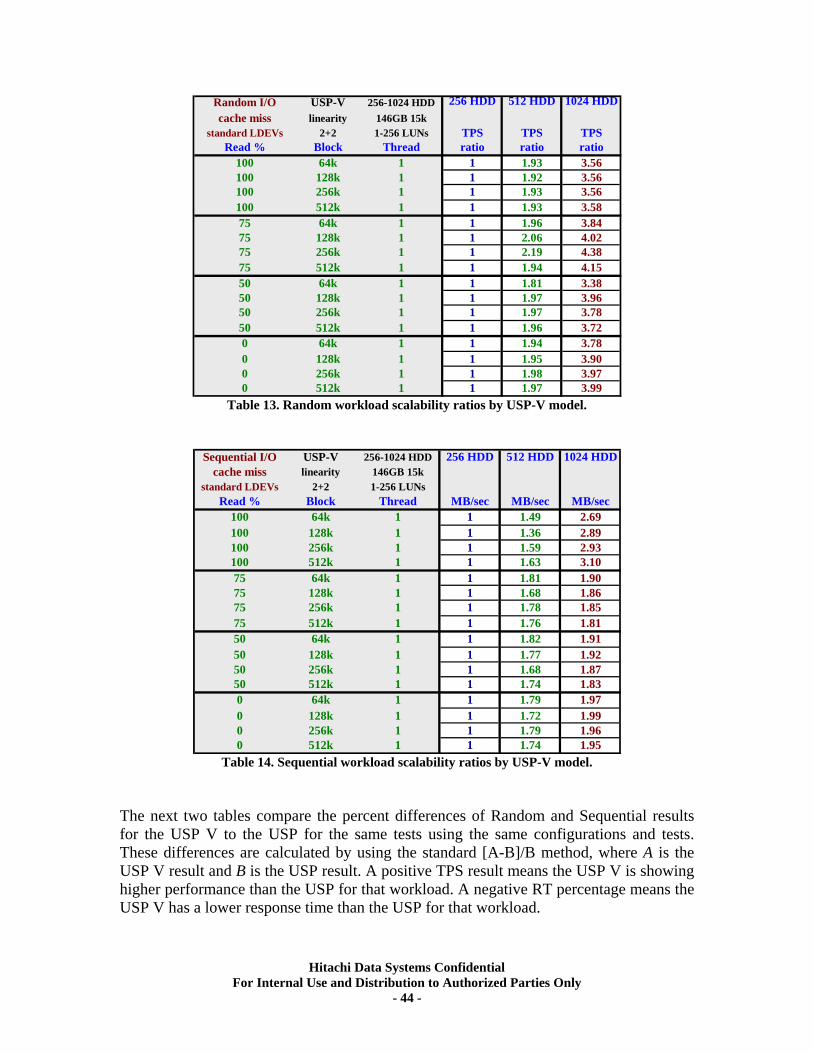
Random I/Ocache miss
standard LDEVs
3.563.563.563.583.844.024.384.153.383.963.783.723.783.903.973.99
USP-V 256-1024 HDD 256 HDD 512 HDD 1024 HDDlinearity 146GB 15k
2+2 1-256 LUNs TPS TPS TPSRead % Block Thread ratio ratio ratio
100 64k 1 1 1.93100 128k 1 1 1.92100 256k 1 1 1.93100 512k 1 1 1.9375 64k 1 1 1.9675 128k 1 1 2.0675 256k 1 1 2.1975 512k 1 1 1.9450 64k 1 1 1.8150 128k 1 1 1.9750 256k 1 1 1.9750 512k 1 1 1.960 64k 1 1 1.940 128k 1 1 1.950 256k 1 1 1.980 512k 1 1 1.97
Table 13. Random workload scalability ratios by USP-V model.
Sequential I/Ocache miss
standard LDEVs
2.692.892.933.101.901.861.851.811.911.921.871.831.971.991.961.95
USP-V 256-1024 HDD 256 HDD 512 HDD 1024 HDDlinearity 146GB 15k
2+2 1-256 LUNsRead % Block Thread MB/sec MB/sec MB/sec
100 64k 1 1 1.49100 128k 1 1 1.36100 256k 1 1 1.59100 512k 1 1 1.6375 64k 1 1 1.8175 128k 1 1 1.6875 256k 1 1 1.7875 512k 1 1 1.7650 64k 1 1 1.8250 128k 1 1 1.7750 256k 1 1 1.6850 512k 1 1 1.740 64k 1 1 1.790 128k 1 1 1.720 256k 1 1 1.790 512k 1 1 1.74
Table 14. Sequential workload scalability ratios by USP-V model. The next two tables compare the percent differences of Random and Sequential results for the USP V to the USP for the same tests using the same configurations and tests. These differences are calculated by using the standard [A-B]/B method, where A is the USP V result and B is the USP result. A positive TPS result means the USP V is showing higher performance than the USP for that workload. A negative RT percentage means the USP V has a lower response time than the USP for that workload.
Hitachi Data Systems Confidential For Internal Use and Distribution to Authorized Parties Only
- 44 -
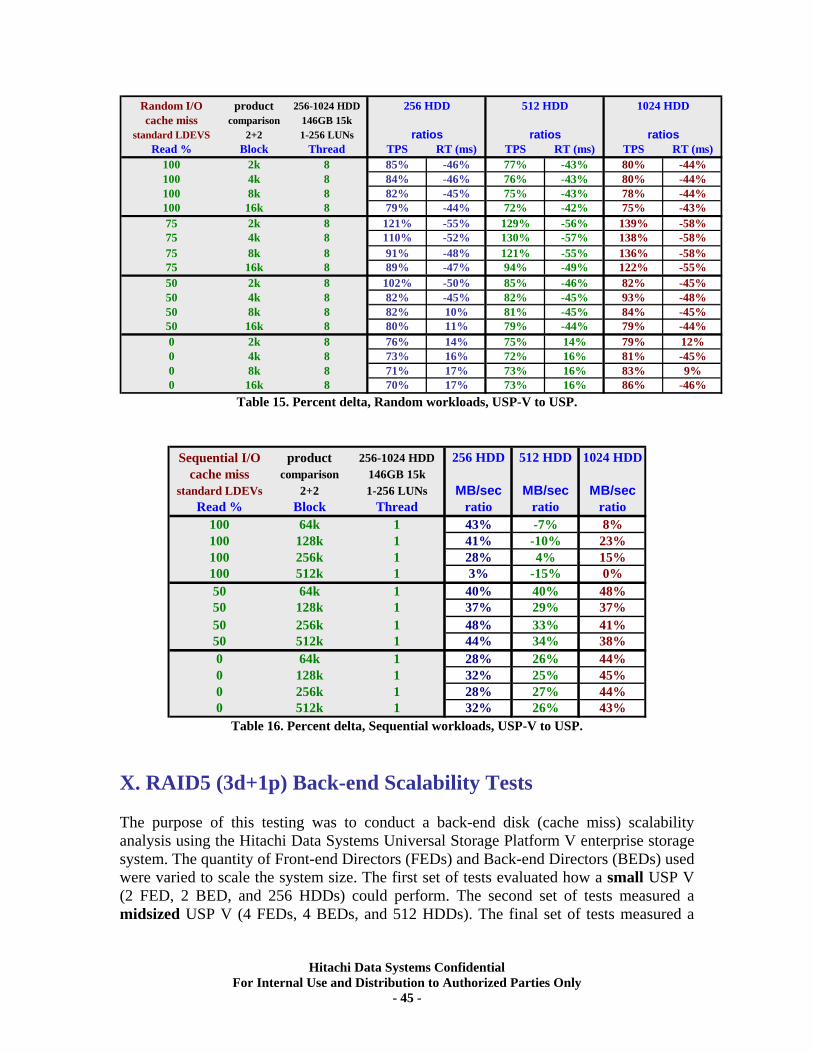
Random I/Ocache miss
standard LDEVS
80% -44%80% -44%78% -44%75% -43%
139% -58%138% -58%136% -58%122% -55%82% -45%93% -48%84% -45%79% -44%79% 12%81% -45%83% 9%86% -46%
product 256-1024 HDDcomparison 146GB 15k
2+2 1-256 LUNsRead % Block Thread TPS RT (ms) TPS RT (ms) TPS RT (ms)
100 2k 8 85% -46% 77% -43%100 4k 8 84% -46% 76% -43%100 8k 8 82% -45% 75% -43%100 16k 8 79% -44% 72% -42%75 2k 8 121% -55% 129% -56%75 4k 8 110% -52% 130% -57%75 8k 8 91% -48% 121% -55%75 16k 8 89% -47% 94% -49%50 2k 8 102% -50% 85% -46%50 4k 8 82% -45% 82% -45%50 8k 8 82% 10% 81% -45%50 16k 8 80% 11% 79% -44%0 2k 8 76% 14% 75% 14%0 4k 8 73% 16% 72% 16%0 8k 8 71% 17% 73% 16%0 16k 8 70% 17% 73% 16%
ratios ratios
512 HDD 1024 HDD256 HDD
ratios
Table 15. Percent delta, Random workloads, USP-V to USP.
Sequential I/Ocache miss
standard LDEVs
product 256-1024 HDD 256 HDD 512 HDD 1024 HDDcomparison 146GB 15k
2+2 1-256 LUNs MB/sec MB/sec MB/secRead % Block Thread ratio ratio ratio
100 64k 1 43% -7%100 128k 1 41% -10%100 256k 1 28% 4%100 512
8%23%15%
k 1 3% -15%50 64k 1 40% 40%50 128
0%48%
k 1 37% 29%50 256k 1 48% 33%50 512
37%41%
k 1 44% 34%0 64k 1 28% 26%0 128k 1 32% 25%0 256k 1 28% 27%0 512
38%44%45%44%
k 1 32% 26% 43% Table 16. Percent delta, Sequential workloads, USP-V to USP.
X. RAID5 (3d+1p) Back-end Scalability Tests The purpose of this testing was to conduct a back-end disk (cache miss) scalability analysis using the Hitachi Data Systems Universal Storage Platform V enterprise storage system. The quantity of Front-end Directors (FEDs) and Back-end Directors (BEDs) used were varied to scale the system size. The first set of tests evaluated how a small USP V (2 FED, 2 BED, and 256 HDDs) could perform. The second set of tests measured a midsized USP V (4 FEDs, 4 BEDs, and 512 HDDs). The final set of tests measured a
Hitachi Data Systems Confidential For Internal Use and Distribution to Authorized Parties Only
- 45 -
large USP V (8 FEDs, 8 BEDs, and 1024 HDDs). A fairly powerful IBM p595 server was used for these tests. There was a single test system that had 256GB of cache and 22 GB of Shared Memory. The disks used were 146GB 15K RPM. The front-end and back-end paths are all 4Gbit FC. The test configurations used for these three sets of tests included:
• USP V small o 2 FED – 16 unshared FC host ports o 2 BED – 256 HDDs (16 disk loops, 64 Array Groups, 64 LUNs)
• USP V midsize o 4 FEDs – 32 unshared FC host ports o 4 BEDs – 512 HDDs (32 disk loops, 128 Array Groups, 128 LUNs)
• USP V large o 8 FEDs – 64 unshared FC host ports o 8 BEDs– 1024 HDDs (64 disk loops, 256 Array Groups, 256 LUNs)
Test Methodology The test methodology was to first configure 256 Array Groups in the USP V using RAID5 3d+1p, and to create one 33GB LDEV per RAID Group. These LDEVs were then mapped to FED ports. For each USP V “model”, only those LDEVS that were behind a certain set of BEDs were accessed for those tests. A specific pair of FEDs was associated with each pair of BEDs, so that certain host ports always saw certain LUNs. Hence, there were always four LUNS per port. The “small” system used the first 16 host ports and 64 LUNs. The “midsize” system used those plus the next group of 16 ports and 64 LUNs. The “large” system used all four sets of ports and LUNs. Each test run for a system began with one LUN and scaled up to the maximum for that system. There were 8 concurrent VDbench threads per LUN for Random workloads, and just 1 thread per LUN for Sequential workloads. These are the tests that were used:
• Random I/O, Transactions per second and Average Response Time, at 2, 4, 8, and 16KB block sizes with 8 Threads (100% - 75% - 50% Read, and 100% Write)
• Sequential I/O, Throughput, at 64, 128, 256, and 512KB block sizes with 1 Thread (100% - 75% - 50% Read, and 100% Write)
Random I/O Transactions The following table shows the peak Random workload results for the RAID5 3d+1p scalability tests. The number of LUNs used per test run was steadily increased from 1 to the maximum (64, 128, 256), and the peak results achieved during those steps are reported in this table.
Hitachi Data Systems Confidential For Internal Use and Distribution to Authorized Parties Only
- 46 -
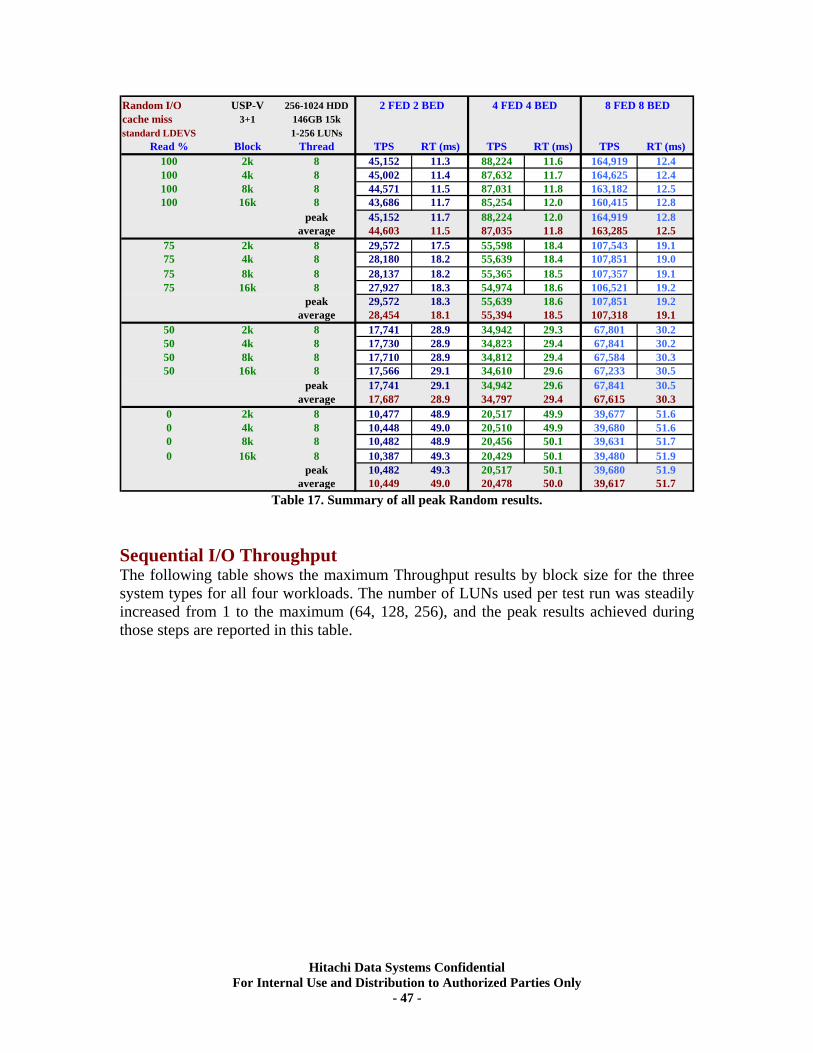
Random I/Ocache missstandard LDEVS
USP-V 256-1024 HDD3+1 146GB 15k
1-256 LUNsRead % Block Thread TPS RT (ms) TPS RT (ms) TPS RT (ms)
100 2k 8 45,152 11.3 88,224 11.6 164,919 12.4100 4k 8 45,002 11.4 87,632 11.7 164,625 12.4100 8k 8 44,571 11.5 87,031 11.8 163,182 12.5100 16k 8 43,686 11.7 85,254 12.0 160,415 12.8
peak 45,152 11.7 88,224 12.0 164,919 12.8average
75 2k 8 29,572 17.5 55,598 18.4 107,543 19.175 4k 8 28,180 18.2 55,639 18.4 107,851 19.075 8k 8 28,137 18.2 55,365 18.5 107,357 19.175 16k 8 27,927 18.3 54,974 18.6 106,521 19.2
peak 29,572 18.3 55,639 18.6 107,851 19.2avera
44,603 11.5 87,035 11.8 163,285 12.5
ge50 2k 8 17,741 28.9 34,942 29.3 67,801 30.250 4k 8 17,730 28.9 34,823 29.4 67,841 30.250 8k 8 17,710 28.9 34,812 29.4 67,584 30.350 16k 8 17,566 29.1 34,610 29.6 67,233 30.5
peak 17,741 29.1 34,942 29.6 67,841 30.5avera
28,454 18.1 55,394 18.5 107,318 19.1
ge0 2k 8 10,477 48.9 20,517 49.9 39,677 51.60 4k 8 10,448 49.0 20,510 49.9 39,680 51.60 8k 8 10,482 48.9 20,456 50.1 39,631 51.70 16k 8 10,387 49.3 20,429 50.1 39,480 51.9
peak 10,482 49.3 20,517 50.1 39,680 51.9avera
17,687 28.9 34,797 29.4 67,615 30.3
e
2 FED 2 BED 4 FED 4 BED 8 FED 8 BED
10,449 49.0 20,478 50.0 39,617 51.7g Table 17. Summary of all peak Random results.
Sequential I/O Throughput The following table shows the maximum Throughput results by block size for the three system types for all four workloads. The number of LUNs used per test run was steadily increased from 1 to the maximum (64, 128, 256), and the peak results achieved during those steps are reported in this table.
Hitachi Data Systems Confidential For Internal Use and Distribution to Authorized Parties Only
- 47 -
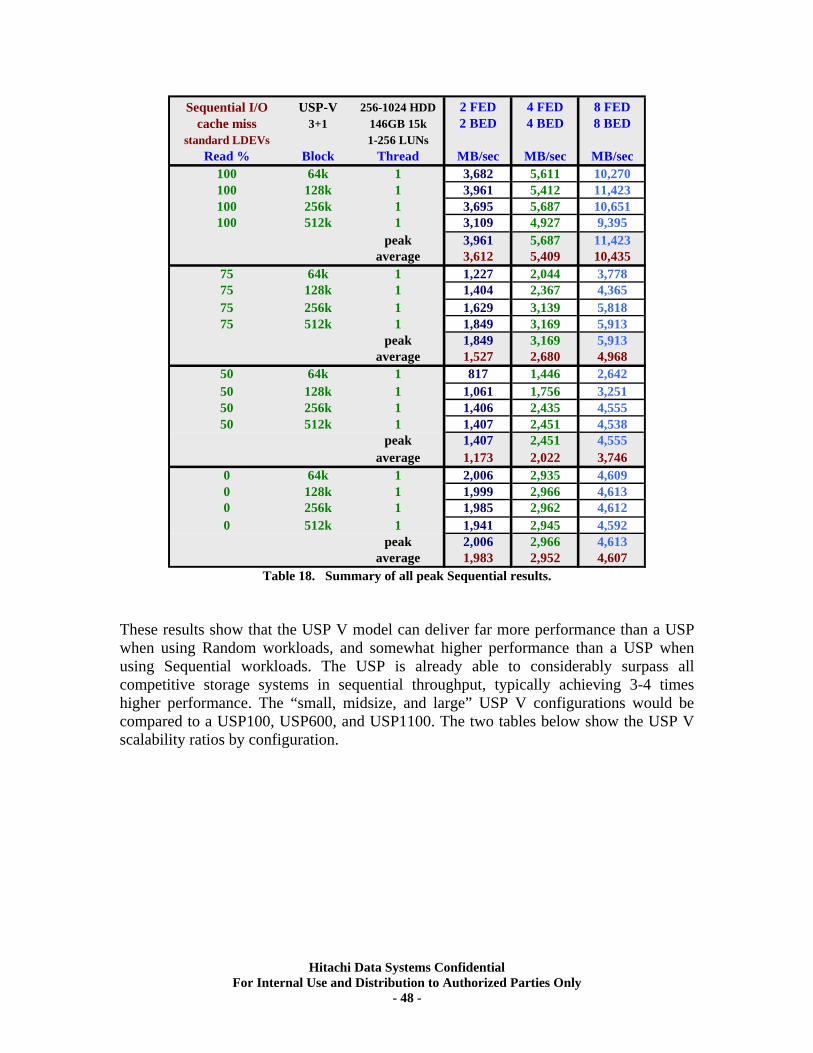
Sequential I/Ocache miss
standard LDEVs
USP-V 256-1024 HDD 2 FED 4 FED 8 FED3+1 146GB 15k 2 BED 4 BED 8 BED
1-256 LUNsRead % Block Thread MB/sec MB/sec MB/sec
100 64k 1 3,682 5,611 10,270100 128k 1 3,961 5,412 11,423100 256k 1 3,695 5,687 10,651100 512k 1 3,109 4,927 9,395
peak 3,961 5,687 11,423average
75 64k 1 1,227 2,044 3,77875 128
3,612 5,409 10,435
k 1 1,404 2,367 4,36575 256k 1 1,629 3,139 5,81875 512k 1 1,849 3,169 5,913
peak 1,849 3,169 5,913average
50 641,527 2,680 4,968
k 1 817 1,446 2,64250 128k 1 1,061 1,756 3,25150 256k 1 1,406 2,435 4,55550 512k 1 1,407 2,451 4,538
peak 1,407 2,451 4,555average
0 64k 1 2,006 2,935 4,6090 128k 1 1,999 2,966 4,6130 256
1,173 2,022 3,746
k 1 1,985 2,962 4,6120 512k 1 1,941 2,945 4,592
peak 2,006 2,966 4,613average 1,983 2,952 4,607
Table 18. Summary of all peak Sequential results.
These results show that the USP V model can deliver far more performance than a USP when using Random workloads, and somewhat higher performance than a USP when using Sequential workloads. The USP is already able to considerably surpass all competitive storage systems in sequential throughput, typically achieving 3-4 times higher performance. The “small, midsize, and large” USP V configurations would be compared to a USP100, USP600, and USP1100. The two tables below show the USP V scalability ratios by configuration.
Hitachi Data Systems Confidential For Internal Use and Distribution to Authorized Parties Only
- 48 -
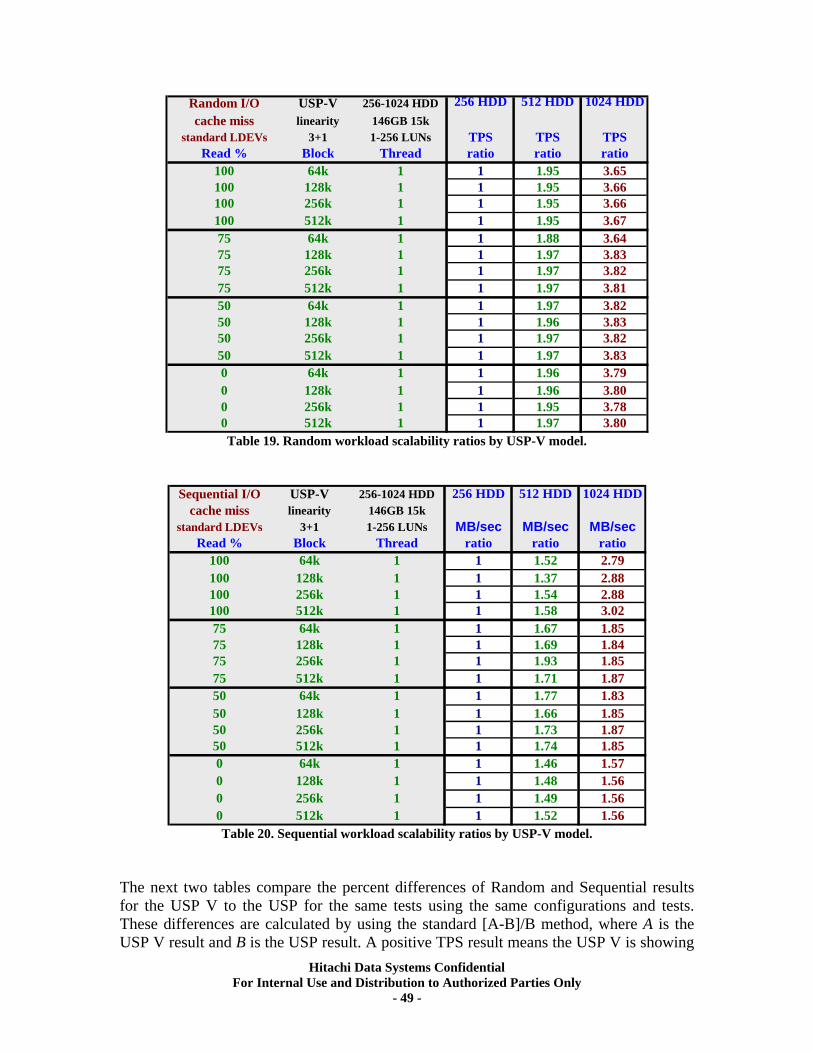
Random I/Ocache miss
standard LDEVs
USP-V 256-1024 HDD 256 HDD 512 HDD 1024 HDDlinearity 146GB 15k
3+1 1-256 LUNs TPS TPS TPSRead % Block Thread ratio ratio ratio
100 64k 1 1 1.95100 128k 1 1 1.95100 256
3.653.66
k 1 1 1.95100 512
3.66k 1 1 1.95
75 64k 1 1 1.8875 128k 1 1 1.9775 256
3.673.643.83
k 1 1 1.9775 512
3.82k 1 1 1.97
50 64k 1 1 1.9750 128k 1 1 1.9650 256
3.813.823.83
k 1 1 1.9750 512
3.82k 1 1 1.97
0 643.83
k 1 1 1.960 128k 1 1 1.960 256k 1 1 1.950 512
3.793.803.78
k 1 1 1.97 3.80 Table 19. Random workload scalability ratios by USP-V model.
Sequential I/Ocache miss
standard LDEVs
USP-V 256-1024 HDD 256 HDD 512 HDD 1024 HDDlinearity 146GB 15k
3+1 1-256 LUNs MB/sec MB/sec MB/secRead % Block Thread ratio ratio ratio
100 64k 1 1 1.52100 128k 1 1 1.37100 256k 1 1 1.54100 512
2.792.882.88
k 1 1 1.5875 64k 1 1 1.6775 128k 1 1 1.6975 256
3.021.851.84
k 1 1 1.9375 512
1.85k 1 1 1.71
50 641.87
k 1 1 1.7750 128k 1 1 1.6650 256k 1 1 1.7350 512
1.831.851.87
k 1 1 1.740 64
1.85k 1 1 1.46
0 1281.57
k 1 1 1.480 256
1.56k 1 1 1.49
0 5121.56
k 1 1 1.52 1.56 Table 20. Sequential workload scalability ratios by USP-V model.
The next two tables compare the percent differences of Random and Sequential results for the USP V to the USP for the same tests using the same configurations and tests. These differences are calculated by using the standard [A-B]/B method, where A is the USP V result and B is the USP result. A positive TPS result means the USP V is showing
Hitachi Data Systems Confidential For Internal Use and Distribution to Authorized Parties Only
- 49 -
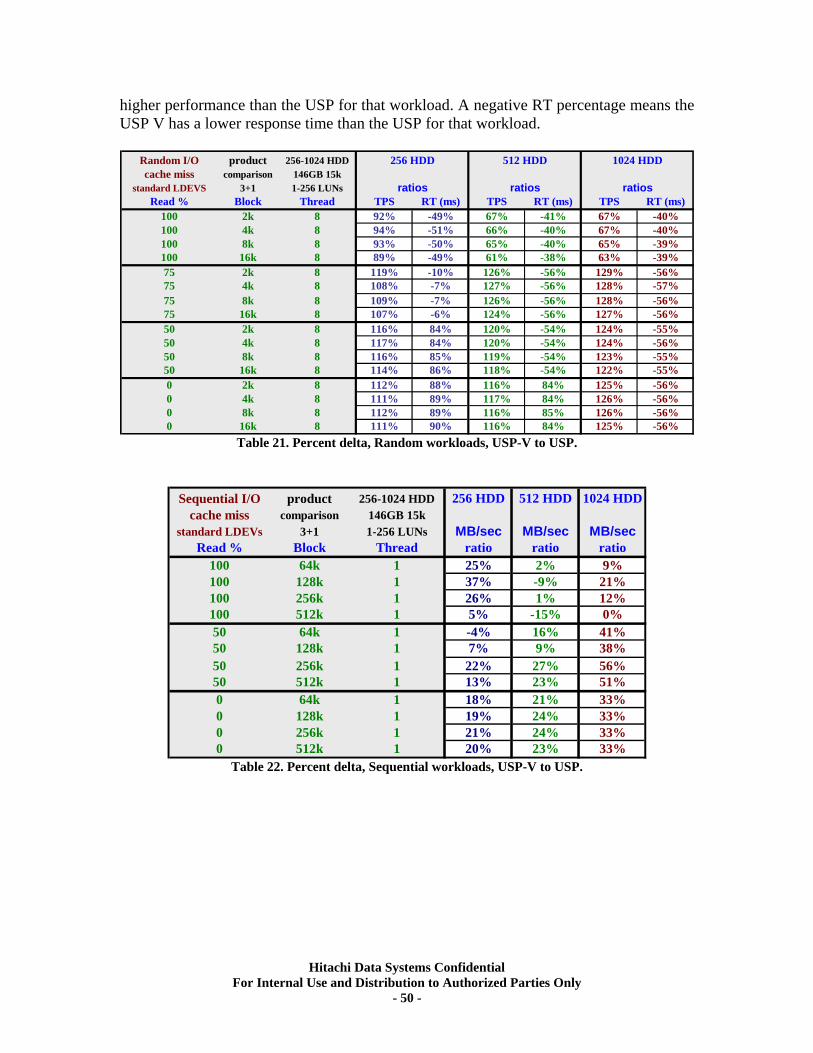
higher performance than the USP for that workload. A negative RT percentage means the USP V has a lower response time than the USP for that workload.
Random I/Ocache miss
standard LDEVS
67% -40%67% -40%65% -39%63% -39%
129% -56%128% -57%128% -56%127% -56%124% -55%124% -56%123% -55%122% -55%125% -56%126% -56%126% -56%125% -56%
product 256-1024 HDDcomparison 146GB 15k
3+1 1-256 LUNsRead % Block Thread TPS RT (ms) TPS RT (ms) TPS RT (ms)
100 2k 8 92% -49% 67% -41%100 4k 8 94% -51% 66% -40%100 8k 8 93% -50% 65% -40%100 16k 8 89% -49% 61% -38%75 2k 8 119% -10% 126% -56%75 4k 8 108% -7% 127% -56%75 8k 8 109% -7% 126% -56%75 16k 8 107% -6% 124% -56%50 2k 8 116% 84% 120% -54%50 4k 8 117% 84% 120% -54%50 8k 8 116% 85% 119% -54%50 16k 8 114% 86% 118% -54%0 2k 8 112% 88% 116% 84%0 4k 8 111% 89% 117% 84%0 8k 8 112% 89% 116% 85%0 16k 8 111% 90% 116% 84%
ratios ratios
512 HDD 1024 HDD256 HDD
ratios
Table 21. Percent delta, Random workloads, USP-V to USP.
Sequential I/Ocache miss
standard LDEVs
product 256-1024 HDD 256 HDD 512 HDD 1024 HDDcomparison 146GB 15k
3+1 1-256 LUNs MB/sec MB/sec MB/secRead % Block Thread ratio ratio ratio
100 64k 1 25% 2%100 128k 1 37% -9%100 256k 1 26% 1%100 512
9%21%12%
k 1 5% -15%50 64k 1 -4% 16%50 128
0%41%
k 1 7% 9%50 256k 1 22% 27%50 512
38%56%
k 1 13% 23%0 64k 1 18% 21%0 128k 1 19% 24%0 256k 1 21% 24%0 512
51%33%33%33%
k 1 20% 23% 33% Table 22. Percent delta, Sequential workloads, USP-V to USP.
Hitachi Data Systems Confidential For Internal Use and Distribution to Authorized Parties Only
- 50 -
XI. RAID5 (7d+1p) Back-end Scalability Tests The purpose of this testing was to conduct a back-end disk (cache miss) scalability analysis using the Hitachi Data Systems Universal Storage Platform V enterprise storage system. The quantity of Front-end Directors (FEDs) and Back-end Directors (BEDs) used were varied to scale the system size. The first set of tests evaluated how a small USP V (2 FED, 2 BED, and 256 HDDs) could perform. The second set of tests measured a midsized USP V (4 FEDs, 4 BEDs, and 512 HDDs). The final set of tests measured a large USP V (8 FEDs, 8 BEDs, and 1024 HDDs). A fairly powerful IBM p595 server was used for these tests. There was a single test system that had 256GB of cache and 22 GB of Shared Memory. The disks used were 146GB 15K RPM. The front-end and back-end paths are all 4Gbit FC. The test configurations used for these three sets of tests included:
• USP V small o 2 FED – 16 unshared FC host ports o 2 BED – 256 HDDs (16 disk loops, 32 Array Groups, 32 LUNs)
• USP V midsize o 4 FEDs – 32 unshared FC host ports o 4 BEDs – 512 HDDs (32 disk loops, 64 Array Groups, 64 LUNs)
• USP V large o 8 FEDs – 64 unshared FC host ports o 8 BEDs– 1024 HDDs (64 disk loops, 128 Array Groups, 128 LUNs)
Test Methodology The test methodology was to first configure 128 Array Groups in the USP V using RAID5 7d+1p, and to create one 33GB LDEV per RAID Group. These LDEVs were then mapped to FED ports. For each USP V “model”, only those LDEVS that were behind a certain set of BEDs were accessed for those tests. A specific pair of FEDs was associated with each pair of BEDs, so that certain host ports always saw certain LUNs. Hence, there were always four LUNS per port. The “small” system used the first 16 host ports and 32 LUNs. The “midsize” system used 32 ports and 64 LUNs. The “large” system used all 128 ports and 128 LUNs. Each test run for a system began with one LUN and scaled up to the maximum for that system. There were 8 concurrent VDbench threads per LUN for Random workloads, and just 1 thread per LUN for Sequential workloads. These are the tests that were used:
• Random I/O, Transactions per second and Average Response Time, at 2, 4, 8, and 16KB block sizes with 8 Threads (100% - 75% - 50% Read, and 100% Write)
• Sequential I/O, Throughput, at 64, 128, 256, and 512KB block sizes with 1 Thread (100% - 75% - 50% Read, and 100% Write)
Hitachi Data Systems Confidential For Internal Use and Distribution to Authorized Parties Only
- 51 -
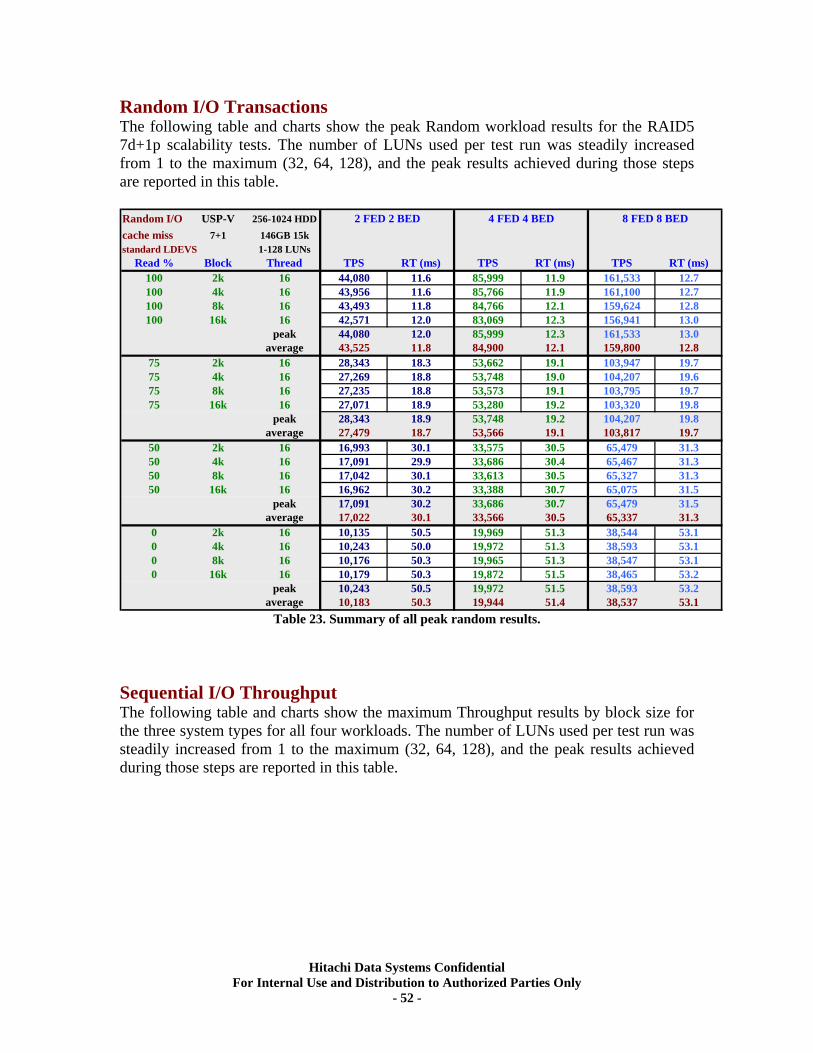
Random I/O Transactions The following table and charts show the peak Random workload results for the RAID5 7d+1p scalability tests. The number of LUNs used per test run was steadily increased from 1 to the maximum (32, 64, 128), and the peak results achieved during those steps are reported in this table. Random I/Ocache missstandard LDEVS
43,525 11.8 84,900 12.1 159,800 12.8
27,479 18.7 53,566 19.1 103,817 19.7
17,022 30.1 33,566 30.5 65,337 31.3
10,183 50.3 19,944 51.4 38,537 53.1
USP-V 256-1024 HDD7+1 146GB 15k
1-128 LUNsRead % Block Thread TPS RT (ms) TPS RT (ms) TPS RT (ms)
100 2k 16 44,080 11.6 85,999 11.9 161,533 12.7100 4k 16 43,956 11.6 85,766 11.9 161,100 12.7100 8k 16 43,493 11.8 84,766 12.1 159,624 12.8100 16k 16 42,571 12.0 83,069 12.3 156,941 13.0
peak 44,080 12.0 85,999 12.3 161,533 13.0average
75 2k 16 28,343 18.3 53,662 19.1 103,947 19.775 4k 16 27,269 18.8 53,748 19.0 104,207 19.675 8k 16 27,235 18.8 53,573 19.1 103,795 19.775 16k 16 27,071 18.9 53,280 19.2 103,320 19.8
peak 28,343 18.9 53,748 19.2 104,207 19.8average
50 2k 16 16,993 30.1 33,575 30.5 65,479 31.350 4k 16 17,091 29.9 33,686 30.4 65,467 31.350 8k 16 17,042 30.1 33,613 30.5 65,327 31.350 16k 16 16,962 30.2 33,388 30.7 65,075 31.5
peak 17,091 30.2 33,686 30.7 65,479 31.5average
0 2k 16 10,135 50.5 19,969 51.3 38,544 53.10 4k 16 10,243 50.0 19,972 51.3 38,593 53.10 8k 16 10,176 50.3 19,965 51.3 38,547 53.10 16k 16 10,179 50.3 19,872 51.5 38,465 53.2
peak 10,243 50.5 19,972 51.5 38,593 53.2average
2 FED 2 BED 4 FED 4 BED 8 FED 8 BED
Table 23. Summary of all peak random results.
Sequential I/O Throughput The following table and charts show the maximum Throughput results by block size for the three system types for all four workloads. The number of LUNs used per test run was steadily increased from 1 to the maximum (32, 64, 128), and the peak results achieved during those steps are reported in this table.
Hitachi Data Systems Confidential For Internal Use and Distribution to Authorized Parties Only
- 52 -
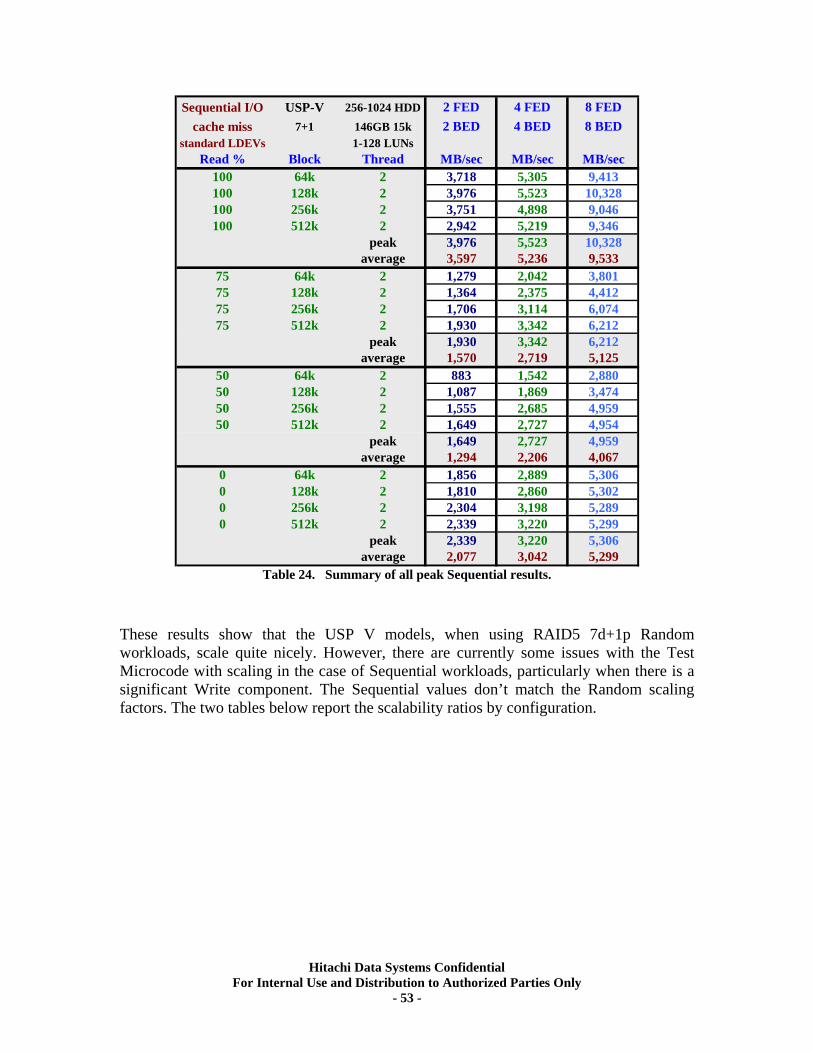
Sequential I/Ocache miss
standard LDEVs
USP-V 256-1024 HDD 2 FED 4 FED 8 FED7+1 146GB 15k 2 BED 4 BED 8 BED
1-128 LUNsRead % Block Thread MB/sec MB/sec MB/sec
100 64k 2 3,718 5,305 9,413100 128k 2 3,976 5,523 10,328100 256k 2 3,751 4,898 9,046100 512k 2 2,942 5,219 9,346
peak 3,976 5,523 10,328average
75 64k 2 1,279 2,042 3,80175 128k 2 1,364 2,375 4,41275 256k 2 1,706 3,114 6,07475 512k 2 1,930 3,342 6,212
peak 1,930 3,342 6,212average
50 64k 2 883 1,542 2,88050 128k 2 1,087 1,869 3,47450 256k 2 1,555 2,685 4,95950 512k 2 1,649 2,727 4,954
peak 1,649 2,727 4,959average
0 64k 2 1,856 2,889 5,3060 128k 2 1,810 2,860 5,3020 256k 2 2,304 3,198 5,2890 512k 2 2,339 3,220 5,299
peak 2,339 3,220 5,306average
3,597 5,236 9,533
1,570 2,719 5,125
1,294 2,206 4,067
2,077 3,042 5,299 Table 24. Summary of all peak Sequential results.
These results show that the USP V models, when using RAID5 7d+1p Random workloads, scale quite nicely. However, there are currently some issues with the Test Microcode with scaling in the case of Sequential workloads, particularly when there is a significant Write component. The Sequential values don’t match the Random scaling factors. The two tables below report the scalability ratios by configuration.
Hitachi Data Systems Confidential For Internal Use and Distribution to Authorized Parties Only
- 53 -
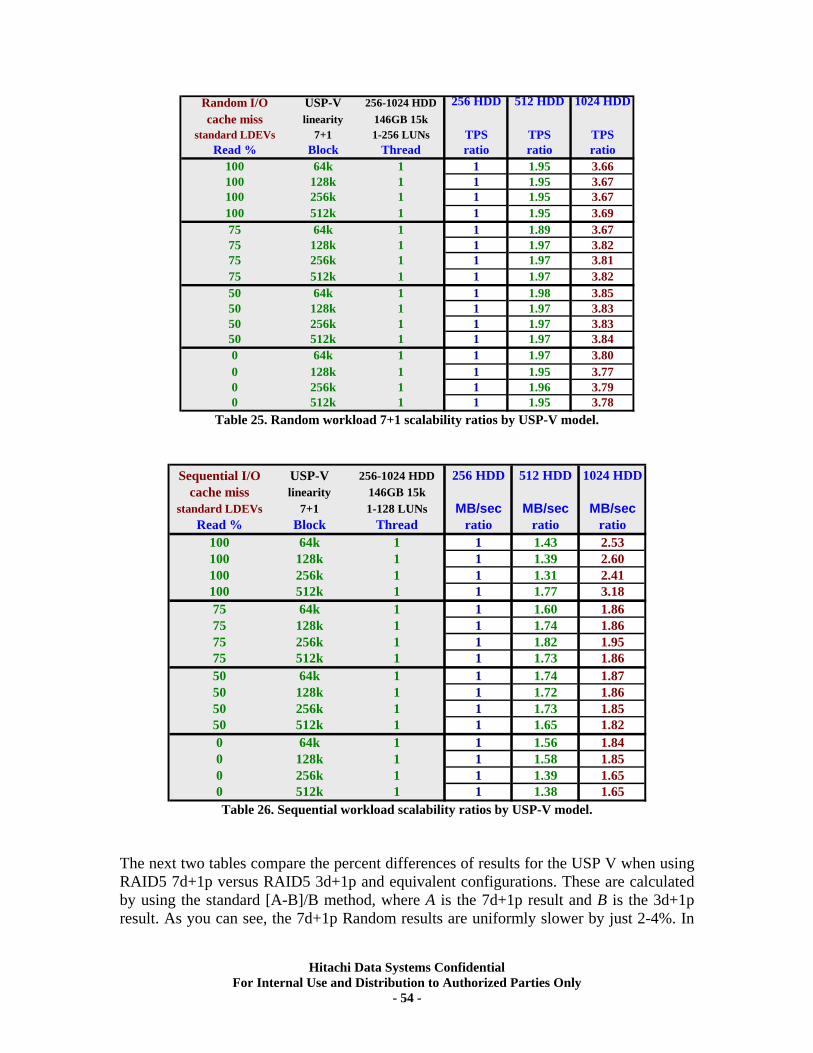
Random I/Ocache miss
standard LDEVs
3.663.673.673.693.673.823.813.823.853.833.833.843.803.773.793.78
USP-V 256-1024 HDD 256 HDD 512 HDD 1024 HDDlinearity 146GB 15k
7+1 1-256 LUNs TPS TPS TPSRead % Block Thread ratio ratio ratio
100 64k 1 1 1.95100 128k 1 1 1.95100 256k 1 1 1.95100 512k 1 1 1.9575 64k 1 1 1.8975 128k 1 1 1.9775 256k 1 1 1.9775 512k 1 1 1.9750 64k 1 1 1.9850 128k 1 1 1.9750 256k 1 1 1.9750 512k 1 1 1.970 64k 1 1 1.970 128k 1 1 1.950 256k 1 1 1.960 512k 1 1 1.95
Table 25. Random workload 7+1 scalability ratios by USP-V model.
Sequential I/Ocache miss
standard LDEVs
USP-V 256-1024 HDD 256 HDD 512 HDD 1024 HDDlinearity 146GB 15k
7+1 1-128 LUNs MB/sec MB/sec MB/secRead % Block Thread ratio ratio ratio
100 64k 1 1 1.43100 128k 1 1 1.39100 256k 1 1 1.31100 512
2.532.602.41
k 1 1 1.7775 64k 1 1 1.6075 128k 1 1 1.7475 256k 1 1 1.8275 512
3.181.861.861.95
k 1 1 1.7350 64k 1 1 1.7450 128k 1 1 1.7250 256k 1 1 1.7350 512
1.861.871.861.85
k 1 1 1.650 64k 1 1 1.560 128k 1 1 1.580 256k 1 1 1.390 512
1.821.841.851.65
k 1 1 1.38 1.65 Table 26. Sequential workload scalability ratios by USP-V model.
The next two tables compare the percent differences of results for the USP V when using RAID5 7d+1p versus RAID5 3d+1p and equivalent configurations. These are calculated by using the standard [A-B]/B method, where A is the 7d+1p result and B is the 3d+1p result. As you can see, the 7d+1p Random results are uniformly slower by just 2-4%. In
Hitachi Data Systems Confidential For Internal Use and Distribution to Authorized Parties Only
- 54 -
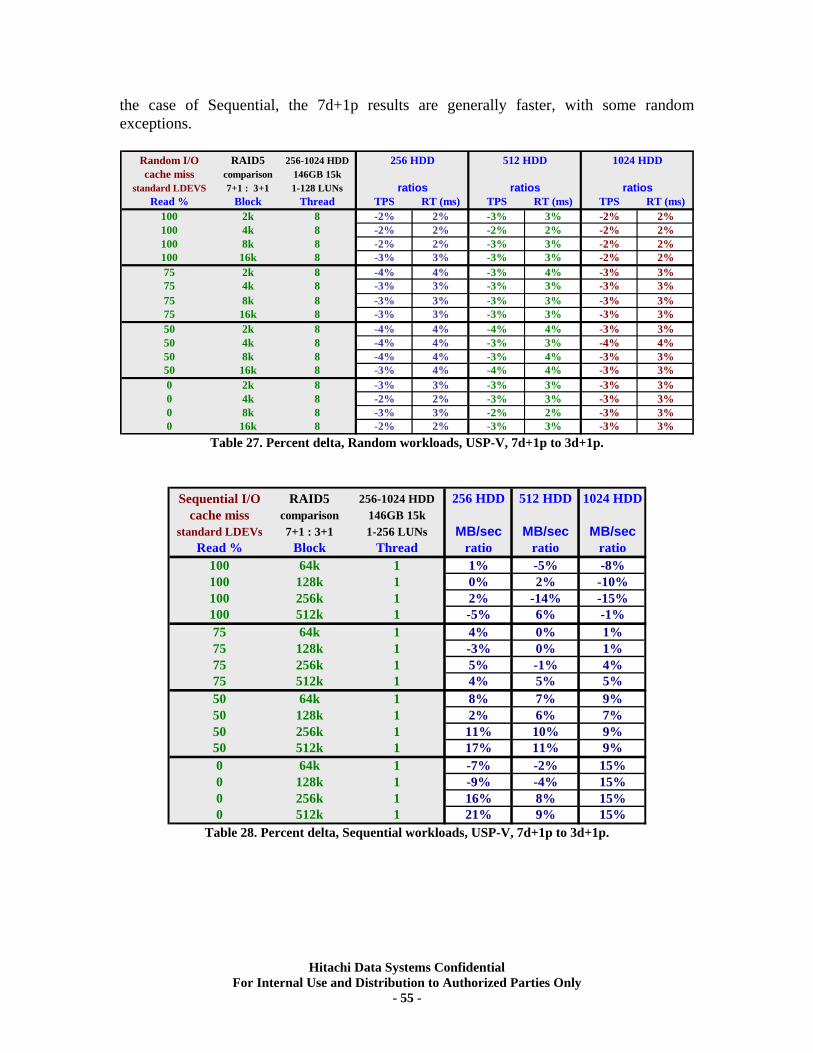
the case of Sequential, the 7d+1p results are generally faster, with some random exceptions.
Random I/Ocache miss
standard LDEVS
-2% 2%-2% 2%-2% 2%-2% 2%-3% 3%-3% 3%-3% 3%-3% 3%-3% 3%-4% 4%-3% 3%-3% 3%-3% 3%-3% 3%-3% 3%-3% 3%
RAID5 256-1024 HDDcomparison 146GB 15k7+1 : 3+1 1-128 LUNs
Read % Block Thread TPS RT (ms) TPS RT (ms) TPS RT (ms)100 2k 8 -2% 2% -3% 3%100 4k 8 -2% 2% -2% 2%100 8k 8 -2% 2% -3% 3%100 16k 8 -3% 3% -3% 3%75 2k 8 -4% 4% -3% 4%75 4k 8 -3% 3% -3% 3%75 8k 8 -3% 3% -3% 3%75 16k 8 -3% 3% -3% 3%50 2k 8 -4% 4% -4% 4%50 4k 8 -4% 4% -3% 3%50 8k 8 -4% 4% -3% 4%50 16k 8 -3% 4% -4% 4%0 2k 8 -3% 3% -3% 3%0 4k 8 -2% 2% -3% 3%0 8k 8 -3% 3% -2% 2%0 16k 8 -2% 2% -3% 3%
ratios ratios
256 HDD
ratios
512 HDD 1024 HDD
Table 27. Percent delta, Random workloads, USP-V, 7d+1p to 3d+1p.
Sequential I/Ocache miss
standard LDEVs
RAID5 256-1024 HDD 256 HDD 512 HDD 1024 HDDcomparison 146GB 15k7+1 : 3+1 1-256 LUNs MB/sec MB/sec MB/sec
Read % Block Thread ratio ratio ratio100 64k 1 1% -5% -8%100 128k 1 0% 2% -10%100 256k 1 2% -14% -15%100 512k 1 -5% 6% -1%75 64k 1 4% 0% 1%75 128k 1 -3% 0% 1%75 256k 1 5% -1% 4%75 512k 1 4% 5% 5%50 64k 1 8% 7% 9%50 128k 1 2% 6% 7%50 256k 1 11% 10% 9%50 512k 1 17% 11% 9%0 64k 1 -7% -2% 15%0 128k 1 -9% -4% 15%0 256k 1 16% 8% 15%0 512k 1 21% 9% 15%
Table 28. Percent delta, Sequential workloads, USP-V, 7d+1p to 3d+1p.
Hitachi Data Systems Confidential For Internal Use and Distribution to Authorized Parties Only
- 55 -
XII. RAID6 (6d+2p) Back-end Scalability Tests The purpose of this testing was to conduct a back-end disk (cache miss) scalability analysis using the Hitachi Data Systems Universal Storage Platform V enterprise storage system. The quantity of Front-end Directors (FEDs) and Back-end Directors (BEDs) used were varied to scale the system size. The first set of tests evaluated how a small USP V (2 FED, 2 BED, and 256 HDDs) could perform. The second set of tests measured a midsized USP V (4 FEDs, 4 BEDs, and 512 HDDs). The final set of tests measured a large USP V (8 FEDs, 8 BEDs, and 1024 HDDs). A fairly powerful IBM p595 server was used for these tests. There was a single test system that had 256GB of cache and 22 GB of Shared Memory. The disks used were 146GB 15K RPM. The front-end and back-end paths are all 4Gbit FC. The test configurations used for these three sets of tests included:
• USP V small o 2 FED – 16 unshared FC host ports o 2 BED – 256 HDDs (16 disk loops, 32 Array Groups, 32 LUNs)
• USP V midsize o 4 FEDs – 32 unshared FC host ports o 4 BEDs – 512 HDDs (32 disk loops, 64 Array Groups, 64 LUNs)
• USP V large o 8 FEDs – 64 unshared FC host ports o 8 BEDs– 1024 HDDs (64 disk loops, 128 Array Groups, 128 LUNs)
Test Methodology The test methodology was to first configure 128 Array Groups in the USP V using RAID6 6d+2p, and to create one 33GB LDEV per RAID Group. These LDEVs were then mapped to FED ports. For each USP V “model”, only those LDEVS that were behind a certain set of BEDs were accessed for those tests. A specific pair of FEDs was associated with each pair of BEDs, so that certain host ports always saw certain LUNs. Hence, there were always four LUNS per port. The “small” system used 16 host ports and 32 LUNs. The “midsize” system used 32 ports and 64 LUNs. The “large” system used all 128 ports and 128 LUNs. Each test run for a system began with one LUN and scaled up to the maximum for that system. There were 8 concurrent VDbench threads per LUN for Random workloads, and just 1 thread per LUN for Sequential workloads. These are the tests that were used:
• Random I/O, Transactions per second and Average Response Time, at 2, 4, 8, and 16KB block sizes with 8 Threads (100% - 75% - 50% Read, and 100% Write)
• Sequential I/O, Throughput, at 64, 128, 256, and 512KB block sizes with 1 Thread (100% - 75% - 50% Read, and 100% Write)
Hitachi Data Systems Confidential For Internal Use and Distribution to Authorized Parties Only
- 56 -
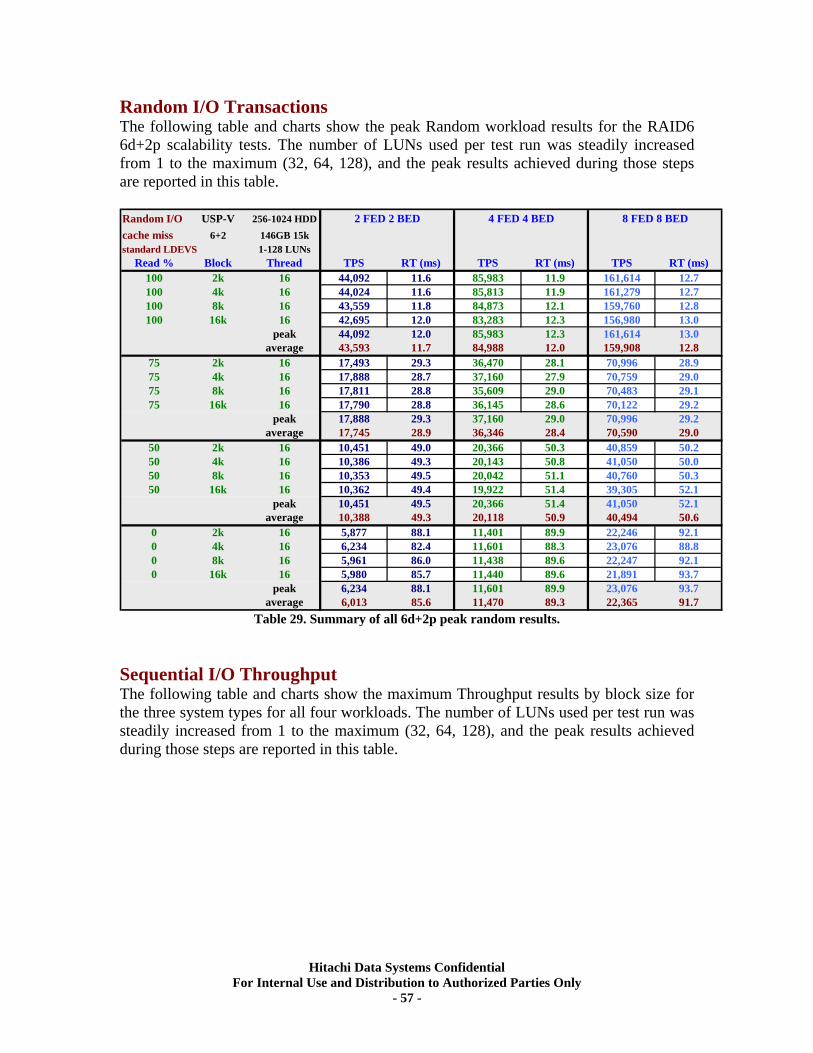
Random I/O Transactions The following table and charts show the peak Random workload results for the RAID6 6d+2p scalability tests. The number of LUNs used per test run was steadily increased from 1 to the maximum (32, 64, 128), and the peak results achieved during those steps are reported in this table. Random I/Ocache missstandard LDEVS
43,593 11.7 84,988 12.0 159,908 12.8
17,745 28.9 36,346 28.4 70,590 29.0
10,388 49.3 20,118 50.9 40,494 50.6
6,013 85.6 11,470 89.3 22,365 91.7
USP-V 256-1024 HDD6+2 146GB 15k
1-128 LUNsRead % Block Thread TPS RT (ms) TPS RT (ms) TPS RT (ms)
100 2k 16 44,092 11.6 85,983 11.9 161,614 12.7100 4k 16 44,024 11.6 85,813 11.9 161,279 12.7100 8k 16 43,559 11.8 84,873 12.1 159,760 12.8100 16k 16 42,695 12.0 83,283 12.3 156,980 13.0
peak 44,092 12.0 85,983 12.3 161,614 13.0average
75 2k 16 17,493 29.3 36,470 28.1 70,996 28.975 4k 16 17,888 28.7 37,160 27.9 70,759 29.075 8k 16 17,811 28.8 35,609 29.0 70,483 29.175 16k 16 17,790 28.8 36,145 28.6 70,122 29.2
peak 17,888 29.3 37,160 29.0 70,996 29.2average
50 2k 16 10,451 49.0 20,366 50.3 40,859 50.250 4k 16 10,386 49.3 20,143 50.8 41,050 50.050 8k 16 10,353 49.5 20,042 51.1 40,760 50.350 16k 16 10,362 49.4 19,922 51.4 39,305 52.1
peak 10,451 49.5 20,366 51.4 41,050 52.1average
0 2k 16 5,877 88.1 11,401 89.9 22,246 92.10 4k 16 6,234 82.4 11,601 88.3 23,076 88.80 8k 16 5,961 86.0 11,438 89.6 22,247 92.10 16k 16 5,980 85.7 11,440 89.6 21,891 93.7
peak 6,234 88.1 11,601 89.9 23,076 93.7average
2 FED 2 BED 4 FED 4 BED 8 FED 8 BED
Table 29. Summary of all 6d+2p peak random results.
Sequential I/O Throughput The following table and charts show the maximum Throughput results by block size for the three system types for all four workloads. The number of LUNs used per test run was steadily increased from 1 to the maximum (32, 64, 128), and the peak results achieved during those steps are reported in this table.
Hitachi Data Systems Confidential For Internal Use and Distribution to Authorized Parties Only
- 57 -
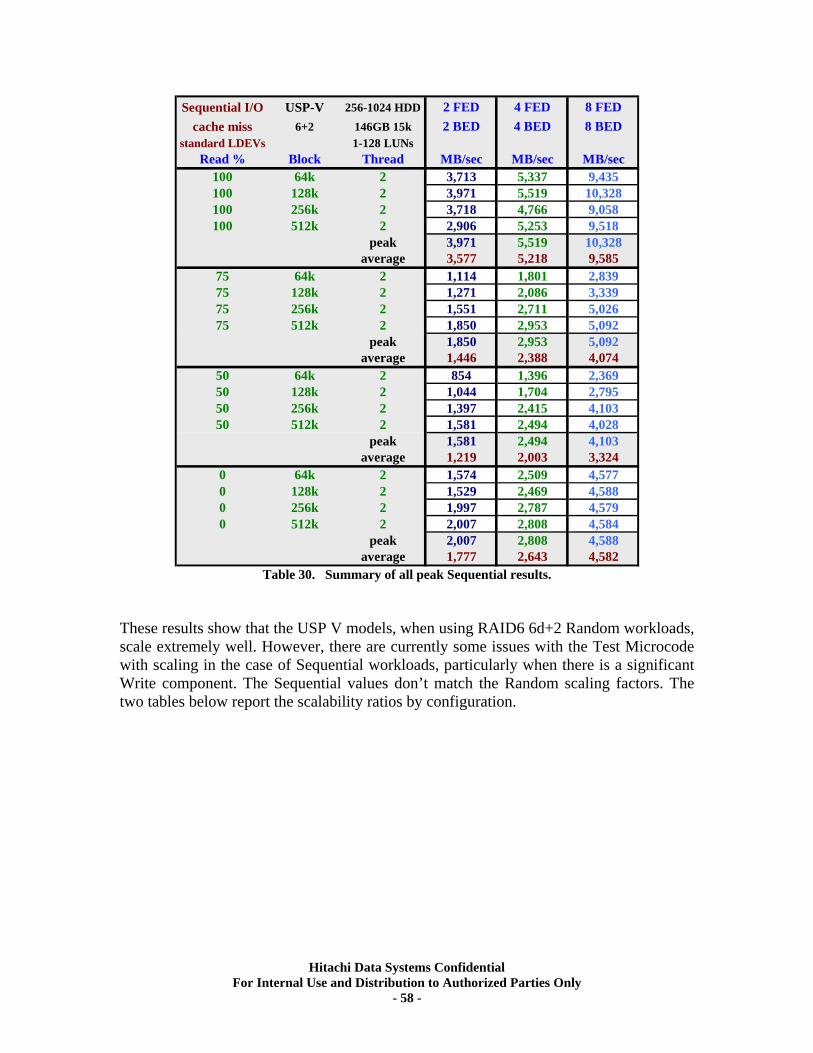
Sequential I/Ocache miss
standard LDEVs
USP-V 256-1024 HDD 2 FED 4 FED 8 FED6+2 146GB 15k 2 BED 4 BED 8 BED
1-128 LUNsRead % Block Thread MB/sec MB/sec MB/sec
100 64k 2 3,713 5,337 9,435100 128k 2 3,971 5,519 10,328100 256k 2 3,718 4,766 9,058100 512k 2 2,906 5,253 9,518
peak 3,971 5,519 10,328average
75 64k 2 1,114 1,801 2,83975 128k 2 1,271 2,086 3,33975 256k 2 1,551 2,711 5,02675 512k 2 1,850 2,953 5,092
peak 1,850 2,953 5,092average
50 64k 2 854 1,396 2,36950 128k 2 1,044 1,704 2,79550 256k 2 1,397 2,415 4,10350 512k 2 1,581 2,494 4,028
peak 1,581 2,494 4,103average
0 64k 2 1,574 2,509 4,5770 128k 2 1,529 2,469 4,5880 256k 2 1,997 2,787 4,5790 512k 2 2,007 2,808 4,584
peak 2,007 2,808 4,588average
3,577 5,218 9,585
1,446 2,388 4,074
1,219 2,003 3,324
1,777 2,643 4,582 Table 30. Summary of all peak Sequential results.
These results show that the USP V models, when using RAID6 6d+2 Random workloads, scale extremely well. However, there are currently some issues with the Test Microcode with scaling in the case of Sequential workloads, particularly when there is a significant Write component. The Sequential values don’t match the Random scaling factors. The two tables below report the scalability ratios by configuration.
Hitachi Data Systems Confidential For Internal Use and Distribution to Authorized Parties Only
- 58 -
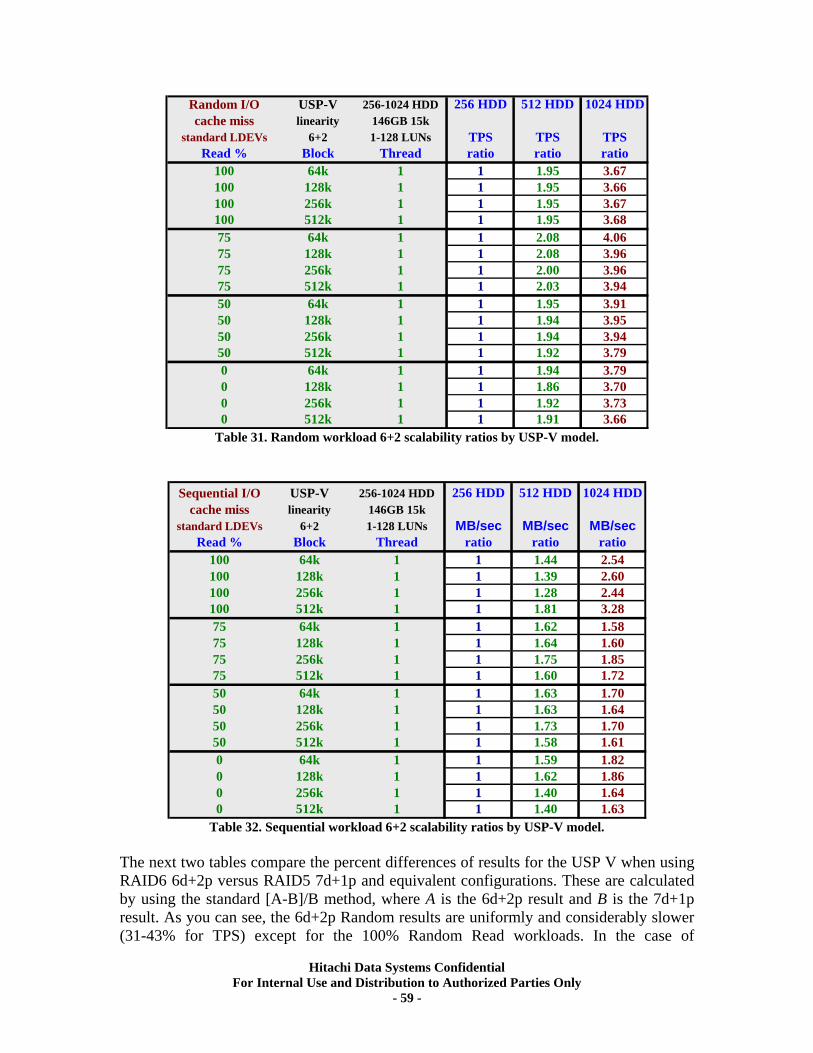
Random I/Ocache miss
standard LDEVs
USP-V 256-1024 HDD 256 HDD 512 HDD 1024 HDDlinearity 146GB 15k
6+2 1-128 LUNs TPS TPS TPSRead % Block Thread ratio ratio ratio
100 64k 1 1 1.95100 128k 1 1 1.95100 256k 1 1 1.95100 512
3.673.663.67
k 1 1 1.9575 64k 1 1 2.0875 128k 1 1 2.0875 256k 1 1 2.0075 512
3.684.063.963.96
k 1 1 2.0350 64k 1 1 1.9550 128k 1 1 1.9450 256k 1 1 1.9450 512
3.943.913.953.94
k 1 1 1.920 64k 1 1 1.940 128k 1 1 1.860 256k 1 1 1.920 512
3.793.793.703.73
k 1 1 1.91 3.66 Table 31. Random workload 6+2 scalability ratios by USP-V model.
Sequential I/Ocache miss
standard LDEVs
USP-V 256-1024 HDD 256 HDD 512 HDD 1024 HDDlinearity 146GB 15k
6+2 1-128 LUNs MB/sec MB/sec MB/secRead % Block Thread ratio ratio ratio
100 64k 1 1 1.44100 128k 1 1 1.39100 256k 1 1 1.28100 512
2.542.602.44
k 1 1 1.8175 64k 1 1 1.6275 128k 1 1 1.6475 256k 1 1 1.7575 512
3.281.581.601.85
k 1 1 1.6050 64k 1 1 1.6350 128k 1 1 1.6350 256k 1 1 1.7350 512
1.721.701.641.70
k 1 1 1.580 64k 1 1 1.590 128k 1 1 1.620 256k 1 1 1.400 512
1.611.821.861.64
k 1 1 1.40 1.63 Table 32. Sequential workload 6+2 scalability ratios by USP-V model.
The next two tables compare the percent differences of results for the USP V when using RAID6 6d+2p versus RAID5 7d+1p and equivalent configurations. These are calculated by using the standard [A-B]/B method, where A is the 6d+2p result and B is the 7d+1p result. As you can see, the 6d+2p Random results are uniformly and considerably slower (31-43% for TPS) except for the 100% Random Read workloads. In the case of
Hitachi Data Systems Confidential For Internal Use and Distribution to Authorized Parties Only
- 59 -
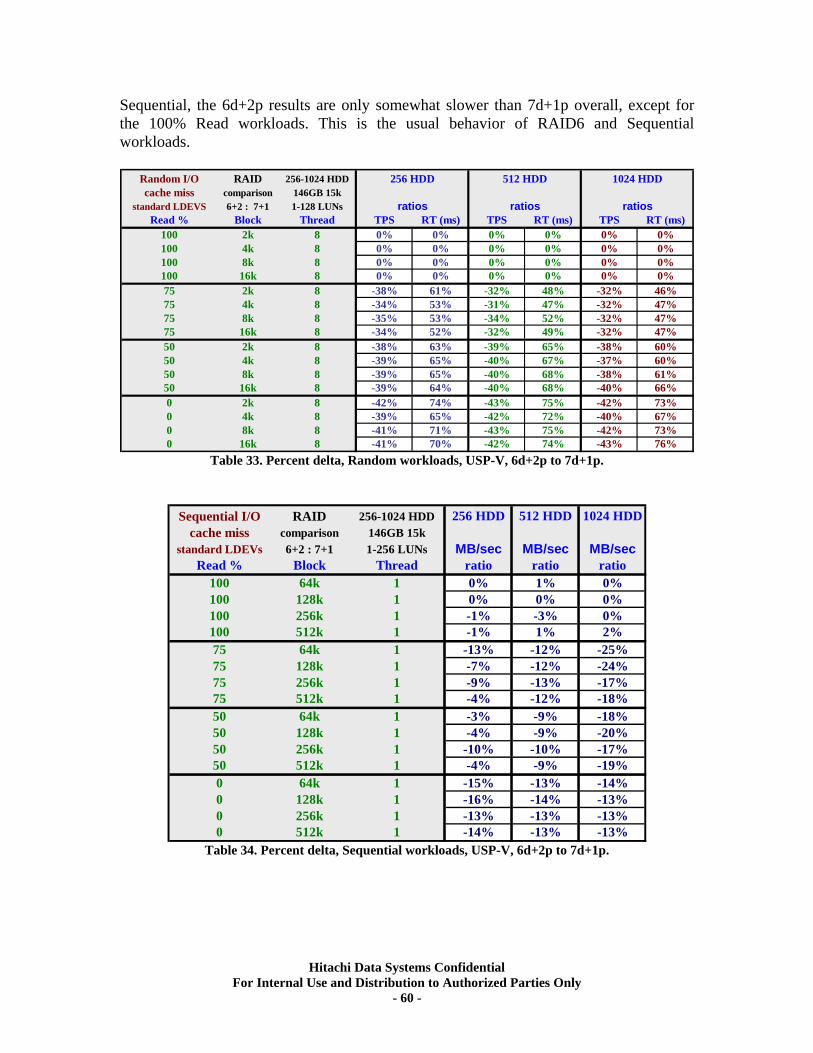
Sequential, the 6d+2p results are only somewhat slower than 7d+1p overall, except for the 100% Read workloads. This is the usual behavior of RAID6 and Sequential workloads.
Random I/Ocache miss
standard LDEVS
0% 0%0% 0%0% 0%0% 0%
-32% 46%-32% 47%-32% 47%-32% 47%-38% 60%-37% 60%-38% 61%-40% 66%-42% 73%-40% 67%-42% 73%-43% 76%
RAID 256-1024 HDDcomparison 146GB 15k6+2 : 7+1 1-128 LUNs
Read % Block Thread TPS RT (ms) TPS RT (ms) TPS RT (ms)100 2k 8 0% 0% 0% 0%100 4k 8 0% 0% 0% 0%100 8k 8 0% 0% 0% 0%100 16k 8 0% 0% 0% 0%75 2k 8 -38% 61% -32% 48%75 4k 8 -34% 53% -31% 47%75 8k 8 -35% 53% -34% 52%75 16k 8 -34% 52% -32% 49%50 2k 8 -38% 63% -39% 65%50 4k 8 -39% 65% -40% 67%50 8k 8 -39% 65% -40% 68%50 16k 8 -39% 64% -40% 68%0 2k 8 -42% 74% -43% 75%0 4k 8 -39% 65% -42% 72%0 8k 8 -41% 71% -43% 75%0 16k 8 -41% 70% -42% 74%
ratios ratios
512 HDD 1024 HDD256 HDD
ratios
Table 33. Percent delta, Random workloads, USP-V, 6d+2p to 7d+1p.
Sequential I/Ocache miss
standard LDEVs
RAID 256-1024 HDD 256 HDD 512 HDD 1024 HDDcomparison 146GB 15k6+2 : 7+1 1-256 LUNs MB/sec MB/sec MB/sec
Read % Block Thread ratio ratio ratio100 64k 1 0% 1% 0%100 128k 1 0% 0% 0%100 256k 1 -1% -3% 0%100 512k 1 -1% 1% 2%75 64k 1 -13% -12% -25%75 128k 1 -7% -12% -24%75 256k 1 -9% -13% -17%75 512k 1 -4% -12% -18%50 64k 1 -3% -9% -18%50 128k 1 -4% -9% -20%50 256k 1 -10% -10% -17%50 512k 1 -4% -9% -19%0 64k 1 -15% -13% -14%0 128k 1 -16% -14% -13%0 256k 1 -13% -13% -13%0 512k 1 -14% -13% -13%
Table 34. Percent delta, Sequential workloads, USP-V, 6d+2p to 7d+1p.
Hitachi Data Systems Confidential For Internal Use and Distribution to Authorized Parties Only
- 60 -
XIII. RAID10 (2d+2d) AMS500 Virtualization Tests Universal Volume Manager The purpose of the USP V’s UVM virtualization feature is to provide for the attachment of external storage (from Hitachi or a variety of other storage vendors) to a USP V and to manage these external volumes as if they originated within the USP V. Those volumes appear to hosts attached to the USP V as logical devices originating from within the USP V. This is the basis of the Hitachi solution for storage virtualization. There is also a USP V software feature available for the logical partitioning of USP cache, disks, and host ports (Virtual Partition Manager) as well as a feature to non-disruptively manage data migration between local volumes and external volumes (Tiered Storage Manager). There are two UVM cache management modes available when mapping the external storage LDEVs through to USP V host ports. These are Cached Mode Enabled and Cached Mode Disabled settings which are selectable on an individual LDEV basis. Note that these configuration settings are independent of those operating within the external storage system. The external systems will continue to operate as if they were still direct or SAN attached to servers. Also note that read or write operations from/to external storage will always pass through the USP V’s cache system. The difference between these cache modes is in how the data blocks are managed.
Cache Mode Disabled For random reads, the use of the cache management MRU/LRU (Most Recently Used/ Least Recently Used) queues are disabled in “Cache Mode Disabled” so data blocks do not remain in cache for further reuse. In the case of random writes, data blocks are written to the USP cache and then out to external storage, just as with internal disks, but the write operation completion signal is not reported to the host until the data has been written to the external storage device’s cache. For sequential reads, the prefetch function is not enabled. Cache Mode Enabled For random reads, the use of the cache management MRU/LRU queues and sequential prefetch are enabled. Enabling Cache Mode can benefit externally attached subsystems of older storage technologies that do not contain sophisticated cache routines. In the case of random writes, data blocks are written to the USP cache, a write operation completion signal is returned to the host, and then the data is written to external storage cache (seen as a disk volume by the USP) just as with internal disks. For sequential read or write patterns, I/O’s are never subject to the MRU/LRU system. These are handled in bursts, with a number of cache slots being allocated for the duration of the operation and placed back on the free queue when complete. For sequential reads, the prefetch function will read ahead from the storage device. Note that if the external storage system supports a similar sequential prefetch function then a similar and independent read ahead operation will likely occur within the external system.
Hitachi Data Systems Confidential For Internal Use and Distribution to Authorized Parties Only
- 61 -
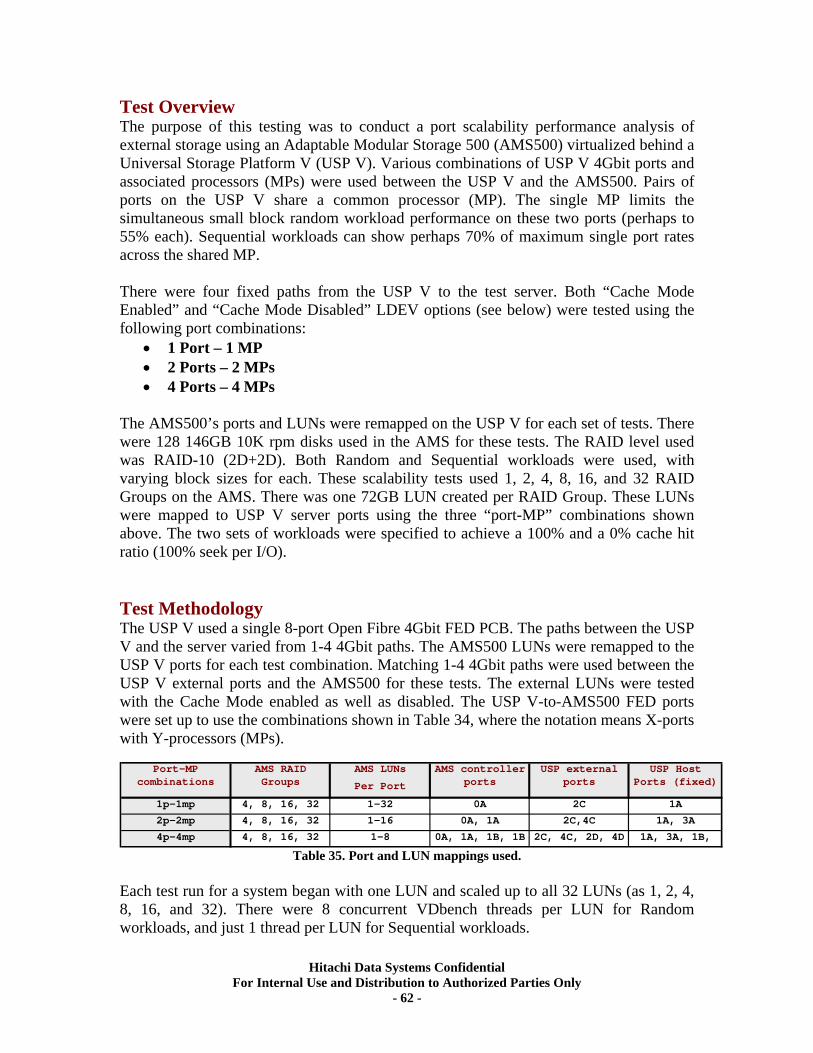
Test Overview The purpose of this testing was to conduct a port scalability performance analysis of external storage using an Adaptable Modular Storage 500 (AMS500) virtualized behind a Universal Storage Platform V (USP V). Various combinations of USP V 4Gbit ports and associated processors (MPs) were used between the USP V and the AMS500. Pairs of ports on the USP V share a common processor (MP). The single MP limits the simultaneous small block random workload performance on these two ports (perhaps to 55% each). Sequential workloads can show perhaps 70% of maximum single port rates across the shared MP. There were four fixed paths from the USP V to the test server. Both “Cache Mode Enabled” and “Cache Mode Disabled” LDEV options (see below) were tested using the following port combinations:
• 1 Port – 1 MP • 2 Ports – 2 MPs • 4 Ports – 4 MPs
The AMS500’s ports and LUNs were remapped on the USP V for each set of tests. There were 128 146GB 10K rpm disks used in the AMS for these tests. The RAID level used was RAID-10 (2D+2D). Both Random and Sequential workloads were used, with varying block sizes for each. These scalability tests used 1, 2, 4, 8, 16, and 32 RAID Groups on the AMS. There was one 72GB LUN created per RAID Group. These LUNs were mapped to USP V server ports using the three “port-MP” combinations shown above. The two sets of workloads were specified to achieve a 100% and a 0% cache hit ratio (100% seek per I/O). Test Methodology The USP V used a single 8-port Open Fibre 4Gbit FED PCB. The paths between the USP V and the server varied from 1-4 4Gbit paths. The AMS500 LUNs were remapped to the USP V ports for each test combination. Matching 1-4 4Gbit paths were used between the USP V external ports and the AMS500 for these tests. The external LUNs were tested with the Cache Mode enabled as well as disabled. The USP V-to-AMS500 FED ports were set up to use the combinations shown in Table 34, where the notation means X-ports with Y-processors (MPs).
AMS LUNs
Per Port
1p-1mp 4, 8, 16, 32 1-32 0A 2C 1A
2p-2mp 4, 8, 16, 32 1-16 0A, 1A 2C,4C 1A, 3A
4p-4mp 4, 8, 16, 32 1-8 0A, 1A, 1B, 1B 2C, 4C, 2D, 4D 1A, 3A, 1B, 3
USP Host Ports (fixed)
Port-MP combinations
AMS RAID Groups
AMS controller ports
USP external ports
Table 35. Port and LUN mappings used.
Each test run for a system began with one LUN and scaled up to all 32 LUNs (as 1, 2, 4, 8, 16, and 32). There were 8 concurrent VDbench threads per LUN for Random workloads, and just 1 thread per LUN for Sequential workloads.
Hitachi Data Systems Confidential For Internal Use and Distribution to Authorized Parties Only
- 62 -
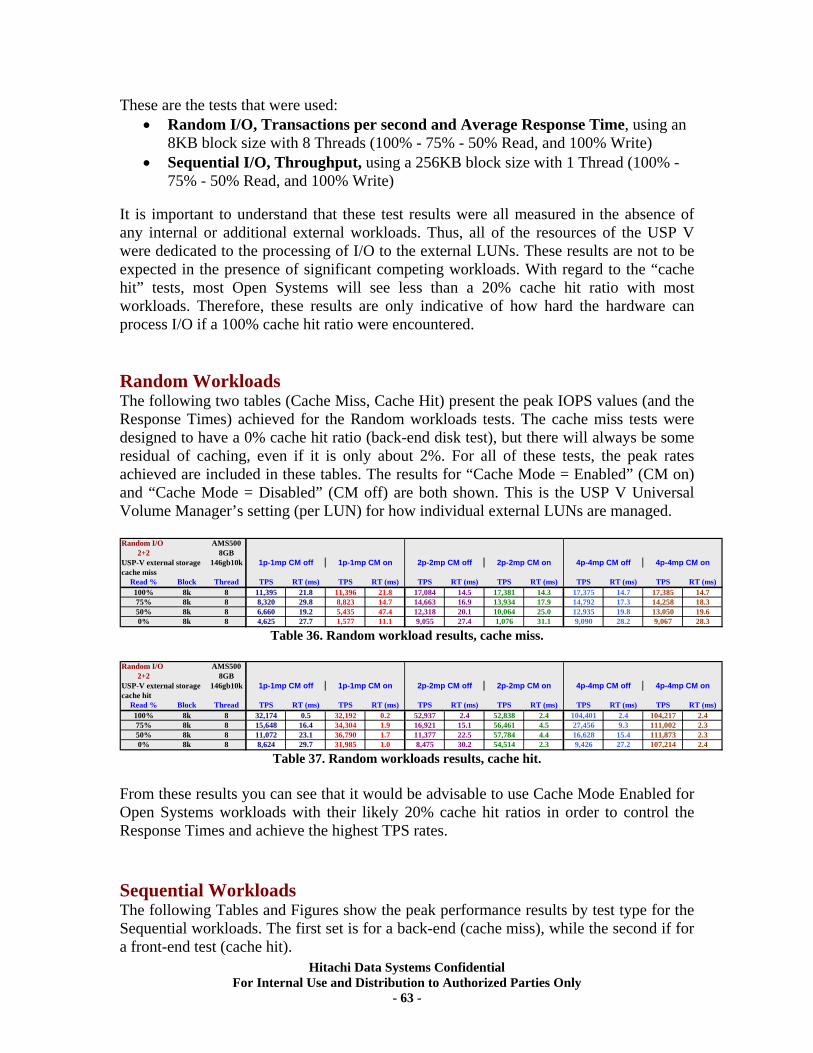
These are the tests that were used: • Random I/O, Transactions per second and Average Response Time, using an
8KB block size with 8 Threads (100% - 75% - 50% Read, and 100% Write) • Sequential I/O, Throughput, using a 256KB block size with 1 Thread (100% -
75% - 50% Read, and 100% Write) It is important to understand that these test results were all measured in the absence of any internal or additional external workloads. Thus, all of the resources of the USP V were dedicated to the processing of I/O to the external LUNs. These results are not to be expected in the presence of significant competing workloads. With regard to the “cache hit” tests, most Open Systems will see less than a 20% cache hit ratio with most workloads. Therefore, these results are only indicative of how hard the hardware can process I/O if a 100% cache hit ratio were encountered. Random Workloads The following two tables (Cache Miss, Cache Hit) present the peak IOPS values (and the Response Times) achieved for the Random workloads tests. The cache miss tests were designed to have a 0% cache hit ratio (back-end disk test), but there will always be some residual of caching, even if it is only about 2%. For all of these tests, the peak rates achieved are included in these tables. The results for “Cache Mode = Enabled” (CM on) and “Cache Mode = Disabled” (CM off) are both shown. This is the USP V Universal Volume Manager’s setting (per LUN) for how individual external LUNs are managed. Random I/O
2+2AMS500
8GBUSP-V external storage 146gb10kcache miss
Read % Block Thread TPS RT (ms) TPS RT (ms) TPS RT (ms) TPS RT (ms) TPS RT (ms) TPS RT (ms)100% 8k 8 11,395 21.8 17,084 14.5 17,381 14.3 17,375 14.775% 8k 8 8,320 29.8 14,663 16.9 13,934 17.9 14,792 17.350% 8k 8 6,660 19.2 12,318 20.1 10,064 25.0 12,935 19.80% 8k 8 4,625 27.7 9,055 27.4 1,076 31.1 9,090 28.2
4p-4mp CM off 4p-4mp CM on1p-1mp CM off 1p-1mp CM on 2p-2mp CM off 2p-2mp CM on
11,396 21.88,823 14.75,435 47.41,577 11.1
17,385 14.714,258 18.313,050 19.69,067 28.3
Table 36. Random workload results, cache miss. Random I/O
2+2AMS500
8GBUSP-V external storage 146gb10kcache hit
Read % Block Thread TPS RT (ms) TPS RT (ms) TPS RT (ms) TPS RT (ms) TPS RT (ms) TPS RT (ms)100% 8k 8 32,174 0.5 52,937 2.4 52,838 2.4 104,401 2.475% 8k 8 15,648 16.4 16,921 15.1 56,461 4.5 27,456 9.350% 8k 8 11,072 23.1 11,377 22.5 57,784 4.4 16,628 15.40% 8k 8 8,624 29.7 8,475 30.2 54,514 2.3 9,426 27.2
4p-4mp CM off 4p-4mp CM on1p-1mp CM off 1p-1mp CM on 2p-2mp CM off 2p-2mp CM on
32,192 0.234,304 1.936,790 1.731,985 1.0
104,217 2.4111,002 2.3111,873 2.3107,214 2.4
Table 37. Random workloads results, cache hit. From these results you can see that it would be advisable to use Cache Mode Enabled for Open Systems workloads with their likely 20% cache hit ratios in order to control the Response Times and achieve the highest TPS rates. Sequential Workloads The following Tables and Figures show the peak performance results by test type for the Sequential workloads. The first set is for a back-end (cache miss), while the second if for a front-end test (cache hit).
Hitachi Data Systems Confidential For Internal Use and Distribution to Authorized Parties Only
- 63 -
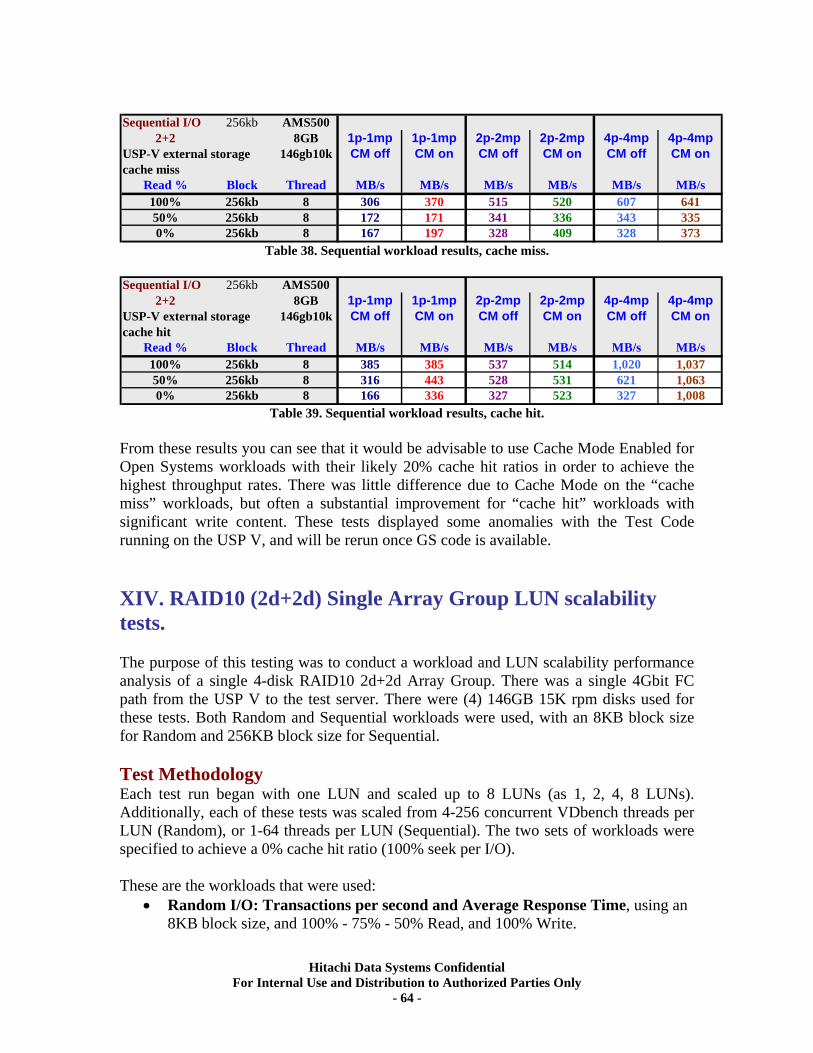
Sequential I/O
2+2256kb AMS500
8GB 1p-1mp 1p-1mp 2p-2mp 2p-2mp 4p-4mp 4p-4mpUSP-V external storage 146gb10k CM off CM on CM off CM on CM off CM oncache miss
Read % Block Thread MB/s MB/s MB/s MB/s MB/s MB/s100% 256kb 8 306 515 520 60750% 256kb 8 172 341 336 3430% 256kb 8 167 328 409 328
370171197
641335373
Table 38. Sequential workload results, cache miss. Sequential I/O
2+2256kb AMS500
8GB 1p-1mp 1p-1mp 2p-2mp 2p-2mp 4p-4mp 4p-4mpUSP-V external storage 146gb10k CM off CM on CM off CM on CM off CM oncache hit
Read % Block Thread MB/s MB/s MB/s MB/s MB/s MB/s100% 256kb 8 385 537 514 1,02050% 256kb 8 316 528 531 6210% 256kb 8 166 327 523 327
385443336
1,0371,0631,008
Table 39. Sequential workload results, cache hit. From these results you can see that it would be advisable to use Cache Mode Enabled for Open Systems workloads with their likely 20% cache hit ratios in order to achieve the highest throughput rates. There was little difference due to Cache Mode on the “cache miss” workloads, but often a substantial improvement for “cache hit” workloads with significant write content. These tests displayed some anomalies with the Test Code running on the USP V, and will be rerun once GS code is available. XIV. RAID10 (2d+2d) Single Array Group LUN scalability tests. The purpose of this testing was to conduct a workload and LUN scalability performance analysis of a single 4-disk RAID10 2d+2d Array Group. There was a single 4Gbit FC path from the USP V to the test server. There were (4) 146GB 15K rpm disks used for these tests. Both Random and Sequential workloads were used, with an 8KB block size for Random and 256KB block size for Sequential. Test Methodology Each test run began with one LUN and scaled up to 8 LUNs (as 1, 2, 4, 8 LUNs). Additionally, each of these tests was scaled from 4-256 concurrent VDbench threads per LUN (Random), or 1-64 threads per LUN (Sequential). The two sets of workloads were specified to achieve a 0% cache hit ratio (100% seek per I/O). These are the workloads that were used:
• Random I/O: Transactions per second and Average Response Time, using an 8KB block size, and 100% - 75% - 50% Read, and 100% Write.
Hitachi Data Systems Confidential For Internal Use and Distribution to Authorized Parties Only
- 64 -
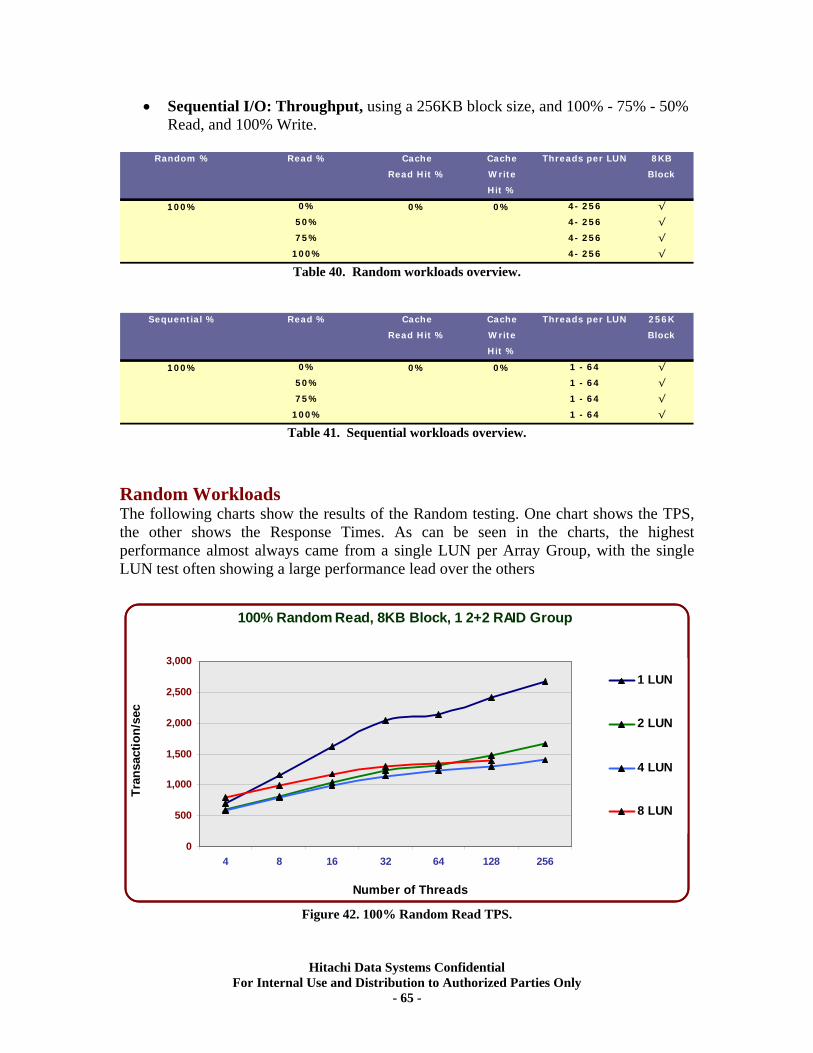
• Sequential I/O: Throughput, using a 256KB block size, and 100% - 75% - 50% Read, and 100% Write.
Cache Cache 8KB
Read Hit % Write Block
Hit %
0% 4- 256 √
50% 4- 256 √
75% 4- 256 √
100% 4- 256 √
100% 0% 0%
Random % Read % Threads per LUN
Table 40. Random workloads overview.
Cache Cache 256K
Read Hit % Write Block
Hit %
0% 1 - 64 √
50% 1 - 64 √
75% 1 - 64 √
100% 1 - 64 √
Sequential % Read % Threads per LUN
100% 0% 0%
Table 41. Sequential workloads overview.
Random Workloads The following charts show the results of the Random testing. One chart shows the TPS, the other shows the Response Times. As can be seen in the charts, the highest performance almost always came from a single LUN per Array Group, with the single LUN test often showing a large performance lead over the others
100% Random Read, 8KB Block, 1 2+2 RAID Group
0
500
1,000
1,500
2,000
2,500
3,000
1 LUN
4 8 16 32 64 128 256
Number of Threads
Tran
sact
ion/
sec
2 LUN
4 LUN
8 LUN
Figure 42. 100% Random Read TPS.
Hitachi Data Systems Confidential For Internal Use and Distribution to Authorized Parties Only
- 65 -
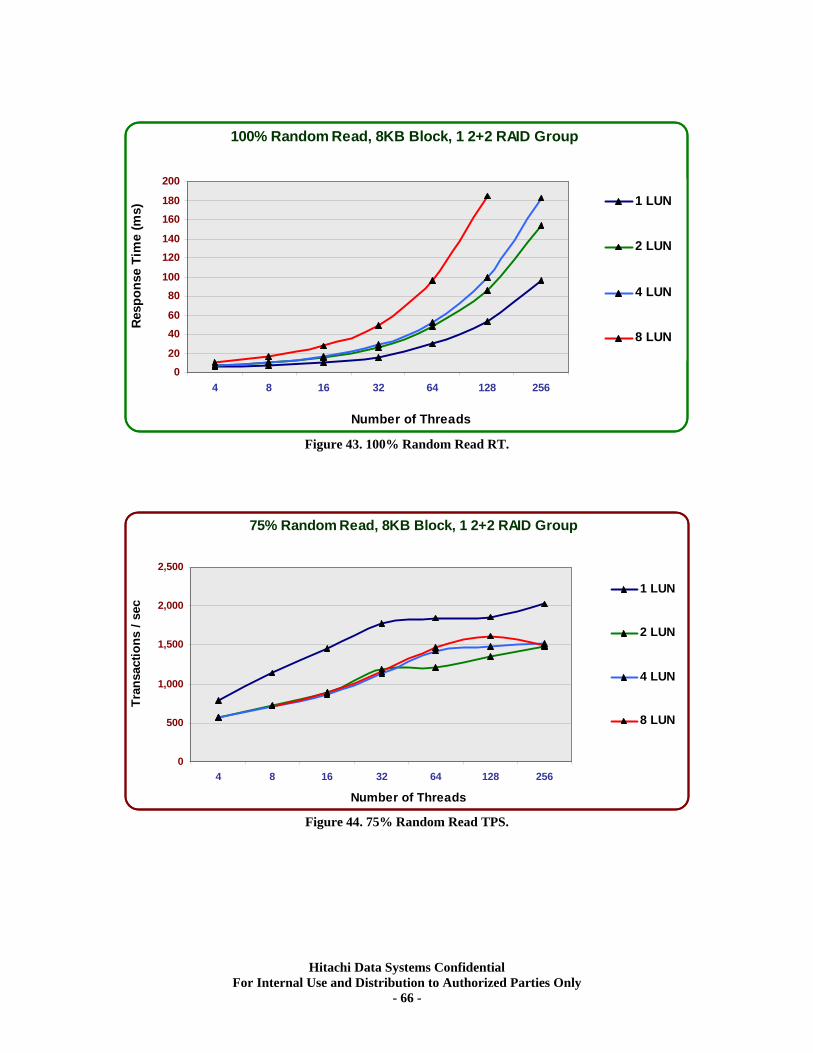
100% Random Read, 8KB Block, 1 2+2 RAID Group
020
4060
80100
120140
160180
200
1 LUN
4 8 16 32 64 128 256
Number of Threads
Resp
onse
Tim
e (m
s)
2 LUN
4 LUN
8 LUN
Figure 43. 100% Random Read RT.
75% Random Read, 8KB Block, 1 2+2 RAID Group
0
500
1,000
1,500
2,000
2,500
1 LUN
4 8 16 32 64 128 256
Number of Threads
Tran
sact
ions
/ se
c
2 LUN
4 LUN
8 LUN
Figure 44. 75% Random Read TPS.
Hitachi Data Systems Confidential For Internal Use and Distribution to Authorized Parties Only
- 66 -
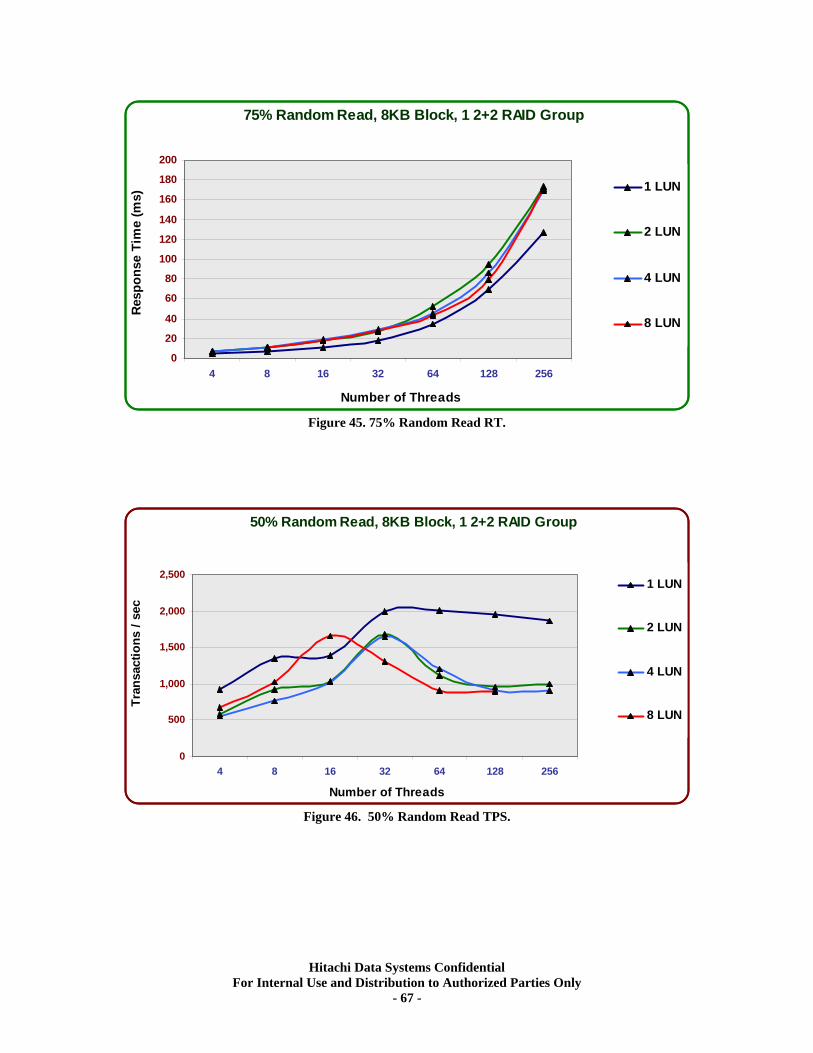
75% Random Read, 8KB Block, 1 2+2 RAID Group
0
20
40
60
80
100
120
140
160
180
200
1 LUN
4 8 16 32 64 128 256
Number of Threads
Res
pons
e Ti
me
(ms)
2 LUN
4 LUN
8 LUN
Figure 45. 75% Random Read RT.
50% Random Read, 8KB Block, 1 2+2 RAID Group
0
500
1,000
1,500
2,000
2,5001 LUN
4 8 16 32 64 128 256
Number of Threads
Tran
sact
ions
/ se
c
2 LUN
4 LUN
8 LUN
Figure 46. 50% Random Read TPS.
Hitachi Data Systems Confidential For Internal Use and Distribution to Authorized Parties Only
- 67 -
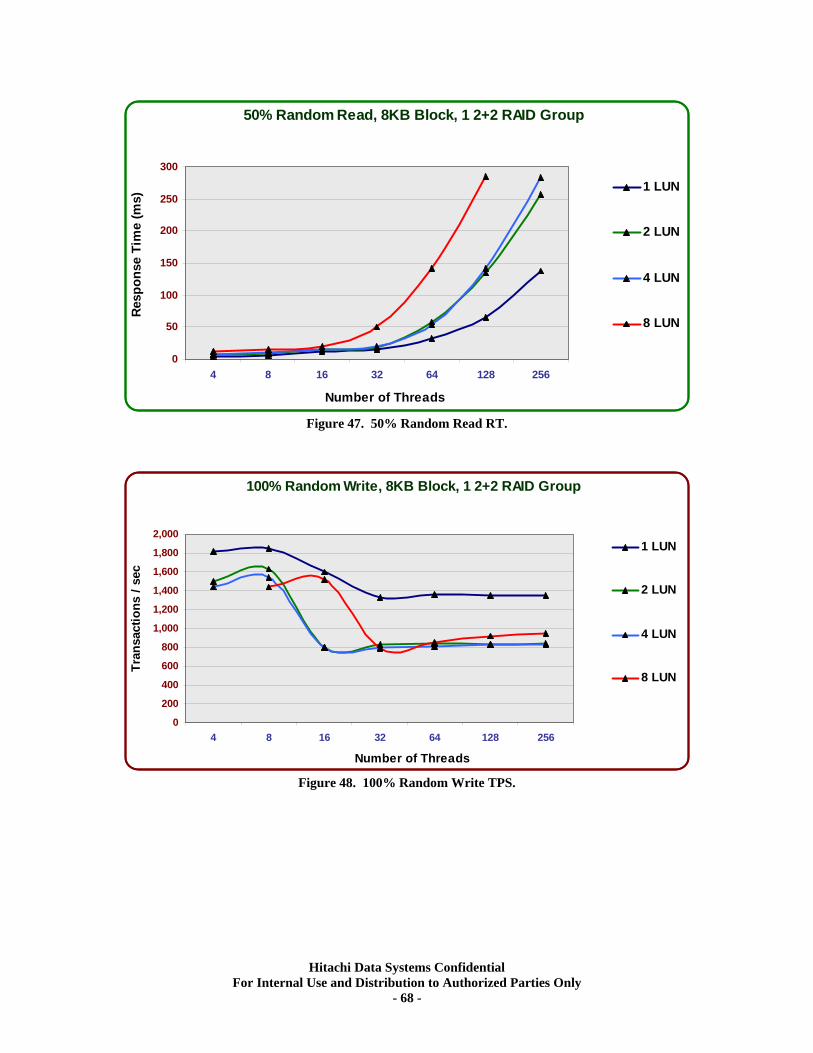
50% Random Read, 8KB Block, 1 2+2 RAID Group
0
50
100
150
200
250
300
1 LUN
4 8 16 32 64 128 256
Number of Threads
Resp
onse
Tim
e (m
s)
2 LUN
4 LUN
8 LUN
Figure 47. 50% Random Read RT.
100% Random Write, 8KB Block, 1 2+2 RAID Group
0
200
400
600
800
1,000
1,200
1,400
1,600
1,800
2,0001 LUN
4 8 16 32 64 128 256
Number of Threads
Tran
sact
ions
/ se
c
2 LUN
4 LUN
8 LUN
Figure 48. 100% Random Write TPS.
Hitachi Data Systems Confidential For Internal Use and Distribution to Authorized Parties Only
- 68 -
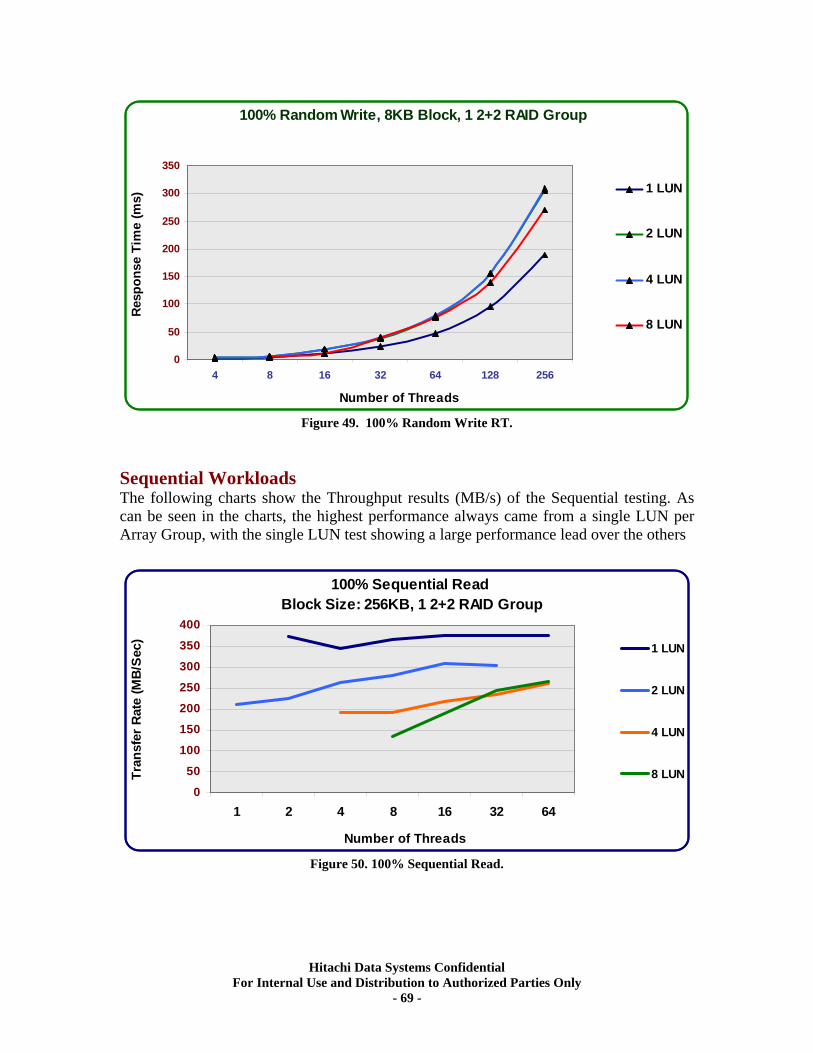
100% Random Write, 8KB Block, 1 2+2 RAID Group
0
50
100
150
200
250
300
350
1 LUN
4 8 16 32 64 128 256
Number of Threads
Res
pons
e Ti
me
(ms)
2 LUN
4 LUN
8 LUN
Figure 49. 100% Random Write RT.
Sequential Workloads The following charts show the Throughput results (MB/s) of the Sequential testing. As can be seen in the charts, the highest performance always came from a single LUN per Array Group, with the single LUN test showing a large performance lead over the others
100% Sequential Read Block Size: 256KB, 1 2+2 RAID Group
0
50
100
150
200
250
300
350
400
1 2 4 8 16 32 64
Number of Threads
Tran
sfer
Rat
e (M
B/S
ec)
1 LUN
2 LUN
4 LUN
8 LUN
Figure 50. 100% Sequential Read.
Hitachi Data Systems Confidential For Internal Use and Distribution to Authorized Parties Only
- 69 -
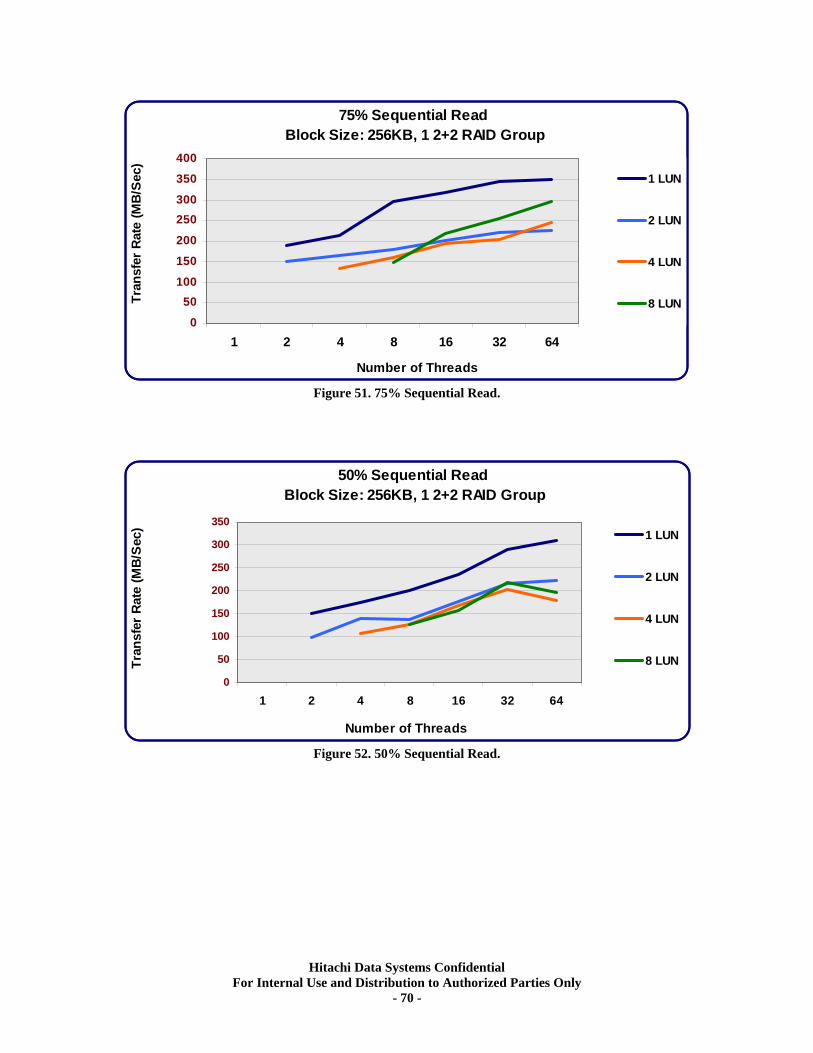
75% Sequential Read Block Size: 256KB, 1 2+2 RAID Group
0
50100
150
200
250300
350
400
1 2 4 8 16 32 64
Number of Threads
Tran
sfer
Rat
e (M
B/S
ec)
1 LUN
2 LUN
4 LUN
8 LUN
Figure 51. 75% Sequential Read.
50% Sequential Read Block Size: 256KB, 1 2+2 RAID Group
0
50
100
150
200
250
300
3501 LUN
1 2 4 8 16 32 64
Number of Threads
Tran
sfer
Rat
e (M
B/S
ec)
2 LUN
4 LUN
8 LUN
Figure 52. 50% Sequential Read.
Hitachi Data Systems Confidential For Internal Use and Distribution to Authorized Parties Only
- 70 -
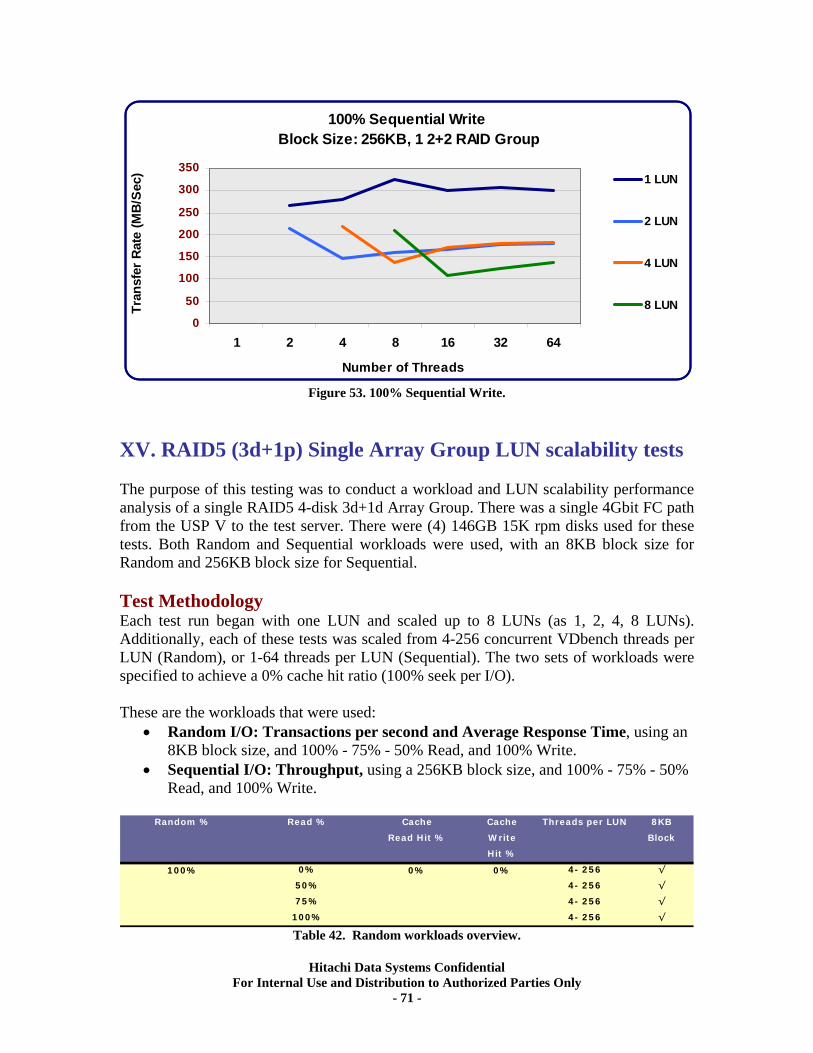
100% Sequential Write Block Size: 256KB, 1 2+2 RAID Group
0
50
100
150
200
250
300
350
1 2 4 8 16 32 64
Number of Threads
Tran
sfer
Rat
e (M
B/S
ec) 1 LUN
2 LUN
4 LUN
8 LUN
Figure 53. 100% Sequential Write.
XV. RAID5 (3d+1p) Single Array Group LUN scalability tests The purpose of this testing was to conduct a workload and LUN scalability performance analysis of a single RAID5 4-disk 3d+1d Array Group. There was a single 4Gbit FC path from the USP V to the test server. There were (4) 146GB 15K rpm disks used for these tests. Both Random and Sequential workloads were used, with an 8KB block size for Random and 256KB block size for Sequential. Test Methodology Each test run began with one LUN and scaled up to 8 LUNs (as 1, 2, 4, 8 LUNs). Additionally, each of these tests was scaled from 4-256 concurrent VDbench threads per LUN (Random), or 1-64 threads per LUN (Sequential). The two sets of workloads were specified to achieve a 0% cache hit ratio (100% seek per I/O). These are the workloads that were used:
• Random I/O: Transactions per second and Average Response Time, using an 8KB block size, and 100% - 75% - 50% Read, and 100% Write.
• Sequential I/O: Throughput, using a 256KB block size, and 100% - 75% - 50% Read, and 100% Write.
Cache Cache 8KB
Read Hit % Write Block
Hit %
0% 4- 256 √
50% 4- 256 √
75% 4- 256 √
100% 4- 256 √
100% 0% 0%
Random % Read % Threads per LUN
Table 42. Random workloads overview.
Hitachi Data Systems Confidential For Internal Use and Distribution to Authorized Parties Only
- 71 -
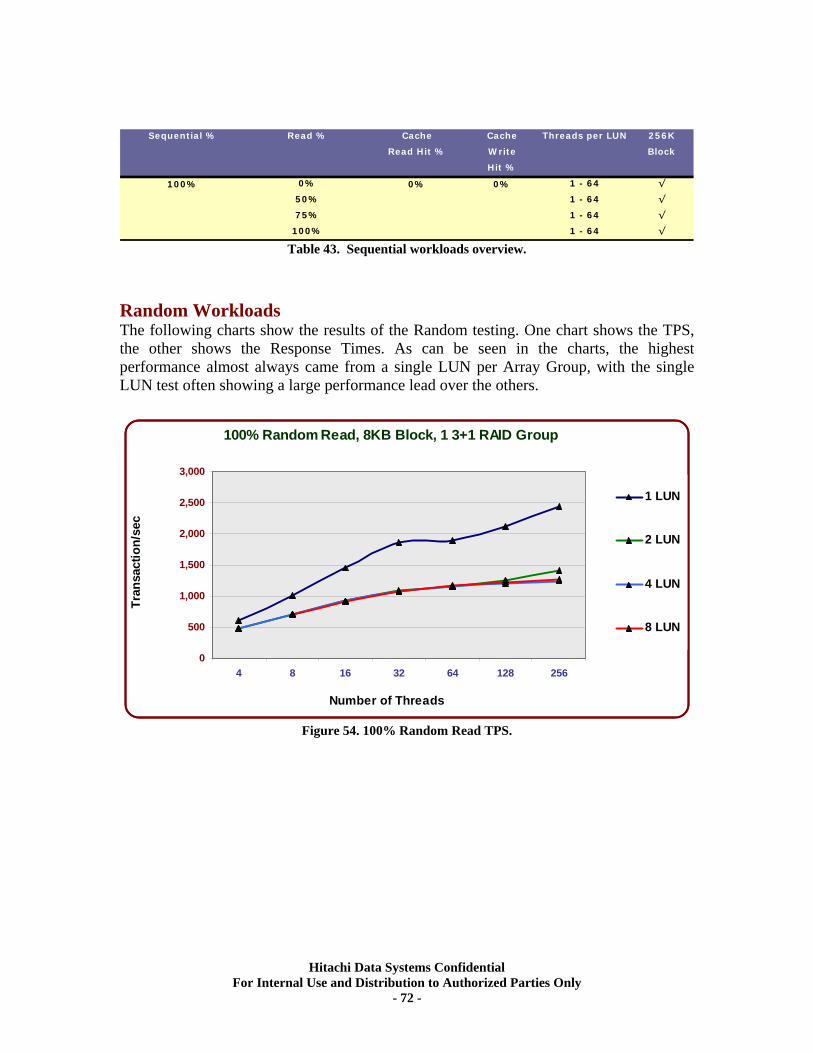
Cache Cache 256K
Read Hit % Write Block
Hit %
0% 1 - 64 √
50% 1 - 64 √
75% 1 - 64 √
100% 1 - 64 √
Sequential % Read % Threads per LUN
100% 0% 0%
Table 43. Sequential workloads overview.
Random Workloads The following charts show the results of the Random testing. One chart shows the TPS, the other shows the Response Times. As can be seen in the charts, the highest performance almost always came from a single LUN per Array Group, with the single LUN test often showing a large performance lead over the others.
100% Random Read, 8KB Block, 1 3+1 RAID Group
0
500
1,000
1,500
2,000
2,500
3,000
1 LUN
4 8 16 32 64 128 256
Number of Threads
Tran
sact
ion/
sec
2 LUN
4 LUN
8 LUN
Figure 54. 100% Random Read TPS.
Hitachi Data Systems Confidential For Internal Use and Distribution to Authorized Parties Only
- 72 -
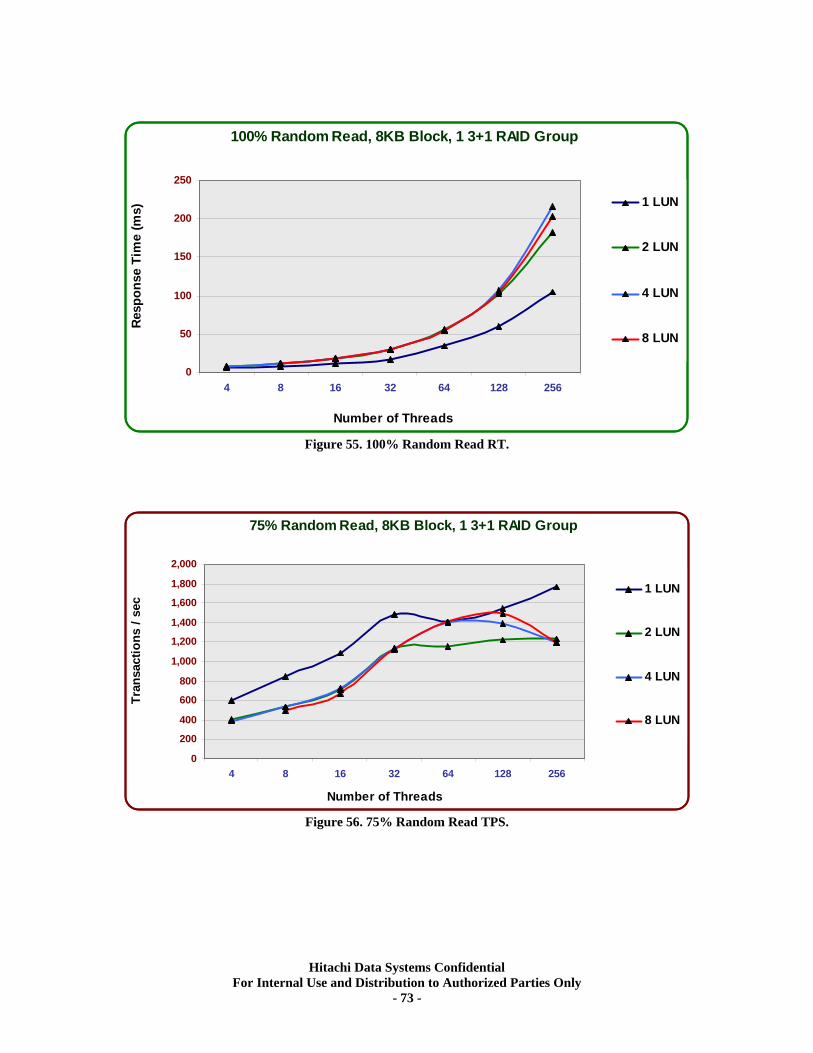
100% Random Read, 8KB Block, 1 3+1 RAID Group
0
50
100
150
200
250
1 LUN
4 8 16 32 64 128 256
Number of Threads
Resp
onse
Tim
e (m
s)
2 LUN
4 LUN
8 LUN
Figure 55. 100% Random Read RT.
75% Random Read, 8KB Block, 1 3+1 RAID Group
0
200
400
600
800
1,000
1,200
1,400
1,600
1,800
2,000
1 LUN
4 8 16 32 64 128 256
Number of Threads
Tran
sact
ions
/ se
c
2 LUN
4 LUN
8 LUN
Figure 56. 75% Random Read TPS.
Hitachi Data Systems Confidential For Internal Use and Distribution to Authorized Parties Only
- 73 -
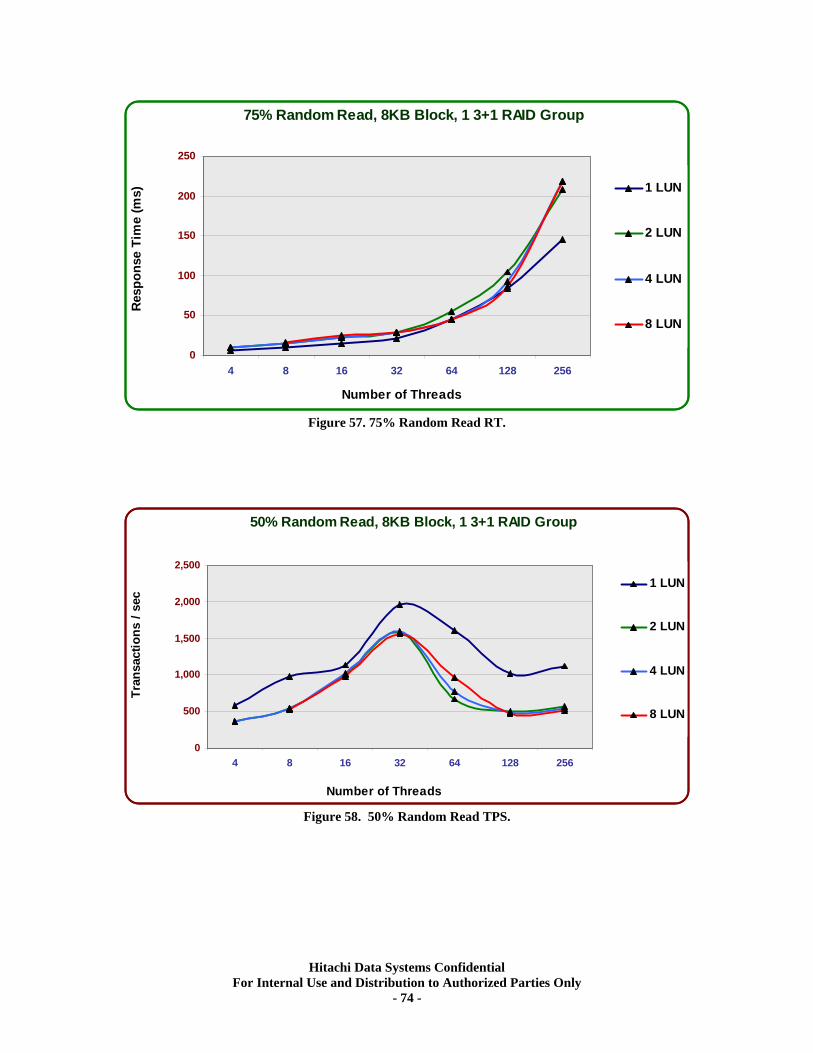
75% Random Read, 8KB Block, 1 3+1 RAID Group
0
50
100
150
200
250
1 LUN
4 8 16 32 64 128 256
Number of Threads
Res
pons
e Ti
me
(ms)
2 LUN
4 LUN
8 LUN
Figure 57. 75% Random Read RT.
50% Random Read, 8KB Block, 1 3+1 RAID Group
0
500
1,000
1,500
2,000
2,500
1 LUN
4 8 16 32 64 128 256
Number of Threads
Tran
sact
ions
/ se
c
2 LUN
4 LUN
8 LUN
Figure 58. 50% Random Read TPS.
Hitachi Data Systems Confidential For Internal Use and Distribution to Authorized Parties Only
- 74 -
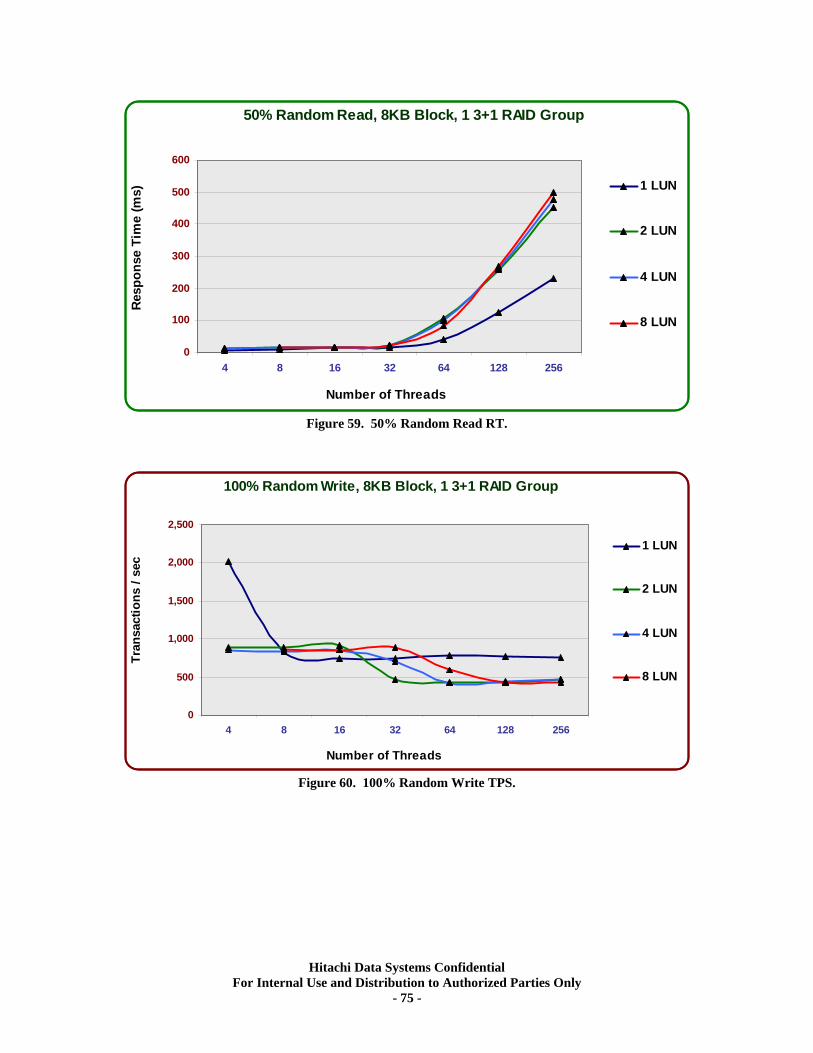
50% Random Read, 8KB Block, 1 3+1 RAID Group
0
100
200
300
400
500
600
1 LUN
4 8 16 32 64 128 256
Number of Threads
Resp
onse
Tim
e (m
s)
2 LUN
4 LUN
8 LUN
Figure 59. 50% Random Read RT.
100% Random Write, 8KB Block, 1 3+1 RAID Group
0
500
1,000
1,500
2,000
2,500
1 LUN
4 8 16 32 64 128 256
Number of Threads
Tran
sact
ions
/ se
c
2 LUN
4 LUN
8 LUN
Figure 60. 100% Random Write TPS.
Hitachi Data Systems Confidential For Internal Use and Distribution to Authorized Parties Only
- 75 -
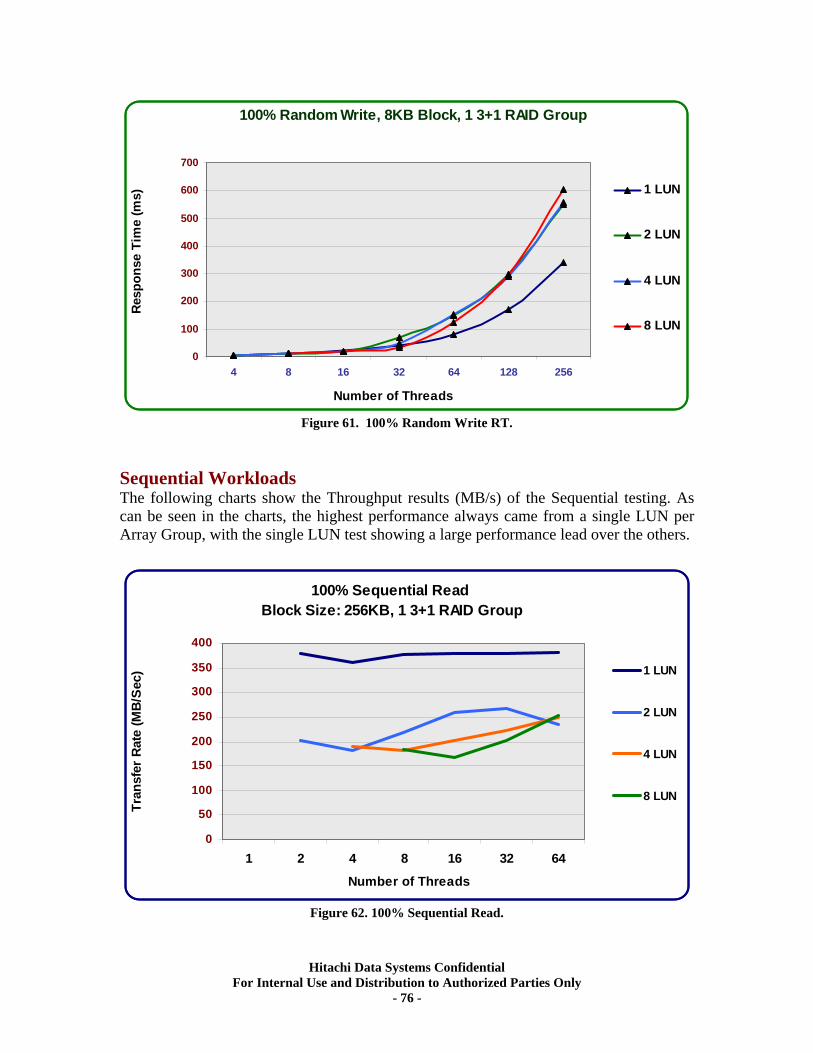
100% Random Write, 8KB Block, 1 3+1 RAID Group
0
100
200
300
400
500
600
700
1 LUN
4 8 16 32 64 128 256
Number of Threads
Resp
onse
Tim
e (m
s)
2 LUN
4 LUN
8 LUN
Figure 61. 100% Random Write RT.
Sequential Workloads The following charts show the Throughput results (MB/s) of the Sequential testing. As can be seen in the charts, the highest performance always came from a single LUN per Array Group, with the single LUN test showing a large performance lead over the others.
100% Sequential Read Block Size: 256KB, 1 3+1 RAID Group
0
50
100
150
200
250
300
350
400
1 2 4 8 16 32 64
Number of Threads
Tran
sfer
Rat
e (M
B/S
ec) 1 LUN
2 LUN
4 LUN
8 LUN
Figure 62. 100% Sequential Read.
Hitachi Data Systems Confidential For Internal Use and Distribution to Authorized Parties Only
- 76 -
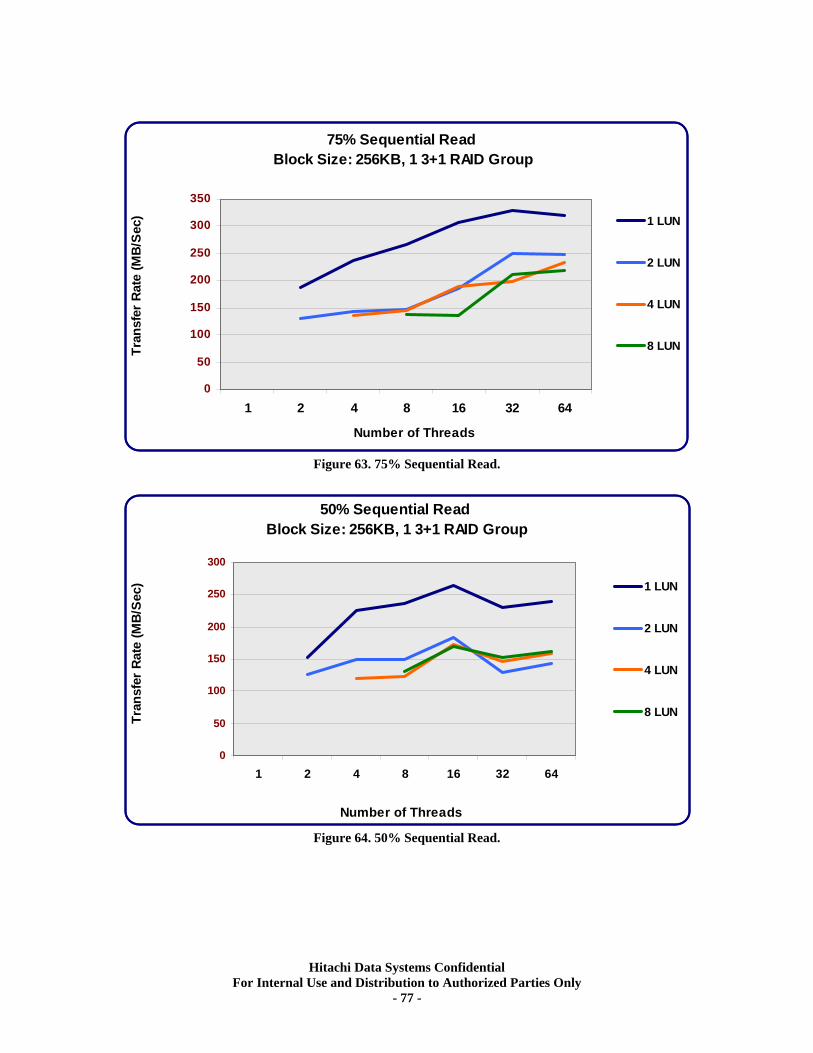
75% Sequential Read Block Size: 256KB, 1 3+1 RAID Group
0
50
100
150
200
250
300
350
1 LUN
1 2 4 8 16 32 64
Number of Threads
Tran
sfer
Rat
e (M
B/S
ec)
2 LUN
4 LUN
8 LUN
Figure 63. 75% Sequential Read.
50% Sequential Read Block Size: 256KB, 1 3+1 RAID Group
0
50
100
150
200
250
300
1 LUN
1 2 4 8 16 32 64
Number of Threads
Tran
sfer
Rat
e (M
B/Se
c)
2 LUN
4 LUN
8 LUN
Figure 64. 50% Sequential Read.
Hitachi Data Systems Confidential For Internal Use and Distribution to Authorized Parties Only
- 77 -
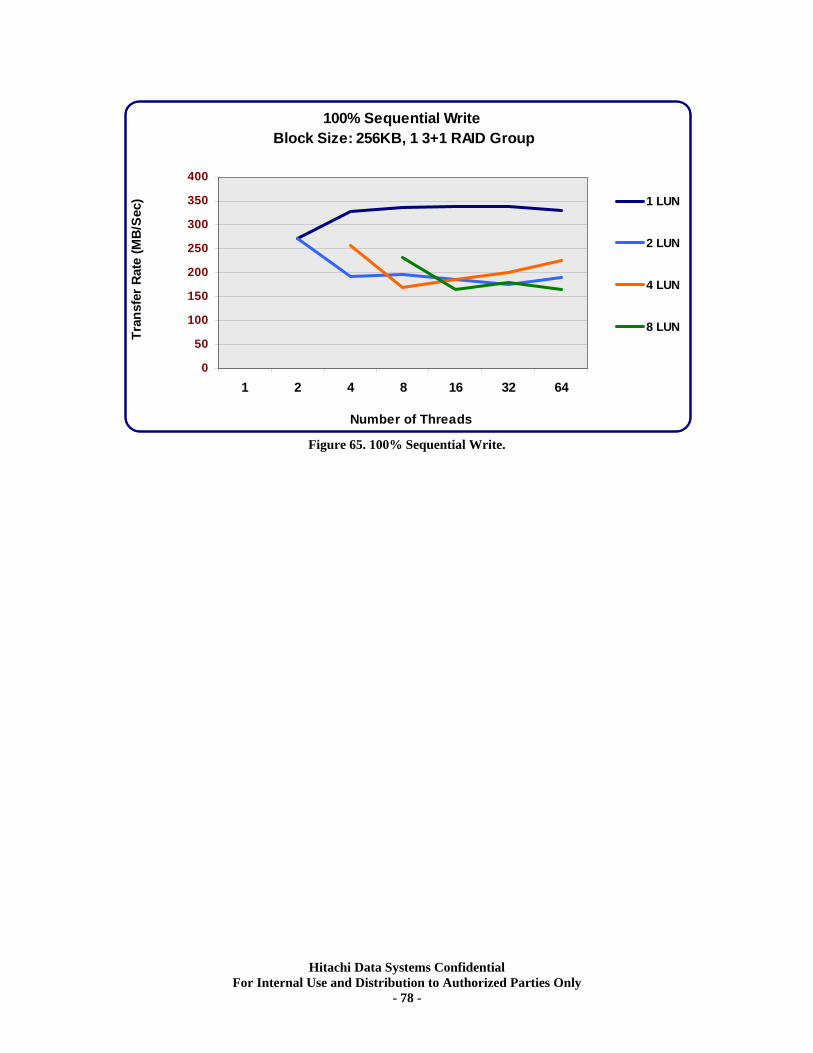
100% Sequential Write Block Size: 256KB, 1 3+1 RAID Group
0
50
100
150
200
250
300
350
400
1 2 4 8 16 32 64
Number of Threads
Tran
sfer
Rat
e (M
B/S
ec) 1 LUN
2 LUN
4 LUN
8 LUN
Figure 65. 100% Sequential Write.
Hitachi Data Systems Confidential For Internal Use and Distribution to Authorized Parties Only
- 78 -
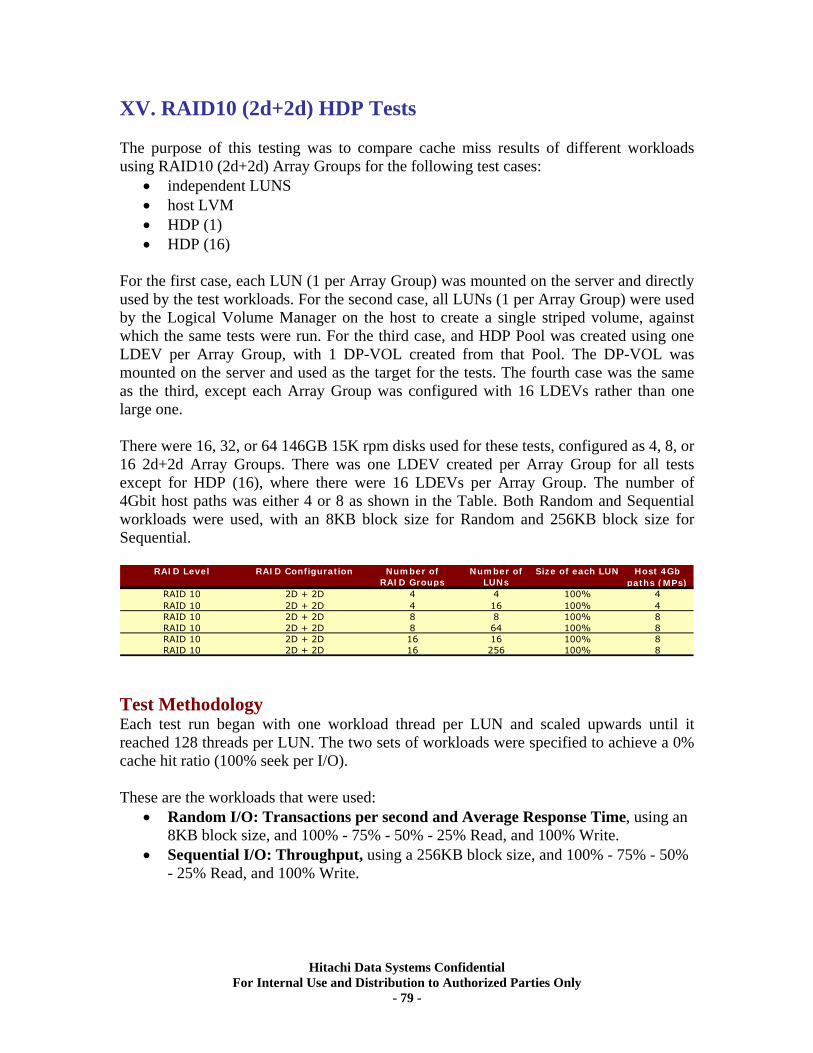
XV. RAID10 (2d+2d) HDP Tests The purpose of this testing was to compare cache miss results of different workloads using RAID10 (2d+2d) Array Groups for the following test cases:
• independent LUNS • host LVM • HDP (1) • HDP (16)
For the first case, each LUN (1 per Array Group) was mounted on the server and directly used by the test workloads. For the second case, all LUNs (1 per Array Group) were used by the Logical Volume Manager on the host to create a single striped volume, against which the same tests were run. For the third case, and HDP Pool was created using one LDEV per Array Group, with 1 DP-VOL created from that Pool. The DP-VOL was mounted on the server and used as the target for the tests. The fourth case was the same as the third, except each Array Group was configured with 16 LDEVs rather than one large one. There were 16, 32, or 64 146GB 15K rpm disks used for these tests, configured as 4, 8, or 16 2d+2d Array Groups. There was one LDEV created per Array Group for all tests except for HDP (16), where there were 16 LDEVs per Array Group. The number of 4Gbit host paths was either 4 or 8 as shown in the Table. Both Random and Sequential workloads were used, with an 8KB block size for Random and 256KB block size for Sequential.
Number of Number ofRAID Groups LUNs
RAID 10 2D + 2D 4 4 100% 4RAID 10 2D + 2D 4 16 100% 4RAID 10 2D + 2D 8 8 100% 8RAID 10 2D + 2D 8 64 100% 8RAID 10 2D + 2D 16 16 100% 8RAID 10 2D + 2D 16 256 100% 8
Host 4Gb paths (MPs)
RAID Level RAID Configuration Size of each LUN
Test Methodology Each test run began with one workload thread per LUN and scaled upwards until it reached 128 threads per LUN. The two sets of workloads were specified to achieve a 0% cache hit ratio (100% seek per I/O). These are the workloads that were used:
• Random I/O: Transactions per second and Average Response Time, using an 8KB block size, and 100% - 75% - 50% - 25% Read, and 100% Write.
• Sequential I/O: Throughput, using a 256KB block size, and 100% - 75% - 50% - 25% Read, and 100% Write.
Hitachi Data Systems Confidential For Internal Use and Distribution to Authorized Parties Only
- 79 -
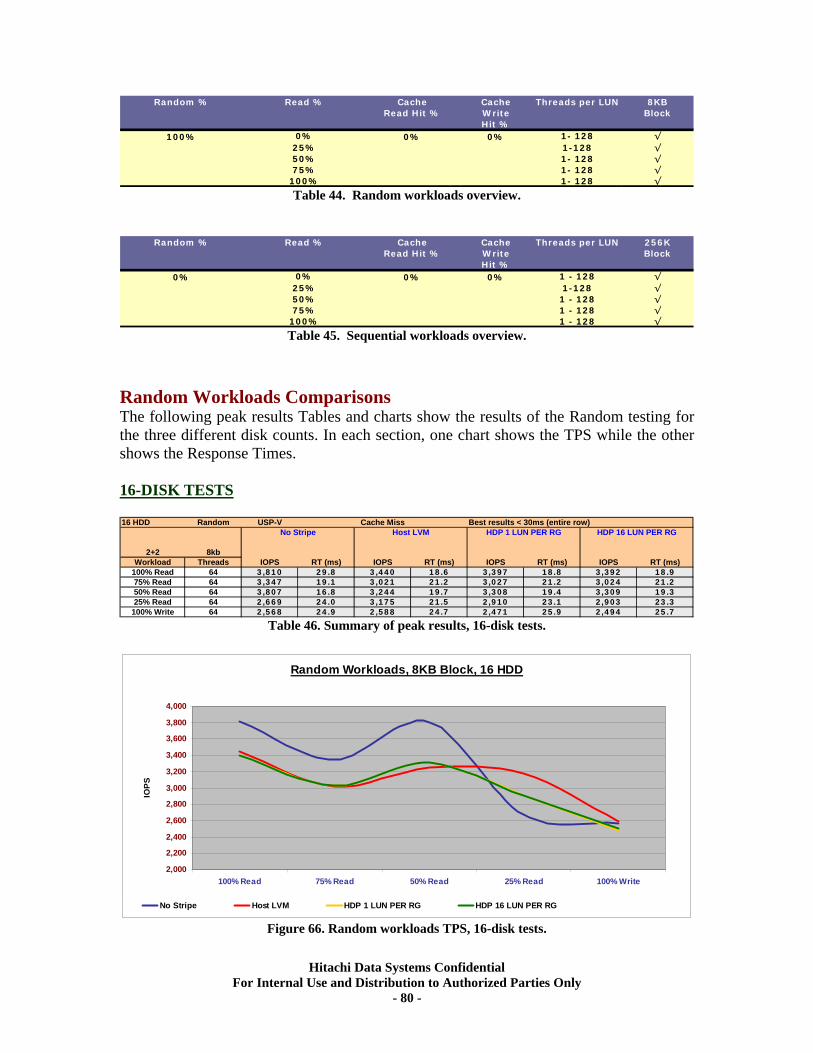
Cache Cache 8KBRead Hit % Write Block
Hit %0% 1- 128 √
25% 1-128 √50% 1- 128 √75% 1- 128 √
100% 1- 128 √
Random % Read % Threads per LUN
100% 0% 0%
Table 44. Random workloads overview.
Cache Cache 256KRead Hit % Write Block
Hit %0% 1 - 128 √
25% 1-128 √50% 1 - 128 √75% 1 - 128 √
100% 1 - 128 √
Random % Read % Threads per LUN
0% 0% 0%
Table 45. Sequential workloads overview.
Random Workloads Comparisons The following peak results Tables and charts show the results of the Random testing for the three different disk counts. In each section, one chart shows the TPS while the other shows the Response Times. 16-DISK TESTS 16 HDD Random USP-V Cache Miss Best results < 30ms (entire row)
2+2 8kbWorkload Threads IOPS RT (ms) IOPS RT (ms) IOPS RT (ms) IOPS RT (ms)
100% Read 64 3,810 29.8 3,440 18.6 3,397 18.8 3,392 18.975% Read 64 3,347 19.1 3,021 21.2 3,027 21.2 3,024 21.250% Read 64 3,807 16.8 3,244 19.7 3,308 19.4 3,309 19.325% Read 64 2,669 24.0 3,175 21.5 2,910 23.1 2,903 23.3
100% Write 64 2,568 24.9 2,588 24.7 2,471 25.9 2,494 25.7
HDP 16 LUN PER RGNo Stripe Host LVM HDP 1 LUN PER RG
Table 46. Summary of peak results, 16-disk tests.
Random Workloads, 8KB Block, 16 HDD
2,000
2,200
2,400
2,600
2,800
3,000
3,200
3,400
3,600
3,800
4,000
100% Read 75% Read 50% Read 25% Read 100% Write
IOPS
No Stripe Host LVM HDP 1 LUN PER RG HDP 16 LUN PER RG
Figure 66. Random workloads TPS, 16-disk tests.
Hitachi Data Systems Confidential For Internal Use and Distribution to Authorized Parties Only
- 80 -
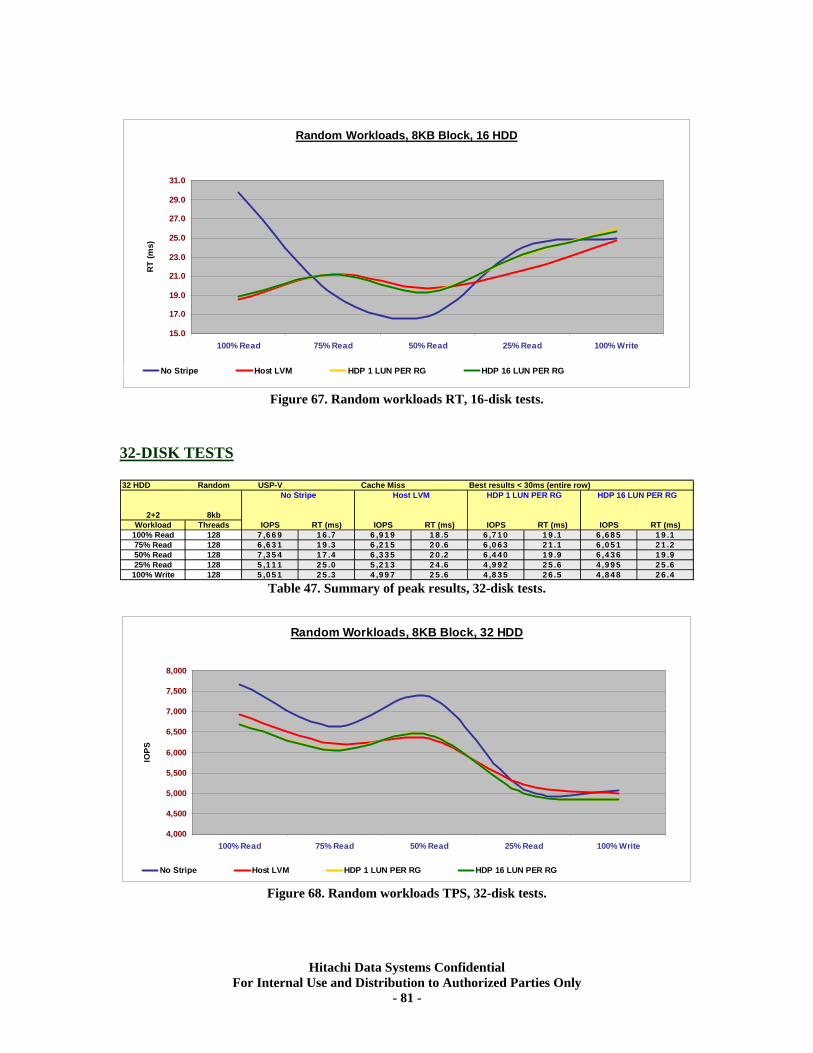
Random Workloads, 8KB Block, 16 HDD
15.0
17.0
19.0
21.0
23.0
25.0
27.0
29.0
31.0
100% Read 75% Read 50% Read 25% Read 100% Write
RT
(ms)
No Stripe Host LVM HDP 1 LUN PER RG HDP 16 LUN PER RG
Figure 67. Random workloads RT, 16-disk tests.
32-DISK TESTS
32 HDD Random USP-V Cache Miss Best results < 30ms (entire row)
2+2 8kbWorkload Threads IOPS RT (ms) IOPS RT (ms) IOPS RT (ms) IOPS RT (ms)
100% Read 128 7,669 16.7 6,919 18.5 6,710 19.1 6,685 19.175% Read 128 6,631 19.3 6,215 20.6 6,063 21.1 6,051 21.250% Read 128 7,354 17.4 6,335 20.2 6,440 19.9 6,436 19.925% Read 128 5,111 25.0 5,213 24.6 4,992 25.6 4,995 25.6
100% Write 128 5,051 25.3 4,997 25.6 4,835 26.5 4,848 26.4
HDP 16 LUN PER RGNo Stripe Host LVM HDP 1 LUN PER RG
Table 47. Summary of peak results, 32-disk tests.
Random Workloads, 8KB Block, 32 HDD
4,000
4,500
5,000
5,500
6,000
6,500
7,000
7,500
8,000
100% Read 75% Read 50% Read 25% Read 100% Write
IOPS
No Stripe Host LVM HDP 1 LUN PER RG HDP 16 LUN PER RG
Figure 68. Random workloads TPS, 32-disk tests.
Hitachi Data Systems Confidential For Internal Use and Distribution to Authorized Parties Only
- 81 -
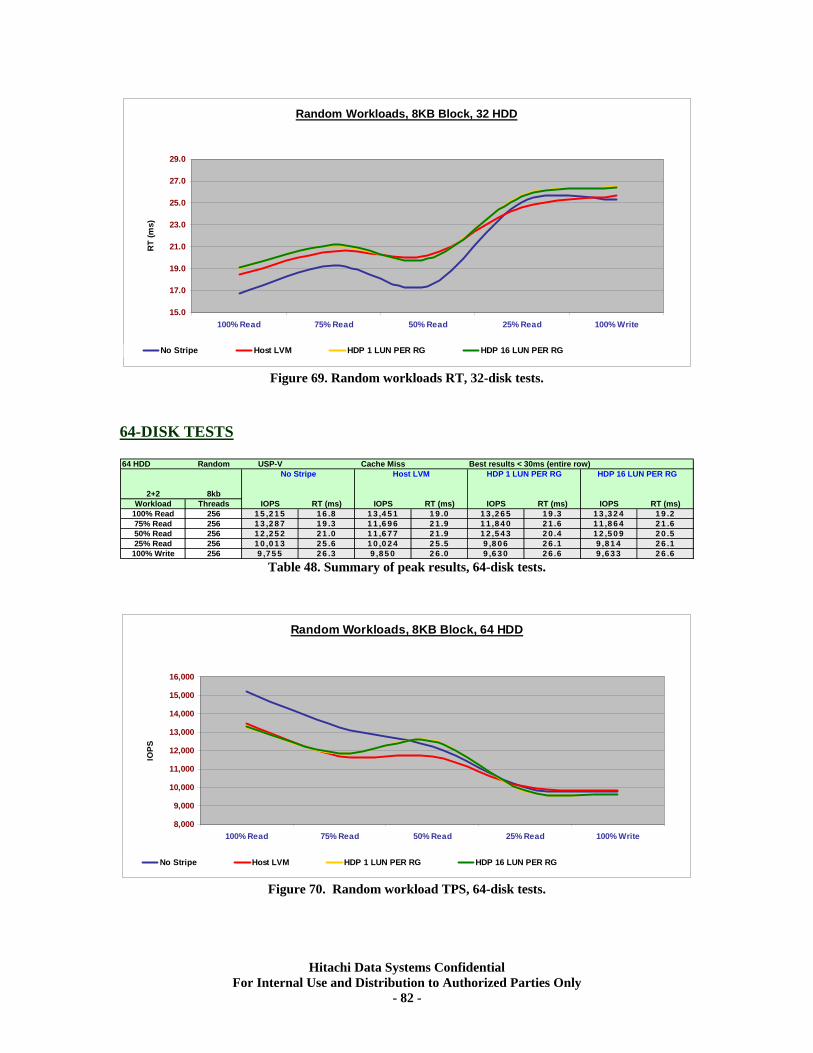
Random Workloads, 8KB Block, 32 HDD
15.0
17.0
19.0
21.0
23.0
25.0
27.0
29.0
100% Read 75% Read 50% Read 25% Read 100% Write
RT
(ms)
No Stripe Host LVM HDP 1 LUN PER RG HDP 16 LUN PER RG
Figure 69. Random workloads RT, 32-disk tests.
64-DISK TESTS
64 HDD Random USP-V Cache Miss Best results < 30ms (entire row)
2+2 8kbWorkload Threads IOPS RT (ms) IOPS RT (ms) IOPS RT (ms) IOPS RT (ms)
100% Read 256 15,215 16.8 13,451 19.0 13,265 19.3 13,324 19.275% Read 256 13,287 19.3 11,696 21.9 11,840 21.6 11,864 21.650% Read 256 12,252 21.0 11,677 21.9 12,543 20.4 12,509 20.525% Read 256 10,013 25.6 10,024 25.5 9,806 26.1 9,814 26.1
100% Write 256 9,755 26.3 9,850 26.0 9,630 26.6 9,633 26.6
HDP 16 LUN PER RGNo Stripe Host LVM HDP 1 LUN PER RG
Table 48. Summary of peak results, 64-disk tests.
Random Workloads, 8KB Block, 64 HDD
8,000
9,000
10,000
11,000
12,000
13,000
14,000
15,000
16,000
100% Read 75% Read 50% Read 25% Read 100% Write
IOPS
No Stripe Host LVM HDP 1 LUN PER RG HDP 16 LUN PER RG
Figure 70. Random workload TPS, 64-disk tests.
Hitachi Data Systems Confidential For Internal Use and Distribution to Authorized Parties Only
- 82 -
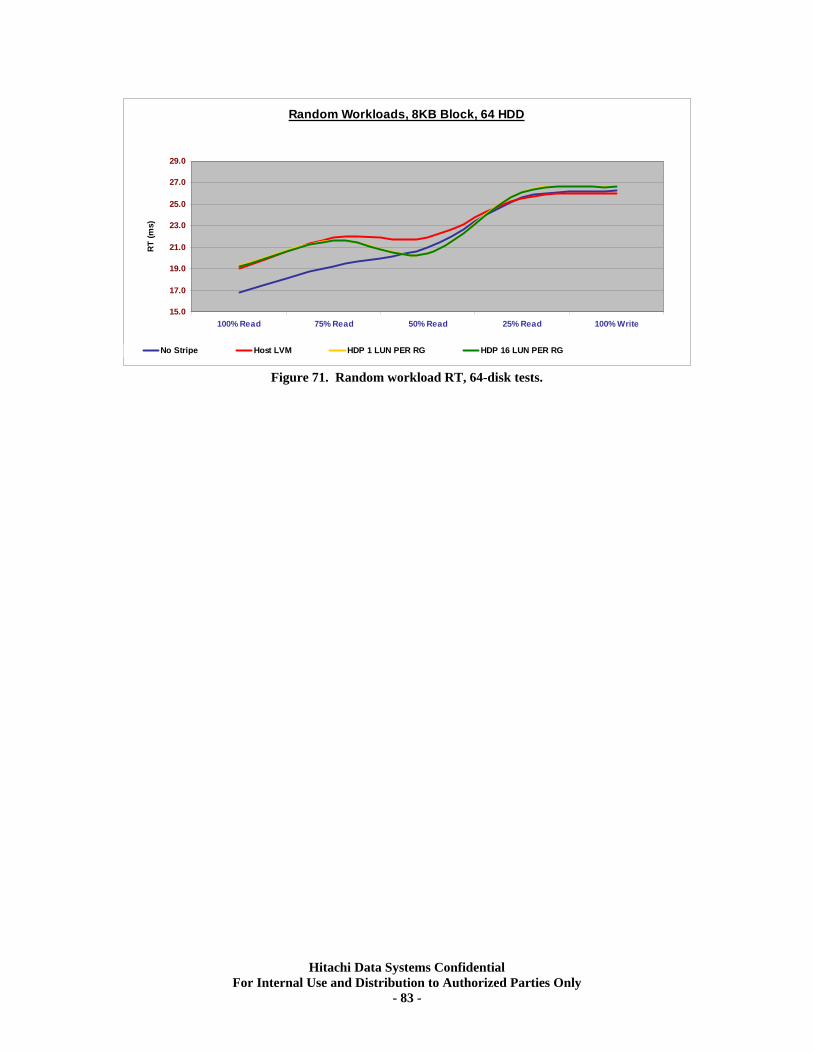
Random Workloads, 8KB Block, 64 HDD
15.0
17.0
19.0
21.0
23.0
25.0
27.0
29.0
100% Read 75% Read 50% Read 25% Read 100% Write
RT
(ms)
No Stripe Host LVM HDP 1 LUN PER RG HDP 16 LUN PER RG
Figure 71. Random workload RT, 64-disk tests.
Hitachi Data Systems Confidential For Internal Use and Distribution to Authorized Parties Only
- 83 -
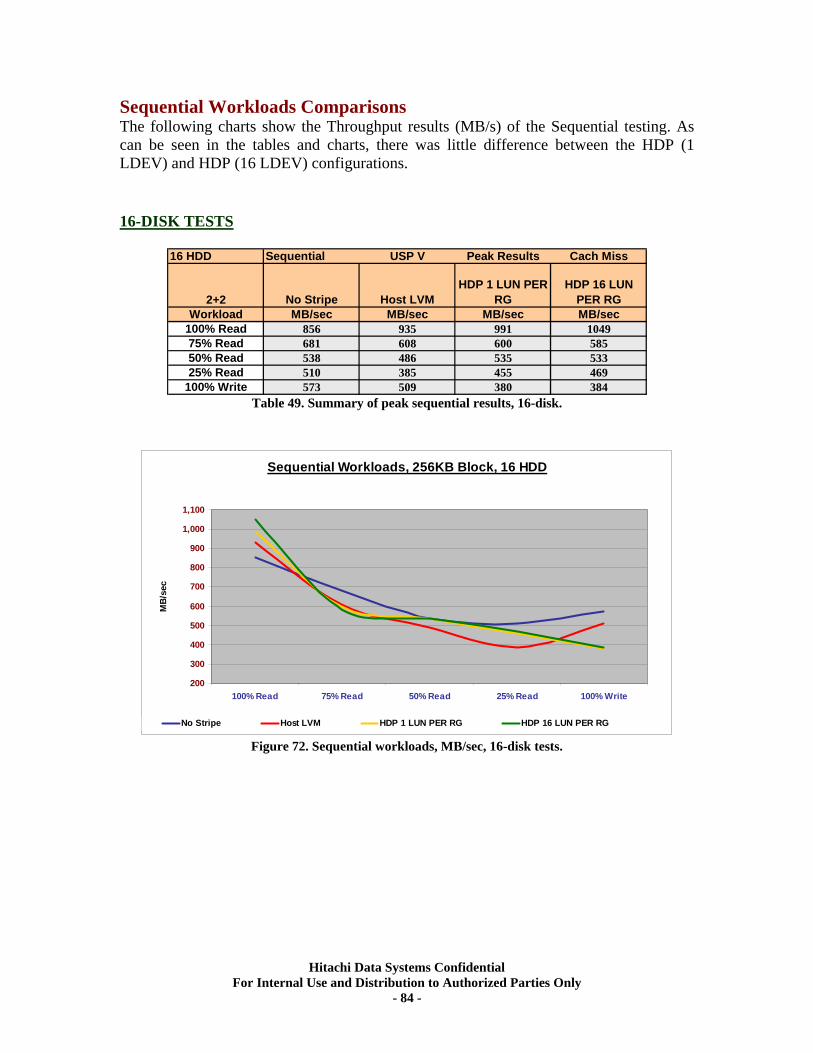
Sequential Workloads Comparisons The following charts show the Throughput results (MB/s) of the Sequential testing. As can be seen in the tables and charts, there was little difference between the HDP (1 LDEV) and HDP (16 LDEV) configurations. 16-DISK TESTS
16 HDD Sequential USP V Peak Results Cach Miss
2+2 No Stripe Host LVMHDP 1 LUN PER
RGHDP 16 LUN
PER RGWorkload MB/sec MB/sec MB/sec MB/sec
100% Read 856 935 991 104975% Read 681 608 600 58550% Read 538 486 535 53325% Read 510 385 455 469
100% Write 573 509 380 384 Table 49. Summary of peak sequential results, 16-disk.
Sequential Workloads, 256KB Block, 16 HDD
200
300
400
500
600
700
800
900
1,000
1,100
100% Read 75% Read 50% Read 25% Read 100% Write
MB/
sec
No Stripe Host LVM HDP 1 LUN PER RG HDP 16 LUN PER RG
Figure 72. Sequential workloads, MB/sec, 16-disk tests.
Hitachi Data Systems Confidential For Internal Use and Distribution to Authorized Parties Only
- 84 -
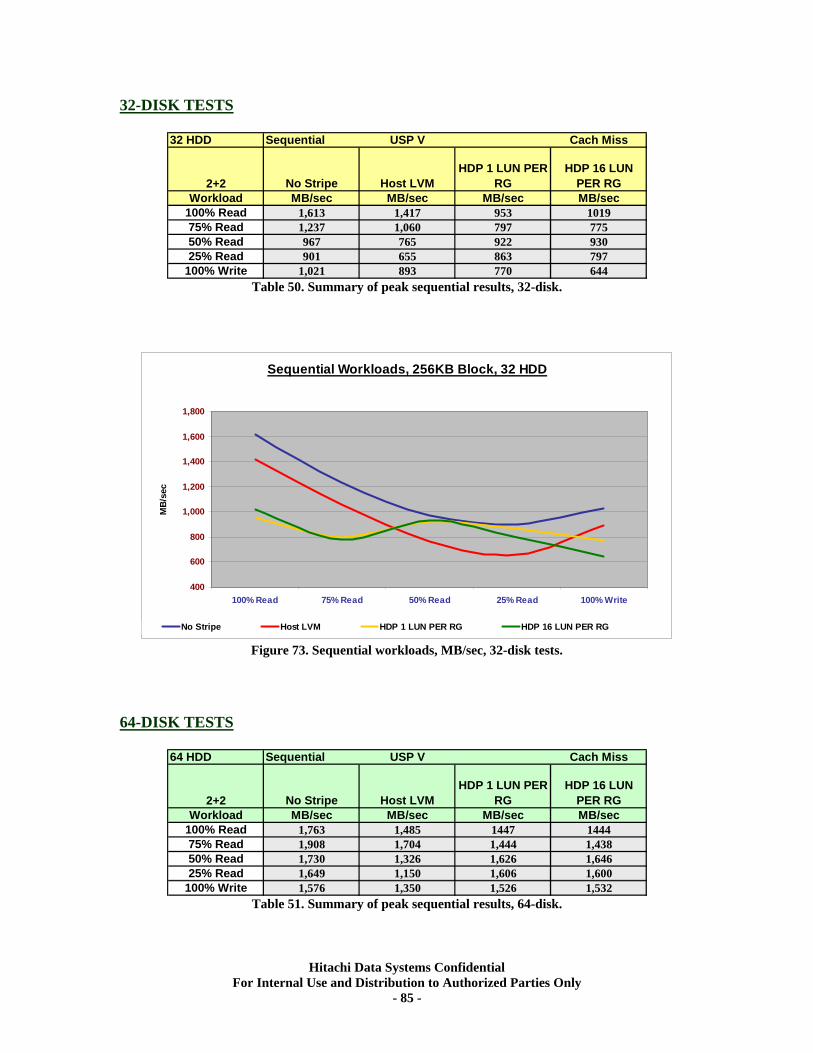
32-DISK TESTS
32 HDD Sequential USP V Cach Miss
2+2 No Stripe Host LVMHDP 1 LUN PER
RGHDP 16 LUN
PER RGWorkload MB/sec MB/sec MB/sec MB/sec
100% Read 1,613 1,417 953 101975% Read 1,237 1,060 797 77550% Read 967 765 922 93025% Read 901 655 863 797
100% Write 1,021 893 770 644 Table 50. Summary of peak sequential results, 32-disk.
Sequential Workloads, 256KB Block, 32 HDD
400
600
800
1,000
1,200
1,400
1,600
1,800
100% Read 75% Read 50% Read 25% Read 100% Write
MB/
sec
No Stripe Host LVM HDP 1 LUN PER RG HDP 16 LUN PER RG
Figure 73. Sequential workloads, MB/sec, 32-disk tests.
64-DISK TESTS
64 HDD Sequential USP V Cach Miss
2+2 No Stripe Host LVMHDP 1 LUN PER
RGHDP 16 LUN
PER RGWorkload MB/sec MB/sec MB/sec MB/sec
100% Read 1,763 1,485 1447 144475% Read 1,908 1,704 1,444 1,43850% Read 1,730 1,326 1,626 1,64625% Read 1,649 1,150 1,606 1,600
100% Write 1,576 1,350 1,526 1,532 Table 51. Summary of peak sequential results, 64-disk.
Hitachi Data Systems Confidential For Internal Use and Distribution to Authorized Parties Only
- 85 -
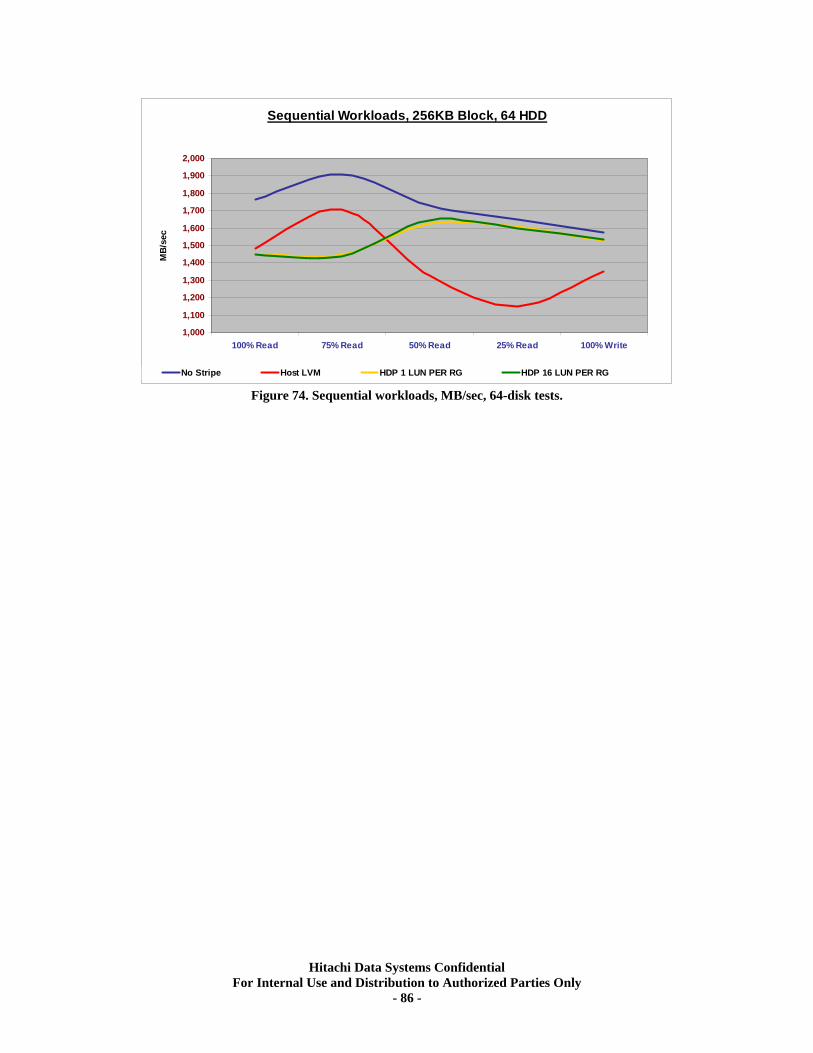
Sequential Workloads, 256KB Block, 64 HDD
1,000
1,100
1,200
1,300
1,400
1,500
1,600
1,700
1,800
1,900
2,000
100% Read 75% Read 50% Read 25% Read 100% Write
MB/
sec
No Stripe Host LVM HDP 1 LUN PER RG HDP 16 LUN PER RG
Figure 74. Sequential workloads, MB/sec, 64-disk tests.
Hitachi Data Systems Confidential For Internal Use and Distribution to Authorized Parties Only
- 86 -
XVI. Summary The Universal Storage Platform V offers great flexibility and it should perform superbly in any environment. At the hardware level, it offers considerably more IOPS power than does the equivalent USP line of products. Even though the USP already delivered best-of-class Sequential performance (about 3x higher than any competition with 9GB/s Read, 4GB/s write), the USP V is outperforming the USP on initial tests. Newer versions of microcode should open up that advantage even more. It is vital, however, that Hitachi Data Systems’ sales personnel, technical support staff, value-added resellers, and others who are responsible delivery of solutions, invest the time required to design the best possible solution to meet each customer’s unique requirements, whether it be capacity, reliability, performance or cost. To assist in delivering the highest quality solution, Hitachi Data Systems’ Global Solution Services should be engaged.
Hitachi Data Systems Confidential For Internal Use and Distribution to Authorized Parties Only
- 87 -
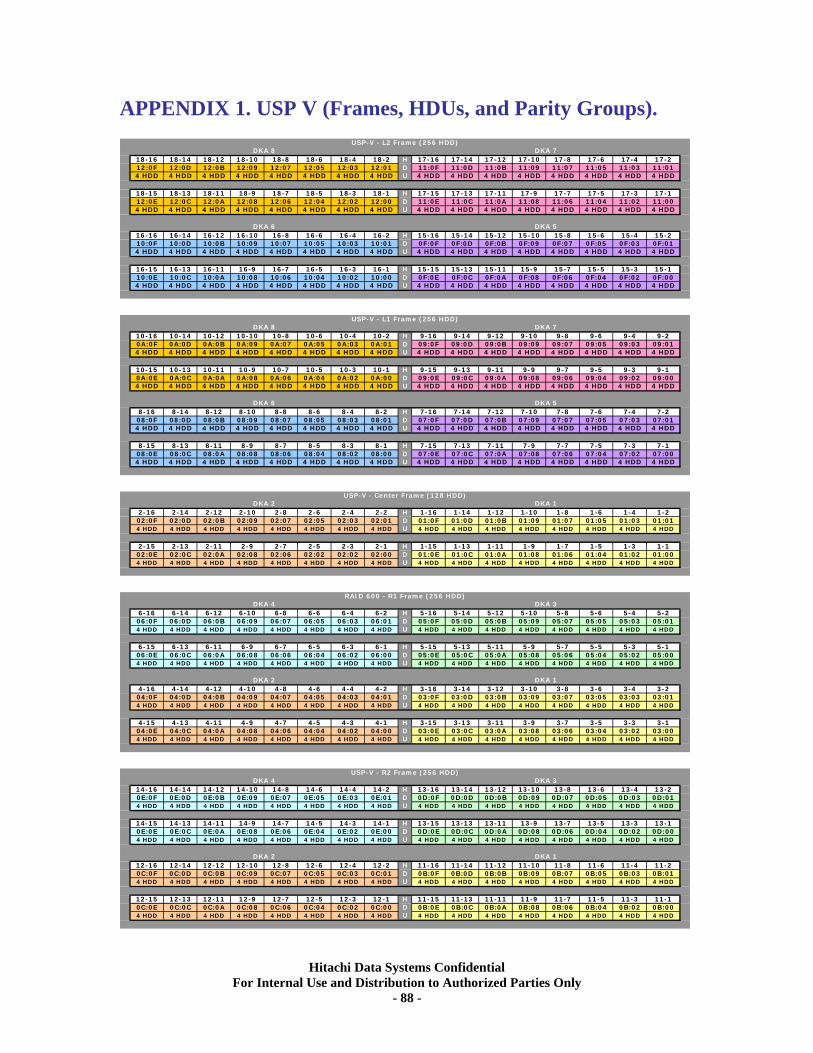
APPENDIX 1. USP V (Frames, HDUs, and Parity Groups).
18-16 18-14 18-12 18-10 18-8 18-6 18-4 18-2 H 17-16 17-14 17-12 17-10 17-8 17-6 17-4 17-212:0F 12:0D 12:0B 12:09 12:07 12:05 12:03 12:01 D 11:0F 11:0D 11:0B 11:09 11:07 11:05 11:03 11:014 HDD 4 HDD 4 HDD 4 HDD 4 HDD 4 HDD 4 HDD 4 HDD U 4 HDD 4 HDD 4 HDD 4 HDD 4 HDD 4 HDD 4 HDD 4 HDD
18-15 18-13 18-11 18-9 18-7 18-5 18-3 18-1 H 17-15 17-13 17-11 17-9 17-7 17-5 17-3 17-112:0E 12:0C 12:0A 12:08 12:06 12:04 12:02 12:00 D 11:0E 11:0C 11:0A 11:08 11:06 11:04 11:02 11:004 HDD 4 HDD 4 HDD 4 HDD 4 HDD 4 HDD 4 HDD 4 HDD U 4 HDD 4 HDD 4 HDD 4 HDD 4 HDD 4 HDD 4 HDD 4 HDD
16-16 16-14 16-12 16-10 16-8 16-6 16-4 16-2 H 15-16 15-14 15-12 15-10 15-8 15-6 15-4 15-210:0F 10:0D 10:0B 10:09 10:07 10:05 10:03 10:01 D 0F:0F 0F:0D 0F:0B 0F:09 0F:07 0F:05 0F:03 0F:014 HDD 4 HDD 4 HDD 4 HDD 4 HDD 4 HDD 4 HDD 4 HDD U 4 HDD 4 HDD 4 HDD 4 HDD 4 HDD 4 HDD 4 HDD 4 HDD
16-15 16-13 16-11 16-9 16-7 16-5 16-3 16-1 H 15-15 15-13 15-11 15-9 15-7 15-5 15-3 15-110:0E 10:0C 10:0A 10:08 10:06 10:04 10:02 10:00 D 0F:0E 0F:0C 0F:0A 0F:08 0F:06 0F:04 0F:02 0F:004 HDD 4 HDD 4 HDD 4 HDD 4 HDD 4 HDD 4 HDD 4 HDD U 4 HDD 4 HDD 4 HDD 4 HDD 4 HDD 4 HDD 4 HDD 4 HDD
10-16 10-14 10-12 10-10 10-8 10-6 10-4 10-2 H 9-16 9-14 9-12 9-10 9-8 9-6 9-4 9-20A:0F 0A:0D 0A:0B 0A:09 0A:07 0A:05 0A:03 0A:01 D 09:0F 09:0D 09:0B 09:09 09:07 09:05 09:03 09:014 HDD 4 HDD 4 HDD 4 HDD 4 HDD 4 HDD 4 HDD 4 HDD U 4 HDD 4 HDD 4 HDD 4 HDD 4 HDD 4 HDD 4 HDD 4 HDD
10-15 10-13 10-11 10-9 10-7 10-5 10-3 10-1 H 9-15 9-13 9-11 9-9 9-7 9-5 9-3 9-10A:0E 0A:0C 0A:0A 0A:08 0A:06 0A:04 0A:02 0A:00 D 09:0E 09:0C 09:0A 09:08 09:06 09:04 09:02 09:004 HDD 4 HDD 4 HDD 4 HDD 4 HDD 4 HDD 4 HDD 4 HDD U 4 HDD 4 HDD 4 HDD 4 HDD 4 HDD 4 HDD 4 HDD 4 HDD
8-16 8-14 8-12 8-10 8-8 8-6 8-4 8-2 H 7-16 7-14 7-12 7-10 7-8 7-6 7-4 7-208:0F 08:0D 08:0B 08:09 08:07 08:05 08:03 08:01 D 07:0F 07:0D 07:0B 07:09 07:07 07:05 07:03 07:014 HDD 4 HDD 4 HDD 4 HDD 4 HDD 4 HDD 4 HDD 4 HDD U 4 HDD 4 HDD 4 HDD 4 HDD 4 HDD 4 HDD 4 HDD 4 HDD
8-15 8-13 8-11 8-9 8-7 8-5 8-3 8-1 H 7-15 7-13 7-11 7-9 7-7 7-5 7-3 7-108:0E 08:0C 08:0A 08:08 08:06 08:04 08:02 08:00 D 07:0E 07:0C 07:0A 07:08 07:06 07:04 07:02 07:004 HDD 4 HDD 4 HDD 4 HDD 4 HDD 4 HDD 4 HDD 4 HDD U 4 HDD 4 HDD 4 HDD 4 HDD 4 HDD 4 HDD 4 HDD 4 HDD
2-16 2-14 2-12 2-10 2-8 2-6 2-4 2-2 H 1-16 1-14 1-12 1-10 1-8 1-6 1-4 1-202:0F 02:0D 02:0B 02:09 02:07 02:05 02:03 02:01 D 01:0F 01:0D 01:0B 01:09 01:07 01:05 01:03 01:014 HDD 4 HDD 4 HDD 4 HDD 4 HDD 4 HDD 4 HDD 4 HDD U 4 HDD 4 HDD 4 HDD 4 HDD 4 HDD 4 HDD 4 HDD 4 HDD
2-15 2-13 2-11 2-9 2-7 2-5 2-3 2-1 H 1-15 1-13 1-11 1-9 1-7 1-5 1-3 1-102:0E 02:0C 02:0A 02:08 02:06 02:02 02:02 02:00 D 01:0E 01:0C 01:0A 01:08 01:06 01:04 01:02 01:004 HDD 4 HDD 4 HDD 4 HDD 4 HDD 4 HDD 4 HDD 4 HDD U 4 HDD 4 HDD 4 HDD 4 HDD 4 HDD 4 HDD 4 HDD 4 HDD
6-16 6-14 6-12 6-10 6-8 6-6 6-4 6-2 H 5-16 5-14 5-12 5-10 5-8 5-6 5-4 5-206:0F 06:0D 06:0B 06:09 06:07 06:05 06:03 06:01 D 05:0F 05:0D 05:0B 05:09 05:07 05:05 05:03 05:014 HDD 4 HDD 4 HDD 4 HDD 4 HDD 4 HDD 4 HDD 4 HDD U 4 HDD 4 HDD 4 HDD 4 HDD 4 HDD 4 HDD 4 HDD 4 HDD
6-15 6-13 6-11 6-9 6-7 6-5 6-3 6-1 H 5-15 5-13 5-11 5-9 5-7 5-5 5-3 5-106:0E 06:0C 06:0A 06:08 06:06 06:04 06:02 06:00 D 05:0E 05:0C 05:0A 05:08 05:06 05:04 05:02 05:004 HDD 4 HDD 4 HDD 4 HDD 4 HDD 4 HDD 4 HDD 4 HDD U 4 HDD 4 HDD 4 HDD 4 HDD 4 HDD 4 HDD 4 HDD 4 HDD
4-16 4-14 4-12 4-10 4-8 4-6 4-4 4-2 H 3-16 3-14 3-12 3-10 3-8 3-6 3-4 3-204:0F 04:0D 04:0B 04:09 04:07 04:05 04:03 04:01 D 03:0F 03:0D 03:0B 03:09 03:07 03:05 03:03 03:014 HDD 4 HDD 4 HDD 4 HDD 4 HDD 4 HDD 4 HDD 4 HDD U 4 HDD 4 HDD 4 HDD 4 HDD 4 HDD 4 HDD 4 HDD 4 HDD
4-15 4-13 4-11 4-9 4-7 4-5 4-3 4-1 H 3-15 3-13 3-11 3-9 3-7 3-5 3-3 3-104:0E 04:0C 04:0A 04:08 04:06 04:04 04:02 04:00 D 03:0E 03:0C 03:0A 03:08 03:06 03:04 03:02 03:004 HDD 4 HDD 4 HDD 4 HDD 4 HDD 4 HDD 4 HDD 4 HDD U 4 HDD 4 HDD 4 HDD 4 HDD 4 HDD 4 HDD 4 HDD 4 HDD
14-16 14-14 14-12 14-10 14-8 14-6 14-4 14-2 H 13-16 13-14 13-12 13-10 13-8 13-6 13-4 13-20E:0F 0E:0D 0E:0B 0E:09 0E:07 0E:05 0E:03 0E:01 D 0D:0F 0D:0D 0D:0B 0D:09 0D:07 0D:05 0D:03 0D:014 HDD 4 HDD 4 HDD 4 HDD 4 HDD 4 HDD 4 HDD 4 HDD U 4 HDD 4 HDD 4 HDD 4 HDD 4 HDD 4 HDD 4 HDD 4 HDD
14-15 14-13 14-11 14-9 14-7 14-5 14-3 14-1 H 13-15 13-13 13-11 13-9 13-7 13-5 13-3 13-10E:0E 0E:0C 0E:0A 0E:08 0E:06 0E:04 0E:02 0E:00 D 0D:0E 0D:0C 0D:0A 0D:08 0D:06 0D:04 0D:02 0D:004 HDD 4 HDD 4 HDD 4 HDD 4 HDD 4 HDD 4 HDD 4 HDD U 4 HDD 4 HDD 4 HDD 4 HDD 4 HDD 4 HDD 4 HDD 4 HDD
12-16 12-14 12-12 12-10 12-8 12-6 12-4 12-2 H 11-16 11-14 11-12 11-10 11-8 11-6 11-4 11-20C:0F 0C:0D 0C:0B 0C:09 0C:07 0C:05 0C:03 0C:01 D 0B:0F 0B:0D 0B:0B 0B:09 0B:07 0B:05 0B:03 0B:014 HDD 4 HDD 4 HDD 4 HDD 4 HDD 4 HDD 4 HDD 4 HDD U 4 HDD 4 HDD 4 HDD 4 HDD 4 HDD 4 HDD 4 HDD 4 HDD
12-15 12-13 12-11 12-9 12-7 12-5 12-3 12-1 H 11-15 11-13 11-11 11-9 11-7 11-5 11-3 11-10C:0E 0C:0C 0C:0A 0C:08 0C:06 0C:04 0C:02 0C:00 D 0B:0E 0B:0C 0B:0A 0B:08 0B:06 0B:04 0B:02 0B:004 HDD 4 HDD 4 HDD 4 HDD 4 HDD 4 HDD 4 HDD 4 HDD U 4 HDD 4 HDD 4 HDD 4 HDD 4 HDD 4 HDD 4 HDD 4 HDD
DKA 2 DKA 1
USP-V - R2 Frame (256 HDD)DKA 4 DKA 3
DKA 2 DKA 1
DKA 4 DKA 3
USP-V - Center Frame (128 HDD)DKA 2 DKA 1
RAID 600 - R1 Frame (256 HDD)
USP-V - L1 Frame (256 HDD)DKA 8 DKA 7
DKA 6 DKA 5
DKA 5DKA 6
DKA 8USP-V - L2 Frame (256 HDD)
DKA 7
Hitachi Data Systems Confidential For Internal Use and Distribution to Authorized Parties Only
- 88 -
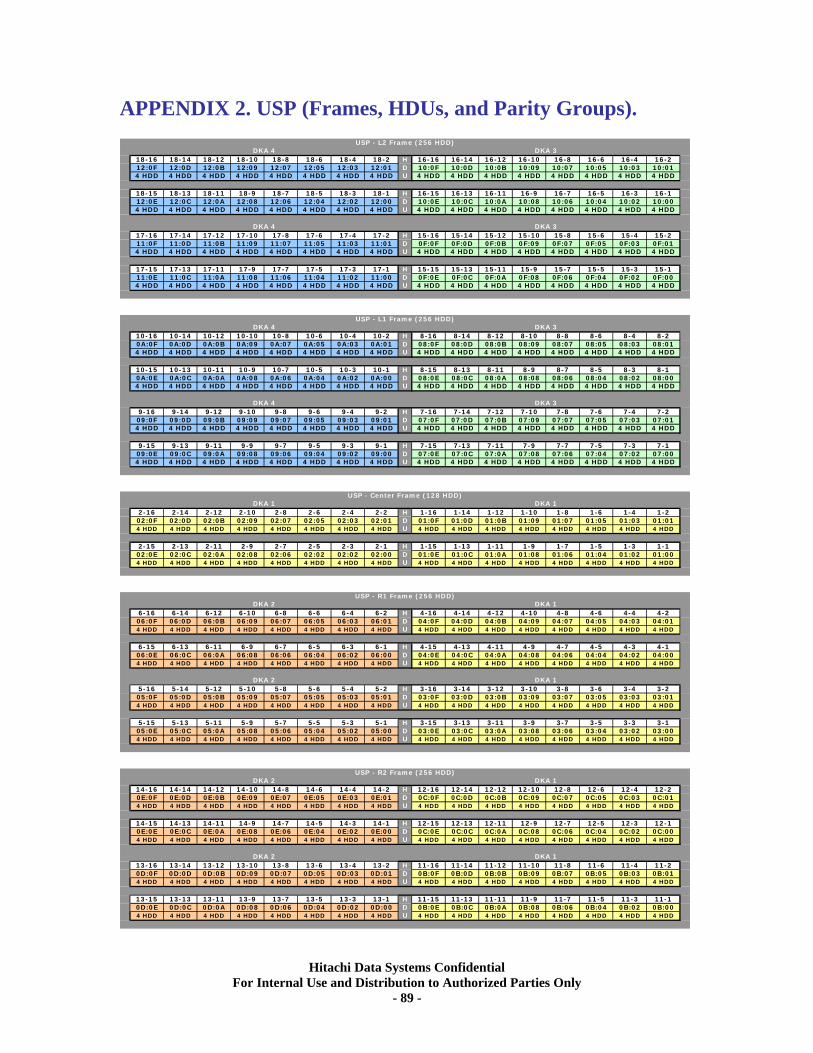
APPENDIX 2. USP (Frames, HDUs, and Parity Groups).
18-16 18-14 18-12 18-10 18-8 18-6 18-4 18-2 H 16-16 16-14 16-12 16-10 16-8 16-6 16-4 16-212:0F 12:0D 12:0B 12:09 12:07 12:05 12:03 12:01 D 10:0F 10:0D 10:0B 10:09 10:07 10:05 10:03 10:014 HDD 4 HDD 4 HDD 4 HDD 4 HDD 4 HDD 4 HDD 4 HDD U 4 HDD 4 HDD 4 HDD 4 HDD 4 HDD 4 HDD 4 HDD 4 HDD
18-15 18-13 18-11 18-9 18-7 18-5 18-3 18-1 H 16-15 16-13 16-11 16-9 16-7 16-5 16-3 16-112:0E 12:0C 12:0A 12:08 12:06 12:04 12:02 12:00 D 10:0E 10:0C 10:0A 10:08 10:06 10:04 10:02 10:004 HDD 4 HDD 4 HDD 4 HDD 4 HDD 4 HDD 4 HDD 4 HDD U 4 HDD 4 HDD 4 HDD 4 HDD 4 HDD 4 HDD 4 HDD 4 HDD
17-16 17-14 17-12 17-10 17-8 17-6 17-4 17-2 H 15-16 15-14 15-12 15-10 15-8 15-6 15-4 15-211:0F 11:0D 11:0B 11:09 11:07 11:05 11:03 11:01 D 0F:0F 0F:0D 0F:0B 0F:09 0F:07 0F:05 0F:03 0F:014 HDD 4 HDD 4 HDD 4 HDD 4 HDD 4 HDD 4 HDD 4 HDD U 4 HDD 4 HDD 4 HDD 4 HDD 4 HDD 4 HDD 4 HDD 4 HDD
17-15 17-13 17-11 17-9 17-7 17-5 17-3 17-1 H 15-15 15-13 15-11 15-9 15-7 15-5 15-3 15-111:0E 11:0C 11:0A 11:08 11:06 11:04 11:02 11:00 D 0F:0E 0F:0C 0F:0A 0F:08 0F:06 0F:04 0F:02 0F:004 HDD 4 HDD 4 HDD 4 HDD 4 HDD 4 HDD 4 HDD 4 HDD U 4 HDD 4 HDD 4 HDD 4 HDD 4 HDD 4 HDD 4 HDD 4 HDD
10-16 10-14 10-12 10-10 10-8 10-6 10-4 10-2 H 8-16 8-14 8-12 8-10 8-8 8-6 8-4 8-20A:0F 0A:0D 0A:0B 0A:09 0A:07 0A:05 0A:03 0A:01 D 08:0F 08:0D 08:0B 08:09 08:07 08:05 08:03 08:014 HDD 4 HDD 4 HDD 4 HDD 4 HDD 4 HDD 4 HDD 4 HDD U 4 HDD 4 HDD 4 HDD 4 HDD 4 HDD 4 HDD 4 HDD 4 HDD
10-15 10-13 10-11 10-9 10-7 10-5 10-3 10-1 H 8-15 8-13 8-11 8-9 8-7 8-5 8-3 8-10A:0E 0A:0C 0A:0A 0A:08 0A:06 0A:04 0A:02 0A:00 D 08:0E 08:0C 08:0A 08:08 08:06 08:04 08:02 08:004 HDD 4 HDD 4 HDD 4 HDD 4 HDD 4 HDD 4 HDD 4 HDD U 4 HDD 4 HDD 4 HDD 4 HDD 4 HDD 4 HDD 4 HDD 4 HDD
9-16 9-14 9-12 9-10 9-8 9-6 9-4 9-2 H 7-16 7-14 7-12 7-10 7-8 7-6 7-4 7-209:0F 09:0D 09:0B 09:09 09:07 09:05 09:03 09:01 D 07:0F 07:0D 07:0B 07:09 07:07 07:05 07:03 07:014 HDD 4 HDD 4 HDD 4 HDD 4 HDD 4 HDD 4 HDD 4 HDD U 4 HDD 4 HDD 4 HDD 4 HDD 4 HDD 4 HDD 4 HDD 4 HDD
9-15 9-13 9-11 9-9 9-7 9-5 9-3 9-1 H 7-15 7-13 7-11 7-9 7-7 7-5 7-3 7-109:0E 09:0C 09:0A 09:08 09:06 09:04 09:02 09:00 D 07:0E 07:0C 07:0A 07:08 07:06 07:04 07:02 07:004 HDD 4 HDD 4 HDD 4 HDD 4 HDD 4 HDD 4 HDD 4 HDD U 4 HDD 4 HDD 4 HDD 4 HDD 4 HDD 4 HDD 4 HDD 4 HDD
2-16 2-14 2-12 2-10 2-8 2-6 2-4 2-2 H 1-16 1-14 1-12 1-10 1-8 1-6 1-4 1-202:0F 02:0D 02:0B 02:09 02:07 02:05 02:03 02:01 D 01:0F 01:0D 01:0B 01:09 01:07 01:05 01:03 01:014 HDD 4 HDD 4 HDD 4 HDD 4 HDD 4 HDD 4 HDD 4 HDD U 4 HDD 4 HDD 4 HDD 4 HDD 4 HDD 4 HDD 4 HDD 4 HDD
2-15 2-13 2-11 2-9 2-7 2-5 2-3 2-1 H 1-15 1-13 1-11 1-9 1-7 1-5 1-3 1-102:0E 02:0C 02:0A 02:08 02:06 02:02 02:02 02:00 D 01:0E 01:0C 01:0A 01:08 01:06 01:04 01:02 01:004 HDD 4 HDD 4 HDD 4 HDD 4 HDD 4 HDD 4 HDD 4 HDD U 4 HDD 4 HDD 4 HDD 4 HDD 4 HDD 4 HDD 4 HDD 4 HDD
6-16 6-14 6-12 6-10 6-8 6-6 6-4 6-2 H 4-16 4-14 4-12 4-10 4-8 4-6 4-4 4-206:0F 06:0D 06:0B 06:09 06:07 06:05 06:03 06:01 D 04:0F 04:0D 04:0B 04:09 04:07 04:05 04:03 04:014 HDD 4 HDD 4 HDD 4 HDD 4 HDD 4 HDD 4 HDD 4 HDD U 4 HDD 4 HDD 4 HDD 4 HDD 4 HDD 4 HDD 4 HDD 4 HDD
6-15 6-13 6-11 6-9 6-7 6-5 6-3 6-1 H 4-15 4-13 4-11 4-9 4-7 4-5 4-3 4-106:0E 06:0C 06:0A 06:08 06:06 06:04 06:02 06:00 D 04:0E 04:0C 04:0A 04:08 04:06 04:04 04:02 04:004 HDD 4 HDD 4 HDD 4 HDD 4 HDD 4 HDD 4 HDD 4 HDD U 4 HDD 4 HDD 4 HDD 4 HDD 4 HDD 4 HDD 4 HDD 4 HDD
5-16 5-14 5-12 5-10 5-8 5-6 5-4 5-2 H 3-16 3-14 3-12 3-10 3-8 3-6 3-4 3-205:0F 05:0D 05:0B 05:09 05:07 05:05 05:03 05:01 D 03:0F 03:0D 03:0B 03:09 03:07 03:05 03:03 03:014 HDD 4 HDD 4 HDD 4 HDD 4 HDD 4 HDD 4 HDD 4 HDD U 4 HDD 4 HDD 4 HDD 4 HDD 4 HDD 4 HDD 4 HDD 4 HDD
5-15 5-13 5-11 5-9 5-7 5-5 5-3 5-1 H 3-15 3-13 3-11 3-9 3-7 3-5 3-3 3-105:0E 05:0C 05:0A 05:08 05:06 05:04 05:02 05:00 D 03:0E 03:0C 03:0A 03:08 03:06 03:04 03:02 03:004 HDD 4 HDD 4 HDD 4 HDD 4 HDD 4 HDD 4 HDD 4 HDD U 4 HDD 4 HDD 4 HDD 4 HDD 4 HDD 4 HDD 4 HDD 4 HDD
14-16 14-14 14-12 14-10 14-8 14-6 14-4 14-2 H 12-16 12-14 12-12 12-10 12-8 12-6 12-4 12-20E:0F 0E:0D 0E:0B 0E:09 0E:07 0E:05 0E:03 0E:01 D 0C:0F 0C:0D 0C:0B 0C:09 0C:07 0C:05 0C:03 0C:014 HDD 4 HDD 4 HDD 4 HDD 4 HDD 4 HDD 4 HDD 4 HDD U 4 HDD 4 HDD 4 HDD 4 HDD 4 HDD 4 HDD 4 HDD 4 HDD
14-15 14-13 14-11 14-9 14-7 14-5 14-3 14-1 H 12-15 12-13 12-11 12-9 12-7 12-5 12-3 12-10E:0E 0E:0C 0E:0A 0E:08 0E:06 0E:04 0E:02 0E:00 D 0C:0E 0C:0C 0C:0A 0C:08 0C:06 0C:04 0C:02 0C:004 HDD 4 HDD 4 HDD 4 HDD 4 HDD 4 HDD 4 HDD 4 HDD U 4 HDD 4 HDD 4 HDD 4 HDD 4 HDD 4 HDD 4 HDD 4 HDD
13-16 13-14 13-12 13-10 13-8 13-6 13-4 13-2 H 11-16 11-14 11-12 11-10 11-8 11-6 11-4 11-20D:0F 0D:0D 0D:0B 0D:09 0D:07 0D:05 0D:03 0D:01 D 0B:0F 0B:0D 0B:0B 0B:09 0B:07 0B:05 0B:03 0B:014 HDD 4 HDD 4 HDD 4 HDD 4 HDD 4 HDD 4 HDD 4 HDD U 4 HDD 4 HDD 4 HDD 4 HDD 4 HDD 4 HDD 4 HDD 4 HDD
13-15 13-13 13-11 13-9 13-7 13-5 13-3 13-1 H 11-15 11-13 11-11 11-9 11-7 11-5 11-3 11-10D:0E 0D:0C 0D:0A 0D:08 0D:06 0D:04 0D:02 0D:00 D 0B:0E 0B:0C 0B:0A 0B:08 0B:06 0B:04 0B:02 0B:004 HDD 4 HDD 4 HDD 4 HDD 4 HDD 4 HDD 4 HDD 4 HDD U 4 HDD 4 HDD 4 HDD 4 HDD 4 HDD 4 HDD 4 HDD 4 HDD
DKA 2 DKA 1
USP - R1 Frame (256 HDD)DKA 2 DKA 1
DKA 2 DKA 1
DKA 4 DKA 3
USP - L2 Frame (256 HDD)DKA 4 DKA 3
USP - L1 Frame (256 HDD)DKA 4 DKA 3
DKA 4 DKA 3
USP - Center Frame (128 HDD)DKA 1 DKA 1
USP - R2 Frame (256 HDD)DKA 2 DKA 1
Hitachi Data Systems Confidential For Internal Use and Distribution to Authorized Parties Only
- 89 -
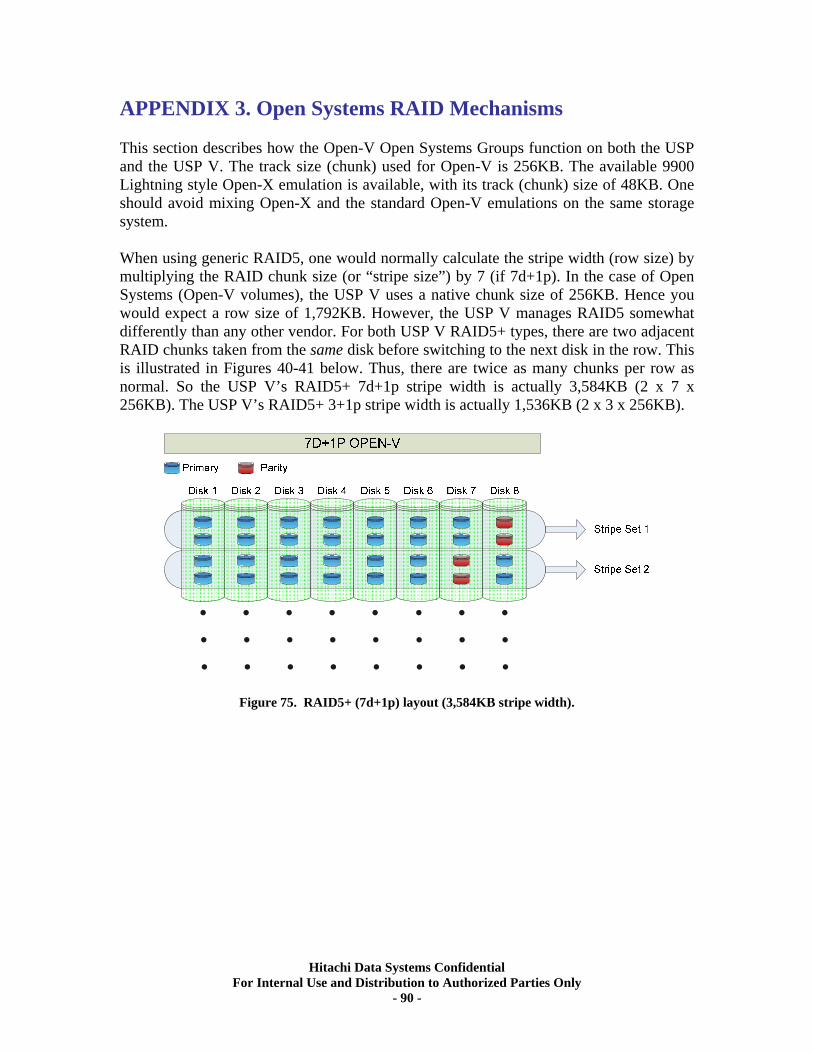
APPENDIX 3. Open Systems RAID Mechanisms This section describes how the Open-V Open Systems Groups function on both the USP and the USP V. The track size (chunk) used for Open-V is 256KB. The available 9900 Lightning style Open-X emulation is available, with its track (chunk) size of 48KB. One should avoid mixing Open-X and the standard Open-V emulations on the same storage system. When using generic RAID5, one would normally calculate the stripe width (row size) by multiplying the RAID chunk size (or “stripe size”) by 7 (if 7d+1p). In the case of Open Systems (Open-V volumes), the USP V uses a native chunk size of 256KB. Hence you would expect a row size of 1,792KB. However, the USP V manages RAID5 somewhat differently than any other vendor. For both USP V RAID5+ types, there are two adjacent RAID chunks taken from the same disk before switching to the next disk in the row. This is illustrated in Figures 40-41 below. Thus, there are twice as many chunks per row as normal. So the USP V’s RAID5+ 7d+1p stripe width is actually 3,584KB (2 x 7 x 256KB). The USP V’s RAID5+ 3+1p stripe width is actually 1,536KB (2 x 3 x 256KB).
Figure 75. RAID5+ (7d+1p) layout (3,584KB stripe width).
Hitachi Data Systems Confidential For Internal Use and Distribution to Authorized Parties Only
- 90 -
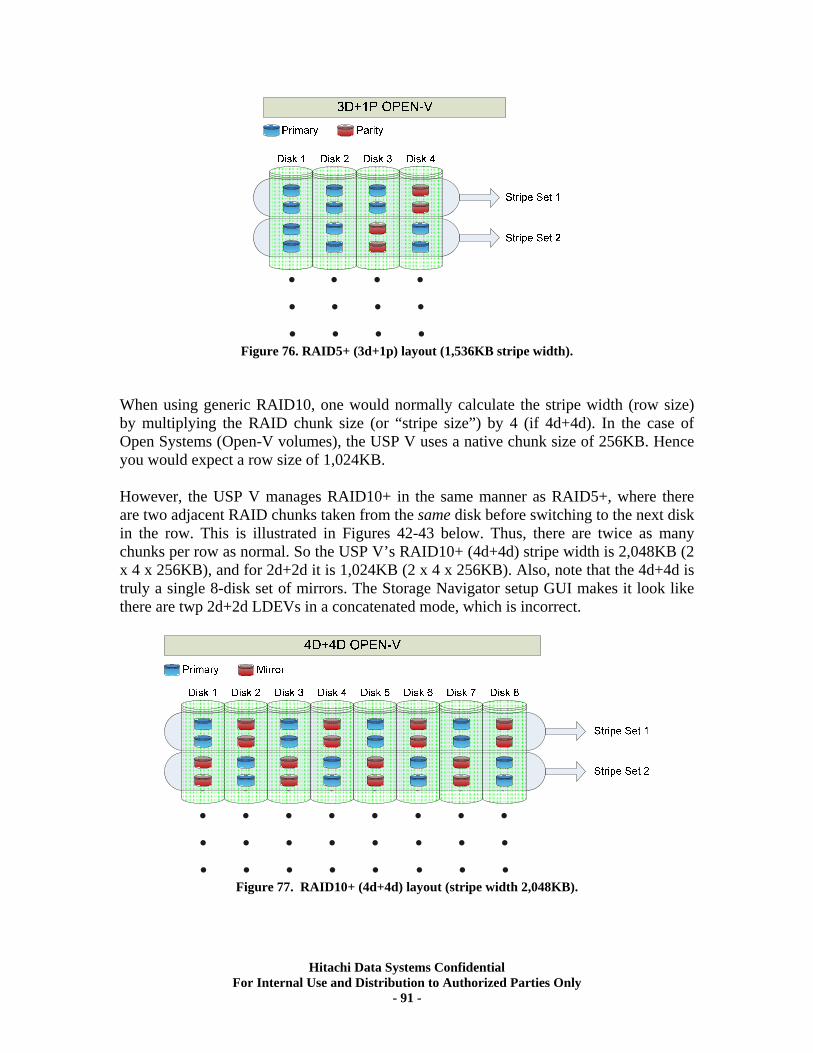
Figure 76. RAID5+ (3d+1p) layout (1,536KB stripe width).
When using generic RAID10, one would normally calculate the stripe width (row size) by multiplying the RAID chunk size (or “stripe size”) by 4 (if 4d+4d). In the case of Open Systems (Open-V volumes), the USP V uses a native chunk size of 256KB. Hence you would expect a row size of 1,024KB. However, the USP V manages RAID10+ in the same manner as RAID5+, where there are two adjacent RAID chunks taken from the same disk before switching to the next disk in the row. This is illustrated in Figures 42-43 below. Thus, there are twice as many chunks per row as normal. So the USP V’s RAID10+ (4d+4d) stripe width is 2,048KB (2 x 4 x 256KB), and for 2d+2d it is 1,024KB (2 x 4 x 256KB). Also, note that the 4d+4d is truly a single 8-disk set of mirrors. The Storage Navigator setup GUI makes it look like there are twp 2d+2d LDEVs in a concatenated mode, which is incorrect.
Figure 77. RAID10+ (4d+4d) layout (stripe width 2,048KB).
Hitachi Data Systems Confidential For Internal Use and Distribution to Authorized Parties Only
- 91 -
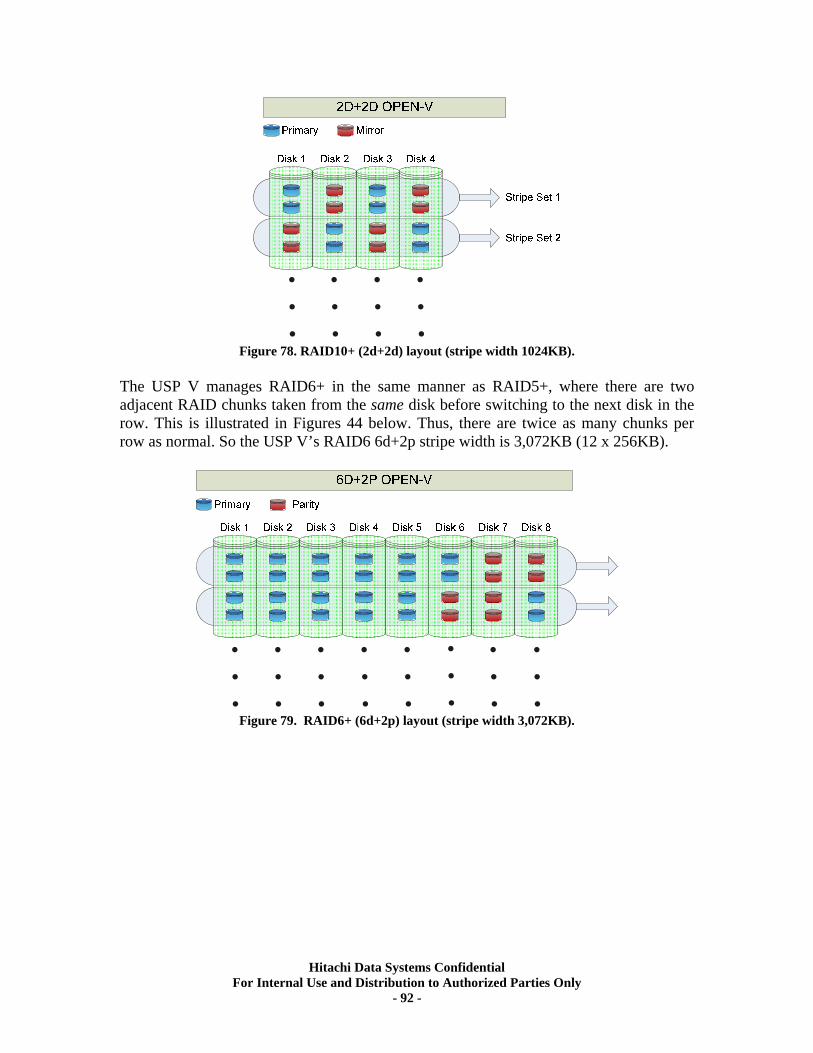
Figure 78. RAID10+ (2d+2d) layout (stripe width 1024KB).
The USP V manages RAID6+ in the same manner as RAID5+, where there are two adjacent RAID chunks taken from the same disk before switching to the next disk in the row. This is illustrated in Figures 44 below. Thus, there are twice as many chunks per row as normal. So the USP V’s RAID6 6d+2p stripe width is 3,072KB (12 x 256KB).
Figure 79. RAID6+ (6d+2p) layout (stripe width 3,072KB).
Hitachi Data Systems Confidential For Internal Use and Distribution to Authorized Parties Only
- 92 -
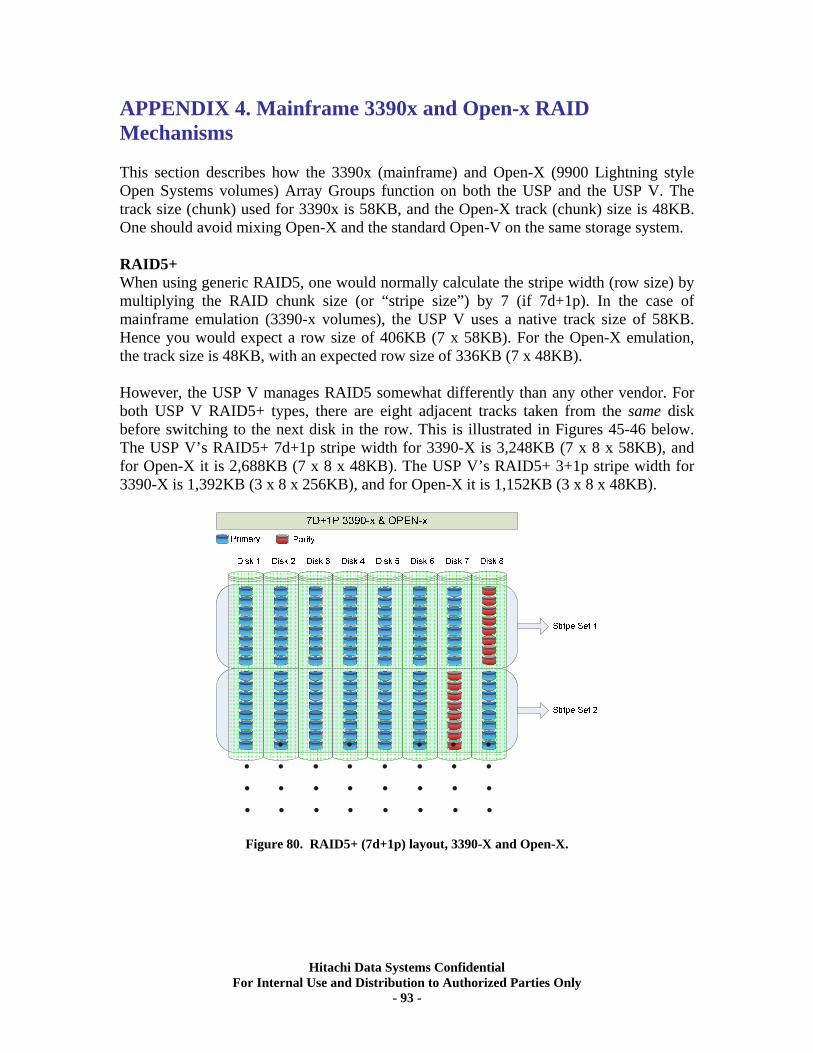
APPENDIX 4. Mainframe 3390x and Open-x RAID Mechanisms This section describes how the 3390x (mainframe) and Open-X (9900 Lightning style Open Systems volumes) Array Groups function on both the USP and the USP V. The track size (chunk) used for 3390x is 58KB, and the Open-X track (chunk) size is 48KB. One should avoid mixing Open-X and the standard Open-V on the same storage system. RAID5+ When using generic RAID5, one would normally calculate the stripe width (row size) by multiplying the RAID chunk size (or “stripe size”) by 7 (if 7d+1p). In the case of mainframe emulation (3390-x volumes), the USP V uses a native track size of 58KB. Hence you would expect a row size of 406KB (7 x 58KB). For the Open-X emulation, the track size is 48KB, with an expected row size of 336KB (7 x 48KB). However, the USP V manages RAID5 somewhat differently than any other vendor. For both USP V RAID5+ types, there are eight adjacent tracks taken from the same disk before switching to the next disk in the row. This is illustrated in Figures 45-46 below. The USP V’s RAID5+ 7d+1p stripe width for 3390-X is 3,248KB (7 x 8 x 58KB), and for Open-X it is 2,688KB (7 x 8 x 48KB). The USP V’s RAID5+ 3+1p stripe width for 3390-X is 1,392KB (3 x 8 x 256KB), and for Open-X it is 1,152KB (3 x 8 x 48KB).
Figure 80. RAID5+ (7d+1p) layout, 3390-X and Open-X.
Hitachi Data Systems Confidential For Internal Use and Distribution to Authorized Parties Only
- 93 -
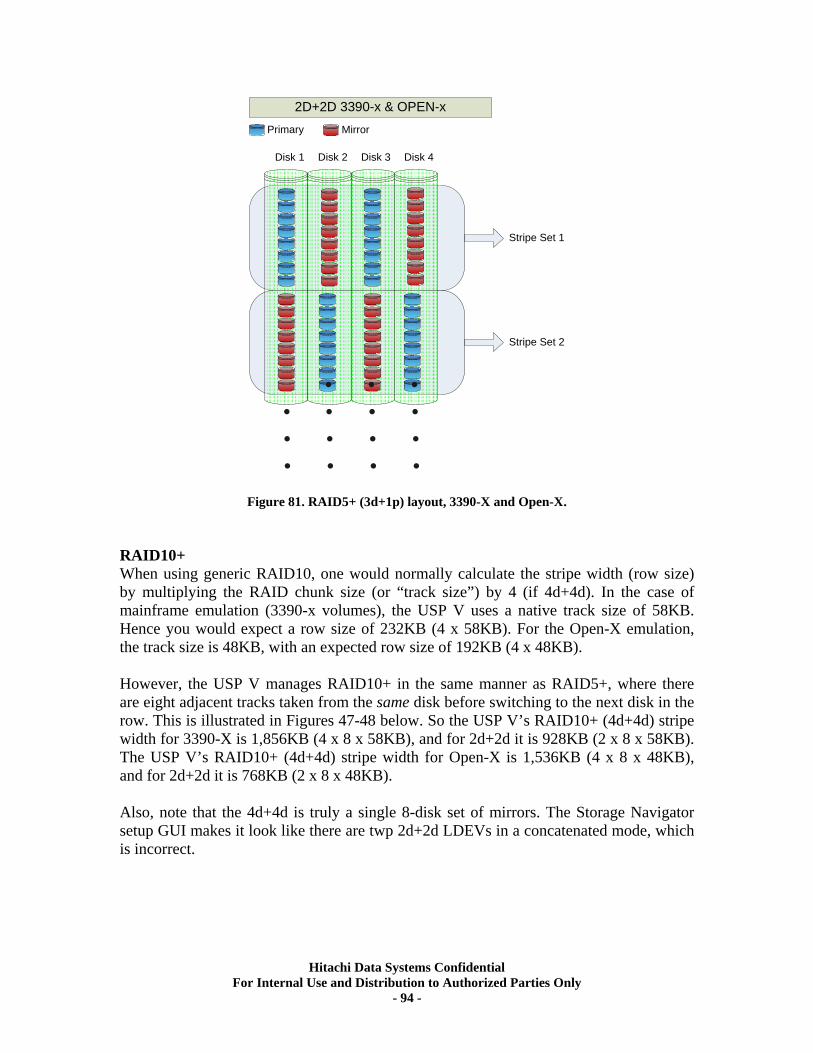
2D+2D 3390-x & OPEN-xPrimary Mirror
Disk 1 Disk 2 Disk 3 Disk 4
Stripe Set 1
Stripe Set 2
Figure 81. RAID5+ (3d+1p) layout, 3390-X and Open-X. RAID10+ When using generic RAID10, one would normally calculate the stripe width (row size) by multiplying the RAID chunk size (or “track size”) by 4 (if 4d+4d). In the case of mainframe emulation (3390-x volumes), the USP V uses a native track size of 58KB. Hence you would expect a row size of 232KB (4 x 58KB). For the Open-X emulation, the track size is 48KB, with an expected row size of 192KB (4 x 48KB). However, the USP V manages RAID10+ in the same manner as RAID5+, where there are eight adjacent tracks taken from the same disk before switching to the next disk in the row. This is illustrated in Figures 47-48 below. So the USP V’s RAID10+ (4d+4d) stripe width for 3390-X is 1,856KB (4 x 8 x 58KB), and for 2d+2d it is 928KB (2 x 8 x 58KB). The USP V’s RAID10+ (4d+4d) stripe width for Open-X is 1,536KB (4 x 8 x 48KB), and for 2d+2d it is 768KB (2 x 8 x 48KB). Also, note that the 4d+4d is truly a single 8-disk set of mirrors. The Storage Navigator setup GUI makes it look like there are twp 2d+2d LDEVs in a concatenated mode, which is incorrect.
Hitachi Data Systems Confidential For Internal Use and Distribution to Authorized Parties Only
- 94 -
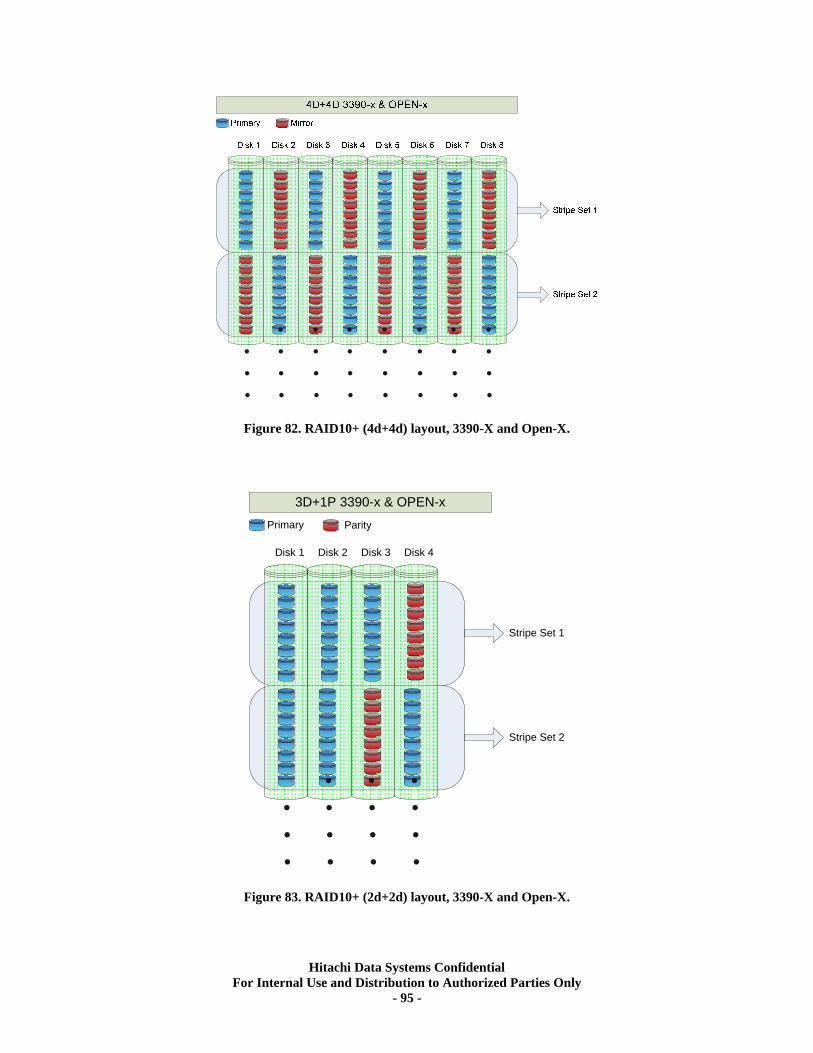
Figure 82. RAID10+ (4d+4d) layout, 3390-X and Open-X.
3D+1P 3390-x & OPEN-xPrimary Parity
Disk 1 Disk 2 Disk 3 Disk 4
Stripe Set 1
Stripe Set 2
Figure 83. RAID10+ (2d+2d) layout, 3390-X and Open-X.
Hitachi Data Systems Confidential For Internal Use and Distribution to Authorized Parties Only
- 95 -
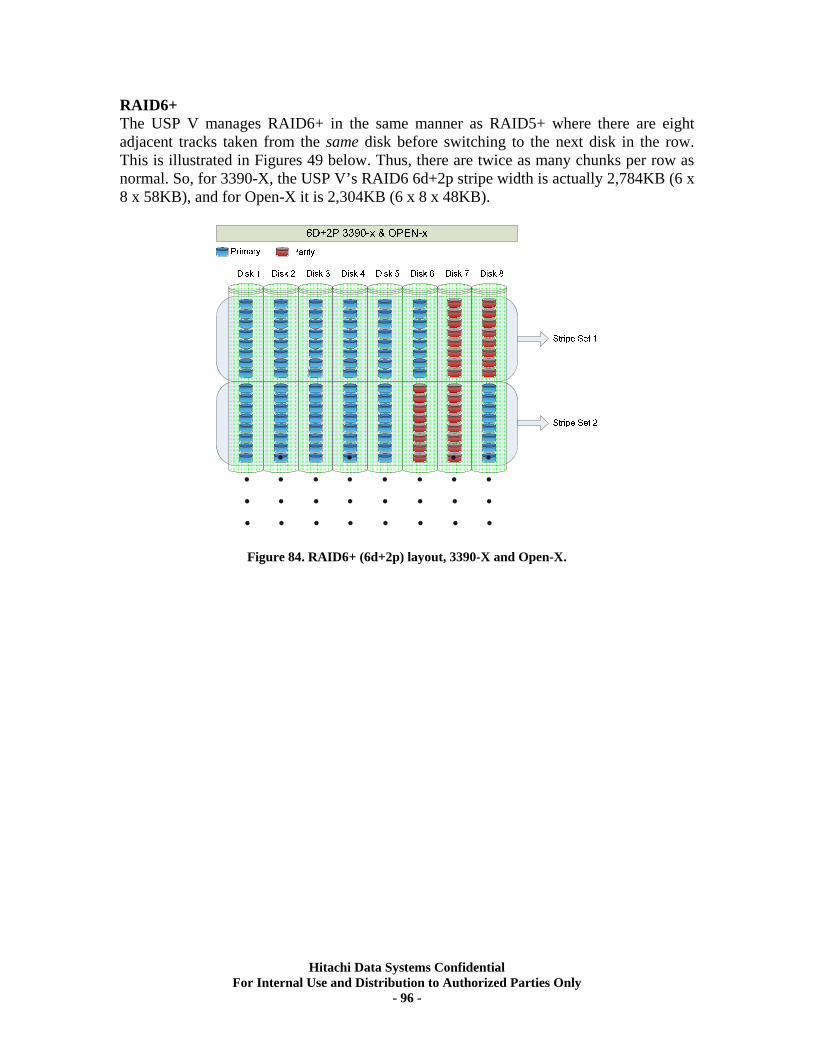
RAID6+ The USP V manages RAID6+ in the same manner as RAID5+ where there are eight adjacent tracks taken from the same disk before switching to the next disk in the row. This is illustrated in Figures 49 below. Thus, there are twice as many chunks per row as normal. So, for 3390-X, the USP V’s RAID6 6d+2p stripe width is actually 2,784KB (6 x 8 x 58KB), and for Open-X it is 2,304KB (6 x 8 x 48KB).
Figure 84. RAID6+ (6d+2p) layout, 3390-X and Open-X.
Hitachi Data Systems Confidential For Internal Use and Distribution to Authorized Parties Only
- 96 -
APPENDIX 5. Concatenated Array Groups The Concatenated Array Group feature allows you to configure all of the space from either two or four RAID-5 7d+1p Array Groups into an association whereby all LDEVs created on these Array Groups are actually striped across all of the elements. Recall that a slice (or partition) created on a standard Array Group is an LDEV (Logical Device), becoming a LUN (Logical Unit) once it has been given a name and mapped to a host port. Now there is a new mechanism known as the VDEV (Virtual Device). It is the name of a row of LDEVs created across the members of the striped Array Groups. When the VDEV is mapped to a host port, it – not an Array Group’s LDEV - then becomes a LUN. Looking at the example in Figure 51, four Array Groups are used in a Concatenated Array Group configuration. This shows how the VDEV “slices” are created across each Array Group. The VDEV is a container that encompasses four LDEVs, where each LDEV comes from a different Array Group. The VDEV is not a visible entity in Storage Navigator, but is more of a concept. When you create an LDEV on an Array Group, you specify the overall size that you wish to carve out from the entire Stripe. It appears that you are creating the entire space on the Array Group in question, but it is actually automatically dividing the space request into four equal parts, then creating an LDEV on each Array Group. You cannot see these other LDEVs in Storage Navigator, and the LDEV that you just made appears to have all of the space. Think of this “primary” LDEV as the anchor point for the other three “hidden” LDEVs that are automatically generated and make up the rest of that particular VDEV. [Note: “primary” and “hidden” are my terms for these elements in the absence of any official terms.] In order to use all of the space available in the Concatenated Array Group, you must create “primary” LDEVs on each Array Group element in turn. You cannot just go through one of the Array Groups and create these “primary” LDEVs to use up all the space from the entire striped set. You may create LDEVs on an Array Group until all of the space available in that Array Group appears to have been consumed. You then move on to the next Array Group in the set and create other LDEVs. You should make a map of what you are doing in order to keep track of the remaining space which can be allocated from each Array Group. The Storage Navigator tool does show you the unused space per Array Group, but it lacks the ability to convey the idea of “primary” or “hidden” LDEV space. The best way to describe the Concatenated Array Group concept is by example. We will look at a four Array Group scenario that uses 32 300GB FC drives. Look at the Figure below for a map of the VDEVs. The first step is to create the four individual RAID-5 7d+1p Array Groups as per usual. The new step is to then associate these four groups together as a Concatenated Array. From this step, you will then create LDEVs on each Array Group as you normally would, but with the caveat that the assignable space on each Array Group appears differently than you would expect. In the Figure, the bold LDEV names represent the “primaries” and those in italics (on the same row) are the “hidden” elements. Notice that for this example there are three primary LDEVs
Hitachi Data Systems Confidential For Internal Use and Distribution to Authorized Parties Only
- 97 -
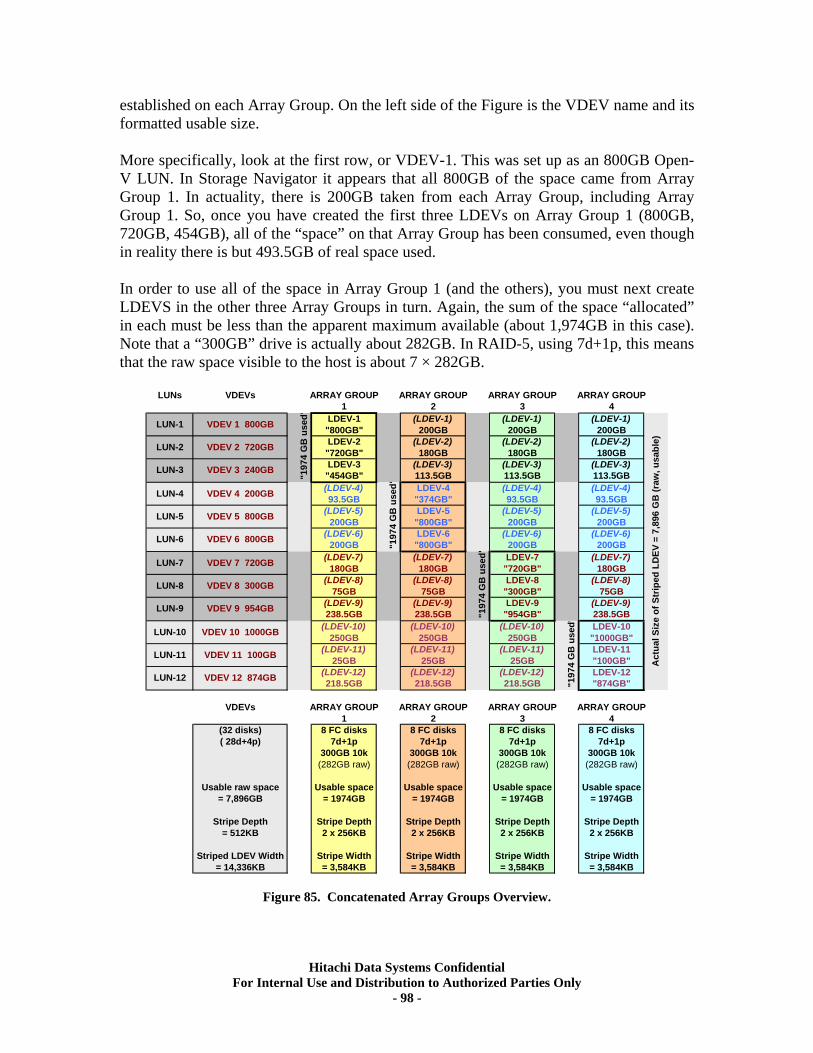
established on each Array Group. On the left side of the Figure is the VDEV name and its formatted usable size. More specifically, look at the first row, or VDEV-1. This was set up as an 800GB Open-V LUN. In Storage Navigator it appears that all 800GB of the space came from Array Group 1. In actuality, there is 200GB taken from each Array Group, including Array Group 1. So, once you have created the first three LDEVs on Array Group 1 (800GB, 720GB, 454GB), all of the “space” on that Array Group has been consumed, even though in reality there is but 493.5GB of real space used. In order to use all of the space in Array Group 1 (and the others), you must next create LDEVS in the other three Array Groups in turn. Again, the sum of the space “allocated” in each must be less than the apparent maximum available (about 1,974GB in this case). Note that a “300GB” drive is actually about 282GB. In RAID-5, using 7d+1p, this means that the raw space visible to the host is about 7 × 282GB.
LUNs VDEVs ARRAY GROUP ARRAY GROUP ARRAY GROUP ARRAY GROUP1 2 3 4
LDEV-1 (LDEV-1) (LDEV-1) (LDEV-1)"800GB" 200GB 200GB 200GBLDEV-2 (LDEV-2) (LDEV-2) (LDEV-2)"720GB" 180GB 180GB 180GBLDEV-3 (LDEV-3) (LDEV-3) (LDEV-3)"454GB" 113.5GB 113.5GB 113.5GB(LDEV-4) LDEV-4 (LDEV-4) (LDEV-4)93.5GB "374GB" 93.5GB 93.5GB
(LDEV-5) LDEV-5 (LDEV-5) (LDEV-5)200GB "800GB" 200GB 200GB
(LDEV-6) LDEV-6 (LDEV-6) (LDEV-6)200GB "800GB" 200GB 200GB
"
Hitachi Data Systems Confidential For Internal Use and Distribution to Authorized Parties Only
- 98 -
(LDEV-7) (LDEV-7) LDEV-7 (LDEV-7)180GB 180GB "720GB" 180GB
(LDEV-8) (LDEV-8) LDEV-8 (LDEV-8)75GB 75GB "300GB" 75GB
(LDEV-9) (LDEV-9) LDEV-9 (LDEV-9)238.5GB 238.5GB "954GB" 238.5GB
(LDEV-10) (LDEV-10) (LDEV-10) LDEV-10250GB 250GB 250GB "1000GB"
(LDEV-11) (LDEV-11) (LDEV-11) LDEV-1125GB 25GB 25GB "100GB"
(LDEV-12) (LDEV-12) (LDEV-12) LDEV-12218.5GB 218.5GB 218.5GB "874GB"
VDEVs ARRAY GROUP ARRAY GROUP ARRAY GROUP ARRAY GROUP1 2 3 4
(32 disks) 8 FC disks 8 FC disks 8 FC disks 8 FC disks( 28d+4p) 7d+1p 7d+1p 7d+1p 7d+1p
300GB 10k 300GB 10k 300GB 10k 300GB 10k(282GB raw) (282GB raw) (282GB raw) (282GB raw)
Usable raw space Usable space Usable space Usable space Usable space= 7,896GB = 1974GB = 1974GB = 1974GB = 1974GB
Stripe Depth Stripe Depth Stripe Depth Stripe Depth Stripe Depth= 512KB 2 x 256KB 2 x 256KB 2 x 256KB 2 x 256KB
Striped LDEV Width Stripe Width Stripe Width Stripe Width Stripe Width= 14,336KB = 3,584KB = 3,584KB = 3,584KB = 3,584KB
Act
ual S
ize
of S
trip
ed L
DEV
= 7
,896
GB
(raw
, usa
ble)
"197
4 G
B u
sed
LUN-9
LUN-10
LUN-11
LUN-12
LUN-5
LUN-6
LUN-7
LUN-8
LUN-1
LUN-2
LUN-3
LUN-4
VDEV 9 954GB
VDEV 10 1000GB
VDEV 11 100GB
VDEV 12 874GB
VDEV 5 800GB
VDEV 6 800GB
VDEV 7 720GB
VDEV 8 300GB
VDEV 1 800GB
VDEV 2 720GB
VDEV 3 240GB
VDEV 4 200GB
""1
974
GB
use
d
""1
974
GB
use
d
""1
974
GB
use
d
Figure 85. Concatenated Array Groups Overview.