Embed Size (px)
Citation preview
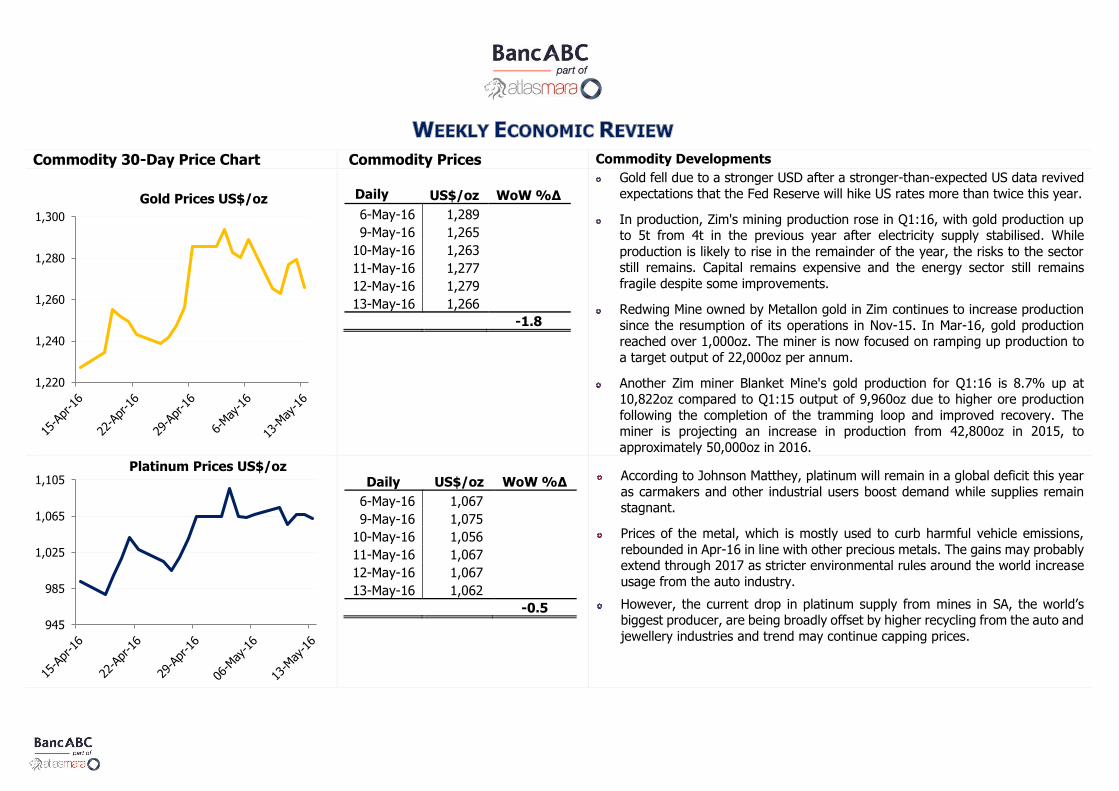
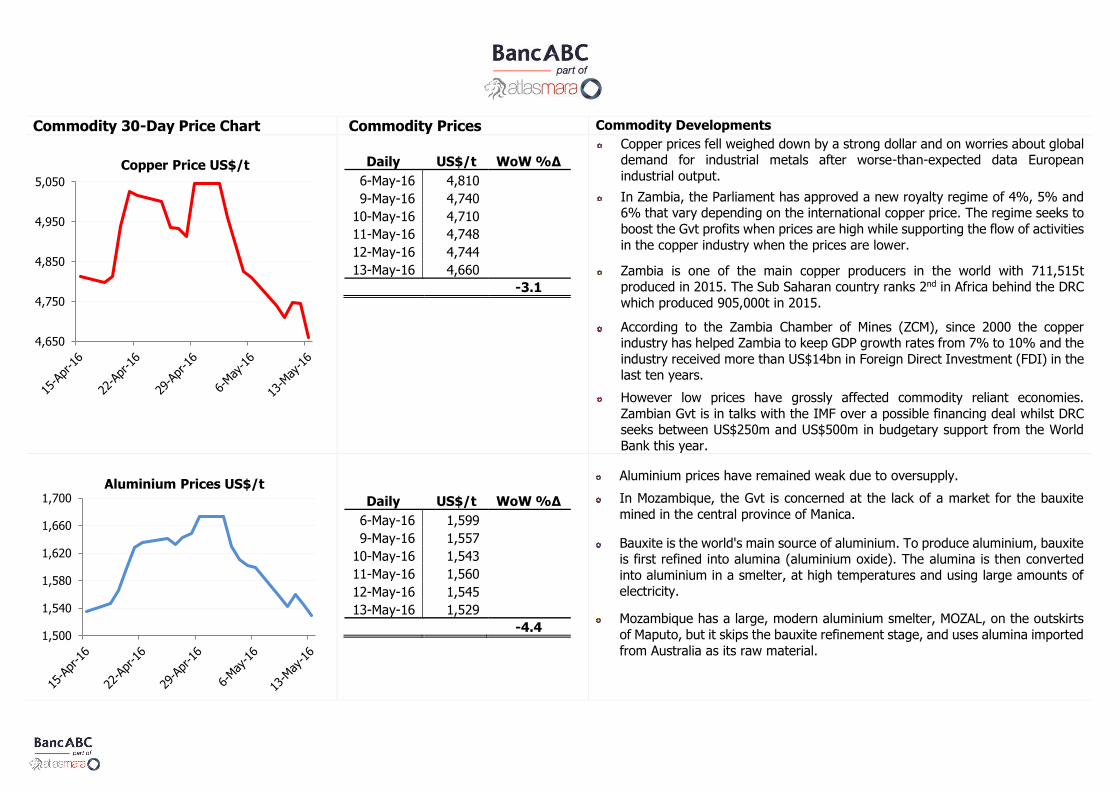
Commodity 30-Day Price Chart Commodity Prices Commodity Developments
Daily US$/oz WoW %∆
6-May-16 1,289
9-May-16 1,265
10-May-16 1,263
11-May-16 1,277
12-May-16 1,279
13-May-16 1,266
-1.8
Gold fell due to a stronger USD after a stronger-than-expected US data revived
expectations that the Fed Reserve will hike US rates more than twice this year.
In production, Zim's mining production rose in Q1:16, with gold production up to 5t from 4t in the previous year after electricity supply stabilised. While
production is likely to rise in the remainder of the year, the risks to the sector still remains. Capital remains expensive and the energy sector still remains
fragile despite some improvements.
Redwing Mine owned by Metallon gold in Zim continues to increase production
since the resumption of its operations in Nov-15. In Mar-16, gold production reached over 1,000oz. The miner is now focused on ramping up production to
a target output of 22,000oz per annum.
Another Zim miner Blanket Mine's gold production for Q1:16 is 8.7% up at 10,822oz compared to Q1:15 output of 9,960oz due to higher ore production
following the completion of the tramming loop and improved recovery. The miner is projecting an increase in production from 42,800oz in 2015, to
approximately 50,000oz in 2016.
Daily US$/oz WoW %∆
6-May-16 1,067
9-May-16 1,075
10-May-16 1,056
11-May-16 1,067
12-May-16 1,067
13-May-16 1,062
-0.5
According to Johnson Matthey, platinum will remain in a global deficit this year
as carmakers and other industrial users boost demand while supplies remain stagnant.
Prices of the metal, which is mostly used to curb harmful vehicle emissions,
rebounded in Apr-16 in line with other precious metals. The gains may probably extend through 2017 as stricter environmental rules around the world increase
usage from the auto industry.
However, the current drop in platinum supply from mines in SA, the world’s biggest producer, are being broadly offset by higher recycling from the auto and
jewellery industries and trend may continue capping prices.
1,220
1,240
1,260
1,280
1,300
Gold Prices US$/oz
945
985
1,025
1,065
1,105Platinum Prices US$/oz
Commodity 30-Day Price Chart Commodity Prices Commodity Developments
Daily US$/t WoW %∆
6-May-16 4,810
9-May-16 4,740
10-May-16 4,710
11-May-16 4,748
12-May-16 4,744
13-May-16 4,660
-3.1
Copper prices fell weighed down by a strong dollar and on worries about global demand for industrial metals after worse-than-expected data European
industrial output.
In Zambia, the Parliament has approved a new royalty regime of 4%, 5% and 6% that vary depending on the international copper price. The regime seeks to
boost the Gvt profits when prices are high while supporting the flow of activities
in the copper industry when the prices are lower.
Zambia is one of the main copper producers in the world with 711,515t produced in 2015. The Sub Saharan country ranks 2nd in Africa behind the DRC
which produced 905,000t in 2015.
According to the Zambia Chamber of Mines (ZCM), since 2000 the copper industry has helped Zambia to keep GDP growth rates from 7% to 10% and the
industry received more than US$14bn in Foreign Direct Investment (FDI) in the last ten years.
However low prices have grossly affected commodity reliant economies.
Zambian Gvt is in talks with the IMF over a possible financing deal whilst DRC seeks between US$250m and US$500m in budgetary support from the World
Bank this year.
Daily US$/t WoW %∆
6-May-16 1,599
9-May-16 1,557
10-May-16 1,543
11-May-16 1,560
12-May-16 1,545
13-May-16 1,529
-4.4
Aluminium prices have remained weak due to oversupply.
In Mozambique, the Gvt is concerned at the lack of a market for the bauxite
mined in the central province of Manica.
Bauxite is the world's main source of aluminium. To produce aluminium, bauxite is first refined into alumina (aluminium oxide). The alumina is then converted
into aluminium in a smelter, at high temperatures and using large amounts of electricity.
Mozambique has a large, modern aluminium smelter, MOZAL, on the outskirts
of Maputo, but it skips the bauxite refinement stage, and uses alumina imported
from Australia as its raw material.
4,650
4,750
4,850
4,950
5,050
Copper Price US$/t
1,500
1,540
1,580
1,620
1,660
1,700Aluminium Prices US$/t
Commodity 30-Day Price Chart Commodity Prices Commodity Developments
Daily US$/t WoW %∆
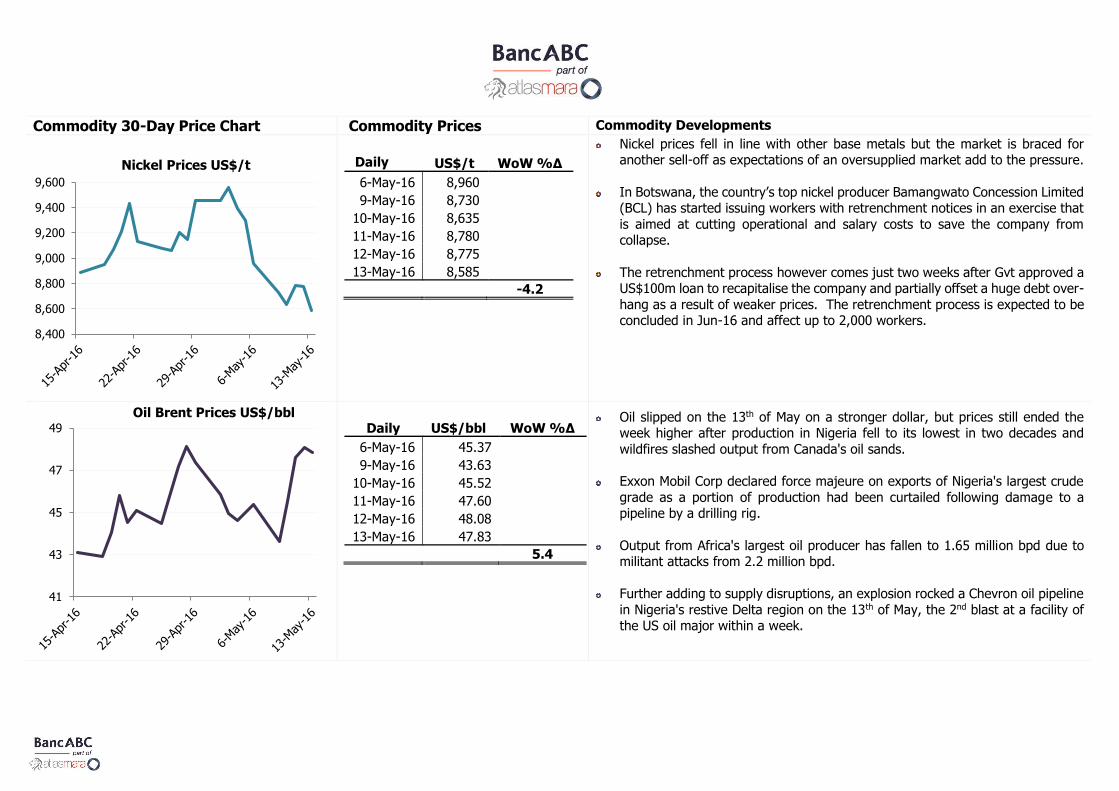
6-May-16 8,960
9-May-16 8,730
10-May-16 8,635
11-May-16 8,780
12-May-16 8,775
13-May-16 8,585
-4.2
Nickel prices fell in line with other base metals but the market is braced for another sell-off as expectations of an oversupplied market add to the pressure.
In Botswana, the country’s top nickel producer Bamangwato Concession Limited (BCL) has started issuing workers with retrenchment notices in an exercise that
is aimed at cutting operational and salary costs to save the company from collapse.
The retrenchment process however comes just two weeks after Gvt approved a US$100m loan to recapitalise the company and partially offset a huge debt over-
hang as a result of weaker prices. The retrenchment process is expected to be concluded in Jun-16 and affect up to 2,000 workers.
Daily US$/bbl WoW %∆
6-May-16 45.37
9-May-16 43.63
10-May-16 45.52
11-May-16 47.60
12-May-16 48.08
13-May-16 47.83
5.4
Oil slipped on the 13th of May on a stronger dollar, but prices still ended the week higher after production in Nigeria fell to its lowest in two decades and
wildfires slashed output from Canada's oil sands.
Exxon Mobil Corp declared force majeure on exports of Nigeria's largest crude
grade as a portion of production had been curtailed following damage to a pipeline by a drilling rig.
Output from Africa's largest oil producer has fallen to 1.65 million bpd due to militant attacks from 2.2 million bpd.
Further adding to supply disruptions, an explosion rocked a Chevron oil pipeline
in Nigeria's restive Delta region on the 13th of May, the 2nd blast at a facility of the US oil major within a week.
8,400
8,600
8,800
9,000
9,200
9,400
9,600
Nickel Prices US$/t
41
43
45
47
49
Oil Brent Prices US$/bbl
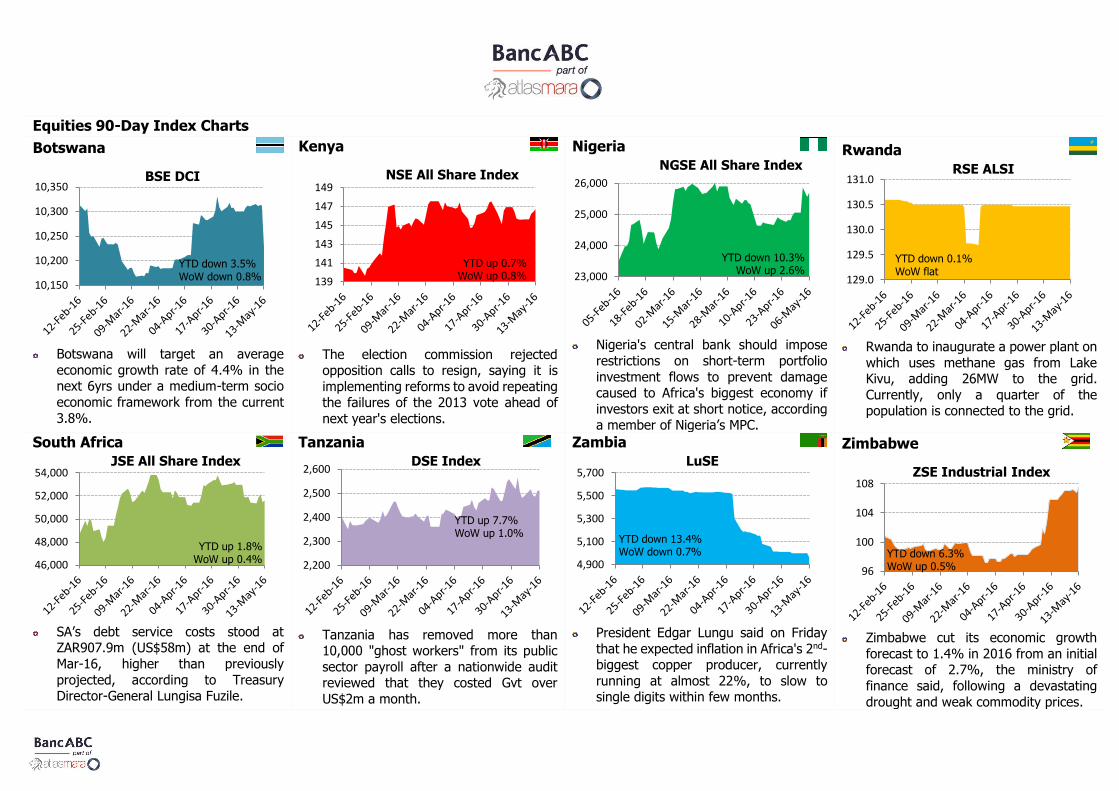
Equities 90-Day Index Charts
Botswana
Botswana will target an average
economic growth rate of 4.4% in the next 6yrs under a medium-term socio
economic framework from the current
3.8%.
Kenya
The election commission rejected
opposition calls to resign, saying it is
implementing reforms to avoid repeating the failures of the 2013 vote ahead of
next year's elections.
Nigeria
Nigeria's central bank should impose
restrictions on short-term portfolio
investment flows to prevent damage caused to Africa's biggest economy if
investors exit at short notice, according a member of Nigeria’s MPC.
Rwanda
Rwanda to inaugurate a power plant on
which uses methane gas from Lake Kivu, adding 26MW to the grid.
Currently, only a quarter of the population is connected to the grid.
South Africa
SA’s debt service costs stood at
ZAR907.9m (US$58m) at the end of
Mar-16, higher than previously
projected, according to Treasury Director-General Lungisa Fuzile.
Tanzania
Tanzania has removed more than
10,000 "ghost workers" from its public
sector payroll after a nationwide audit reviewed that they costed Gvt over
US$2m a month.
Zambia
President Edgar Lungu said on Friday
that he expected inflation in Africa's 2nd-biggest copper producer, currently
running at almost 22%, to slow to single digits within few months.
Zimbabwe
Zimbabwe cut its economic growth
forecast to 1.4% in 2016 from an initial forecast of 2.7%, the ministry of
finance said, following a devastating
drought and weak commodity prices.
10,150
10,200
10,250
10,300
10,350BSE DCI
YTD down 3.5%WoW down 0.8% 139
141
143
145
147
149NSE All Share Index
YTD up 0.7%WoW up 0.8% 23,000
24,000
25,000
26,000
NGSE All Share Index
YTD down 10.3%WoW up 2.6%
129.0
129.5
130.0
130.5
131.0RSE ALSI
YTD down 0.1%WoW flat
46,000
48,000
50,000
52,000
54,000JSE All Share Index
YTD up 1.8%WoW up 0.4% 2,200
2,300
2,400
2,500
2,600DSE Index
YTD up 7.7%WoW up 1.0%
4,900
5,100
5,300
5,500
5,700LuSE
YTD down 13.4%WoW down 0.7%
96
100
104
108ZSE Industrial Index
YTD down 6.3%WoW up 0.5%
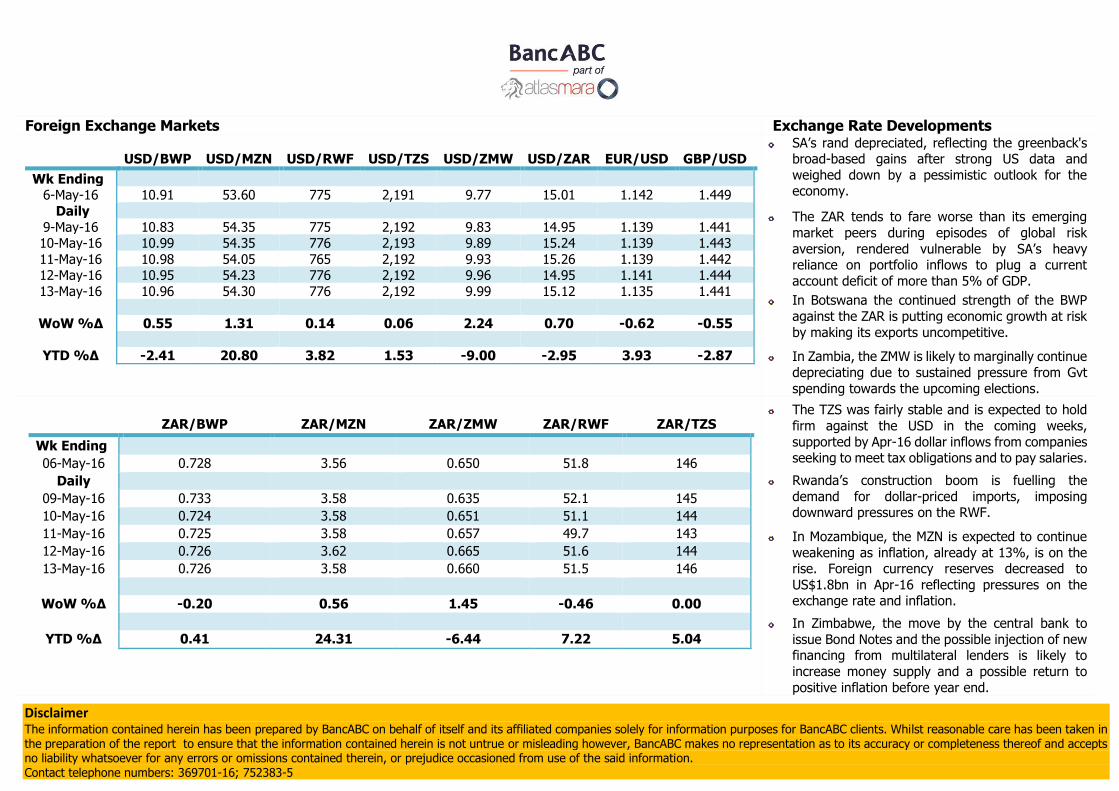
Foreign Exchange Markets Exchange Rate Developments
USD/BWP USD/MZN USD/RWF USD/TZS USD/ZMW USD/ZAR EUR/USD GBP/USD
Wk Ending 6-May-16 10.91 53.60 775 2,191 9.77 15.01 1.142 1.449
Daily
9-May-16 10.83 54.35 775 2,192 9.83 14.95 1.139 1.441 10-May-16 10.99 54.35 776 2,193 9.89 15.24 1.139 1.443
11-May-16 10.98 54.05 765 2,192 9.93 15.26 1.139 1.442 12-May-16 10.95 54.23 776 2,192 9.96 14.95 1.141 1.444
13-May-16 10.96 54.30 776 2,192 9.99 15.12 1.135 1.441
WoW %∆ 0.55 1.31 0.14 0.06 2.24 0.70 -0.62 -0.55
YTD %∆ -2.41 20.80 3.82 1.53 -9.00 -2.95 3.93 -2.87
SA’s rand depreciated, reflecting the greenback's broad-based gains after strong US data and
weighed down by a pessimistic outlook for the economy.
The ZAR tends to fare worse than its emerging
market peers during episodes of global risk
aversion, rendered vulnerable by SA’s heavy reliance on portfolio inflows to plug a current
account deficit of more than 5% of GDP.
In Botswana the continued strength of the BWP
against the ZAR is putting economic growth at risk
by making its exports uncompetitive.
In Zambia, the ZMW is likely to marginally continue
depreciating due to sustained pressure from Gvt
spending towards the upcoming elections.
ZAR/BWP ZAR/MZN ZAR/ZMW ZAR/RWF ZAR/TZS
Wk Ending
06-May-16 0.728 3.56 0.650 51.8 146
Daily
09-May-16 0.733 3.58 0.635 52.1 145
10-May-16 0.724 3.58 0.651 51.1 144
11-May-16 0.725 3.58 0.657 49.7 143
12-May-16 0.726 3.62 0.665 51.6 144
13-May-16 0.726 3.58 0.660 51.5 146
WoW %∆ -0.20 0.56 1.45 -0.46 0.00
YTD %∆ 0.41 24.31 -6.44 7.22 5.04
The TZS was fairly stable and is expected to hold
firm against the USD in the coming weeks,
supported by Apr-16 dollar inflows from companies seeking to meet tax obligations and to pay salaries.
Rwanda’s construction boom is fuelling the
demand for dollar-priced imports, imposing downward pressures on the RWF.
In Mozambique, the MZN is expected to continue
weakening as inflation, already at 13%, is on the rise. Foreign currency reserves decreased to
US$1.8bn in Apr-16 reflecting pressures on the exchange rate and inflation.
In Zimbabwe, the move by the central bank to
issue Bond Notes and the possible injection of new financing from multilateral lenders is likely to
increase money supply and a possible return to
positive inflation before year end.
Disclaimer The information contained herein has been prepared by BancABC on behalf of itself and its affiliated companies solely for information purposes for BancABC clients. Whilst reasonable care has been taken in the preparation of the report to ensure that the information contained herein is not untrue or misleading however, BancABC makes no representation as to its accuracy or completeness thereof and accepts no liability whatsoever for any errors or omissions contained therein, or prejudice occasioned from use of the said information. Contact telephone numbers: 369701-16; 752383-5
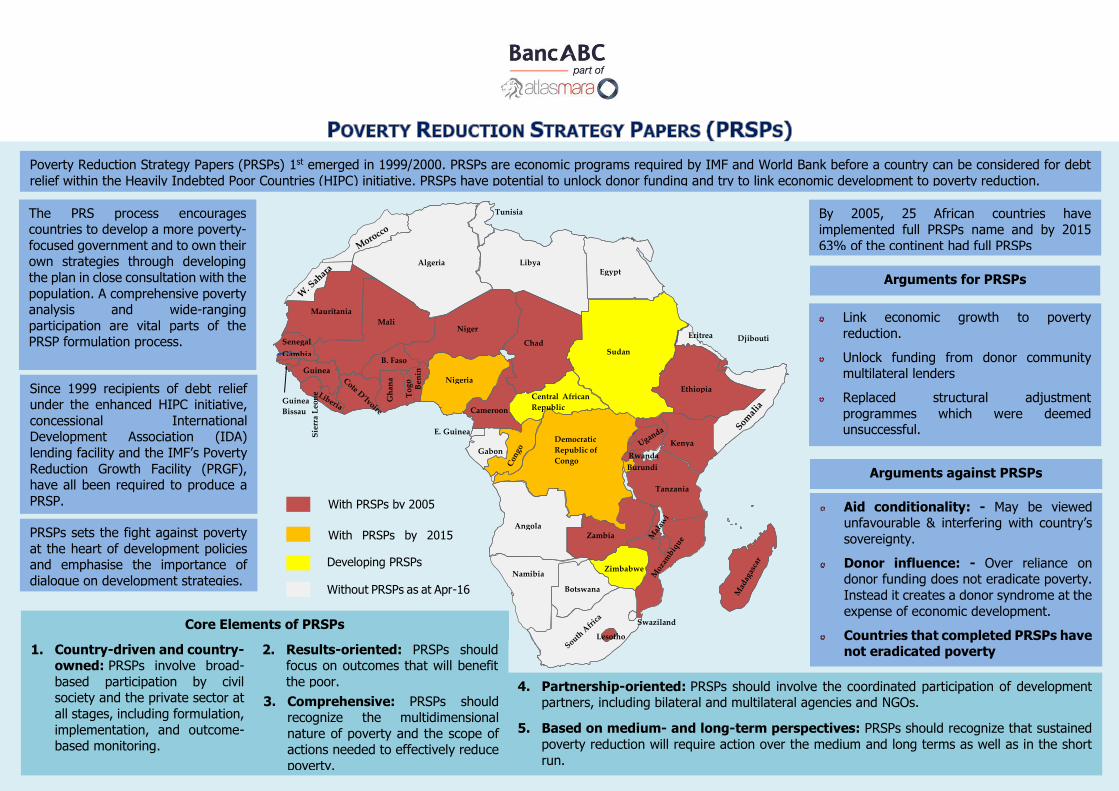
With PRSPs by 2005
With PRSPs by 2015 PRSPs
Developing PRSPs
Without PRSPs as at Apr-16
Zambia
Zimbabwe
Angola
Namibia Botswana
Lesotho Swaziland
Democratic
Republic of
Congo
Central African
Republic
Sudan
Tanzania
Kenya Rwanda Burundi
Ethiopia
Eritrea Djibouti
Egypt Libya Algeria
Tunisia
Mauritania Mali
Niger
Nigeria
Chad
Cameroon
Gabon
E. Guinea
B. Faso
Ben
in
Gh
ana
Guinea
Senegal
Sie
rra
Leo
ne
Gambia
Guinea
Bissau
By 2005, 25 African countries have
implemented full PRSPs name and by 2015
63% of the continent had full PRSPs
The PRS process encourages countries to develop a more poverty-
focused government and to own their own strategies through developing
the plan in close consultation with the
population. A comprehensive poverty analysis and wide-ranging
participation are vital parts of the PRSP formulation process.
Poverty Reduction Strategy Papers (PRSPs) 1st emerged in 1999/2000. PRSPs are economic programs required by IMF and World Bank before a country can be considered for debt
relief within the Heavily Indebted Poor Countries (HIPC) initiative. PRSPs have potential to unlock donor funding and try to link economic development to poverty reduction.
Since 1999 recipients of debt relief under the enhanced HIPC initiative,
concessional International Development Association (IDA)
lending facility and the IMF’s Poverty
Reduction Growth Facility (PRGF), have all been required to produce a
PRSP.
PRSPs sets the fight against poverty
at the heart of development policies and emphasise the importance of
dialogue on development strategies.
Arguments against PRSPs
Arguments for PRSPs
2. Results-oriented: PRSPs should focus on outcomes that will benefit
the poor.
Core Elements of PRSPs
1. Country-driven and country-owned: PRSPs involve broad-
based participation by civil society and the private sector at
all stages, including formulation,
implementation, and outcome-based monitoring.
3. Comprehensive: PRSPs should recognize the multidimensional
nature of poverty and the scope of actions needed to effectively reduce
poverty.
4. Partnership-oriented: PRSPs should involve the coordinated participation of development partners, including bilateral and multilateral agencies and NGOs.
5. Based on medium- and long-term perspectives: PRSPs should recognize that sustained
poverty reduction will require action over the medium and long terms as well as in the short
run.
3.
Aid conditionality: - May be viewed unfavourable & interfering with country’s
sovereignty.
Donor influence: - Over reliance on donor funding does not eradicate poverty.
Instead it creates a donor syndrome at the
expense of economic development.
Countries that completed PRSPs have not eradicated poverty
Link economic growth to poverty
reduction.
Unlock funding from donor community multilateral lenders
Replaced structural adjustment
programmes which were deemed unsuccessful.