Embed Size (px)
Citation preview

Temperature Dependence of Self-diffusion in Cr2O3 from First Principles
Bharat Medasanib,1, Maria L. Sushkob, Kevin M. Rossob, Daniel K. Schreiberc, Stephen M. Bruemmerc
aPhysical and Computational Sciences Directorate, Pacific Northwest National Laboratory, Richland, WA 99354, USAbDelaware Energy Institute, University of Delaware, Newark, DE 19702, USA
cEnergy and Environment Directorate, Pacific Northwest National Laboratory, Richland, WA 99354, USA
Abstract
Understanding and predicting the dominant diffusion processes in Cr2O3 is essential to its optimization for anti-corrosion coatings, spintronics, and other applications. Despite significant theoretical effort in modeling defect me-diated diffusion in Cr2O3 the correlation with experimentally measured diffusivities remains poor partly due to theinsufficient accuracy of the theoretical approaches. Here an attempt to resolve these discrepancies is made throughhigh accuracy density functional theory simulations coupled with grand canonical formalism of defect thermochem-istry. In this approach, point defect formation energies were computed using hybrid exchange correlation functional.This level of theory proved to be essential for achieving the agreement with experimental self-diffusion coefficients.The analysis of the resulting self-diffusion coefficients indicate that chromium has higher mobility at low temperaturesand high oxygen partial pressures, in particular at standard temperature and pressure conditions. At high vacuum, hightemperature conditions, oxygen diffusion becomes dominant. At Cr/Cr2O3 interfaces O vacancies were found to bemore mobile than Cr vacancies at all temperatures. Cr diffuses preferentially along the c-axis at low temperatures butswitches to basal plane at higher temperatures. O diffusion is primarily bound to basal plane at all temperatures.
1. Introduction
Cr2O3 finds applications in both functional and structural applications such as catalysis [1, 2], electro-optics[3, 4],magnetoelectronic [5, 6], and corrosion protection[7]. It serves as a protective oxide coating on widely used high-temperature Ni and Fe alloys[8, 9, 10]. Point defects play an important role in the effectiveness of Cr2O3 for corrosionprotection and other applications and significant experimental effort has been devoted to understanding the nature ofpoint defects and their diffusion mechanisms. However, there is a large spread in the reported self-diffusion coefficientsand defect formation energies from various experimental studies [11, 12, 13, 14, 15, 16, 17, 18, 19, 20].
Complementing the experimental investigations, diffusion mediated by both intrinsic and extrinsic point defectsin Cr2O3 have been extensively studied theoretically by many groups, including ours [21, 22, 23, 24, 25, 26, 27,28]. Due to the advances in density functional theory (DFT) accuracy in calculating many properties of materials,recent studies employed DFT to evaluate formation energies, migration barriers and charge localization of pointdefects[22, 23, 24, 28, 27]. The 0K energies obtained from DFT were combined with Einstein-Smoluchowski randomwalk thermal diffusion formalism[29] to predict the self-diffusion coefficients in Cr2O3. However, the agreementbetween calculated and experimental self-diffusion coefficients had, so far, been poor, which prompted the use ofmodified diffusion equations [27, 22]. This leaves the question of the root cause of the discrepancy between theoryand experiment unresolved.
A possible source of discrepancy is the insufficient accuracy of the DFT in modeling transition metal oxides, whichrequires the use of empirical corrections to the exchange-correlation functionals to induce electron localization. Forexample, to correct for the self-interaction error and induce electron localization in modeling Cr2O3 highly correlatedCr-3d (and sometimes O-2p) electrons the Hubbard on-site correction is often employed [30, 31, 32]. However, theresulting defect formation energies vary significantly [22, 23, 24, 25, 20, 33] depending on the choice of Hubbard
∗Corresponding author: B. Medasani ([email protected], [email protected]).
1
arX
iv:1
904.
0462
5v1
[co
nd-m
at.m
trl-
sci]
9 A
pr 2
019
U parameters and the type of the semi-local generalized gradient approximation (GGA) functionals. Adding to theconfusion, corrections to minimize the electrostatic errors inherent in the periodic supercell formulation of defects andthe errors due to the under-prediction of bandgap by semi-local functionals were either not applied or inconsistentlyapplied in many of these studies.
Rak and Brenner found that the barrier energies for defect migration were not sensitive to the variations in Uvalue. In contrast, they showed that varying U value results in a variation of defect formation energies [27]. The likelyreason for such variations is in electronic dissimilarities in the local environments in defected and bulk systems. Forexample, the electronic density surrounding a point defect such as a vacancy is much lower compared to the electronicdensity in the corresponding bulk system and the relative effect of U is different.
Selecting the U parameter in the Hubbard correction scheme is neither trivial nor consistent. Often, U selectionis based on fitting a bulk property to the experimental value. The chosen optimal U value is highly dependent on theselected bulk property. Another approach which avoids the empirical route in the selection of U is based on the linearresponse theory (LRT)[34]. LRT based U values often tend to be smaller than the U values obtained from regressingbulk properties. To overcome the uncertainties associated with the empirical U value of Hubbard correction scheme,we employed hybrid functional to accurately evaluate defect electronic levels and defect formation energies.
Here we report self-diffusion coefficients computed using Einstein-Smoluchowski formalism and high accuracypoint defect energies. The resulting diffusion coefficients have a reasonable agreement with the experimental data.This work can be considered as the culmination of our previous studies on the atomistic diffusion mechanisms inCr2O3 mediated by vacancies and interstitials [23, 28]. For barrier energies, the transition state and ground defect stateexhibit similar local electronic environment, suggesting an insensitivity to the U value used in this prior work. Hence,by utilizing the transition barrier energies obtained in those studies in addition to the revised more accurate defectenergies and defect thermodynamics, we evaluated Fermi level variations, stoichiometry deviations and self diffusioncoefficients in undoped bulk Cr2O3 as a function of temperature and oxygen partial pressure. The computed selfdiffusion coefficients were analyzed using Brouwer diagrams to reveal the dominant defects responsible for diffusion.
2. Methods
2.1. Density Functional Theory Approach
Density functional theory (DFT) calculations for defect formation energies were performed using the Vienna abinitio simulation package (VASP) [35, 36, 37]. We utilized HSE [38] hybrid functional with 25% mixing of Hartree- Fock exchange at short range and 100% PBE correlation. Projector augmented wave (PAW) [39, 40] optimized forPBE [41] functional was used. Wave functions preoptimized from GGA+U calculations with PBEsol [42] functionalwas used as input to the HSE calculations. The HSE screening parameter of 0.6, which is different from the commonlyused values of 0.2 and 0.3 corresponding to HSE06 and HSE03, respectively, was chosen after fitting the computedbandgaps with the experimental bandgap. This point is further discussed in the Results section. The reciprocal spaceof the primitive cell of Cr2O3 (R3c space group) with 10 atoms was sampled with 5×5×5 Γ-centered k-point grid.The primitive cell was fully relaxed (both size and shape were relaxed) until the forces converged to 0.01 eV/Å.The atomic positions in the 2×2×1 defect supercells were relaxed at constant volume and fixed cell shape until theindividual forces on each atom were minimized to 0.03 eV/Å. For supercell calculations, a cut-off value of 400 eVwas used for the plane-wave basis set and 2×2×1 Γ-centered k-point grid was used to sample the reciprocal space.Spin polarization with anti-ferromagnetic (AFM) ordering of Cr spins was used. Gaussian method with a width of0.01 eV was used for electronic smearing.
2.2. Diffusion Coefficient Calculation
In materials which support charged defects, the diffusion coefficient of an element s can be defined as
Ds =∑
X
∑q
d(Xqs ) (1)
where d is the diffusion coefficient pertaining to a defect Xqs , with X denoting the defect type, and q representing the
defect charge. X can be a regular point defect, such as a vacancy or an interstitial, or it can be a complex defect, such
2
as the Frenkel defect. Based on Einstein’s random walk theory, d can be computed as
d =12
c∑
p
mpl2pΓp. (2)
Here c is the concentration of defect, Xqs , and p represents one of the migration pathways. mp, lp, and Γp indicate
the multiplicity, length, and jump frequency associated with path p, respectively. The defect concentration, c, is afunction of the defect formation energy E f ,
c = c0e−βE f , (3)
were c0 is the number of lattice sites per cell volume. According to Vineyard’s transition state theory (TST) [43], thejump frequency is defined as a function of the attempt frequency νp and the migration barrier energy Em,p as
Γp = νpe−βEm,p . (4)
The attempt frequency is evaluated under harmonic approximation using the phonon modes of defect ground andtransition states as
ν =
∏3N−3i νi∏3N−4i ν′j
, (5)
where νi and ν′j represent the real phonon frequencies of the ground and transition states of the defect respectively andN is the number of atoms in the bulk supercell.
3. Finite Temperature Defect Concentrations
The effect of pressure and temperature is accounted for in the diffusion coefficients through the chemical poten-tial term in the expression for defect formation energies. Assuming dilute concentrations for defects, we utilizedconstrained grand canonical formalism to compute the elemental chemical potentials at finite temperatures. This for-malism has been successfully applied to predict defect concentrations in ZrO2 under dilute conditions[44]. In thisformalism, bulk Cr2O3 is assumed to be in contact with an infinite O2 reservoir at temperature T and partial pressurepO2 . The oxygen chemical potential then is defined as
µO(pO2 ,T ) = µ0O + ∆µ0
O(1atm, 298K) + ∆µO(pO2 ,T ). (6)
In the above equation, µ0O is the 0 K DFT computed O chemical potential, ∆µ0
O(1 atm, 298 K) is the correction toobtain the experimental chemical potential of O at standard temperature and pressure (STP: 273 K and 1 atm pressure)conditions, and ∆µO(pO2 ,T ) is given by
∆µO(pO2 ,T ) = kT ln(pO2 ). (7)
The latter two quantities are obtained from NIST-JANAF tables[45]. Cr chemical potential is obtained from µO as
µCr(pO2 ,T ) = ∆HCr2O3 − µO(pO2 ,T ), (8)
where ∆HCr2O3 is the formation enthalpy of Cr2O3.Since the overall system is charge neutral, we impose the charge neutrality condition after accounting for the
charged defects and free carriers such as electrons and holes using the expression∑Xq
s
q cXqs + p − n = 0, (9)
where p and n represent the number densities of holes and electrons, respectively. Given that the formation energy ofa charged defect can be calculated as [23, 28]
EXqs
f = EXqs
tot − Ebulktot +
∑s′
ns′ (Xqs )µs′ + qEF + EXq
scorr. (10)
We can rewrite the concentration of defect Xqs as
cXqs (pO2 ,T, EF) = cXq
s0 e−EXq
sf (pO2 ,T,EF )/kT . (11)
3
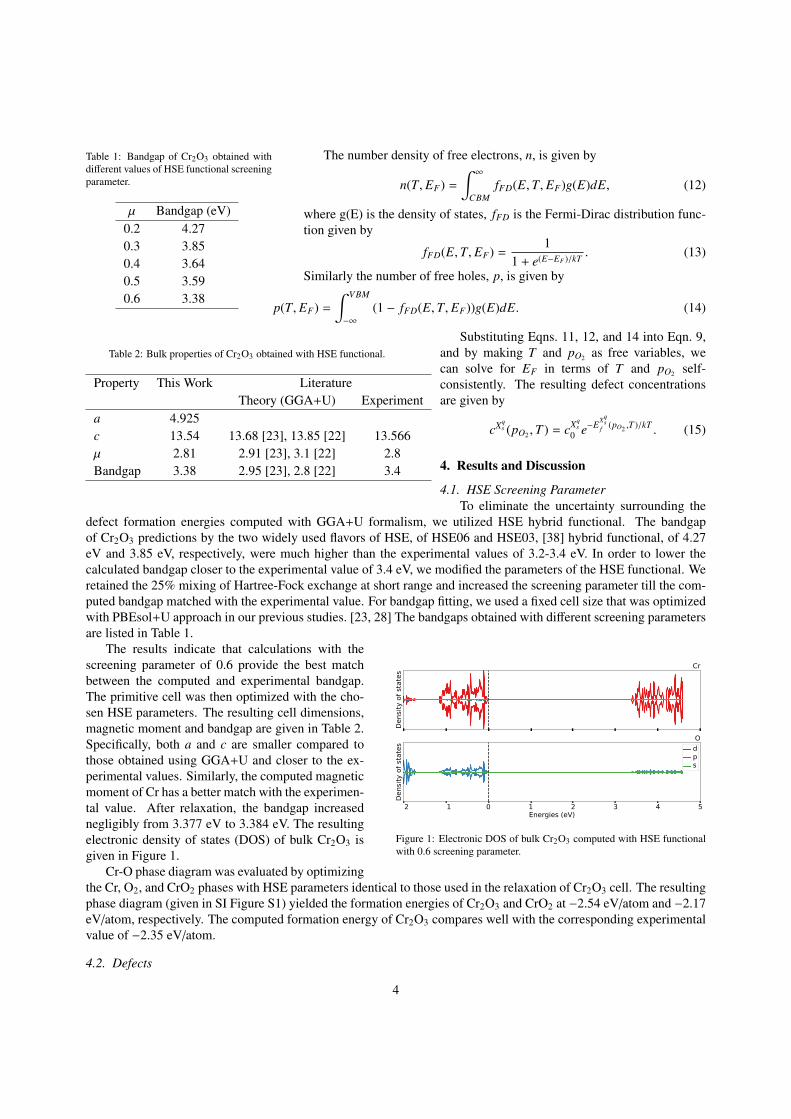
Table 1: Bandgap of Cr2O3 obtained withdifferent values of HSE functional screeningparameter.
µ Bandgap (eV)0.2 4.270.3 3.850.4 3.640.5 3.590.6 3.38
The number density of free electrons, n, is given by
n(T, EF) =
∫ ∞CBM
fFD(E,T, EF)g(E)dE, (12)
where g(E) is the density of states, fFD is the Fermi-Dirac distribution func-tion given by
fFD(E,T, EF) =1
1 + e(E−EF )/kT . (13)
Similarly the number of free holes, p, is given by
p(T, EF) =
∫ VBM
−∞
(1 − fFD(E,T, EF))g(E)dE. (14)
Table 2: Bulk properties of Cr2O3 obtained with HSE functional.
Property This Work LiteratureTheory (GGA+U) Experiment
a 4.925c 13.54 13.68 [23], 13.85 [22] 13.566µ 2.81 2.91 [23], 3.1 [22] 2.8Bandgap 3.38 2.95 [23], 2.8 [22] 3.4
Substituting Eqns. 11, 12, and 14 into Eqn. 9,and by making T and pO2 as free variables, wecan solve for EF in terms of T and pO2 self-consistently. The resulting defect concentrationsare given by
cXqs (pO2 ,T ) = cXq
s0 e−EXq
sf (pO2 ,T )/kT . (15)
4. Results and Discussion
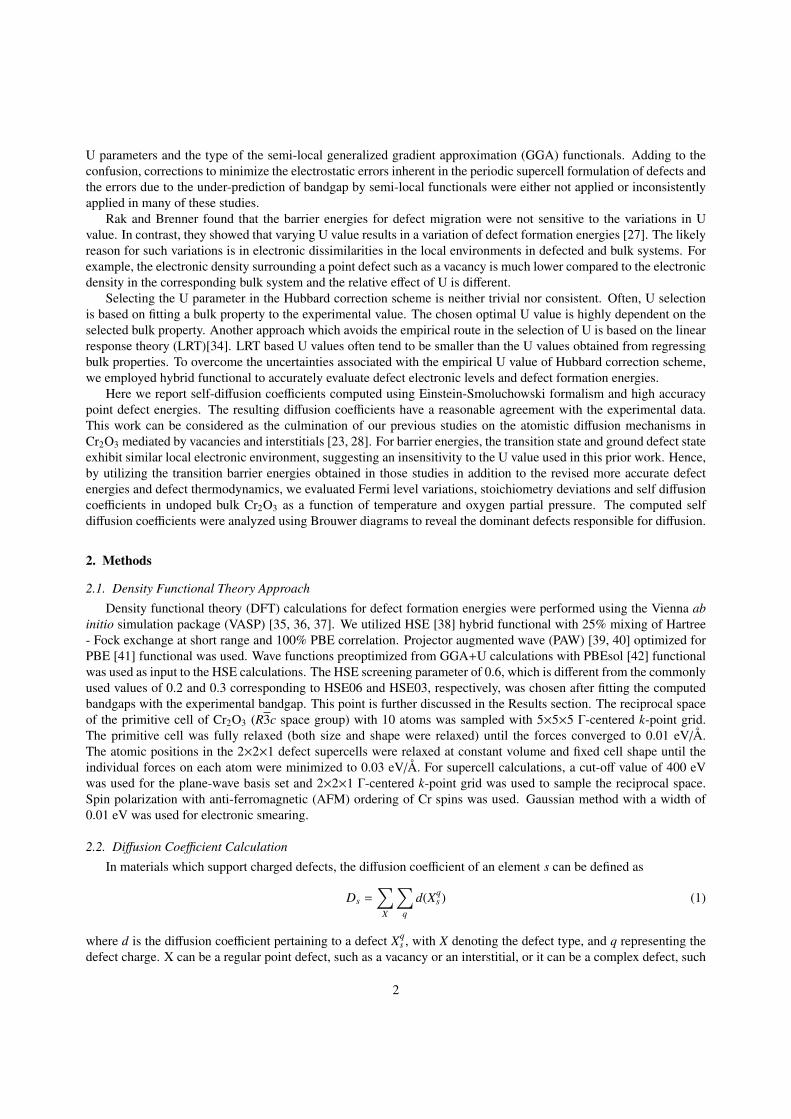
4.1. HSE Screening ParameterTo eliminate the uncertainty surrounding the
defect formation energies computed with GGA+U formalism, we utilized HSE hybrid functional. The bandgapof Cr2O3 predictions by the two widely used flavors of HSE, of HSE06 and HSE03, [38] hybrid functional, of 4.27eV and 3.85 eV, respectively, were much higher than the experimental values of 3.2-3.4 eV. In order to lower thecalculated bandgap closer to the experimental value of 3.4 eV, we modified the parameters of the HSE functional. Weretained the 25% mixing of Hartree-Fock exchange at short range and increased the screening parameter till the com-puted bandgap matched with the experimental value. For bandgap fitting, we used a fixed cell size that was optimizedwith PBEsol+U approach in our previous studies. [23, 28] The bandgaps obtained with different screening parametersare listed in Table 1.
Dens
ity of s
tates
total
Dens
ity of s
tates
Cr
−2 −1 0 1 2 3 4 5Energies (eV)
Dens
ity of s
tates
Odps
Figure 1: Electronic DOS of bulk Cr2O3 computed with HSE functionalwith 0.6 screening parameter.
The results indicate that calculations with thescreening parameter of 0.6 provide the best matchbetween the computed and experimental bandgap.The primitive cell was then optimized with the cho-sen HSE parameters. The resulting cell dimensions,magnetic moment and bandgap are given in Table 2.Specifically, both a and c are smaller compared tothose obtained using GGA+U and closer to the ex-perimental values. Similarly, the computed magneticmoment of Cr has a better match with the experimen-tal value. After relaxation, the bandgap increasednegligibly from 3.377 eV to 3.384 eV. The resultingelectronic density of states (DOS) of bulk Cr2O3 isgiven in Figure 1.
Cr-O phase diagram was evaluated by optimizingthe Cr, O2, and CrO2 phases with HSE parameters identical to those used in the relaxation of Cr2O3 cell. The resultingphase diagram (given in SI Figure S1) yielded the formation energies of Cr2O3 and CrO2 at −2.54 eV/atom and −2.17eV/atom, respectively. The computed formation energy of Cr2O3 compares well with the corresponding experimentalvalue of −2.35 eV/atom.
4.2. Defects
4
DOS
Cr0i
DOS
Cr1i
DOS
Cr2i
−2 −1 0 1 2 3 4 5Energies (eV)
DOS
Cr3idps
(a) Cr interstitials
DOS
V0Cr
DOS
V−1Cr
DOS
V−2Cr
−2 −1 0 1 2 3 4 5Energies (eV)
DOS
V−3Cr
dps
(b) Cr vacancies
Figure 2: Orbital projected DOS averaged over all sites for interstitials in different charge states. Dashed vertical line marks the position of theFermi level. The zero level has been fixed at the VBM.
DOS
V0Cr− split
DOS
V−1Cr− split
DOS
V−2Cr− split
−2 −1 0 1 2 3 4 5Energies (eV)
DOS
V−3Cr− split
dps
Figure 3: Orbital projected DOS averaged over all sites for Cr vacancytriple defects in different charge states. Dashed vertical line marks theposition of the Fermi level. The zero level has been fixed at the VBM.
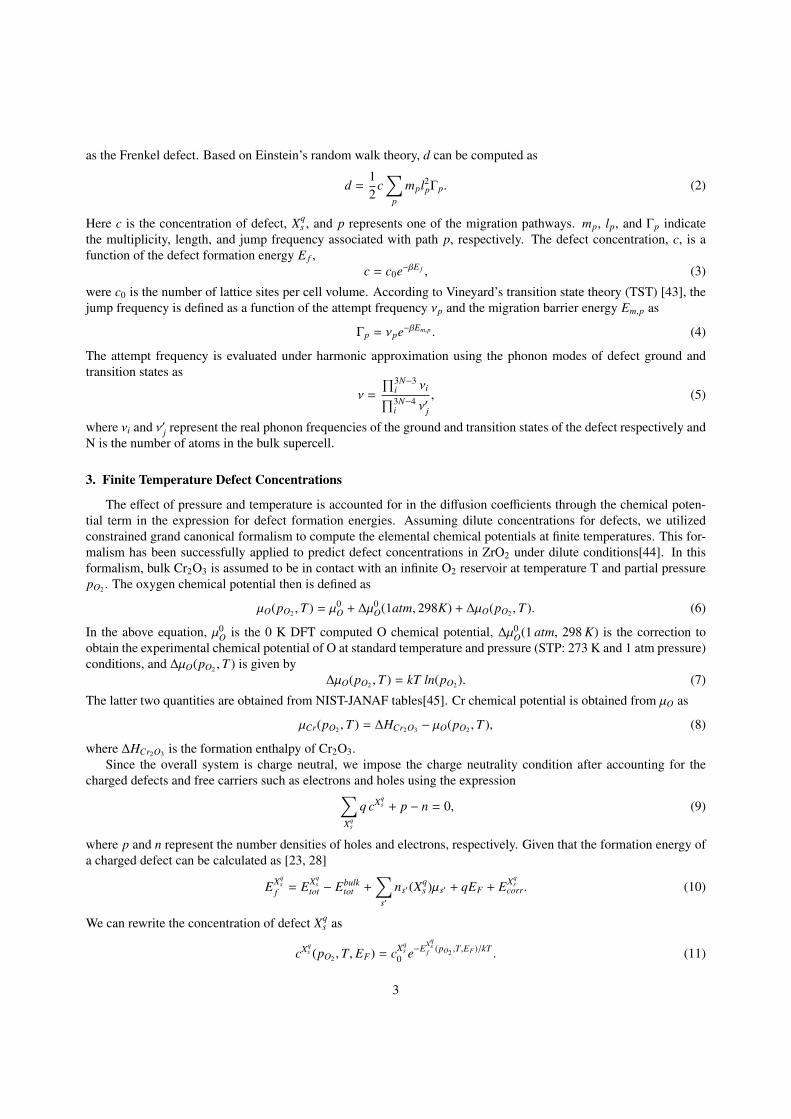
Defect calculations were performed using a2×2×1 supercell containing vacancies and intersti-tials and generated from the optimized primitive cell.In addition to vacancies and interstitials, Cr vacancytriple defect (or split-vacancy) identified in our ear-lier work [23] was also considered. The ionic posi-tions in the defect supercells were optimized underfixed volume and shape conditions.
To gain an understanding of how HSE affecteddefect properties, we evaluated electronic density ofstates (DOS), distribution of excess electrons andholes for charged defects, and the formation energiesof the optimized defects.
4.2.1. Electronic Structure of DefectsPrevious studies of defects in Cr2O3 mainly em-
ployed GGA+U method. Given that U and thewidth of the bandgap often have monotonic relation-ship U value is often fitted to recover experimentalbandgap. The choice of the U-value not only affectsthe bandgap but also the position of the VBM and toa certain extent CBM with respect to the core bands.To get an understanding of the influence of U on thedefect induced electronic states, we focus on the de-fect levels of the neutral Cr and O vacancies. In par-ticular, in the studies of Lebreau et al., and Rak and Brenner, the U value of 5.0 eV within Dudarev formalism wasused for Cr-3d electrons. According to the DOS of the vacancies reported in these two studies, neutral Cr vacancy
5

DOS
O0i
DOS
O−1i
−2 −1 0 1 2 3 4 5Energies (eV)
DOS
O−2i
dps
(a) O dumbbell interstitialsDO
S
V0O
DOS
V1O
−2 −1 0 1 2 3 4 5Energies (eV)
DOS
V2O
dps
(b) O vacancies
Figure 4: Orbital projected DOS averaged over all sites for O defects in different charge states. Dashed vertical line marks the position of the Fermilevel. The zero level has been fixed at the VBM.
exhibits two defects levels, one that is slightly above the VBM (0.2 or 0.3 eV, respectively) , and another that is un-occupied and at the bottom of the CBM. Differing from these studies, Gray et al. used {U, J} = {4.5, 1} eV within theLiechtenstein formalism and Medasani et al. used U=3.7 eV within Dudarev formalism. Both studies indicate thatVCr introduces multiple defect levels. Gray et al.’s results point to four distinct defect levels (with two of them veryclose to each other and slightly below the CBM) in the bandgap, and Medasani et al. reported 5 distinct defect levels.If defect levels that are energetically closer are grouped together, then Gray et al and Medasani et al’s data predict theexistence of three defect level zones: a) just above the VBM, b) 1 eV above the VBM, and c) just below the CBM.The HSE results confirm this pattern (Figure 2b). This indicates that Ue f f of ~3.7 eV is able to describe defect levelsof VCr more accurately at the GGA+U level of theory. For V0
O, HSE predicts two defect levels that are spin degenerateat 0.8 and 2.6 eV above VBM (Figure 4b). Similar electronic structure for V0
O was obtained in the study of Gray etal., where the spin degenerate levels are at 1.3 and 2.6 eV and in the study of Carey et al, who used UCr−3d = 5 eVand UO−2p = 5.5 eV, where the corresponding defect levels are at 1 and 2 eV above the VBM. Medasani et al. insteadobserved no degeneracy, but the resulting four levels are still within the bandgap. In contrast, Lebreau et al. observedno defect levels within the bandgap for VO. These results indicate that the energetic position of defect electronic stateswith respect to the VBM are highly dependent on the choice of U parameters and on the +U formalism selected.Comparison with the HSE results shows that although some GGA+U data qualitatively match the HSE results thedifference is often quite noticeable especially for neutral vacancies. Interestingly, for charged defects such as V−3
Cr , V2O,
and for interstitials, defect levels obtained from our GGA+U calculations are in good agreement with those obtainedfrom HSE calculations (see Figures2b-4a). It is noteworthy that unlike the study by Gray et al of native vacancies inCr2O3 that assumed fixed defect levels in the bandgap independent of the defect charge state, our earlier GGA+U andthe present HSE studies on vacancies and interstitials indicate that defect levels in the bandgap are not fixed but varydepending on the defect charge state.
4.2.2. Charge distributionThe distribution of the charge of excess hole(s) or electron(s) for the various charge states of the native vacancies
and self-interstitials is shown in SI Fig. S2 - S5. These plots indicate that both holes and electrons are delocalized.This finding on the delocalization of the holes is consistent with the earlier studies [33, 46, 23]. However, comparisonof charge distributions of Cr1
i and Cr2i holes shows that delocalization is more pronounced when GGA+U is used.
4.2.3. 0-K Defect Formation EnergiesAfter structure optimization, the spurious electrostatic interactions inherent in the periodic boundary formalism of
charged defects were corrected using the anisotropic FNV (Freysoldt, Neugebauer, and Vande Walle) method [47, 48]
6
(see Table S1 in SI for the resulting corrections). The charge transition levels of the defects with respect to the valenceband maximum are presented in Table S2 in the SI. When compared to the corrected transition levels reported in ourprevious works, the corresponding transition levels obtained with HSE are overall at a higher Fermi level. Some ofthe transition levels such as Cri (3/2) transition, which is at 2.6 eV above the VBM, differ by nearly 1 eV (1.64 eVin Ref [28]). Further, HSE predicts that only +3 and +2 charge states are stable for Cri within the bandgap. Onthe other hand, the Oi (0/-2) transition level at 3.07 eV differs only by 0.14 eV from the corresponding transitionlevel computed using GGA+U coupled with bandgap correction. This shows that while bandgap correction overallimproves the position of the transition levels computed with GGA+U, the improved agreement between the HSEcomputed and badgap corrected GGA+U formation energies is not systematic. The position of some transition levelssuch as Oi (0/-2) and VO (1/0) are almost the same, while the position of other transition levels such as Cri (3/2) andVO (2/1) exhibit differences that are greater than 0.4 eV when computed at the HSE and GGA+U levels of theory.
Table 3: Defect formation energies (in eV) of Cr2O3 with Fermilevel (EF ) at the middle of the bandgap under O-rich conditions.
Defect q HSE GGA+U [23, 28]
VO
0 5.55 6.011 5.62 6.342 6.16 7.47
VCr
0 0.90 1.93-1 0.93 1.69-2 1.30 1.37-3 2.00 1.66
Oi
0 2.94 2.18-1 4.77 3.69-2 5.76 4.38
Cri
0 11.65 10.131 9.58 8.822 7.85 7.913 6.92 7.97
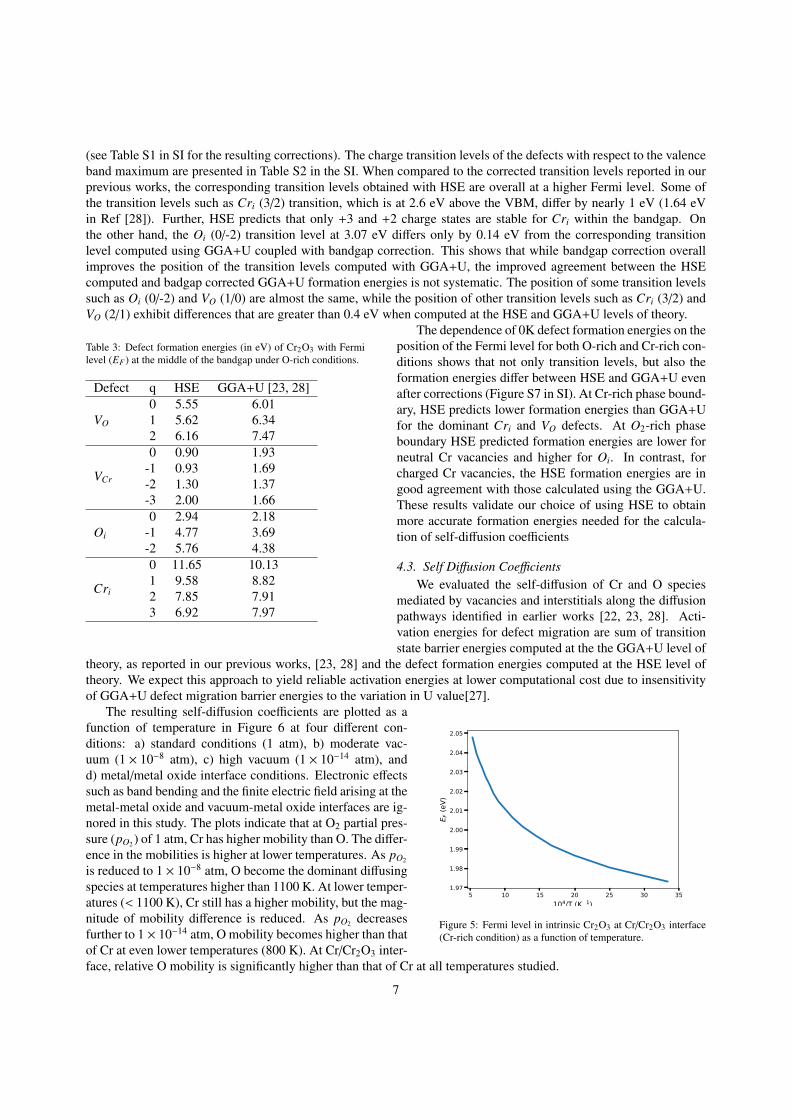
The dependence of 0K defect formation energies on theposition of the Fermi level for both O-rich and Cr-rich con-ditions shows that not only transition levels, but also theformation energies differ between HSE and GGA+U evenafter corrections (Figure S7 in SI). At Cr-rich phase bound-ary, HSE predicts lower formation energies than GGA+Ufor the dominant Cri and VO defects. At O2-rich phaseboundary HSE predicted formation energies are lower forneutral Cr vacancies and higher for Oi. In contrast, forcharged Cr vacancies, the HSE formation energies are ingood agreement with those calculated using the GGA+U.These results validate our choice of using HSE to obtainmore accurate formation energies needed for the calcula-tion of self-diffusion coefficients
4.3. Self Diffusion CoefficientsWe evaluated the self-diffusion of Cr and O species
mediated by vacancies and interstitials along the diffusionpathways identified in earlier works [22, 23, 28]. Acti-vation energies for defect migration are sum of transitionstate barrier energies computed at the the GGA+U level of
theory, as reported in our previous works, [23, 28] and the defect formation energies computed at the HSE level oftheory. We expect this approach to yield reliable activation energies at lower computational cost due to insensitivityof GGA+U defect migration barrier energies to the variation in U value[27].
5 10 15 20 25 30 35104/T (K−1)
1.97
1.98
1.99
2.00
2.01
2.02
2.03
2.04
2.05
E F (e
V)
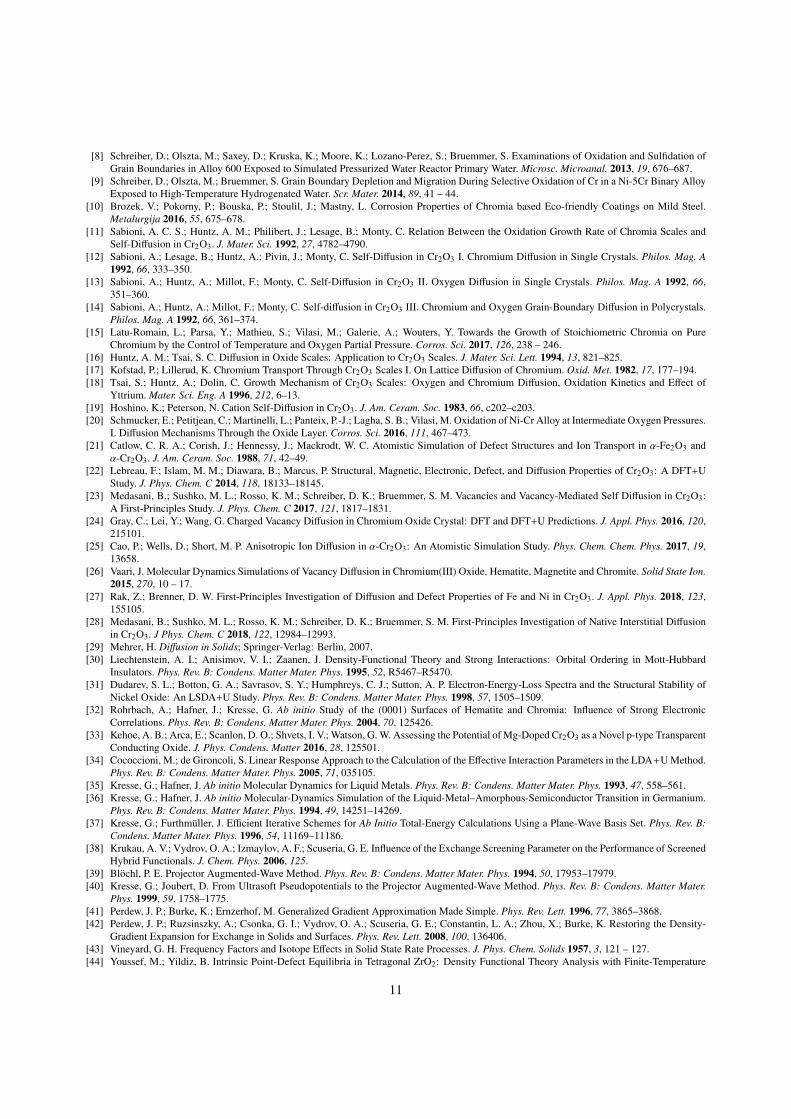
Figure 5: Fermi level in intrinsic Cr2O3 at Cr/Cr2O3 interface(Cr-rich condition) as a function of temperature.
The resulting self-diffusion coefficients are plotted as afunction of temperature in Figure 6 at four different con-ditions: a) standard conditions (1 atm), b) moderate vac-uum (1 × 10⁻⁸ atm), c) high vacuum (1 × 10⁻¹⁴ atm), andd) metal/metal oxide interface conditions. Electronic effectssuch as band bending and the finite electric field arising at themetal-metal oxide and vacuum-metal oxide interfaces are ig-nored in this study. The plots indicate that at O2 partial pres-sure (pO2 ) of 1 atm, Cr has higher mobility than O. The differ-ence in the mobilities is higher at lower temperatures. As pO2
is reduced to 1 × 10⁻⁸ atm, O become the dominant diffusingspecies at temperatures higher than 1100 K. At lower temper-atures (< 1100 K), Cr still has a higher mobility, but the mag-nitude of mobility difference is reduced. As pO2 decreasesfurther to 1 × 10⁻¹⁴ atm, O mobility becomes higher than thatof Cr at even lower temperatures (800 K). At Cr/Cr2O3 inter-face, relative O mobility is significantly higher than that of Cr at all temperatures studied.
7

6 7 8 9 10 11 12 13 14104/T (K−1)
−50
−40
−30
−20
−10
0
log D (cm
2 .s)
pO2 1.0e+00 atmCrO
(a)
6 7 8 9 10 11 12 13 14104/T (K−1)
−50
−40
−30
−20
−10
0
log D (cm
2 .s)
pO2 1.0e-08 atmCrO
(b)
6 7 8 9 10 11 12 13 14104/T (K−1)
−50
−40
−30
−20
−10
0
log D (cm
2 .s)
pO2 1.0e-14 atmCrO
(c)
6 7 8 9 10 11 12 13 14104/T (K−1)
−50
−40
−30
−20
−10
0
log
D (c
m2 .s
)Cr/Cr2O3 In erface
CrO
(d)
Figure 6: Self diffusion coefficients of Cr and O at vacuum/oxide interface at O2 partial pressures of a) 1 atm, b) 1 × 10⁻⁸ atm, c) 1 × 10⁻¹⁴ atm, d)and at Cr/oxide interace.
Sabioni reported the experimental diffusion coefficients of Cr and O as (2.2− 7.2)×10−18 cm s−2 and (3.2− 8.4)×10−18
cm s−2 measured at 1300° C and 1100° C respectively under high vacuum conditions. The experimental diffusion co-efficients reported by Sabioni et al. were nearly the same for Cr and O, and relatively independent of pO2 . Sabioniproposed the suprising independence of the diffusion coefficients from pO2 could be due to the presence of impuritiesin the Cr2O3 samples at around 1 ppm level. The resulting high concentration of extrinsic defects may have affectedthe diffusion coefficients in the Cr2O3 samples. While the diffusion coefficients reported by Sabioni could not beconsidered representative of intrinsic Cr2O3, they could serve as higher limits on one of the diffusion coefficients bypromoting the compensating defects of either Cr or O species. At 1373 K and at 1 × 10⁻¹⁴ atm, which are represen-tative of experimental conditions used to measure O diffusion, the computed diffusion coefficient of O is found to beat 1 × 10⁻¹⁸ cm s−2. This indicates that O diffusion coefficient was not affected by the extrinsic defects. At 1573 K,the maximal value of Cr diffusion coefficient observed by us is at 1 × 10⁻¹⁸ cm s−2 (at standard conditions), whichmatches with the experimental value of Cr diffusion.
To identify the nature of the predominant defects facilitating the diffusion of each species we plotted the defectconcentrations in Brouwer diagrams at different temperatures (Fig. 7). At low temperatures (< 800 K), Cr vacancies(including Cr triple defects denoted as VCr−T D) have higher concentrations at all pO2 . At 1200 K, the concentration ofVO is higher at pO2 below 1 × 10⁻⁸ atm. Above 1 × 10⁻⁸ atm, Cr vacancies become the dominant defects. Due to the
8

high concentration of Cr vacancies at pressures close to 1 atm and temperatures above 1200 K, the self diffusion of Cris equal to the one measured by Sabioni, suggesting that self-compensating Cr vacancies could be responsible for thehigh Cr diffusion coefficient (when compared to the intrinsic Cr diffusion coefficients at corresponding pO2 ). Theseresults indicate that vacancies are the mediators of reported self-diffusion coefficients in Cr2O3.
10−14 10−12 10−10 10−8 10−6 10−4pO2 (atm)
10−82
10−74
10−66
10−58
10−50
10−42
10−34
10−26
Defect con
centratio
n
300K
VCrVOVCr− TD
Oi
Crinh
(a)
10−14 10−12 10−10 10−8 10−6 10−4pO2 (atm)
10−30
10−27
10−24
10−21
10−18
10−15
10−12
Defect con
centratio
n
800K
VCrVOVCr− TD
Oi
Crinh
(b)
10−14 10−12 10−10 10−8 10−6 10−4pO2 (atm)
10−24
10−21
10−18
10−15
10−12
10−9
Defect con
centratio
n
1200K
VCrVOVCr− TD
Oi
Crinh
(c)
Figure 7: Brouwer diagrams depicting the defect concentrations vs.O2 partial pressure in Cr2O3 for a) 300 K, b) 800 K, and c) 1200 K.
If the impurity concentration in Cr2O3 samples couldbe minimized to very low levels, Fig. 7c indicatesthat at high temperatures (> 1200 K) and low pO2 (<1 × 10⁻¹² atm), VO and Cri could be responsible for Oand Cr diffusion respectively. However the relative mo-bility of O is very high in such cases, indicating againthat vacancies dominate the diffusion process in Cr2O3.
The Brouwer diagrams also reveal that it would bemisleading to use commonly reported 0-K defect forma-tion energies at the phase boundary edges to predict domi-nant defects responsible for experimentally measured dif-fusion coefficients. For example at Cr-rich boundary, the0-K defect energy diagram (Figure S6 in SI) indicates thatCri could be the dominant defect if the Fermi level, EF ,lies between 1.5 to 1.9 eV. However, the allowed Fermilevel range is only 1.97 − 2.04 eV (Figure 5) and neutralvacancies are the dominant defects. Fermi level variationis plotted as a function of pO2 for different temperatures inFigure 8a. The plots indicate that Cr2O3 is intrinsically p-type at low temperatures and high pO2 , where Fermi levelcan become as low as 1.2 eV. Under such conditions, thedominant defects are VCr (Figure S6 in SI). At low tem-peratures and low pO2 , the Fermi level is around 1.75 eVmaking Cr2O3 slightly n-type intrinsically. Stoichiome-try deviation plotted as a function of pO2 in Figure 8(b)shows that the deviation is negligible in intrinsic Cr2O3.
Figure 9 shows the anisotropic ratio of diffusion for Crand O at various operational conditions. The results indi-cate that Cr2O3 basal plane is the preferential diffusionpathway for O under all conditions. For Cr, however, thepreferred diffusion orientation is temperature dependent.At low temperatures, Cr diffuses mainly along the c-axis.The mode of diffusion switches to basal plane pathwayat around 1200 K under high pO2 . In ultra high vacuumconditions of pO2 ≤1 × 10⁻¹⁴ atm the primary mode of Crdiffusion switches back to c-axis at around 1600 K. Un-der such conditions, Cr diffusion coefficients along basalplane and c-axis become nearly the same.
5. Summary
Towards a comprehensive understanding of the diffu-sion processes in Cr2O3, we computed the self diffusioncoefficients and Brouwer diagrams in Cr2O3. Diffusioncoefficients were computed using the DFT at two accu-racy levels and the Einstein random walk formalism. Thedefect formation energies were reevaluated with HSE hy-brid functional for high accuracy, and were corrected for
9

spurious electrostatic interaction errors arising in the periodic supercell method. The resulting self diffusion coeffi-cients have a good agreement with the experimental data. Our results reveal that vacancies are primarily responsiblefor both Cr and O diffusion in intrinsic Cr2O3. At high temperatures and low oxygen partial pressures, O has highermobility. Cr has higher mobility at lower temperatures at moderate to high oxygen partial pressure. The preferred pathfor O diffusion is along the basal plane. Cr diffusion takes place along the c-axis at low temperatures and switchesto basal plane at temperatures above 1200 K. The revealed mechanism for self-diffusion in Cr2O3 in a wide range oftemperature and pressure conditions opens new avenues for the design of Cr2O3 materials.
10−15 10−13 10−11 10−9 10−7 10−5 10−3pO2 (atm)
1.3
1.4
1.5
1.6
1.7
E F (e
V)
300 K400 K600 K800 K1000 K1200 K
(a)
10−15 10−13 10−11 10−9 10−7 10−5 10−3pO2 (atm)
−1.5
−1.0
−0.5
0.0
0.5
ΔX of C
r
1e−10300 KΔ00 K1200 K
(b)
Figure 8: (a) Fermi level in intrinsic Cr2O3, and (b) stoichiometry deviation expressed in terms of relative change in Cr composition form stoi-chiometry as functions of temperature and O2 partial pressure.
Acknowledgement
This work was supported by the U.S. Department of Energy (DOE), Office of Science, Basic Energy Sciences,Materials Sciences and Engineering Division. Simulations were performed using PNNL Institutional Computingfacility. PNNL is a multi-program national laboratory operated by Battelle for the U.S. DOE under Contract DEAC05-76RL01830.
References
[1] Bates, M. K.; Jia, Q.; Ramaswamy, N.; Allen, R. J.; Mukerjee, S. Composite Ni/NiO-Cr2O3 Catalyst for Alkaline Hydrogen EvolutionReaction. J. Phys. Chem. C 2015, 119, 5467–5477.
[2] Xie, Z.; Fan, J.; Cheng, Y.; Jin, L.; Hu, G.; Lu, J.; Luo, M. Cr2O3 Catalysts for Fluorination of 2-Chloro-3,3,3-Trifluoropropene to 2,3,3,3-Tetrafluoropropene. Ind. & Eng. Chem. Res. 2013, 52, 3295–3299.
[3] Arca, E.; Kehoe, A. B.; Veal, T. D.; Shmeliov, A.; Scanlon, D. O.; Downing, C.; Daly, D.; Mullarkey, D.; Shvets, I. V.; Nicolosi, V.;Watson, G. W. Valence Band Modification of Cr2O3 by Ni-Doping: Creating a High Figure of Merit p-type TCO. J. Mater. Chem. C 2017, 5,12610–12618.
[4] Farrell, L.; Fleischer, K.; Caffrey, D.; Mullarkey, D.; Norton, E.; Shvets, I. V. Conducting Mechanism in the Epitaxial p-type TransparentConducting Oxide Cr2O3:Mg. Phys. Rev. B: Condens. Matter Mater. Phys. 2015, 91, 125202.
[5] Mu, S.; Wysocki, A. L.; Belashchenko, K. D. Effect of Substitutional Doping on the Neel Temperature of Cr2O3. Phys. Rev. B: Condens.Matter Mater. Phys. 2013, 87, 054435.
[6] Pati, S. P.; Shimomura, N.; Nozaki, T.; Shibata, T.; Sahashi, M. Neel Temperature of Cr2O3 in Cr2O3/Co Exchange-Coupled System: Effectof Buffer Layer. J. Appl. Phys. 2015, 117, 17D137.
[7] Zurek, J.; Young, D.; Essuman, E.; Hnsel, M.; Penkalla, H.; Niewolak, L.; Quadakkers, W. Growth and Adherence of Chromia Based SurfaceScales on Ni-base Alloys in High- and Low-pO2 Gases. Mater. Sci. Eng.: A 2008, 477, 259 – 270, 3rd International Conference on SprayDeposition and Melt Atomization (SDMA 2006) and the 6th International Conference on Spray Forming (ICSF VI).
10
[8] Schreiber, D.; Olszta, M.; Saxey, D.; Kruska, K.; Moore, K.; Lozano-Perez, S.; Bruemmer, S. Examinations of Oxidation and Sulfidation ofGrain Boundaries in Alloy 600 Exposed to Simulated Pressurized Water Reactor Primary Water. Microsc. Microanal. 2013, 19, 676–687.
[9] Schreiber, D.; Olszta, M.; Bruemmer, S. Grain Boundary Depletion and Migration During Selective Oxidation of Cr in a Ni-5Cr Binary AlloyExposed to High-Temperature Hydrogenated Water. Scr. Mater. 2014, 89, 41 – 44.
[10] Brozek, V.; Pokorny, P.; Bouska, P.; Stoulil, J.; Mastny, L. Corrosion Properties of Chromia based Eco-friendly Coatings on Mild Steel.Metalurgija 2016, 55, 675–678.
[11] Sabioni, A. C. S.; Huntz, A. M.; Philibert, J.; Lesage, B.; Monty, C. Relation Between the Oxidation Growth Rate of Chromia Scales andSelf-Diffusion in Cr2O3. J. Mater. Sci. 1992, 27, 4782–4790.
[12] Sabioni, A.; Lesage, B.; Huntz, A.; Pivin, J.; Monty, C. Self-Diffusion in Cr2O3 I. Chromium Diffusion in Single Crystals. Philos. Mag. A1992, 66, 333–350.
[13] Sabioni, A.; Huntz, A.; Millot, F.; Monty, C. Self-Diffusion in Cr2O3 II. Oxygen Diffusion in Single Crystals. Philos. Mag. A 1992, 66,351–360.
[14] Sabioni, A.; Huntz, A.; Millot, F.; Monty, C. Self-diffusion in Cr2O3 III. Chromium and Oxygen Grain-Boundary Diffusion in Polycrystals.Philos. Mag. A 1992, 66, 361–374.
[15] Latu-Romain, L.; Parsa, Y.; Mathieu, S.; Vilasi, M.; Galerie, A.; Wouters, Y. Towards the Growth of Stoichiometric Chromia on PureChromium by the Control of Temperature and Oxygen Partial Pressure. Corros. Sci. 2017, 126, 238 – 246.
[16] Huntz, A. M.; Tsai, S. C. Diffusion in Oxide Scales: Application to Cr2O3 Scales. J. Mater. Sci. Lett. 1994, 13, 821–825.[17] Kofstad, P.; Lillerud, K. Chromium Transport Through Cr2O3 Scales I. On Lattice Diffusion of Chromium. Oxid. Met. 1982, 17, 177–194.[18] Tsai, S.; Huntz, A.; Dolin, C. Growth Mechanism of Cr2O3 Scales: Oxygen and Chromium Diffusion, Oxidation Kinetics and Effect of
Yttrium. Mater. Sci. Eng. A 1996, 212, 6–13.[19] Hoshino, K.; Peterson, N. Cation Self-Diffusion in Cr2O3. J. Am. Ceram. Soc. 1983, 66, c202–c203.[20] Schmucker, E.; Petitjean, C.; Martinelli, L.; Panteix, P.-J.; Lagha, S. B.; Vilasi, M. Oxidation of Ni-Cr Alloy at Intermediate Oxygen Pressures.
I. Diffusion Mechanisms Through the Oxide Layer. Corros. Sci. 2016, 111, 467–473.[21] Catlow, C. R. A.; Corish, J.; Hennessy, J.; Mackrodt, W. C. Atomistic Simulation of Defect Structures and Ion Transport in α-Fe2O3 and
α-Cr2O3. J. Am. Ceram. Soc. 1988, 71, 42–49.[22] Lebreau, F.; Islam, M. M.; Diawara, B.; Marcus, P. Structural, Magnetic, Electronic, Defect, and Diffusion Properties of Cr2O3: A DFT+U
Study. J. Phys. Chem. C 2014, 118, 18133–18145.[23] Medasani, B.; Sushko, M. L.; Rosso, K. M.; Schreiber, D. K.; Bruemmer, S. M. Vacancies and Vacancy-Mediated Self Diffusion in Cr2O3:
A First-Principles Study. J. Phys. Chem. C 2017, 121, 1817–1831.[24] Gray, C.; Lei, Y.; Wang, G. Charged Vacancy Diffusion in Chromium Oxide Crystal: DFT and DFT+U Predictions. J. Appl. Phys. 2016, 120,
215101.[25] Cao, P.; Wells, D.; Short, M. P. Anisotropic Ion Diffusion in α-Cr2O3: An Atomistic Simulation Study. Phys. Chem. Chem. Phys. 2017, 19,
13658.[26] Vaari, J. Molecular Dynamics Simulations of Vacancy Diffusion in Chromium(III) Oxide, Hematite, Magnetite and Chromite. Solid State Ion.
2015, 270, 10 – 17.[27] Rak, Z.; Brenner, D. W. First-Principles Investigation of Diffusion and Defect Properties of Fe and Ni in Cr2O3. J. Appl. Phys. 2018, 123,
155105.[28] Medasani, B.; Sushko, M. L.; Rosso, K. M.; Schreiber, D. K.; Bruemmer, S. M. First-Principles Investigation of Native Interstitial Diffusion
in Cr2O3. J Phys. Chem. C 2018, 122, 12984–12993.[29] Mehrer, H. Diffusion in Solids; Springer-Verlag: Berlin, 2007.[30] Liechtenstein, A. I.; Anisimov, V. I.; Zaanen, J. Density-Functional Theory and Strong Interactions: Orbital Ordering in Mott-Hubbard
Insulators. Phys. Rev. B: Condens. Matter Mater. Phys. 1995, 52, R5467–R5470.[31] Dudarev, S. L.; Botton, G. A.; Savrasov, S. Y.; Humphreys, C. J.; Sutton, A. P. Electron-Energy-Loss Spectra and the Structural Stability of
Nickel Oxide: An LSDA+U Study. Phys. Rev. B: Condens. Matter Mater. Phys. 1998, 57, 1505–1509.[32] Rohrbach, A.; Hafner, J.; Kresse, G. Ab initio Study of the (0001) Surfaces of Hematite and Chromia: Influence of Strong Electronic
Correlations. Phys. Rev. B: Condens. Matter Mater. Phys. 2004, 70, 125426.[33] Kehoe, A. B.; Arca, E.; Scanlon, D. O.; Shvets, I. V.; Watson, G. W. Assessing the Potential of Mg-Doped Cr2O3 as a Novel p-type Transparent
Conducting Oxide. J. Phys. Condens. Matter 2016, 28, 125501.[34] Cococcioni, M.; de Gironcoli, S. Linear Response Approach to the Calculation of the Effective Interaction Parameters in the LDA+U Method.
Phys. Rev. B: Condens. Matter Mater. Phys. 2005, 71, 035105.[35] Kresse, G.; Hafner, J. Ab initio Molecular Dynamics for Liquid Metals. Phys. Rev. B: Condens. Matter Mater. Phys. 1993, 47, 558–561.[36] Kresse, G.; Hafner, J. Ab initio Molecular-Dynamics Simulation of the Liquid-Metal–Amorphous-Semiconductor Transition in Germanium.
Phys. Rev. B: Condens. Matter Mater. Phys. 1994, 49, 14251–14269.[37] Kresse, G.; Furthmuller, J. Efficient Iterative Schemes for Ab Initio Total-Energy Calculations Using a Plane-Wave Basis Set. Phys. Rev. B:
Condens. Matter Mater. Phys. 1996, 54, 11169–11186.[38] Krukau, A. V.; Vydrov, O. A.; Izmaylov, A. F.; Scuseria, G. E. Influence of the Exchange Screening Parameter on the Performance of Screened
Hybrid Functionals. J. Chem. Phys. 2006, 125.[39] Blochl, P. E. Projector Augmented-Wave Method. Phys. Rev. B: Condens. Matter Mater. Phys. 1994, 50, 17953–17979.[40] Kresse, G.; Joubert, D. From Ultrasoft Pseudopotentials to the Projector Augmented-Wave Method. Phys. Rev. B: Condens. Matter Mater.
Phys. 1999, 59, 1758–1775.[41] Perdew, J. P.; Burke, K.; Ernzerhof, M. Generalized Gradient Approximation Made Simple. Phys. Rev. Lett. 1996, 77, 3865–3868.[42] Perdew, J. P.; Ruzsinszky, A.; Csonka, G. I.; Vydrov, O. A.; Scuseria, G. E.; Constantin, L. A.; Zhou, X.; Burke, K. Restoring the Density-
Gradient Expansion for Exchange in Solids and Surfaces. Phys. Rev. Lett. 2008, 100, 136406.[43] Vineyard, G. H. Frequency Factors and Isotope Effects in Solid State Rate Processes. J. Phys. Chem. Solids 1957, 3, 121 – 127.[44] Youssef, M.; Yildiz, B. Intrinsic Point-Defect Equilibria in Tetragonal ZrO2: Density Functional Theory Analysis with Finite-Temperature
11

Effects. Phys. Rev. B: Condens. Matter Mater. Phys. 2012, 86, 144109.[45] Chase, M. W. J. NIST-JANAF Thermochemical Tables, 4th Edition; American Institute of Physics: New York, 1998.[46] Lany, S.; Zunger, A. Assessment of Correction Methods for the Band-Gap Problem and for Finite-Size Effects in Supercell Defect Calcula-
tions: Case Studies for ZnO and GaAs. Phys. Rev. B: Condens. Matter Mater. Phys. 2008, 78, 235104.[47] Freysoldt, C.; Neugebauer, J.; Van de Walle, C. G. Fully Ab Initio Finite-Size Corrections for Charged-Defect Supercell Calculations. Phys.
Rev. Lett. 2009, 102, 016402.[48] Kumagai, Y.; Oba, F. Electrostatics-Based Finite-Size Corrections for First-Principles Point Defect Calculations. Phys. Rev. B: Condens.
Matter Mater. Phys. 2014, 89, 195205.
6 8 10 12 14104/T (K−1)
0.0
0.5
1.0
1.5
2.0
2.5
3.0
3.5
4.0
Aniso
ropi
c Ra
io
pO2 1.0e+00 a mCr c-axisCr ab-planeO c-axisO ab-plane
(a)
6 8 10 12 14104/T (K−1)
0.0
0.5
1.0
1.5
2.0
2.5
3.0
3.5
4.0
Aniso
tropic Ra
tio
pO2 1.0e-08 atmCr c-axisCr ab-planeO c-axisO ab-plane
(b)
6 8 10 12 14104/T (K−1)
0.0
0.5
1.0
1.5
2.0
2.5
3.0
3.5
4.0
Aniso
tropic Ra
tio
pO2 1.0e-14 atmCr c-axisCr ab-planeO c-axisO ab-plane
(c)
Figure 9: Anisotropic ratio of diffusion of Cr and O at vacuum/oxide interface at O2 partial pressures of a) 1 atm, b) 1 × 10⁻⁸ atm, c) 1 × 10⁻¹⁴
atm.
12
![arXiv:1509.04713v1 [cond-mat.mes-hall] 15 Sep 2015qpt.physics.harvard.edu/p288.pdfof the Joule heat generated in graphene escapes via di-rect di usion to the contacts (SM). As temperature](https://img.pdfslide.us/doc/110x75/5e5127c8daa6496de87876ac/arxiv150904713v1-cond-matmes-hall-15-sep-of-the-joule-heat-generated-in-graphene.jpg)
![arXiv:1603.07515v1 [math.NA] 24 Mar 2016 - CCIMI · 2016. 6. 2. · marching schemes, nonlinear di usion lters such as the Perona-Malik model (cf. [33]) and many variants thereof,](https://img.pdfslide.us/doc/110x75/60f507c7abadde521437f178/arxiv160307515v1-mathna-24-mar-2016-ccimi-2016-6-2-marching-schemes.jpg)

![Baltimore, MD, USA Department of Electrical and …arXiv:1601.04115v2 [cs.CV] 16 May 2016 1. Introduction By capturing both the magnitude and the anisotropy of water di usion, di usion](https://img.pdfslide.us/doc/110x75/5f9721af8c9f6a5508232812/baltimore-md-usa-department-of-electrical-and-arxiv160104115v2-cscv-16-may.jpg)


![Abstract arXiv:1210.5268v4 [cs.CL] 24 Nov 2014 · Di usion of Lexical Change in Social Media Jacob Eisenstein1;, Brendan O’Connor2, Noah A ... [10,20,21], voting in political elections](https://img.pdfslide.us/doc/110x75/5f753b4f70096a0bc9145e33/abstract-arxiv12105268v4-cscl-24-nov-2014-di-usion-of-lexical-change-in-social.jpg)

![arXiv:1206.0720v2 [math.PR] 7 Dec 2014Noname manuscript No. (will be inserted by the editor) A Queueing Model with Independent Arrivals, and its Fluid and Di usion Limits Harsha Honnappa](https://img.pdfslide.us/doc/110x75/5f2d7c12bd24cd3e3957c168/arxiv12060720v2-mathpr-7-dec-2014-noname-manuscript-no-will-be-inserted-by.jpg)
![arXiv:2012.07591v1 [math.NA] 14 Dec 2020 · rubbers. The presented modelling approach recovers experimental ndings related to the di usion of cyclo-hexane and the resulting swelling](https://img.pdfslide.us/doc/110x75/60b1289b10c4a73ead7b7d11/arxiv201207591v1-mathna-14-dec-2020-rubbers-the-presented-modelling-approach.jpg)
![Abstract. Key words. arXiv:1510.08938v2 [math.DS] 10 … usion model organized by the winged-cusp singularity and with (spatio-temporal) adaptation variables wand z. The fundamental](https://img.pdfslide.us/doc/110x75/5b02d10f7f8b9a3c378b459f/abstract-key-words-arxiv151008938v2-mathds-10-usion-model-organized-by.jpg)
![arXiv:2009.07977v1 [cond-mat.soft] 16 Sep 2020 · 2020. 9. 18. · PFT power functional theory PNP Poisson-Nernst-Planck RDDFT reaction-di usion density functional theory TDDFT time-dependent](https://img.pdfslide.us/doc/110x75/60896fabdb12f30375327392/arxiv200907977v1-cond-matsoft-16-sep-2020-2020-9-18-pft-power-functional.jpg)


![cr dist fit2 - arXiv · 2018. 9. 20. · arXiv:1604.05070v1 [cs.DL] 18 Apr 2016 Annual Journal citationindices: a comparative study Abdul Khaleque,1,∗ Arnab Chatterjee,2,† and](https://img.pdfslide.us/doc/110x75/602a99370a91cd43b83a31c1/cr-dist-fit2-arxiv-2018-9-20-arxiv160405070v1-csdl-18-apr-2016-annual.jpg)