Embed Size (px)
Citation preview

Using Word Frequency Lists to Measure Corpus Homogeneity and Similarity between Corpora.
Adam Kilgarriff Information Technology Research Institute
University of Brighton Lewes Road, Brighton BN2 4JG, UK
email: Adam.Kilgarriff@i~ri.bton. ac.uk
Abstract
How similar are two corpora? A measure of corpus similarity would be very useful for lexicography and language engineering. Word frequency lists are cheap and easy to generate so a measure based on them would be of use as a quick guide in many circumstances; for example, to judge how a newly available corpus related to existing resources, or how easy it might be to port an NLP system designed to work with one text type to work with another. We show that corpus similarity can only be interpreted in the light of corpus homogeneity. The paper presents a measure, based on the XX 2 statistic, for measuring both corpus similarity and corpus homogeneity. The measure is compared with a rank-based measure and shown to outperform it. Some results are presented. A method for evaluating the accuracy of the measure is introduced and some results of using the measure are presented.
1 Introduction
How similar are two corpora? The question arises on many occasions. Does it matter whether lexicographers use this corpora or that, or are they similar enough for it to make no difference? (The original impetus for the research was the question, "are the fiction and jourDali~m parts of the Longman Lancaster Corpus and British National Corpus I (BNC) interchangeable? x) In NLP, many useful results can be generated from corpora, but when can the results developed using one corpus be applied to another? There are also questions of more general interest. Looking at British national newspapers: is the Independent more like the Guardian or the Telegraph? There are many ways in which the question could be addressed, but the one we take here is to take texts from each newspaper and compare the frequencies of words used. Given an accurately part-of-speech-tagged or parsed corpus, the same method could be applied to frequency lists of parts-of-speech or syntactic constructions, and the methodological part of the paper would still be salient. Section 2 presents the case for using word frequencies.
How homogeneous is a corpus? The question is both of interest in its own right, and is a preUminary to any quantitative approach to corpus similarity. It is of interest in its own right, because a sublanguage corpus, or one containing only a specific language variety, has very different characteristics to a general corpus (Biber, 1993), yet it is not obvious how a corpus's position on this scale can be assessed. I t is of interest as a preliminary to a measure of corpus similarity, because it is not clear what a measure of similarity would mean if a homogeneous corpus was
1 See hi;up: l / l o g o , o z . a c . a k / b n c
231
!
being compared with a heterogeneous one. For the statistical language mode11ing community, the preferred approach to assessing homogeneity is by calculating perplexity, and the approach can be extendlng to measuring similarity by calculating cross-entropy (Charniak, 1993). In section 6 compare these methods with the approach developed here.
In this paper we present a method for measuring both corpus similarity and corpus homo- geneity. In brief, the method (for the homogeneity case) is as follows:
• Divide the corpus into two halves by randomly placing texts in one of two subcorpora;
• Produce a word frequency list for each subcorpus;
• Calculate the X 2 statistic for the rtifference between the two subcorpora;
• Normalise;
• Iterate. (to give different random halves);
• Interpret result by comparing values for different corpora.
The only difPerences for the corpus-similarity case are that (1) one subcorpus is taken from the first corpus and the other from the second, and (2) the similarity value is to be interpreted by reference to the homogeneity measure for each corpus.
After arguing the the case for using word frequency lists and describing related work, the paper describes the various pitfalls the measure must avoid and presents some first results.
I I I I I I I I
2 Why word frequency lists?
Are word frequency lists interesting? Many think not. There are two recurring themes amongst the noes. Firstly, what is hnportant about texts is their me~ing . Since the message is thrown out m when a text is reduced to a frequency list, the heart of the text is jettisoned. This arg-ment comes i from all quarters: the second comes mainly from linguists. It is that, if we are to count, the objects we should be counting are ones with a linguistic pedigree. In relation to content, we should be n counting word senses, or lexical units, since any list will be compromised if money bank and river | bank are counted together. In relation to form, we should be counting grammatical constructions: nnmbers of relative clauses or passives tell us far more about the linguistic character of a text than numbers of o c c u r r e n c e s of toho or which. I
' l ~ i u g the general argument first, firstly, a text without its context is itself an abstraction. w
A transcript of a conversation is a more concise version than an audio tape (which is itself more m concise than a video tape). A newspaper article is understood more fully if the reader is well- • versed in the political or other circumstances of its publication. There is not a complete break m
between texts, which present meaning, and frequency lists, which do not. e l Secondly, our concern is with language corpora, not with texts. While a text may be coherent I
in its me~uing, a corpus comprising multiple texts can scarcely be. The objective in gathering multiple-text corpora is to identify a linguistic object in which the individual meanings of texts m are taken out of focus, to be replaced by the character of the whole. I
Thirdly, as will be evident too all workers in corpus-based computational linguistics, frequency lists are very useful representations of meaning for information retrieval, text categorisation, and IIg numerous other purposes. They are useful because they are a representation of the text which is I susceptible to automatic, objective manipulation. The full text is very rich in information, but
I 232 i
m
I I I I I I I I I
)1 I I I I I I
that information cannot be readily used to make, e.g., similarity judgements. When a text or corpus is represented as a frequency list, much information is lost, but the tradeoff is an object that is susceptible to statistical processing.
To move on to the concerns regarding what is counted: in exploring word frequency lists we are also investigating a hypothesis. Sinclair has postulated
Every distinct sense of a word is associated with a distinction in form 2
We take this one step further and postulate "no linguistic distinction without a word frequency distinction'; any dii~erence in the linguistic character of two corpora will leave its trace in a di~erence between their word frequency lists. It may not be evident which words will be more frequent, and which less, if one corpus uses more relative clauses and less passives than another, on this hypothesis, some will be.
An advantage of using word frequency lists is that there is so much data: two corpora can be compared in respect of thousands of data points (e.g., words). Although money bar& and river bank are counted together, corpora using the one and corpora using the other will tend to be discriminated because the one corpus will use money, account and Barclays more, the other, river and grassy. It is a research question to determine which words' frequencies vary for a given variation in linguistic structures (see the section on newspapers for an indication of how this can proceed). For current purposes, we can happily pool the data, referring only to individual words when we seek further insight into why we get the results we do. Biber's work (see below) shows how quantitative methods can be used to discover and capture register differences, and some of the objects he counts are words (others being gr~mm~ical constructions), so his work provides some grounds for optimism.
The hypothesis would of course be a very useful, if true. Words are far easier to count accu- rately than syntactic categories or word senses. To count syntactic categories requires linguistic theory to identify precisely what the syntactic category is; empirical research to identify the features that indicate where it is present; and a computer program, to automatically identify occurrences. The first two stages are likely to introduce theoretical disagreements, and the last two, errors. The prospects for two independent teams arriving at the same syntactic-construction frequency list for the same corpus are slim. By contrast, if agreement is reached on a few tokenisa- tion issues (hyphens, clitics), the chances of two groups arriving at identical word frequency lists is very good. 3 The rule that any string of alphanumerics surrounded by whitespace or punctuation is a word may have its shortcomings, but it makes word-counting very reliable.
Word frequency lists axe cheap and easy to generate, so a measure of corpus similarity based on them would be of use as a quick guide in many circumstances where a more extensive analysis of the two corpora was not viable; for example, to judge how a newly available corpus related to existing resources, so a decision about buying it or installing it could be made, or as a prelhninary assessment of how much customisation was likely to be necessary to port an NLP application from one domain (and corpus) to another.
3 Related Work
The only other piece of work the author has found which aims to measure similarity between corpora is (Joh~n~son and Hofland, 1989). Their goal is to find which genres, within the LOB
2Cited in (Moon, 1987, p 89) SAt least for languages sharing certain typographical conventions, e.g., not Chinese or Japanese.
233
corpus, most resemble each other. They take the 89 most common words in the corpus, find their rank within each genre, and calculate a Spearman rank correlation statistic. This method is compared empirically with the X 2 method in some detail in section 6 below.
There is a large body of work aiming to find words which are particularly characteristic of one text, or corpus, in contrast to another. 4 This includes work on linguistic variation, author identification (Mosteller and Wallace, 1964) and information retrieval (Salton, 1989). (Dunning, 1993) and (Pedersen, 1996) shows how some of the methods which have been used in the past (particularly mutual information scores) are invalid for rare events, and introduce accurate mea- sures of how 'surprising' rare events are. (Church and Gale, 1995a) show how Inverse Document Frequency, a measure based on the proportion of documents a word occurs in, can be used along- side word frequency to estimate how distinctive a word is of the texts it occurs in. (Church and Gale, 1995b) extend this work, showing how to model word ~equency distributions in a manner consistent with the fact that some words are evenly spread, while others tend to occur often in documents where they occur at all. As most of this work ~im~ to find good indexing terms for information retrieval, it is mostly concerned with middle-to-low frequency items, and differences in topic rather than differences in register.
There is a growing body of work which explores and quantifies the differences between corpora. Pre-eminent in this field is Biber (Biber, 1988; Biber, 1995), in whose studies the objective is to identify the major dimensions of linguistic variation across languages, and to identify the linguistic and functional characteristics which co-occur in the different registers of a language. His method involves counting a range of linguistic features in each text, and then using factor analysis to determine which of the features co-occur. Co-occurring features are then grouped together to give the dimensions of variation, and the texts (or corpora) of di~erent registers can be identified by their location with respect to these dimensions.
A recent paper by (Sekine, 1997) explores the domain dependence of parsing. He parses corpora of various text genres, identifies the subtrees of depth 1 in each corpus, and counts the number of occurrences of each subtree. This gives him a subtree frequency list for each corpus, and he is then able to investigate which subtree are markedly different in frequency between corpora. Such work is highly salient for customizing parsers for particular domains. In the current context, Sekine's subtree frequency lists can readily be compared with word frequency lists to determine which lists are better for measuring corpus similarity and homogeneity.
Within the literature on statistical language mode]llng, there is much discussion of related questions. From an information-theoretic point of view, the theoretical answer to the problem is simple: entropy is a measure of a corpus's homogeneity, and the cross-entropy between two corpora quantifies their similarity. Entropy is not a quantity that can be directly measured. The standard problem for statistical language modelling is to aim to find the model for which the 'cross-entropy' of the model for the corpus is as low as possible. For a perfect language model, the cross-entropy would be the entropy of the corpus (Church and Mercer, 1993; Charniak, 1993). The potential for using information-theoretic constructs to measure corpus similarity is a topic for current research. The Known Similarity Corpora evaluation methodology presented in Section 6 will be applicable to the issue of assessing how well cross-entropy captures pre-theoretical notions of corpus similarity and homogeneity.
4For a fuller review, see (Kilgarriff, 1996)
I I I I I I I I- I I I I I I I I I I
234 I

I I 4 Corpus homogeneity
I I i I
A corpus is a collection of texts. The definition only serves to Show how heterogeneous a collection of objects the word denotes. One may contain hundreds of words, another, hundreds of millions. One may include a very small number of texts, with a one-text corpus as the limiting case; another may contain thousands of texts, s
These factozs present problems for a measure of corpus similarity. It is not clear what, if anything, a measure of the similarity of a thousand-word corpus and a million-word corpus, or a one-text corpus and a thousand-text corpus, would mean. Also, most contain some texts that are much bigger than others. Thus, in the BNC, the shortest file (which approximates to a 'text') contains 25 words, and the longest, a hundred thousand times that many. Two corpora of the same size and the same number of texts may still have a very different shape, if, in one, one of the texts accounts for most of the corpus, whereas in the other, they are all of similar size.
Like a corpus, a text can be large or small, heterogeneous or Imlform. A corpus can contain complete texts or sampled texts, as in the Brown corpus.
How homogeneous is a corpus? The first point to make is that there is no obvious way to approach the question. It is clear that the British National Corpus is less homogeneous than a corpus of software manuals, but it is not clear how to measure the difference. The second is that it is very similar to the question, "how similar are two corpora?" Our approach to measuring homogeneity is to randomly divide a corpus into two random halves and measure the similarity of the two halves, thus emphasising the relation between the two questions. The third point is that it is a pre-requisite to a measure of corpus similarity. A judgement of similarity rnns the risk of meaninglessness if a homogeneous corpus is compared with a heterogeneous one.
Our method provides figures which can be directly compared for corpus homo(/hetero)geneity and for corpus (dis)similarity. (High scores correspond to heterogeneous corpora and dissimilar corpora) The possible outcomes, for various permutations of the scores for homogeneity of corpus 1 (corpl), homogeneity of corpus 2 (corp2), and corpus dissimilarity (dis), are presented in Table 1.
corpl corp2 equal equal equal equal much higher high low high
dis Comment ' equal same language variety/ies
high low higher
high high low high high a bit higher low low a bit higher
, -
different language varieties corp2 is homogeneous and falls within the range of 'general' corpl corp2 is homogeneous and falls outside the range of 'general' corpl impossible overlapping; share some varieties similar varieties
Table 1: Interactions between homogeneity and similarity: a similarity measure can only be interpreted with respect to homogeneity.
The last two lines in the table point to the differences between general corpora and specific corpora. High scores for heterogeneity will be for general corpora, which embrace a number of language varieties. Corpus similarity between general corpora will be a matter of whether
5A corpus may contain texts in di~erent languages: here, we only consider corpora which are essentially all in the same language.
235

all the same language varieties are represented in each corpus, and in what proportions. Low heterogeneity scores will typically relate to corpora of a single language variety, so here, similarity scores may be interpreted as a measure of the distance between the two varieties.
From the point of view of measuring corpus homogeneity or similarity, it is desirable to use a method which m~r6mi.qes the significance of the division of a corpus into texts. 'Text' and 'doc- ument' are problematic constructs: any corpus-building project has to make a range of practical decisions about what is to be considered a text, determining, for example, whether all the poems in a book of poetry count as one text, and how newspapers are going to be divided.S The one point at which our method uses the division into texts is in identifying the ch, mk.q of the corpus to be randomly placed in a subcorpus. Any subdivisions of the corpus which tended to keep contiguous material together and which gave an appropriate n,,mber of chunks (say, between 20 and 200), all of approxlmately the same size, would be satisfactory. One possibility is to treat a corpus as a single text, with chunks specified as "first 5,000 words", "next 5,000 words", etc., the strategy adopted in the experiments described below.
5
At a Krst pass, it would appear that the chi-square test will serve to indicate whether two corpora are drawn from the same population, or whether two or more phenomena are signi~cantly fli~erent in their distributions between two corpora. For a contingency table of dimensions m x n, if the null hypothesis is true, the statistic
- E) 2
E
(where 0 is the observed value, E is the expected value calculated on the basis of the joint corpus, and the sum is over the cells of the contingency table) will be M-distributed with (rn - 1) x (n - 1) degrees of freedom. T
(HoR~nd and Joh~.n~son, 1982) use the test to identify where words are signi6cantly more frequent in the LOB corpus (of British English) than in the Brown corpus (of American English). In the table where they make the comparison, the X2-value for each word is given, with the value marked 1, 2 or 3 if it exceeds the critical value of the statistic at any of three different significant levels, so one might infer that the LOB-Brown diITerence was non-random.
Looking at the LOB-Brown comparison, we find that very many words, including most very common words, are marked. Much of the time, the null hypothesis is defeated. Does this show that all those words have systematically different patterns of usage in British and American English?
To test this, we took two corpora which were indisputably of the same language type: each was a random subset of the BNC. The sampling was as follows: all texts shorter than 20,000 words were excluded and all others were truncated at 20,000 words. The truncated texts were randomly assigned to either corpus 1 or corpus 2, and frequency lists for each corpus were generated.
As in the LOB-Brown comparison, for very many words, including most common words, the null hypothesis was defeated. This reveals a bald, obvious fact about language. Words are not selected at random. There is no a pr/ori reason to expect them to behave as if they had been,
SThe appropriate theoretical response, as taken in the Text Encoding Initiative, is that texts are hierarchically structured, so 'same text' does not have a unique interpretation.
VProvided all expected values are over a threshold of 5. Where there is just one degree of freedom, Yates' correction is applied.
236
I
I
I
I
I
I !
!
I
I I i I I i I I I t

and indeed they do not. The LOB-Brown differences cp-nuot in general be interpreted as British- American differences: it is in the nature of language that any two collections of texts covering a range of registers (and comprising,-say, less than a thousand samples of over a thousand words each) will show such differences. While it might seem plausible that oddities would in some way balance out to give a population that was indistinguishable from one where the individual words (as opposed to the individual texts) had been randomly selected, this turns out not to be the c a s e .
Let us look closer at why this occurs. A key word in the last paragraph is 'indistinguishable'. The null hypothesis we are testing is that both frequency lists were the outcome of random selections from the s~me source. Since words in a text are not random, we know that our corpora are not randomly generated. The only question, then, is whether there is enough evidence to say that they are not, with confidence. In general, where a word is more common, there is more evidence. This is why a higher proportion of common words than of rare ones defeat the null hypothesis. As one statistics textbook puts it:
None of the null hypotheses we have considered with respect to goodness of fit can be ezactl~/true, so if we increase the sample size (and hence the value of X 2) we would ultimately reach the point when all null hypotheses would be rejected. All that the X 2 test can tell us, then, is that the sample size is too small to reject the null hypothesis! (Owen and Jones, 1977, p 359)
For large corpora and common words, the sample size is no longer too small. On the null hy- pothesis, the expected value for the (O-E)2/E term would be 0.5 s and would not vary with word frequency. Table 2 shows that this term tends to be substantially higher than 0.5 and increases with word frequency.
FClass First word Mean error term II [ (Words in freq. order) in class for items in class
First 20 items Next 20 items Next 40 items Next 80 items Next 160 items Next 320 items Next 640 items Next 1280 items Next 2560 items Next 5120 items Next 10240 items Next 20480 items
the are been first little level front fast precisely extract discontent four-year-old
55.1 47.7 25.6 29.8 17.3 12.8 12.5 13.7 13.9 12.5 8.0 4.7
Table 2: Variation of (O-E)2/E term with word frequency for same-variety corpora. The table was generated from a list, ordered by frequency, giving the term's value for each word. The first line of the table then states that the average of these values, for the first 20 items on the list (the first of which was the) was 55.1.
SO.5 rather than 1 because there are two cells in the contingency table for each degree of freedom.
237

5.1 X 2 w i t h o u t t h e n u l l h y p o t h e s i s
We cannot use the X 2 statistic for testing the null hypothesis, but nonetheless it does come close to meeting our requirements. The (O-E)2/E term gives a measure of the difference in a word's frequency between two corpora, and, while the measure tends to increase with word frequency, it does not increase by orders of magnitude. The strategy we adopt is therefore to calculate X 2 for (sub)corpus pairs, and then to use this as the measure of corpus similarity and homogeneity. The score is then norma]ised by the nnrober of words used for the comparison (equivalent to the numbers of degrees of freedom) to give a measure we shall call CBDF (Chi By Degrees of Freedom).
The question arises, wiMch words, and how many, should be used in the comparison. Since the error-term tends to increase with frequency, CBDF scores for will only be comparable if words of the same span of frequencies are used in the comparisons. We simply used the N most frequent words in the union of the two corpora to be compared. The experiments below explore different values for N.
5 .2 N o r m a l i s a t i o n
At a first pass, a measure of corpus homogeneity or similarity should be able to compare corpora of different sizes. As we have seen, for all but purely random populations, (O-E)2/E tends to increase with frequency. Where corpora are larger, words will tend to be more frequent, so, for the same level of corpus similarity or homogeneity and the same number of degrees of freedom, X ~ will be larger. There is also a theoretical problem: it is not clear what it means to say that corpora of different sizes are equally homogeneous. If corpus 1 is twice as large as corpus 2, do we call them 'equally homogeneous' if corpus i contains twice as many language varieties as corpus 2, or the same number of language varieties but twice as much of each? Is a corpus as homogeneous as a subcorpus we produce from it which contains a randomly selected half of its texts, or is it as homogeneous as one that contains half of each of its texts? It is not obvious, and I am currently investigating the question further. The experiemtus described below all use same-size corpora.
6 Eva luat ion
To invent a measure is easy. To determine that it is a good measure is more di61cult. In this section, I first present some results suggesting the face validity of the measure. Then I present a method for evaluating the measure, and describe some experiments in which a X 2 test and a Spearman Rank Correlation test are compared.
As a rn ln l rn~] requirement, a measure is good fl i t confirms our subjective judgements regarding corpus similarity. If it is evident to experts that corpus A is more like corpus B than corpus C, then the measure is invalidated if it does not confirm that A and B are more similar than A and C. So that this style of comparison can be made, I compared 200,000-word corpora from each of the language sources shown in Table 3. (All were extracted from the BNC.) The results are presented in Table 4.
To move beyond such purely qualitative evaluation, I use sets of 'Known-Similarity Corpora' (KSC). Each corpus within a set comprises text of two types, in varying fractions, as illustrated in Table 5.
We can now say that Corpusl and Corpus2 are more similar than Corpusl and Corpus3; Corpus3 and Corpus4 are more similar than Corpus2 and Corpus5; and a number of other such
238

Short GUA IND DMI NME FAC ACC DNB HAN BMJ GRA
Title Description The Guardian The Independent Daily Mirror New Musical Express The Face Accountancy Dictionary of National Biography H~+~ard British Medical Journal Computergram
Broadsheet national newspaper Broadsheet national newspaper Tabloid national newspaper Weekly pop/rock music magazine Weekly fashion magazine Accountancy periodical Comprises short biographies Proceedings of Parliament Academic papers on medicine Electronic computer-trade newsletter
Table 3: Corpora for first experiment.
ACC ART BMJ DMI DNB ENV FAC GRA GUA HAN IND NME
i
I
ACC ART BMJ DMI DNB ENV FAC GRA GUA HAN IND NME
4.62 21.40 3.38 20.16 23.50 8.08 21.56 26.19 32.08 2.47 40.56 30.07 40.14 35.15 22.68 23.10 28.12 34.65 20.49 25.14 31.14 7.76 27.75 29.96 33.50 31.40 14.06 18.37 22.68 11.41 24.13 33.76 33.00 32.14 12.76 17.83 22.96 13.96 21.18 25.99 30.05 9.77
1.86 41.50 2.60 36.92 36.93 3.43 45.26 28.96 34.35 31.06 23.24 12.04 52.25 32.03 31.23 30.10 21.69 14.45 39.41 34.77 5.84
2.20 32.25 3.92 36.21 22.62 28.06 4.11 31.39 15.09
3.65 23.27 4.44 33.25 16.56 3.10
Table 4: CBDF homogeneity and similarity scores for twelve 200,000-word corpora.
Corpusl Corpus2 Corpus3 Corpus4 Corpus5 Corpus6
100% GUA 80% GUA 60% GUA 40% GUA 20% GUA
0% GUA
0% BMJ 20% BMJ 40% BMJ 60% BMJ 80% BMJ
100% BMJ
Table 5: Example of Known-Similarity Corpora set.
239

judgements. In fact, for this set, 55 such judgements can be made. The number of such judge- ments, for a KSC set of n corpora, is
n ( i ( i + 1 ) ) ~ ( n --i) 1 i----1 2
A proposed metric ca~a now be scored. An ideal metric would make the 'correct' judgement in all 55 cases. Two metrics can be compared by seeing which makes the correct judgement more of the time.
There are some difBculties with the method. Firstly, as mentioned above, there are different ways in which corpora can be different. They can be different because they each represents one language variety, and these varieties are different, or they can be different because they contain different mixes of the same varieties. Clearly, this method only addresses the latter, and ideally this approach to evaluation is paired with one where the focus is on subjective judgements of how similar distinct language varieties are. 9
Secondly, if the corpora are small and the difference in proportions between the corpora is also small, it is not clear that all the 'gold standard' assertions are in fact true. There may be a medical supplement in one of the copies of the Guardian in the corpus, and one of the copies of the BMJ may focus on social issues in medicine: perhaps, then, Corpus3 is more like Corpus5 than Corpus4.
To address this, the two language varieties in each KSC set were selected to be quite distinct from each other. The procedure was as follows. For each of the 33 texts sources represented by over 200,000 words in the BNC, the first 200,000 words were taken, homogeneity was calculated, and similarity between all pairs was calculated. (The results in Table 4 show some of the results.) Using these similarity scores, the corpora were clustered. This showed that there was in fact only one major cluster, with the broadsheet newspapers at its centre. Broadsheet newspapers were used as one of the language varieties for each of the KSC sets; the other varieties were chosen on the basis of (1) quantity of text (over 380,000 words were needed to construct the KSC sets), (2) ideally, it was neither too homogeneous (as that would tend to make the task too easy) nor too heterogeneous (as then it would not be clear whether the gold standard was true), and (3) it was not too similar to 'broadsheet newspaper' (again, it would not be clear whether the gold standard was true). This last constraint could be interpreted as meaning that I did not make the task too difficult: this was an unavoidable by-product of ensuring the validity of the gold standard. It is not pernicious since the technique is only to be used to compare one corpus-s~m~larity statistic with another.
The first three KSC sets contained, in addition to broadsheet-newspaper (for which I used a combination of Guardian and Independent material, hereafter 'ballast'), the sources in Table 6. The sets were constructed as in ratios of 5:0, 4:1, 3:2, 2:3, 1:4 and 0:5, with each corpus comprising 200,000 words.
I then computed corpus similarity. I used both X 2 and Spearman l ~ n k Correlation (hereafter spearman). As, for evaluation purposes, I was concerned only with similarity measures and gold standard statements did not relate to homogeneity scores, I used whole-corpus frequencies rather than repeatedly taking different random halves of each corpus and averaging results.
This test turned out to be easy. Provided more than ten words were used as data points, both statistics gave 100% correct answers.
9UCltEL, the Unit for Computer R~earch into Language at the Lancaster University currently has a grant proposal for gathering data about human judgements of slm~larity between text genres.
I !
I 1 ! !
1 i|, ! i ! ! !
i I ! I
240
i i ! i ! |
I | l
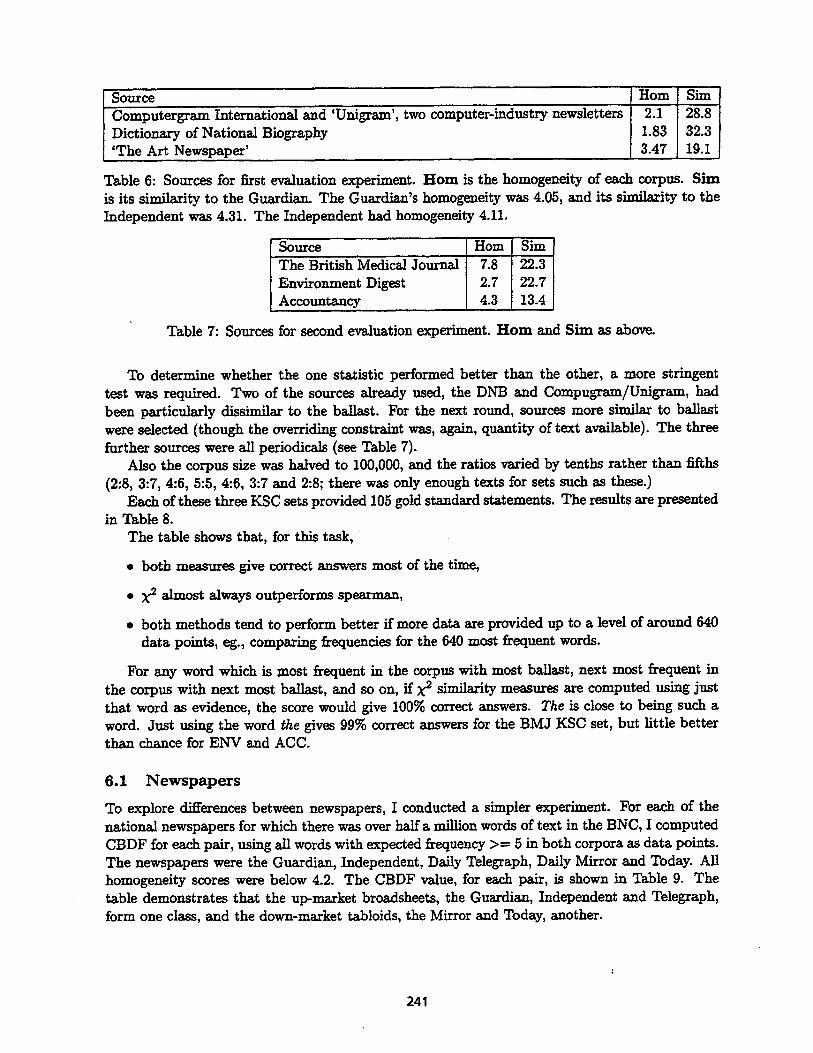
Source Horn Sire "Computergr_~m International and 'Unigrum', two computer-industry newsletters 2.1 28.8 Dictionary of National Biography 1.83 32.3 'The Art Newspaper' 3.47 19.1
Table 6: Sources for first evaluation experiment. Horn is the homogeneity of each corpus. Sire is its similarity to the Guardian. The Guardian's homogeneity was 4.05, and its s~ml]u~-ity to the Independent was 4.31. The Independent had homogeneity 4.11.
Source Horn Sire The British Medical Journal 7.8 22.3 Environment Digest 2.7 22.7 Accountancy 4.3 13.4
Table 7: Sources for second evaluation experiment. H o m and S im as above.
To determine whether the one statistic performed better than the other, a more stringent test was required. Two of the sources already used, the DNB and Compugram/Unigr~m, had been particularly dissimilar to the ballast. For the next round, sources more siml]ur to ballast were selected (though the overriding censtr_~int was, again, quantity of text available). The three further sources were all periodicals (see Table 7).
Also the corpus size was halved to 100,000, and the ratios varied by tenths rather than fifths (2:8, 3:7, 4:6, 5:5, 4:6, 3:7 and 2:8; there was only enough texts for sets such as these.)
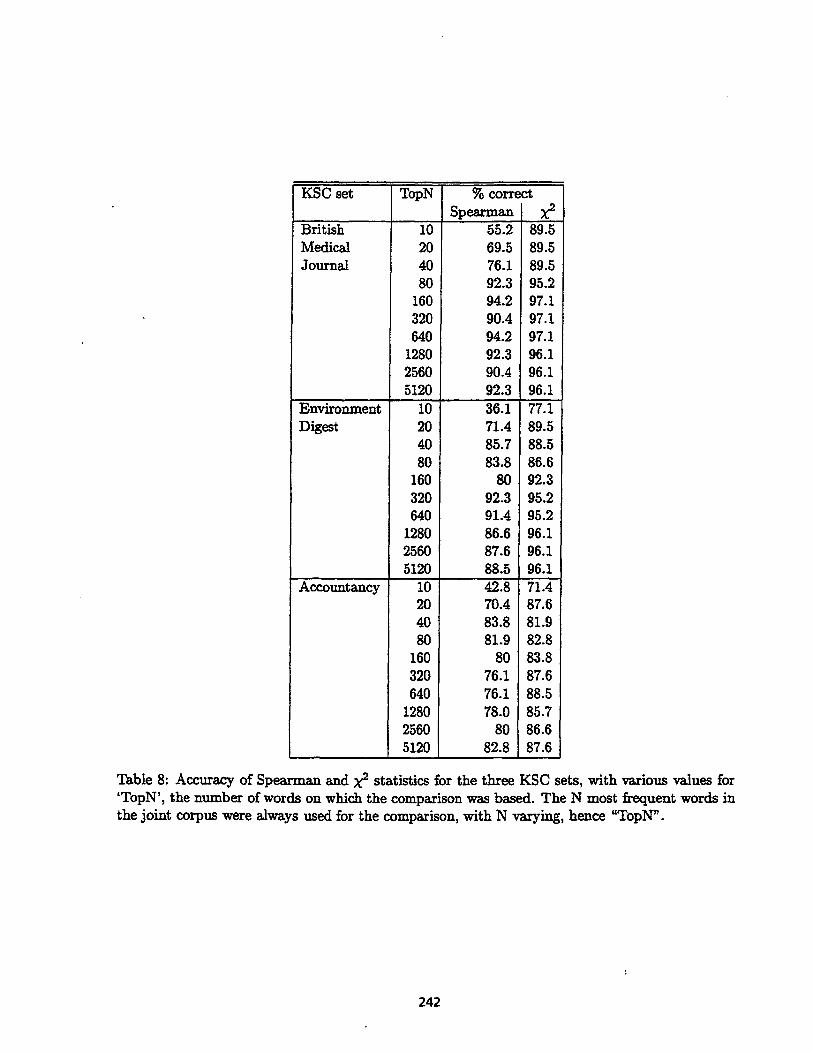
Each of these three KSC sets provided 105 gold standard statements. The results are presented in Table 8.
The table shows that, for this task,
• both measures give correct ~n~wers most of the time,
• X 2 ~]most always outperforms spearman,
• both methods tend to perform better if more data are provided up to a level of around 640 data points, eg., comparing frequencies for the 640 most frequent words.
For any word which is most frequent in the corpus with most ballast, next most frequent in the corpus with next most ballast, and so on, if X p sirni]~L"ity measures are computed using just that word as evidence, the score would give 100% correct answers. The is close to being such a word. Just using the word the gives 99% correct un~wers for the BMJ KSC set, but little better than r hu~ce for ENV and ACC.
6.1 N e w s p a p e r s
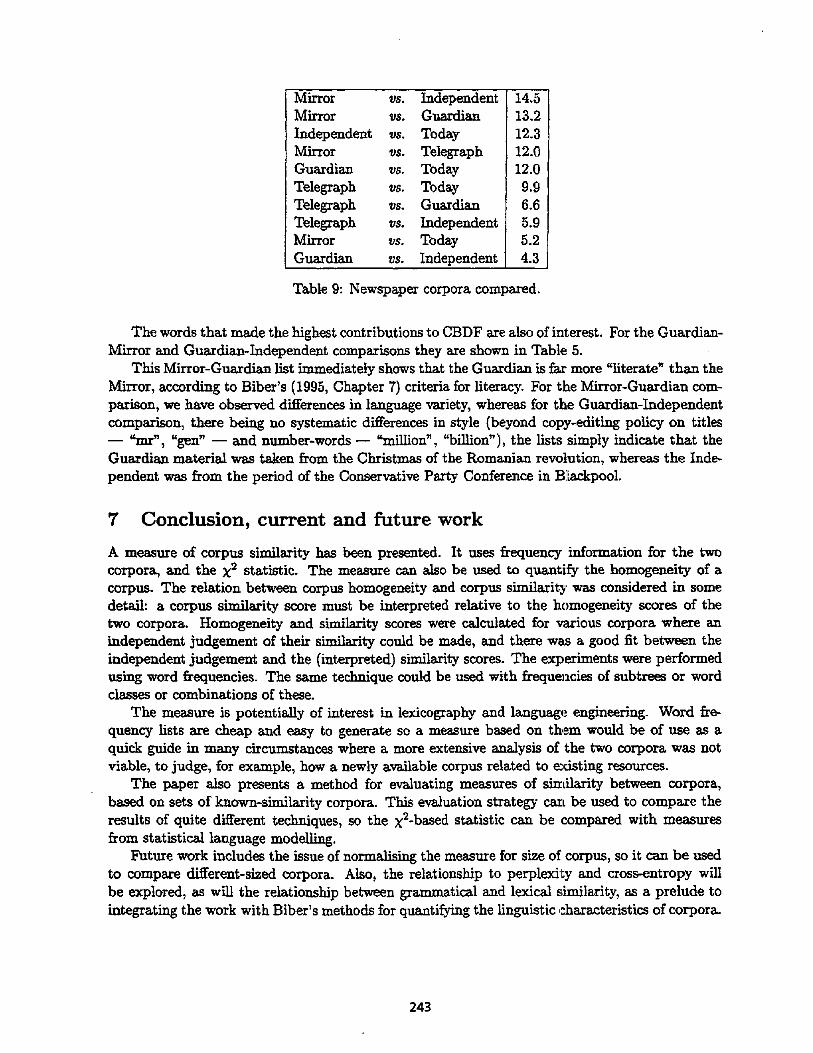
To explore differences between newspapers, I conducted a simple r experiment. For each of the national newspapers for which there was over half a million words of text in the BNC, I computed CBDF for each pair, using all words with expected frequency >-- 5 in both corpora as data points. The newspapers were the Guardian, Independent, Daily Telegraph, Daily Mirror and Today. All homogeneity scores were below 4.2. The CBDF value, for each pair, is shown in Table 9. The table demonstrates that the up-market broadsheets, the Guardian, Independent and Telegraph, form one class, and the down-market tabloids, the Mirror and Today, another.
241
KSC set TopN % correct Spearman I X~.
i0 55.2 89.5 20 69.5 89.5 40 76.1 89.5 80 92.3 95.2
160 94.2 97.1 320 90.4 97.1 640 94.2 97.1
1280 92.3 96.1 2560 90.4 96.1 5120 92.3 96.1
10 36.1 77.1 20 71.4 89.5 40 85.7 88.5 80 83.8 86.6
160 80 92.3 320 92.3 95.2 640 91.4 95.2
1280 86.6 96.1 2560 87.6 96.1 5120 88.5 96.1
10 42.8 71.4 20 70.4 87.6 40 83.8 81.9 80 81.9 82.8
160 80 83.8 320 76.1 87.6 640 76.1 88.5
1280 78.0 85.7 2560 80 86.6 5120 82.8 187.6
British Medical Journal
Environment Digest
Accountancy
Table 8: Accuracy of Spearman and X 2 statistics for the three KSC sets, with various values for 'TopN', the n11mber of words on which the comparison was based. The N most frequent words in the joint corpus were always used for the comparison, with N varying, hence ~J~opN'.
242
1 /
t I1 I
t
I Ii I 1
!
Mirror vs. Independent lZl.5 Mirror vs. Guardian Independent vs. Today Mirror vs. Telegraph Guardian vs. Today Telegraph vs. Today Telegraph vs. Guardian Telegraph vs. Independent Mirror vs. Today Guardian vs. Independent
13.2 12.3 12.0 12.0 9.9 6.6 5.9 5.2 4.3
Table 9: Newspaper corpora compared.
The words that made the highest contributions to CBDF are also of interest. For the Guardian- Mirror and Guardian-lndependent comparisons they are shown in Table 5.
This Mirror-Guardian list immediately shows that the Guardian is far more "literate" than the Mirror, according to Biber's (1995, Chapter 7) criteria for literacy. For the Mirror-Guardian com- parison, we have observed differences in language variety, whereas for the Guardian-Independent comparison, there being no systematic differences in style (beyond copy-editing policy on titles -- "m.r", "gen" ~ and number-words -- "million ", "billion"), the lists simply indicate that the Guardian material was taken from the Christmas of the Romanian revolution, whereas the Inde- pendent was from the period of the Conservative Party Conference in B]Lackpool.
7 Conclusion, current and future work
A measure of corpus similarity has been presented. It uses frequency information for the two corpora, and the X 2 statistic. The measure can also be used to quantify the homogeneity of a corpus. The relation between corpus homogeneity and corpus shnilarity was considered in some detail: a corpus similarity score must be interpreted relative to the homogeneity scores of the two corpora. Homogeneity and similarity scores were calculated for various corpora where an independent judgement of their similarity could be made, and there was a good fit between the independent judgement and the (interpreted) similarity scores. The experiments were performed using word frequencies. The same technique could be used with freque~Icies of subtrees or word classes or combinations of these.
The measure is potentially of interest in lexicography and language engineering. Word fre- quency lists are cheap and easy to generate so a measure based on them would be of use as a quick guide in many circ,lm~tances where a more extensive analysis of the two corpora was not viable, to judge, for example, how a newly available corpus related to existing resources.
The paper also presents a method for evaluating measures of shzdlarity between corpora, based on sets of known-similarity corpora. This evaluation strategy can be used to compare the results of quite different techniques, so the x2-based statistic can be ,compared with measures from statistical language modelling.
Future work includes the issue of normalising the measure for size of corpus, so it can be used to compare different-sized corpora. Also, the relationship to perplexity and cross-entropy will be explored, as will the relationship between grammatical and lexical similarity, as a prelude to integrating the work with Biber's methods for quantifying the linguistic characteristics of corpora.
243

Mirror Guardian WORD POS ~ WORD POS • PRON DET" l ON she PRON n't NOT he PRON 's V
her DET his DET we PRON ' re vhb you PRON mirror PN her PRON boss N my dps him PRON star N after PREP me PRON was V your DET 'm V said V major PN away PART mnm N night N a DET tv N just ADV fergie PN
Guardian Independent WORD POS WORD POS
the mr PN of PREP million NUMBER mr PN christmas PN its DET bill N which REL page N-PN government N romania PN by PREP gen PN that CONJ billion NUM us PN clowes PN european ADJ-N ambulance N political ADJ romanian ADJ part F N guardian PN however ADV eastern PN east PN summit N kong PN europe PN hong PN dixons PN market N ceausescu PN per cent N aged PREP group N panama PN national ADJ december PN in PREP barlow PN president PN hurd PN soviet ADJ havel PN eu~pe PN beijing PN cup N-PN bucharest PN military ADJ commons N minister N-PN january PN not NOT thatcher PN berlin PN
sport N conference N in-short ADV rates N peking PN lawson PN sir N-PN interest N blackpool PN football N-PN october PN knighton PN is V / P R E P mandela PN conservative ADJ-N base ADJ-N
Table 10: Mirror-Guardian and Guardian-Independent comparisons: high-contrast words. The 30 most different words are listed, provided they are above a threshold for the X 2 value. The lists for the Guardian-Independent comparison are shorter because there were not 30 items scoring above the threshold on either side of that comparison. All words are normalised to lower case. Parts of speech are derived from BNC tags. PN -- proper noun. Hyphenated categories are those for which CLAWS, the tagger used for tagging the BNC, was uncertain which of the two tags to assign.
I I ! i I i |
I ! I D. i I |
I I tl
244

I I I I I I
I
t |
1 |,,
I I
i 1 I
l ferences
Biber, Douglas. 1988. Variation across speech and writing. Cambridge University Press.
Biber, Douglas. 1993. Using register-diversified corpora for general language studies. Computa- tional Linguistics, 19(2):219-242.
Biber, Douglas. 1995. Dimensions in Register Variation. Cambridge University Press.
Charniak, Eugene. 1993. Statistical Language Learning. MIT Press, Cambridge, Mass.
Church, Kenneth and William Gale. 1995a. Inverse document frequency (IDF): a measure of deviations from Poisson. In David Yarowsky and Kenneth Church, editors, Third Workshop on very large corpora, pages 121-130, MIT.
Chui'ch, Kenneth and William Gale. 1995b. Poisson mixtures. Journal of Natural Language Engineering, 1(2):163-190.
Church, Kenneth W. and Robert L. Mercer. 1993. Introduction to the special issue on computa- tional linguistics using large corpora. Computational Linguistics, 19(1):1-24.
Dnnniug, Ted. 1993. Accurate methods for the statistics of surprise and coincidence. Computa- tional Linguistics, 19(1):61-74.
Holland, K. and S. Johansson, editors. 1982. Word Frequencies in British and American English. The Norwegian Computing Centre for the Humanities, Bergen, Norway.
Johan~son, Stig and Knut Hofland, editors. 1989. Frequency Analysis of English vocabulary and grammar, based on the LOB corpus. Clarendon, Oxford.
Kilgarriff, Adam. 1996. Which words are particularly characteristic of a text? a survey of statistical approaches. In Language Engineering for Document Analysis and Recognition, pages 33-40, Brighton, England, April. AISB Workshop Series.
Moon, Rosamtmd. 1987. The analysis of meaning. In John M. Sinclair, editor, Looking Up: An Account of the GOB UILD Project in Lexical Computing. Collins, London, chapter 4.
Mosteller, Frederick and David L. Wallace. 1964. Applied Bayesian and Classical Inference - The Case of The Federalist Papers. Springer Series in Satisties, Springer-Verlag.
Owen, Frank and Ronald Jones. 1977. Statistics. Polytech Publishers.
Pedemen, Ted. 1996. Fishing for exactness. In Proc. Conf. South-Central SAS Users Group, Texas.
Salton, Gerard. 1989. Automatic Yezt Processing. Addison-Wesley.
Sekine, Satshi. 1997. The domain dependence of parsing. In Proc. Fifth Conference on Applied Natural Language Processing, pages 96-102, Washington DC, April. ACL.
245