Embed Size (px)
Citation preview
2190
Mahmoud A. El-Sharief, Using value stream mapping for lean manufacturing implementation: cement sacks
factory as an industrial case study, pp.2190 - 2212
Journal of Engineering Sciences, Assiut University, Faculty of Engineering, Vol. 41, No. 6, November,
2013, E-mail address: [email protected]
USING VALUE STREAM MAPPING FOR LEAN
MANUFACTURING IMPLEMENTATION: CEMENT SACKS
FACTORY AS AN INDUSTRIAL CASE STUDY
Mahmoud A. El-Sharief
Mechanical Engineering Department – Faculty of Engineering, Assiut University, 71516 Assiut
E- Mail address: [email protected]
Received 9 November 2013; accepted 25 November 2013
ABSTRACT
Lean manufacturing is a production system, which was first developed by Toyota Production
Systems (TPSs) to reduce wastes while improving the operational and environmental performance
of manufacturing and industrial businesses. While the global industrial market suffers from gnarled
competition, lean manufacturing philosophy is providing an effective methodology to reduce cost
and maximize profit. In addition, the market no longer accepts waste caused by out of control
production or inefficient processes. A commitment to quality and lean operations will result in
quality improvement, waste elimination and reduction in time and costs.
Value stream mappings (VSMs), a lean manufacturing tool, which originated from the Toyota
Production Systems (TPSs), is known as “material and information flow mapping.” This mapping tool uses the techniques of lean manufacturing to analyze and evaluate certain work processes in a
manufacturing operation. This tool is used primarily to identify, demonstrate and decrease waste, as
well as create flow in the manufacturing process. VSM can be created merely using paper and
pencil; however, more advanced maps are created using Microsoft Visio as well as Microsoft Excel.
This paper describes practical implementation strategies for using lean manufacturing and an
industrial case study(Cement Sacks Factory) is included. After lean manufacturing methodology has
been applied to the case, results are produced as Cement Sacks Factory process efficiency is raised
by 4.31% and the TAKT time is reduced about 56%.
Keywords: Lean Manufacturing; Value Stream Mapping; Waste elimination; Facility layout; Case
study
1. Introduction
The critical starting point for lean thinking is value. As stated Womack et al. [1] value can
only be defined by the ultimate customer. Moreover, it is only meaningful when expressed
in terms of a specific product (a good or a service, and often both at once)which meets the
customer's needs at a specific price at a specific time. Value is created by the producer.
From the customer's standpoint, this is why producers exist.
With going on years , world has achieved great steps in industrial life to people, thus made
countries to compete with them in grossing their industrial fleet. Therefore, industrial
associations expanded to include many sectors in the same association. With competition
between power centers in world and war between them, industrial association has begun to
find systems to manage its big factories. Hence, many systems appeared, such as “lean”, “six sigma " and " lean six sigma “.
2191
Mahmoud A. El-Sharief, Using value stream mapping for lean manufacturing implementation: cement sacks
factory as an industrial case study, pp. 2190 - 2212
Journal of Engineering Sciences, Assiut University, Faculty of Engineering, Vol. 41, No. 6, November,
2013, E-mail address: [email protected]
1.1.Lean manufacturing system
Lean Manufacturing is the systematic elimination of waste from all aspects of an
organization’s operations, where waste is viewed as any use or loss of resources that does not lead directly to creating the product or service a customer wants when they want it. In
many industrial processes, such non-value added activity could comprise more than 90
percent of a factory’s total activity [1].
Lean manufacturing is the processes, techniques, strategies and initiatives being
implemented by companies around the world that aim to reduce unnecessary and
unproductive tasks, activities and behaviors in the work environment. In other word, lean
manufacturing is implemented in order to reduce waste and improve the organization
production and morale.
There are many tools and techniques in lean manufacturing that can be implemented but
the selection of effective lean tool, and technique in lean manufacturing is hard to choose.
Wrong decision will affect the waste and time. Lean thinking is a highly involved method
of managing an organization to improve the productivity, efficiency, and quality of
products and services.
1.2. Lean manufacturing benefits
T. MELTON [2] stated the benefits of lean manufacturing are:
Help to produce business outputs as fast as possible.
Convert a business enquiry to a finished output; then it can hold less row
material and finished stock inventory.
Hold lower inventory levels means need less cash to run the business.
Able to produce work faster.
Can do more with the same resources (machinery, people).
Can complete work faster than competitors.
Reduce the cash required for your business attractive.
1.3. More common practices of lean manufacturing
A few of the more common practices of the lean manufacturing are:
Just In Time: Producing only what is needed, when it is needed, and with the
needed quantities; reducing work-in-process inventory.
Kanban: A card that signals production of a set quantity of goods once that
number of goods has been used by a customer process.
Production leveling (or heijunka): Spreading production evenly over time;
reducing batch sizes to one.
Setup time reduction: Reducing the time to changeover between producing
different products; required leveling production.
Standardized work: Documented, detailed work procedures religiously followed
by everyone doing the job such that the work is performed the same way every
time.
2192
Mahmoud A. El-Sharief, Using value stream mapping for lean manufacturing implementation: cement sacks
factory as an industrial case study, pp. 2190 - 2212
Journal of Engineering Sciences, Assiut University, Faculty of Engineering, Vol. 41, No. 6, November,
2013, E-mail address: [email protected]
Multi-skilled workers: Workers trained in multiple job tasks so work can be
assigned flexibly to balance the line dynamically.
1.4.Identification and elimination of waste
The philosophy of identification and elimination of the waste is:
The central theme of a lean manufacturing production system.
A dynamic and constantly improving process dependent upon understanding and
involvement by all employees.
Successful implementation that requires all employees must be trained to
identify and eliminate waste from their work.
Waste exists in all work and at all levels in the organization.
1.5.Types of waste
There are seven types of wastes [1]:
Over-production, producing more than needed, and/or producing faster than
needed.
Wait time, idle time that is produced when two dependent variables are not fully
synchronized.
Transportation, any material movement that does not directly support a Lean
Manufacturing System.
Processing, effort that adds no value to a product or service.
Inventory, any supply in excess of process requirements necessary to produce
goods or services Just in Time.
Motion, any movement of people that does not contribute added value to the
product or service.
Reworks or Corrections, repair of a product or service to fulfill customer
requirements
2. Value Stream Mapping
Jim Womack et al. [3] presented that a Value Stream Mapping (VSM) is a collection of all
actions value added as well as non-value added that are required to bring a product or a
group of products that use the same resources through the main flows, from raw material to
the customers. These actions are those in the overall supply chain including both
information and operation flow which are the core of any successful lean operation. Value
stream mapping is a special type of flow chart that uses numbers and symbols known as
“the language of lean” to improve the flow of material and information.
2.1.Value stream mapping benefits
Ulf K. Teichgraeber et al [4] stated that there is a need to understand the entire
manufacturing system in order to create VSM and gain maximum benefits, which are:
2193
Mahmoud A. El-Sharief, Using value stream mapping for lean manufacturing implementation: cement sacks
factory as an industrial case study, pp. 2190 - 2212
Journal of Engineering Sciences, Assiut University, Faculty of Engineering, Vol. 41, No. 6, November,
2013, E-mail address: [email protected]
In order to visually display where waste occurs in the process and to distinction
between values add and non-value add activities (waste), a value stream map
(VSM) is drawn because the main principle of lean manufacturing is to reduce
waste in an operation, such as long lead times, defects and material waste.
Shows the linkage between material and information flow of a product
Identifies all types of waste in the value stream and take steps to try eliminating
them.
Once the current state VSM is created, it becomes the baseline for improvement
and for the creation of a future state value stream mapping FSVSM. The
FSVSM can then be used as a world class manufacturing implementation road
map.
2.2.VSM Creation
The procedure of the VSM creation is:
1. The Current State Value Stream Map
Select the product family that will be mapped
Decide what the goal for improvement will be
Form a team to collect data and map the selected value stream
Walk the flow and collect data on the value stream
Value Stream Map terminology
Value stream map standard symbols
Draw a map of the value stream
2. Analysis the Current conditions
Identify value added and waste
Choosing appropriate waste reduction methods and reconfigure process to
eliminate waste and maximize value
3. Take actions and create the Future State Value Stream Map.
2.2.1. The current state value stream map
2.2.1.1.Select the product family that will be mapped Value stream maps are created for a single product, or a family of products. A family is a
group of products with similar routings, similar process times, and customers with similar
needs and demand rates. ‘Similar’ means that while there may be some variation, it is
recognizable that all members of the group have the same set of core operations. Products
may vary by color, size, or one or two steps in the production process. H.J. Warnecke et al.
[5] presented the reason for concentrating on a family of products is that lean
improvements such as cells and kanban systems only work well if all products in the
stream are similar in process times and routings.
2194
Mahmoud A. El-Sharief, Using value stream mapping for lean manufacturing implementation: cement sacks
factory as an industrial case study, pp. 2190 - 2212
Journal of Engineering Sciences, Assiut University, Faculty of Engineering, Vol. 41, No. 6, November,
2013, E-mail address: [email protected]
2.2.1.2.Decide on the goal for improvement There are different opinions about what the goal should be. First opinion for Advocates of
the TPS style of lean manufacturing will claim that production at takttime is the only
acceptable goal of the improvement process. Second opinion is that takttime is an outcome,
not a design parameter. Whether the goal is to reduce cost by eliminating waste, or to
produce in time with customer demand, value stream mapping is an essential tool, and it is
independent of anyone production philosophy.
2.2.1.3.Form the value stream mapping team Value stream mapping is the best done by a team in a workshop format. This is because
few people really understand the entire value stream, or have the knowledge to anticipate
the impacts of specific changes to it. A team with a variety of members is therefore
required.
2.2.1.4.Walk the flow The team members should have a form for gathering data on each step (including work
centers, queues, raw materials arrival, shipping to the customer, and operators).
2.2.1.5.VSM terminologies
Value-added activities: An activity that transforms or shapes material or
information, the customer wants it and it is done right the first time.
Non value added – needed activities: Activities which causing no value to be
created but which cannot be eliminated based on current state of technology or
thinking required (regulatory, customer mandate, legal).
Non value-added activities: Activities that consumes resources but create no
value in the eyes of the customer.
Cycle time: Cycle time is the time required to execute activities in a process
(including value-added and non-value added time)
Takt time: Measure of customer demand - how much is required in the time
available
Takt Time = available time / time customer demand rate for available time
The information flow: Indicates how each process will know what to make. The
information flow is drawn on the upper portion of the map. The information flow
is drawn from right to left on the map and is connected to the material flow
previously drawn.
Time line: After the completion of the map, a timeline is drawn below the
process boxes to indicate the production lead-time and value added time.
Production lead-time: The time that a particular product spends on the shop floor
from its arrival until its completion.
Value added time: This time represents the sum of the processing times for each
process.
Process cycle efficiency = Value added time/ total cycle time
2195
Mahmoud A. El-Sharief, Using value stream mapping for lean manufacturing implementation: cement sacks
factory as an industrial case study, pp. 2190 - 2212
Journal of Engineering Sciences, Assiut University, Faculty of Engineering, Vol. 41, No. 6, November,
2013, E-mail address: [email protected]
Value Stream Map and Selected Standard Icons:VSM symbols is not
standardized and there are many variations. Here are the most common symbols.
2.2.1.6.VSM process symbols Value stream map uses special symbols to represent where there is waste in manufacturing
processes and to help find ways to eliminate that waste.
2.2.1.7.Draw the current state map The current state map is simply a set of connected operations and queues starting with a
supplier and ending with a customer. After the data collection is complete, all of the data
can be collected in a single spreadsheet or transferred directly to the value stream map
from each team member’s notes as follows:
Draw customer, supplier and production control icons.
Enter customer requirement.
Calculate takt time.
Draw outbound shipping icon and truck with delivery frequency.
Draw in bound shipping icon and truck with delivery frequency.
Add process box, in sequence, left to right.
Add collected data box below.
Add communication and information flow arrows.
Obtain process attributes. Add to data box.
Add operator symbols.
Add inventory locations and level in days of demand and graph at bottom.
Add push and pull icons.
Add other information.
Add working hours.
Add value and non-values add time.
Calculate total value and non-value add times.
2.2.2. Analysis the current conditions
2.2.2.1.Identify value added and waste Value stream mapping is a process designed to reduce lead-time to make product flow and
to eliminate waste (non-value added operations or activities). All for purpose of meeting
customer demand at the lowest cost and with the highest quality[6]. Lean thinking relies on
recognizing the “seven wastes” over-production, over-processing, inventory, motion,
scrap, waiting and transportation. With simulation, it is easy to avoid the traditional
problem of eliminating waste at an operation where there is no net gain [7]. That is because
the revised system’s performance can be compared to the current state to see the impact of
the proposed change.
2196
Mahmoud A. El-Sharief, Using value stream mapping for lean manufacturing implementation: cement sacks
factory as an industrial case study, pp. 2190 - 2212
Journal of Engineering Sciences, Assiut University, Faculty of Engineering, Vol. 41, No. 6, November,
2013, E-mail address: [email protected]
2.2.2.2.Choosing appropriate waste reduction methods and reconfigure process to
eliminate waste and maximize value Matthias Holweg et al. [8] stated that there are many waste elimination methods that can
be applied in a given situation, but selecting the appropriate method is not easy.
Consideration must be made of cost disruption to other product families and parts of the
production system, operator skills, maintenance, reliability, space and so forth.
2.2.3. Take actions and create the future state value stream map The future state map is nothing more than an implementation plan that highlights what
kind of lean tools are needed to eliminate the waste, and where they are needed in the
product value stream. Creating a future state map is done through answering a set of
questions concerning issues related to building of the future state map and technical
implementation related to the use of lean tools. Based on the answers to these questions
one should mark the future state ideas directly on the future state map. After creating the
future state map, the last step is to carry it out by trying to implement the different ideas
generated by the future state map on the actual value stream.
2.3.The lean facility layout
Layout is an integral part of a Lean manufacturing strategy. Meaningful restructuring
requires corresponding physical changes in the layout. Flow is one of the main five
concepts of lean manufacturing, but in order to achieve smooth flow important decisions
must be taken and that is to plan and design a layout that is integrated to other concepts of
lean along with the flow.
Facility layout decision is based on criteria aimed at creating an effective and efficient
workflow and high standard production. Conversely, a layout re-design can be the catalyst
for re-structuring. A layout project properly done can demonstrate the need for change to
an organization reluctant to tear itself apart and rebuild. Therefore, requirements for
effective layout are:
Minimize material handling costs
Utilize space efficiently
Utilize labor efficiently
Eliminate bottlenecks
Facilitate communication and interaction between workers, between workers and
their supervisors, or between workers and customers.
Reduce manufacturing cycle time and customer service time
Eliminate wasted or redundant movement
Facilitate the entry, exit, and placement of material, products, and people
Incorporate safety and security measures; Promote product and service quality
Encourage proper maintenance activities
Provide a visual control of operations or activities
Provide flexibility to adapt to changing conditions
2197
Mahmoud A. El-Sharief, Using value stream mapping for lean manufacturing implementation: cement sacks
factory as an industrial case study, pp. 2190 - 2212
Journal of Engineering Sciences, Assiut University, Faculty of Engineering, Vol. 41, No. 6, November,
2013, E-mail address: [email protected]
2.4.Lean factory design
A lean plant/shop floor layout has significant impact on the organization's performance.
Material and information flow is organized and streamlined. A lean plant layout is an
effective way to improve profitability and throughput while increasing safety [9]. The
elimination of wasted movement and implementing line balancing can significantly reduce
costs and reduce cycle time to provide speed of delivery and improved throughput.
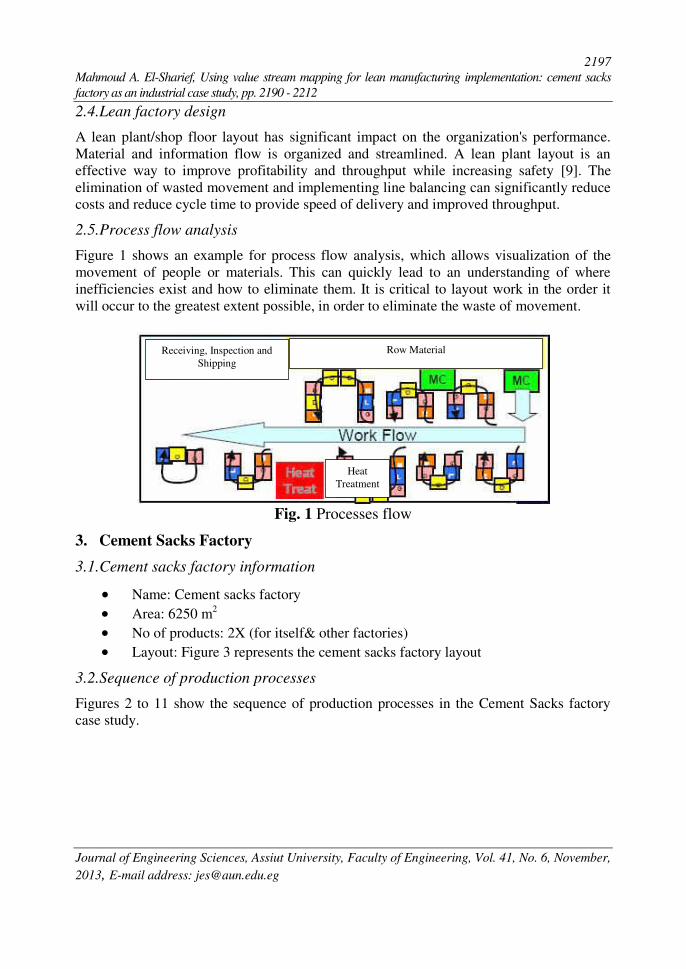
2.5.Process flow analysis
Figure 1 shows an example for process flow analysis, which allows visualization of the
movement of people or materials. This can quickly lead to an understanding of where
inefficiencies exist and how to eliminate them. It is critical to layout work in the order it
will occur to the greatest extent possible, in order to eliminate the waste of movement.
Fig. 1 Processes flow
3. Cement Sacks Factory
3.1.Cement sacks factory information
Name: Cement sacks factory
Area: 6250 m2
No of products: 2X (for itself& other factories)
Layout: Figure 3 represents the cement sacks factory layout
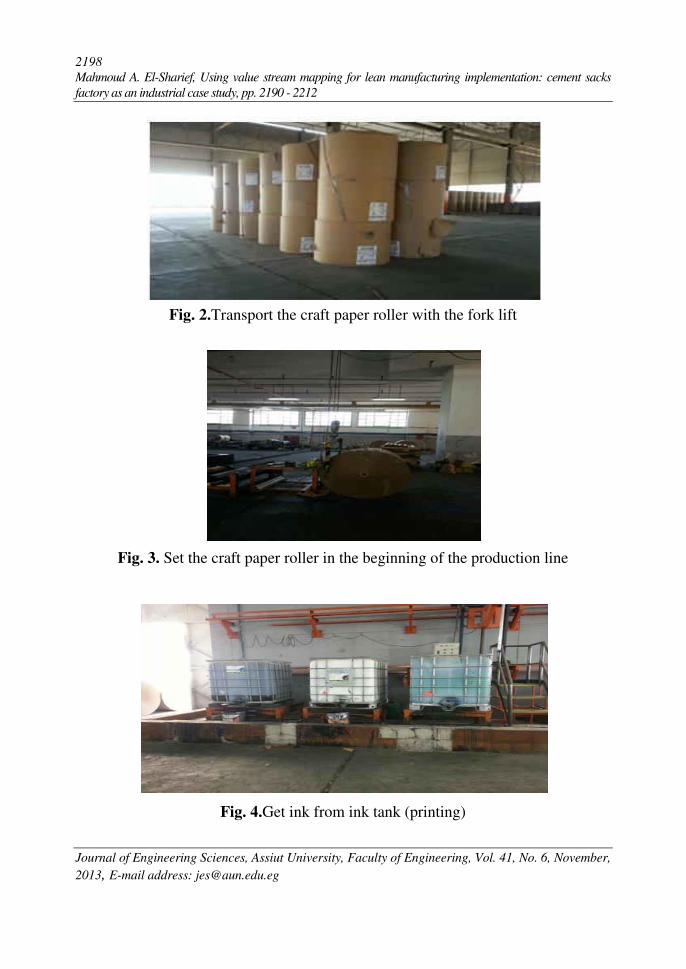
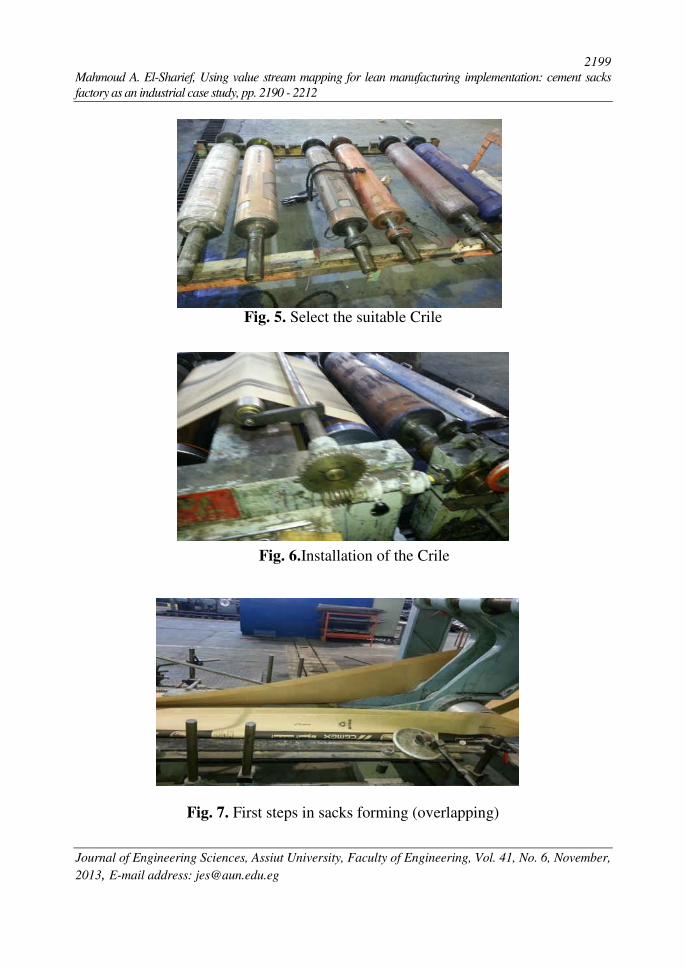
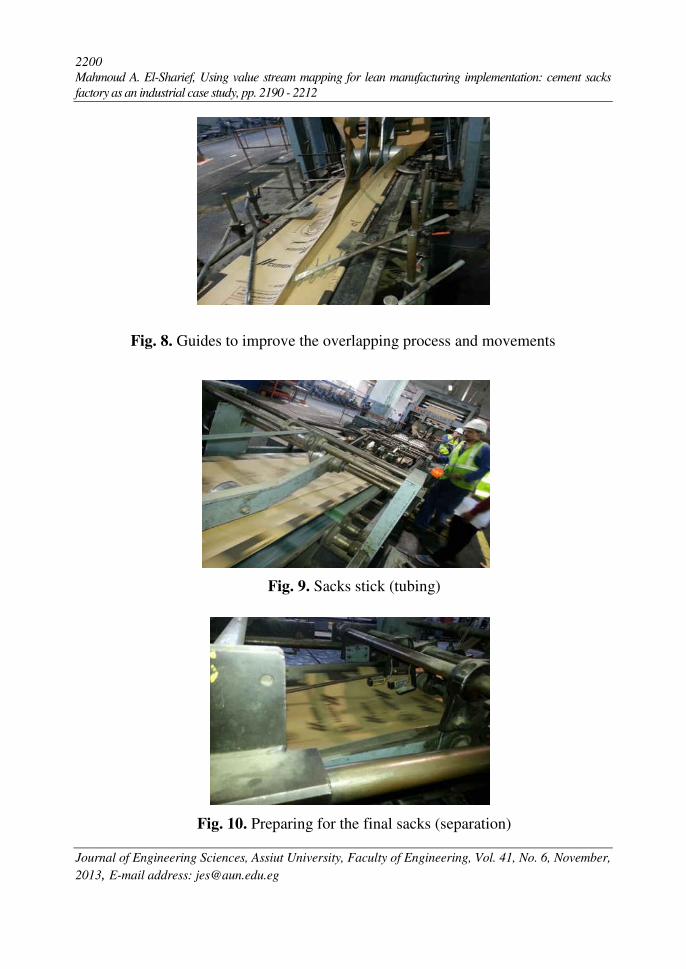
3.2.Sequence of production processes
Figures 2 to 11 show the sequence of production processes in the Cement Sacks factory
case study.
Receiving, Inspection and
Shipping
Row Material
Heat
Treatment
2198
Mahmoud A. El-Sharief, Using value stream mapping for lean manufacturing implementation: cement sacks
factory as an industrial case study, pp. 2190 - 2212
Journal of Engineering Sciences, Assiut University, Faculty of Engineering, Vol. 41, No. 6, November,
2013, E-mail address: [email protected]
Fig. 2.Transport the craft paper roller with the fork lift
Fig. 3. Set the craft paper roller in the beginning of the production line
Fig. 4.Get ink from ink tank (printing)
2199
Mahmoud A. El-Sharief, Using value stream mapping for lean manufacturing implementation: cement sacks
factory as an industrial case study, pp. 2190 - 2212
Journal of Engineering Sciences, Assiut University, Faculty of Engineering, Vol. 41, No. 6, November,
2013, E-mail address: [email protected]
Fig. 5. Select the suitable Crile
Fig. 6.Installation of the Crile
Fig. 7. First steps in sacks forming (overlapping)
2200
Mahmoud A. El-Sharief, Using value stream mapping for lean manufacturing implementation: cement sacks
factory as an industrial case study, pp. 2190 - 2212
Journal of Engineering Sciences, Assiut University, Faculty of Engineering, Vol. 41, No. 6, November,
2013, E-mail address: [email protected]
Fig. 8. Guides to improve the overlapping process and movements
Fig. 9. Sacks stick (tubing)
Fig. 10. Preparing for the final sacks (separation)
2201
Mahmoud A. El-Sharief, Using value stream mapping for lean manufacturing implementation: cement sacks
factory as an industrial case study, pp. 2190 - 2212
Journal of Engineering Sciences, Assiut University, Faculty of Engineering, Vol. 41, No. 6, November,
2013, E-mail address: [email protected]
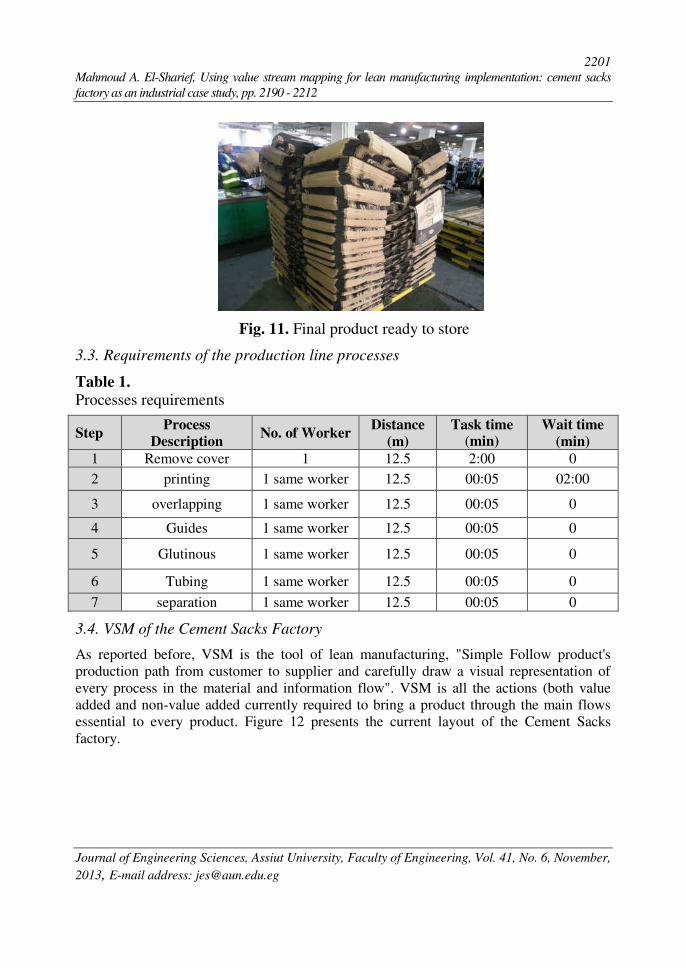
Fig. 11. Final product ready to store
3.3. Requirements of the production line processes
Table 1. Processes requirements
Step Process
Description No. of Worker
Distance
(m)
Task time (min)
Wait time
(min)
1 Remove cover 1 12.5 2:00 0
2 printing 1 same worker 12.5 00:05 02:00
3 overlapping 1 same worker 12.5 00:05 0
4 Guides 1 same worker 12.5 00:05 0
5 Glutinous 1 same worker 12.5 00:05 0
6 Tubing 1 same worker 12.5 00:05 0
7 separation 1 same worker 12.5 00:05 0
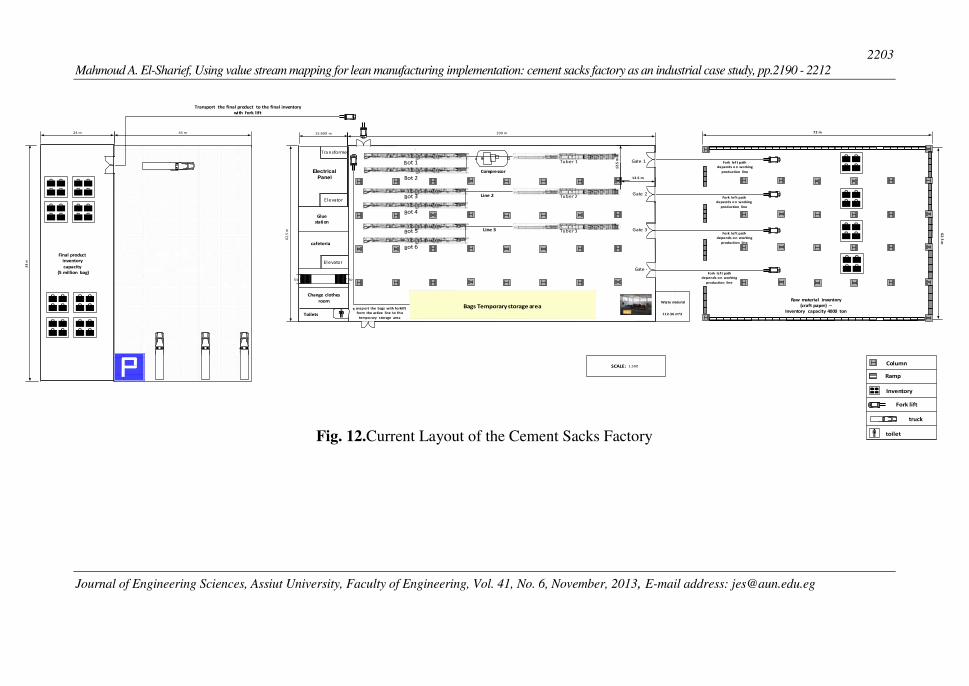
3.4. VSM of the Cement Sacks Factory
As reported before, VSM is the tool of lean manufacturing, "Simple Follow product's
production path from customer to supplier and carefully draw a visual representation of
every process in the material and information flow". VSM is all the actions (both value
added and non-value added currently required to bring a product through the main flows
essential to every product. Figure 12 presents the current layout of the Cement Sacks
factory.
2202
Mahmoud A. El-Sharief, Using value stream mapping for lean manufacturing implementation: cement sacks
factory as an industrial case study, pp. 2190 - 2212
Journal of Engineering Sciences, Assiut University, Faculty of Engineering, Vol. 41, No. 6, November,
2013, E-mail address: [email protected]
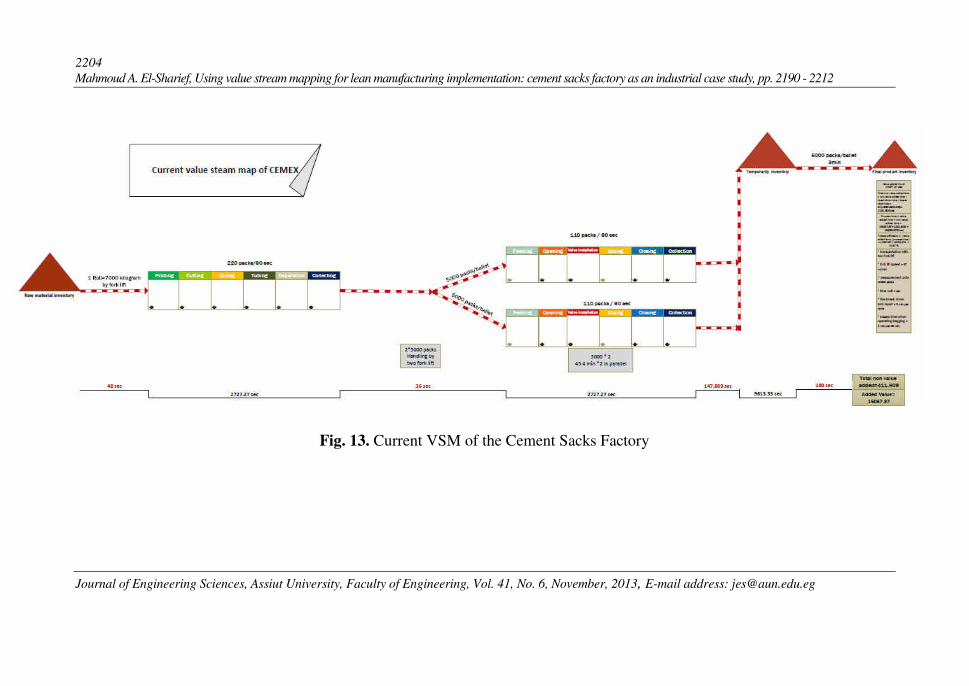
3.4.1. Current VSM Figure 13 presents the current VSM of the Cement Sacks factory. VSM Data Set:
Product flow unit of 10,000-cement packs.
Handling using two forklifts with speed = 47 m/min each.
Coding time for one 5,000 sacks pallet = 1 min.
Product:
Cement packs consist of: Craft paper
Glue
Ink
Customer Requirements:
Pallet=5000 packs.
Working Time:
Shift time = 6.75 hr.
Break time = 1.25 hr.
Manufacturing Process: Manufacturing processes for a sample consists of 10000 packs are shown in table 2.
2203
Mahmoud A. El-Sharief, Using value stream mapping for lean manufacturing implementation: cement sacks factory as an industrial case study, pp.2190 - 2212
Journal of Engineering Sciences, Assiut University, Faculty of Engineering, Vol. 41, No. 6, November, 2013, E-mail address: [email protected]
Transport the final product to the final inventory
with fork lift
62
.5 m
8
4 m
62
.5 m
Column
Ramp
Inventory
Fork lift
truck
toilet
SCALE: 1:500
72 m
depends o n working
Raw material inventory
(craft paper) –
Inventory capacity 4000 ton
ot 1 Tuber 1
Compressor
ot 2
ot 3 Tuber 2 Gate 2
ot 4
ot 5 Tuber 3 Gate 3
ot 6
Gate 4
ansp ort the bags with forklift Bags Temporary storage area from the active line to th e
tempo rary storage area
Fork lef t path
depends o n working
production line
Fork lef t path
production line
Fork lef t path
depends o n working
production line
Fork lef t path
depends o n working
production line
Waste material
112.36 m^2
Line 3
Line 2
12
.5 m
Gate 1
12.5 m
B
B
B
B
B
B
100 m
24 m
45 m 15.909 m
Transformer
Electrical
Panel
Elevator
Glue
station
cafeteria
Elevator
Up Up
Change clothes
room
Tr
Toilets
Final product
inventory
capacity
(5 million bag)
Fig. 12.Current Layout of the Cement Sacks Factory
2204
Mahmoud A. El-Sharief, Using value stream mapping for lean manufacturing implementation: cement sacks factory as an industrial case study, pp. 2190 - 2212
Journal of Engineering Sciences, Assiut University, Faculty of Engineering, Vol. 41, No. 6, November, 2013, E-mail address: [email protected]
Fig. 13. Current VSM of the Cement Sacks Factory
2205
Mahmoud A. El-Sharief, Using value stream mapping for lean manufacturing implementation: cement sacks
factory as an industrial case study, pp.2190 - 2212
Journal of Engineering Sciences, Assiut University, Faculty of Engineering, Vol. 41, No. 6, November,
2013, E-mail address: [email protected]
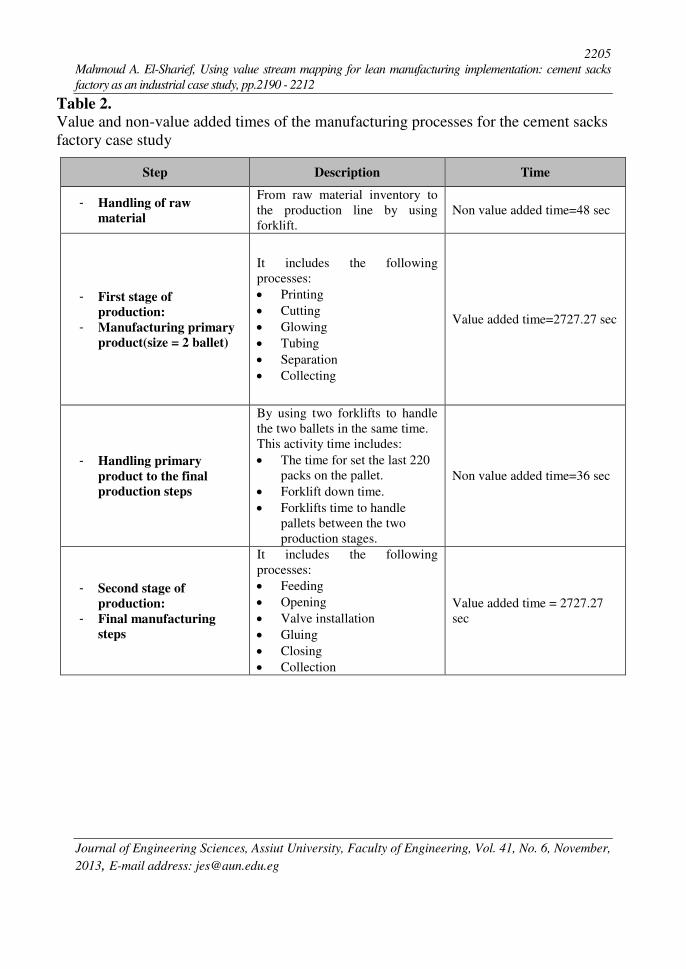
Table 2.
Value and non-value added times of the manufacturing processes for the cement sacks
factory case study
Step Description Time
- Handling of raw
material
From raw material inventory to
the production line by using
forklift.
Non value added time=48 sec
- First stage of
production:
- Manufacturing primary
product(size = 2 ballet)
It includes the following
processes:
Printing
Cutting
Glowing
Tubing
Separation
Collecting
Value added time=2727.27 sec
- Handling primary
product to the final
production steps
By using two forklifts to handle
the two ballets in the same time.
This activity time includes:
The time for set the last 220
packs on the pallet.
Forklift down time.
Forklifts time to handle
pallets between the two
production stages.
Non value added time=36 sec
- Second stage of
production:
- Final manufacturing
steps
It includes the following
processes:
Feeding
Opening
Valve installation
Gluing
Closing
Collection
Value added time = 2727.27
sec

2206
Mahmoud A. El-Sharief, Using value stream mapping for lean manufacturing implementation: cement sacks
factory as an industrial case study, pp. 2190 - 2212
Journal of Engineering Sciences, Assiut University, Faculty of Engineering, Vol. 41, No. 6, November,
2013, E-mail address: [email protected]
Step Description Time
- Handling final product
to the temporary
inventory
The time for this process
includes:
The time for set the last 220
packs on the pallet.
Fork lifts caring and down
time.
Fork lifts time to transfer the
pallets.
Coding time.
Non value added
time=147.809 sec
- Temporary inventory This step is taken for sacks to
drying glue Value added time=9613.33 sec
- Handling pallets to the
final product inventory
This uses two forklifts to handle
the two pallets Non value added time=180 sec
- Final product inventory Final sacks storage Out of process description
3.4.2. Current process efficiency
Break down and repairing time for one cycle = 8 /45 = 0.178 min.
Total value add time =15067.87 sec.
Total non-value added time = non-value add time +break down time + losses time.
- =411.809+480+300.
- =1191.809 sec.
Process time = 15067.87+1191.809=16259.679 sec.
Process efficiency = 15067.87/16259.679=92.67%.
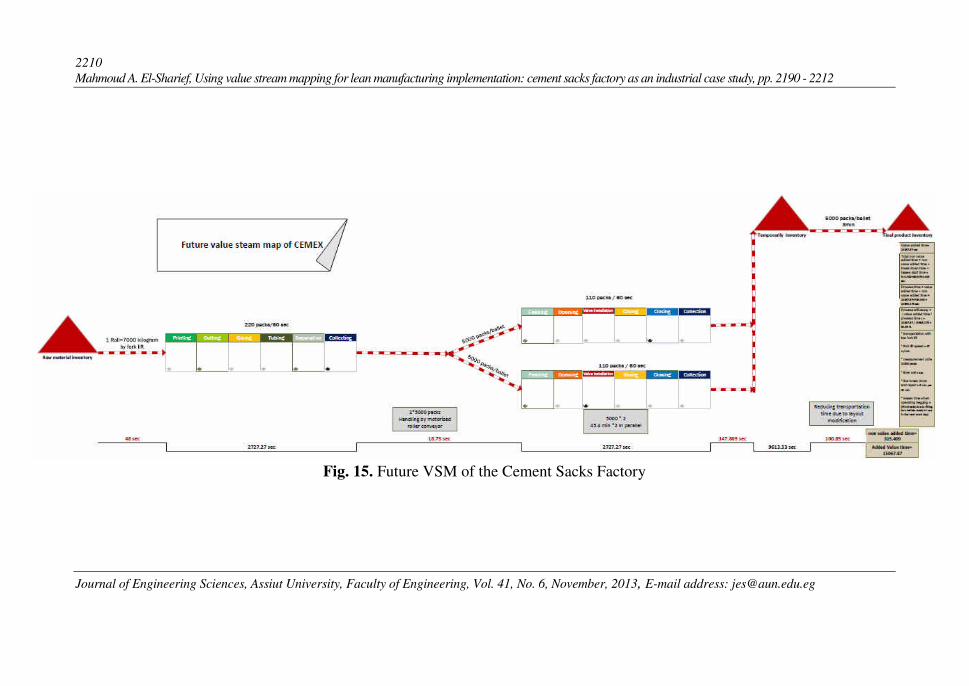
3.4.3. Modified value stream mapping These value stream maps show the effect of applying lean thinking on the efficiency of the
production lines for the Cement Sacks Factory as shown in table 3.Figures 14 and 15 show
the modified layout and VSM respectively of the Cement Sacks Factory.
2207
Mahmoud A. El-Sharief, Using value stream mapping for lean manufacturing implementation: cement sacks
factory as an industrial case study, pp. 2190 - 2212
Journal of Engineering Sciences, Assiut University, Faculty of Engineering, Vol. 41, No. 6, November,
2013, E-mail address: [email protected]
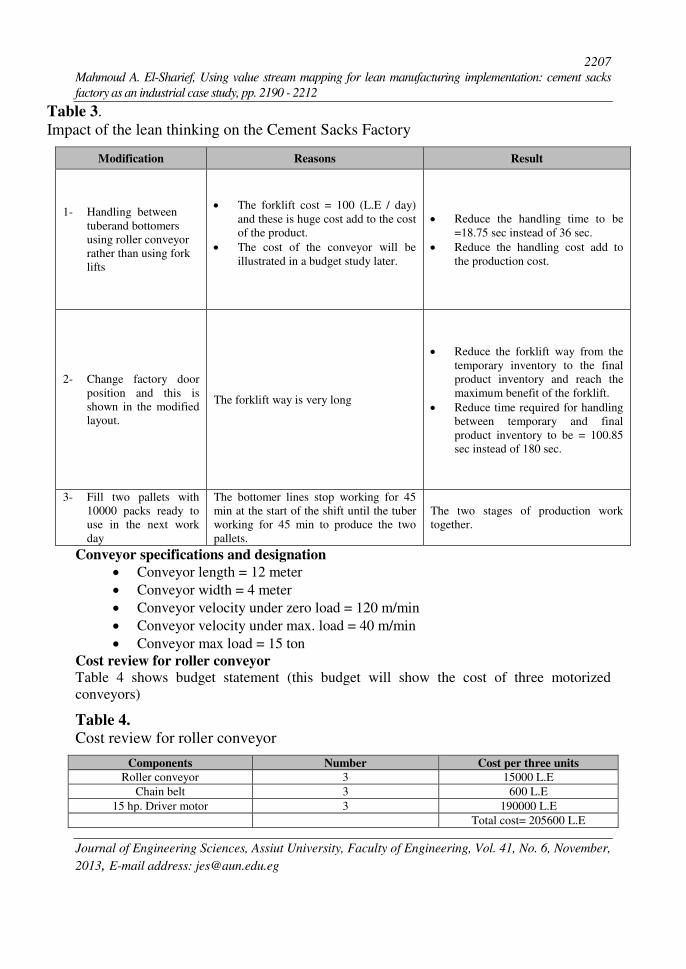
Table 3.
Impact of the lean thinking on the Cement Sacks Factory
Modification Reasons Result
1- Handling between
tuberand bottomers
using roller conveyor
rather than using fork
lifts
The forklift cost = 100 (L.E / day)
and these is huge cost add to the cost
of the product.
The cost of the conveyor will be
illustrated in a budget study later.
Reduce the handling time to be
=18.75 sec instead of 36 sec.
Reduce the handling cost add to
the production cost.
2- Change factory door
position and this is
shown in the modified
layout.
The forklift way is very long
Reduce the forklift way from the
temporary inventory to the final
product inventory and reach the
maximum benefit of the forklift.
Reduce time required for handling
between temporary and final
product inventory to be = 100.85
sec instead of 180 sec.
3- Fill two pallets with
10000 packs ready to
use in the next work
day
The bottomer lines stop working for 45
min at the start of the shift until the tuber
working for 45 min to produce the two
pallets.
The two stages of production work
together.
Conveyor specifications and designation
Conveyor length = 12 meter
Conveyor width = 4 meter
Conveyor velocity under zero load = 120 m/min
Conveyor velocity under max. load = 40 m/min
Conveyor max load = 15 ton
Cost review for roller conveyor
Table 4 shows budget statement (this budget will show the cost of three motorized
conveyors)
Table 4. Cost review for roller conveyor
Components Number Cost per three units
Roller conveyor 3 15000 L.E
Chain belt 3 600 L.E
15 hp. Driver motor 3 190000 L.E
Total cost= 205600 L.E
2208
Mahmoud A. El-Sharief, Using value stream mapping for lean manufacturing implementation: cement sacks
factory as an industrial case study, pp. 2190 - 2212
Journal of Engineering Sciences, Assiut University, Faculty of Engineering, Vol. 41, No. 6, November,
2013, E-mail address: [email protected]
Income statement
After applying this modification, the handling time between tubers and bottomers,
will be reduced by 17.25 sec.
The production time for one cement bag = 0.655 sec.
This will show that in the 17.2 sec. will produce 27 bag
The net profit for one bag = 0.2 L.E
The daily bag production 90000 bags
The daily net profit = 90000*0.2= 18000 L.E
Cach flow statement
After reviewing budget and income statement, the total cost = 205600L.E and capital
recovery rate= 205600/18000 = 12 days
Modification results
The non-value added time will be reduced to =315.409 sec instead of 1191.809 sec.
Therefore the efficiency of the production line cycle will be increased to = 94.98 % instead
of 92.67 %.

2209
Mahmoud A. El-Sharief, Using value stream mapping for lean manufacturing implementation: cement sacks factory as an industrial case study, pp.2190 - 2212
Journal of Engineering Sciences, Assiut University, Faculty of Engineering, Vol. 41, No. 6, November, 2013, E-mail address: [email protected]
72 m 24 m 45 m 15.909 m 100 m
Tra nsformer
Ga te 1 Tu ber 1 Fork left path
depends on working
production line
Bot 1
Electrical
Panel Bot 2 12.5 m
Ga te 2 Line 2 Bot 3 Tu ber 2 Fork left path depends on working
production line
E leva tor
Bot 4 Glue
station
Line 3 Ga te 3 Bot 5 Tu ber 3 Fork left path
depends on working production line
cafeteria Bot 6
Final product
inventory
capa ci ty
(5 mill ion ba g)
E leva tor
Ga te 4
Up Up
Transport the bags with forklift from the active line to the
temporary storage area Cha nge clothes
room Raw material inventory
(craft paper) –
Inventory ca pa city 4000 ton
Waste materi al
Bags Temporary storage area Compressor
T oilets 112.36 m^2
Transport the bags with fork lift from the the temporary storage area to the fina l
product inventory
SCALE: 1:500
First modification: Column
Handling between tuber and
bottomers using roller
conveyor to transport tow
ballets filling with 10000
packs
Conveyor specification:
Conveyor velocity with zero
load = 120 m/min
Conveyor velocity with max.
load = 40 m/min
Max. load = 15 ton
Power = 15 hors power
Ramp Third modification :
Fill tow ballets with 10000
packs ready to use in next work
day
Inventory
Seconde modification Fork lift
Change factory door position truck
Change final product inventory
door position toilet
Roller conveyor
62.5
m
84 m
62.5
m
12.5
m
Fig. 14 Modified Layout of the Cement Sacks Factory
2210
Mahmoud A. El-Sharief, Using value stream mapping for lean manufacturing implementation: cement sacks factory as an industrial case study, pp. 2190 - 2212
Journal of Engineering Sciences, Assiut University, Faculty of Engineering, Vol. 41, No. 6, November, 2013, E-mail address: [email protected]
Fig. 15. Future VSM of the Cement Sacks Factory
2211
Mahmoud A. El-Sharief, Using value stream mapping for lean manufacturing implementation: cement sacks
factory as an industrial case study, pp.2190 - 2212
Journal of Engineering Sciences, Assiut University, Faculty of Engineering, Vol. 41, No. 6, November,
2013, E-mail address: [email protected]
4. Conclusions
Value stream mapping has proven to be an effective way to analyze a company’s current production state and point out problem areas. The visual nature of value stream mapping,
by combining information and material flow on one map, depicts how the two relate to the
lead-time. By applying lean thinking and VSM technique in the Cement Sacks Factory
case study, there are many benefits can be obtained as:
Reduction in the handling cost which add to the production cost.
Reduction in the forklift way from the temporary inventory to the final product
inventory.
Reaching the maximum benefit of the forklift.
Reduction in the time required for handling between temporary and final product
inventory to 100.85 sec instead of 180 sec. This means that the reduction percentage
is 56.
There are many factors contributing to the lead-time, that is, order handling, planning,
procurement, delivery, inspection, manufacturing, handling, picking, packing and delivery.
This paper focuses on analysis of manufacturing data for reducing lead-time and addresses
within Make and Plan. Future work can be carried out on design, order handling, delivery
or reassembly since those are also important factors affecting production and lead-time in
the company’s operations.
5. References
[1] James P. Womack & Daniel T. Jones, Lean Thinking, Free Press, New York, USA, 2003.
[2] T. MELTON, The Benefits of Lean Manufacturing: What Lean Thinking has to Offer the
Process Industries, Chemical Engineering Research and Design, Vol. 83, 2005, pp. 662–673.
[3] Jim Womack & Dan Jones, Learning to See Value Stream Mapping to Creat Value and
Eliminate Muda, Brookline, massachusetts, USA, 1999.
[4] Ulf K. Teichgraeber, Maximilian de Bucourt, Applying value stream mapping techniques
to eliminate non-value-added waste for the procurement of endovascular stents, European
Journal of Radiology, Vol. 81, 2012, pp. 47– 52.
[5] H.J. Warnecke and M. Hueser, Lean Production, Int. J. Production Economics, Vol. 41
1995, pp. 37-43.
[6] Rachna Shah, and Peter T. Ward, Lean manufacturing: context, practice bundles, and
performance, Journal of Operations Management, Vol. 21, 2003, pp. 129–149.
[7] Fawaz A. Abdulmalek and Jayant Rajgopal, Analyzing the benefits of lean manufacturing
and value stream mapping via simulation: A process sector case study, Int. J. Production
Economics, Vol. 107, 2007, pp. 223–236.
[8] Matthias Holweg, The genealogy of lean production, Journal of Operations Management,
Vol. 25, 2007, pp. 420–437.
[9] Rachna Shah and Peter T. Ward, Defining and developing measures of lean production,
Journal of Operations Management, Vol. 25, 2007, pp. 785–805.
2212
Mahmoud A. El-Sharief, Using value stream mapping for lean manufacturing implementation: cement sacks
factory as an industrial case study, pp. 2190 - 2212
Journal of Engineering Sciences, Assiut University, Faculty of Engineering, Vol. 41, No. 6, November,
2013, E-mail address: [email protected]
وما في نظم التصنيع دا خريط تدفق المنتج والمع مصنع إنتاج راسالرشيق: است تطبيقي من الصناع حالأكياس اأسمنت ك
ص العربى: المننع شنن الت نن هنن Lean Manufacturingال ط نن نتنن ن نن ي رنن تط ير الع ل نن ر ي رنن يننتظ
اء مست ى رحس ن م رقل ل ال ق غ ع عيا اأ ع ع لل ت ل ع ع اأس ارع ني .ال الع ل ن الع فس من س ال عتج ن يلناا اترجن ط نحن ن ال نع ال شن فلسن الت ن رنظ يمن ال معرج ن تن ف ل ن
ض فع ل ن ت يعن لن،للظ يعاي عل .ال ح يرع ظ التك ل ف ل ن مق يجن ف اقن ن رجن عنن سن ء التل ت ء أيع يالتحكظ في اإنت نظ يق اعن ن لج اتلتناا . اإنت ج الع نع ن شن الت ي ن ت ال
عتج ج في رحس ن ععه يعتج ا لص ي ال ى الا ي ال اق أن ا من ن أ من الت التكن ل ف رقل ل ل يعتج نت من ي . ال
ائ عل م ت خ عتج ت يال ف ال ن ت عنن(VSMs)ر نع ل هي ع ظ الت ئ سن لنع ا ال شن ي اأ التني الننع مننن ن نن ت ننظ ر ي رنن للت ا .(TPSs)ن ننع رقع نن ت رسننت هنناط اأ شنن الت عننض يرق نن ظ لتحل ننل ال
ل نن ت ع ع .رسننت الع ا هنناط ال ينن يرقل ننل أس سنني ننكل اأ ل لتح ننا ال اقنن نن عننن ف اق ف م ل نن رنن ععتج ي ال كن في يس ع ع . ي ل ت ال ا ين عن (VSMs) ن ء الع لن، يمن ;القلنظ ي ال تقن اسنتا كن است م أ ث ي ا رق ي است .Microsoft Excel ل إض ف Microsoft Visio عن
نف حث ي شن ي نال، ي هاا ال نع ال نظ الت م فني ن سنت ن ات التع اين اأس سن ال ل ن ال ي ن عنن ات ار ج يسننت هنناط ال ننع ع اإسننت ننع ل ننع ع يهنن م ل نن ير ق نن مننن ال ةنن ال تاسنن ع فنني
م أمكنن سنت قنه ال شن ي نع ال ظ الت عرج ن لنع تاسن ال عت. ع ر هاط ال ( اأس أ س )شك يعلي عس ح الي 4..1رحس ن ء اإنت عس ح الي ع ال من الت %. 65% ير ض ال ق في