Embed Size (px)
Citation preview
Usi
ng U
ML
, Pat
tern
s, a
nd J
ava
Ob
ject
-Ori
ente
d S
oftw
are
En
gin
eeri
ng 14.3 Scheduling
Camp III,July 6
Camp II, July 4
Camp I, July 1
Bernd Bruegge & Allen H. Dutoit Object-Oriented Software Engineering: Using UML, Patterns, and Java 2
Where are we?
SPMP IEEE Std 1058 0. Front Matter 1. Introduction 2. Project Organization 3. Managerial Process 4. Technical Process 5. Work Elements, Schedule, Budget
5.1 Work Breakdown Structure 5.2 Dependencies between tasks 5.3 Resource Requirements 5. 4 Budget 5.5 Schedule (Today’s lecture)
Optional Inclusions
Bernd Bruegge & Allen H. Dutoit Object-Oriented Software Engineering: Using UML, Patterns, and Java 3
Outline
The last lecture dealt with Work Breakdown Structures Today we focus on Dependencies and Scheduling Estimating times for activities Determining critical path and slack times Determining project duration Many heuristics and examples
How to live with a given deadline Optimizing schedules Rearranging schedules
Bernd Bruegge & Allen H. Dutoit Object-Oriented Software Engineering: Using UML, Patterns, and Java 4
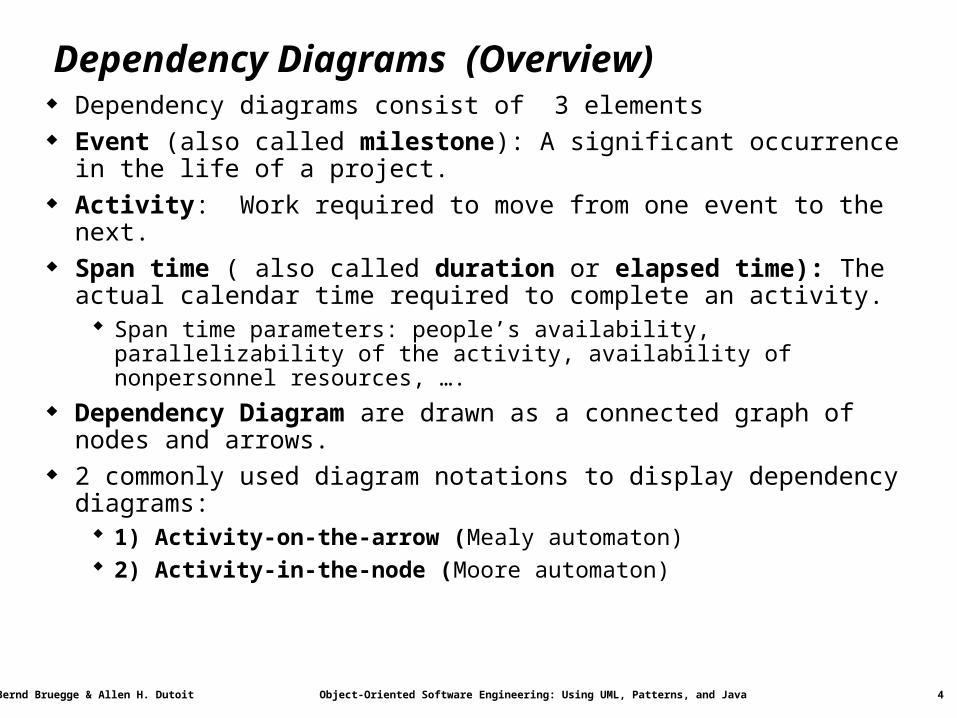
Dependency Diagrams (Overview) Dependency diagrams consist of 3 elements Event (also called milestone): A significant occurrence in the life of a project. Activity: Work required to move from one event to the next. Span time ( also called duration or elapsed time): The actual calendar time
required to complete an activity. Span time parameters: people’s availability, parallelizability of the activity,
availability of nonpersonnel resources, …. Dependency Diagram are drawn as a connected graph of nodes and arrows. 2 commonly used diagram notations to display dependency diagrams:
1) Activity-on-the-arrow (Mealy automaton) 2) Activity-in-the-node (Moore automaton)
Bernd Bruegge & Allen H. Dutoit Object-Oriented Software Engineering: Using UML, Patterns, and Java 5
Why Dependency Diagrams?
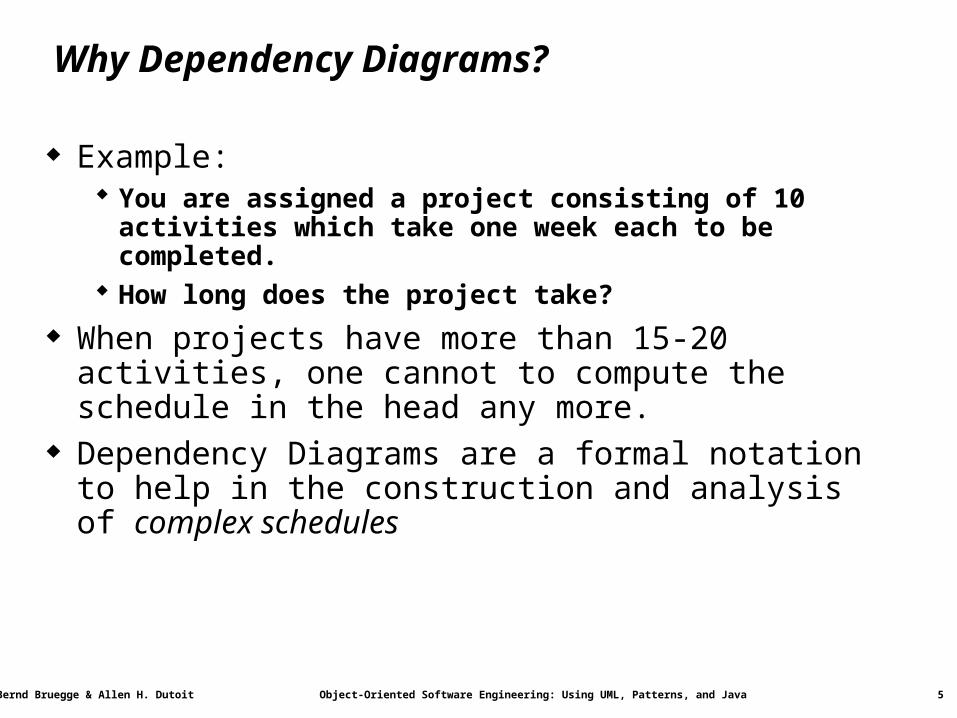
Example: You are assigned a project consisting of 10 activities which take one
week each to be completed. How long does the project take?
When projects have more than 15-20 activities, one cannot to compute the schedule in the head any more.
Dependency Diagrams are a formal notation to help in the construction and analysis of complex schedules
Bernd Bruegge & Allen H. Dutoit Object-Oriented Software Engineering: Using UML, Patterns, and Java 6
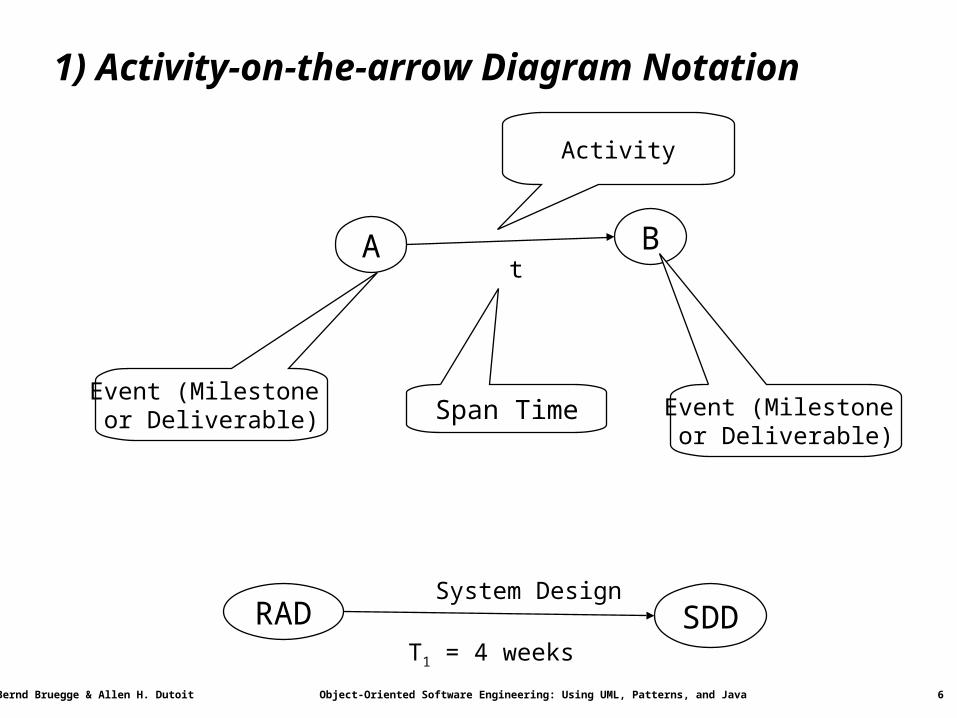
1) Activity-on-the-arrow Diagram Notation
A Bt
Event (Milestone or Deliverable) Event (Milestone
or Deliverable)
Activity
T1 = 4 weeks
RAD SDDSystem Design
Span Time
Bernd Bruegge & Allen H. Dutoit Object-Oriented Software Engineering: Using UML, Patterns, and Java 7
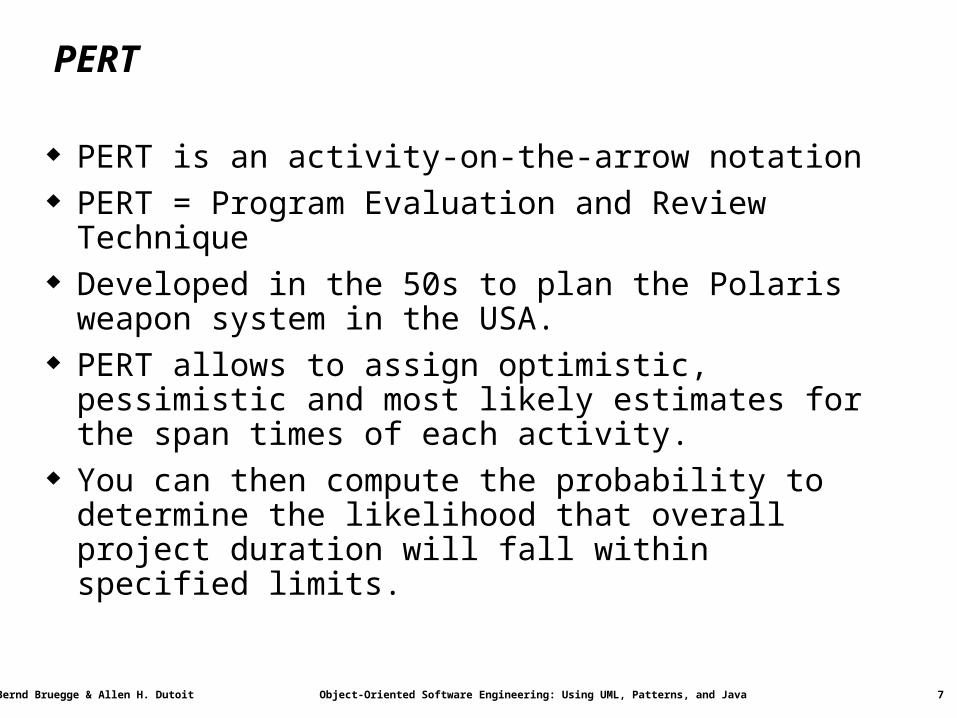
PERT
PERT is an activity-on-the-arrow notation PERT = Program Evaluation and Review Technique Developed in the 50s to plan the Polaris weapon system in the
USA. PERT allows to assign optimistic, pessimistic and most likely
estimates for the span times of each activity. You can then compute the probability to determine the
likelihood that overall project duration will fall within specified limits.
Bernd Bruegge & Allen H. Dutoit Object-Oriented Software Engineering: Using UML, Patterns, and Java 8
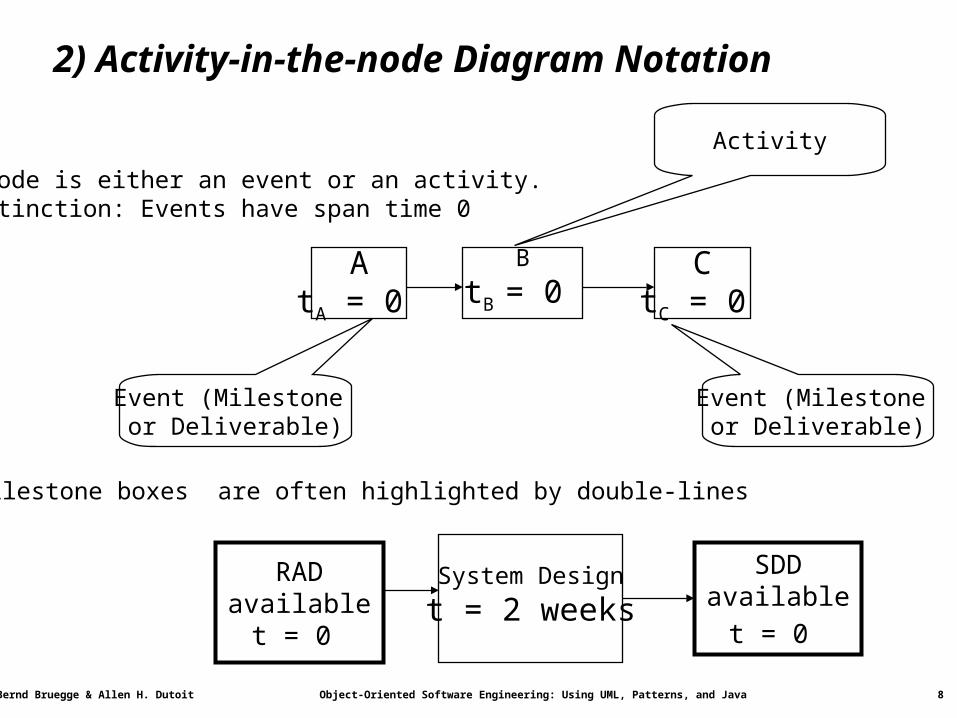
RADavailable
t = 0
System Design
t = 2 weeks
SDDavailable
t = 0
2) Activity-in-the-node Diagram Notation
Event (Milestone or Deliverable)
Event (Milestone or Deliverable)
Activity
A Node is either an event or an activity. Distinction: Events have span time 0
AtA = 0
B
tB = 0 C
tC = 0
Milestone boxes are often highlighted by double-lines
Bernd Bruegge & Allen H. Dutoit Object-Oriented Software Engineering: Using UML, Patterns, and Java 9
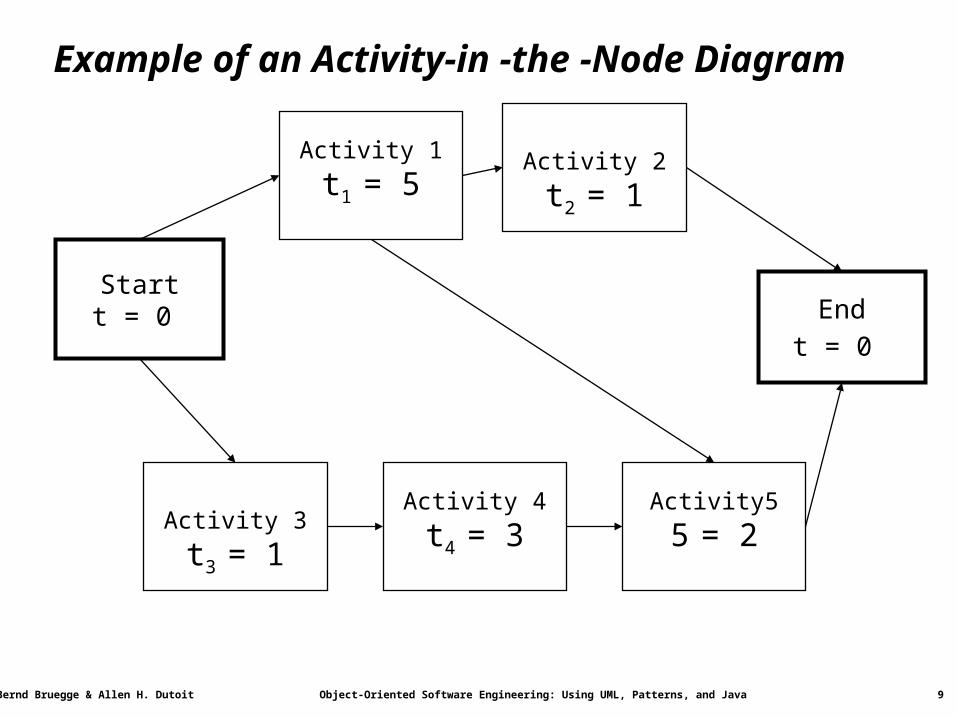
Example of an Activity-in -the -Node Diagram
Activity 3
t3 = 1
Activity 4
t4 = 3
Activity 2
t2 = 1
Startt = 0
Activity 1
t1 = 5
Endt = 0
Activity5
5 = 2
Bernd Bruegge & Allen H. Dutoit Object-Oriented Software Engineering: Using UML, Patterns, and Java 10
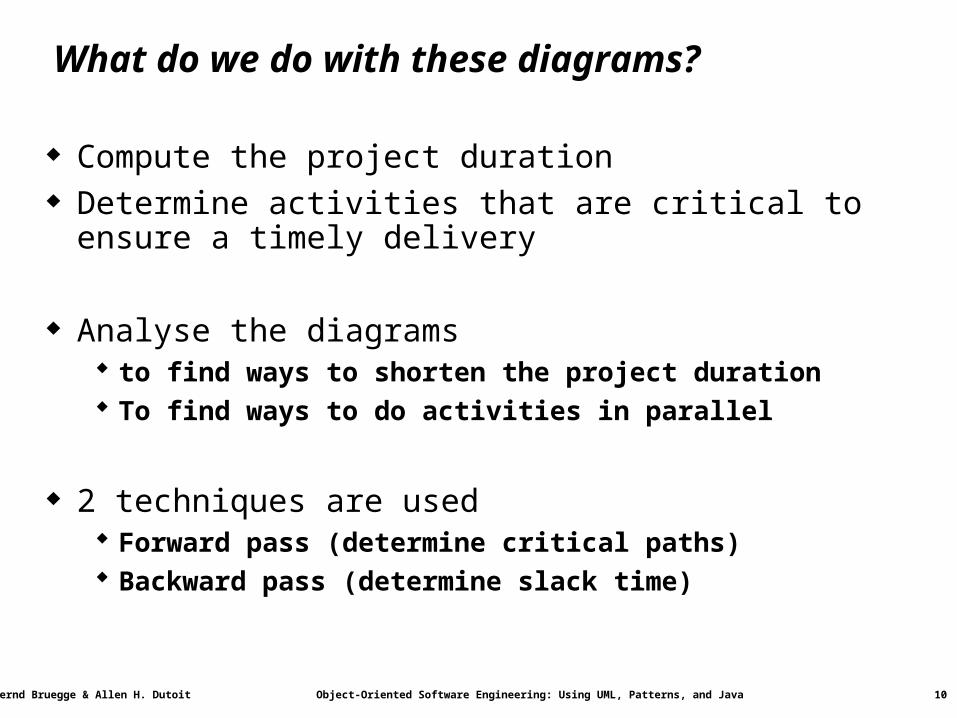
What do we do with these diagrams?
Compute the project duration Determine activities that are critical to ensure a timely delivery
Analyse the diagrams to find ways to shorten the project duration To find ways to do activities in parallel
2 techniques are used Forward pass (determine critical paths) Backward pass (determine slack time)
Bernd Bruegge & Allen H. Dutoit Object-Oriented Software Engineering: Using UML, Patterns, and Java 11
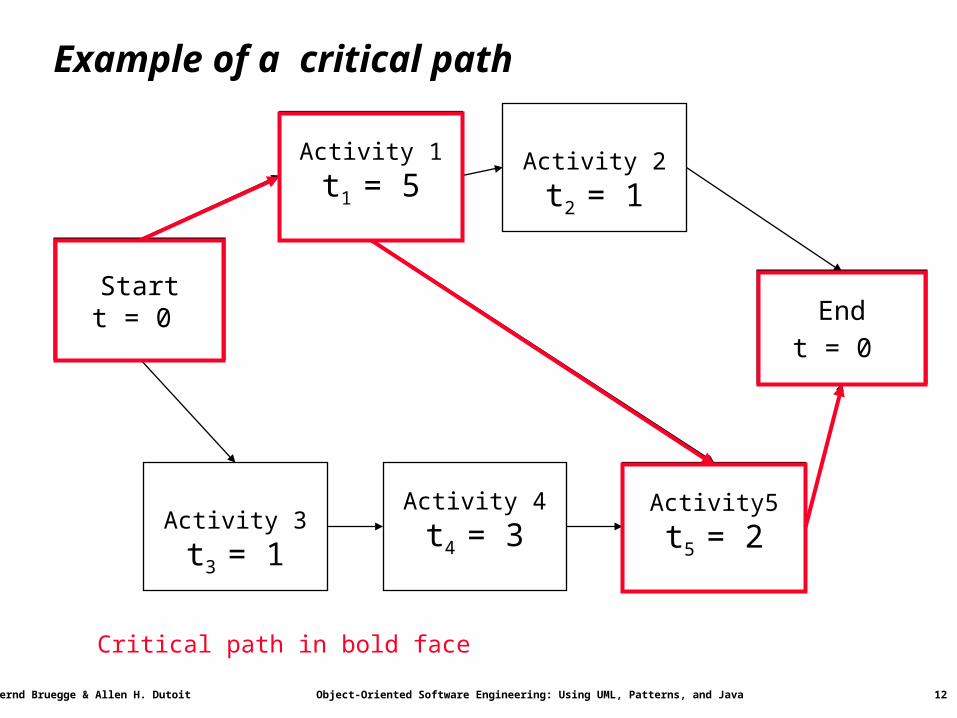
Definitions: Critical Path and Slack Time4
Critical path: A sequence of activities that take the longest time to complete The length of the critical path(s) defines how long your project will
take to complete.
Noncritical path: A sequence of activities that you can delay and still finish the
project in the shortest time possible.
Slack time: The maximum amount of time that you can delay an activity and
still finish your project in the shortest time possible.
Bernd Bruegge & Allen H. Dutoit Object-Oriented Software Engineering: Using UML, Patterns, and Java 12
Example of a critical path
Activity 3
t3 = 1
Activity 4
t4 = 3
Activity 2
t2 = 1
Startt = 0
Activity 1
t1 = 5
Endt = 0
Activity5
5 = 2
Startt = 0
Activity 1
t1 = 5
Endt = 0
Activity5
t5 = 2
Critical path in bold face
Bernd Bruegge & Allen H. Dutoit Object-Oriented Software Engineering: Using UML, Patterns, and Java 13
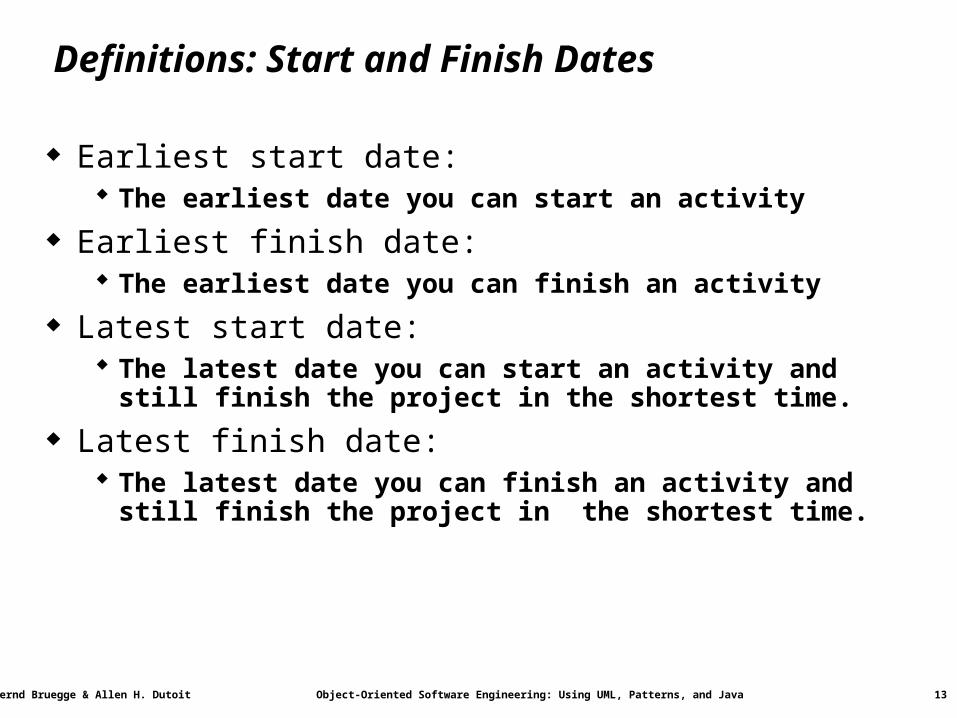
Definitions: Start and Finish Dates
Earliest start date: The earliest date you can start an activity
Earliest finish date: The earliest date you can finish an activity
Latest start date: The latest date you can start an activity and still finish the project
in the shortest time.
Latest finish date: The latest date you can finish an activity and still finish the project
in the shortest time.
Bernd Bruegge & Allen H. Dutoit Object-Oriented Software Engineering: Using UML, Patterns, and Java 14
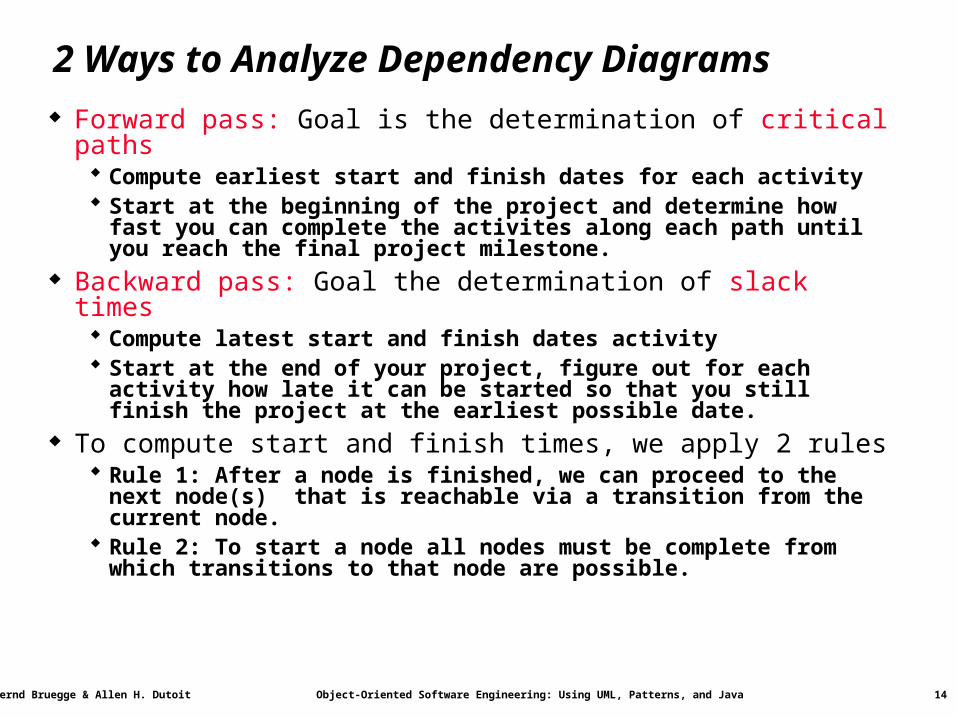
2 Ways to Analyze Dependency Diagrams
Forward pass: Goal is the determination of critical paths Compute earliest start and finish dates for each activity Start at the beginning of the project and determine how fast you
can complete the activites along each path until you reach the final project milestone.
Backward pass: Goal the determination of slack times Compute latest start and finish dates activity Start at the end of your project, figure out for each activity how late
it can be started so that you still finish the project at the earliest possible date.
To compute start and finish times, we apply 2 rules Rule 1: After a node is finished, we can proceed to the next node(s)
that is reachable via a transition from the current node. Rule 2: To start a node all nodes must be complete from which
transitions to that node are possible.
Bernd Bruegge & Allen H. Dutoit Object-Oriented Software Engineering: Using UML, Patterns, and Java 15
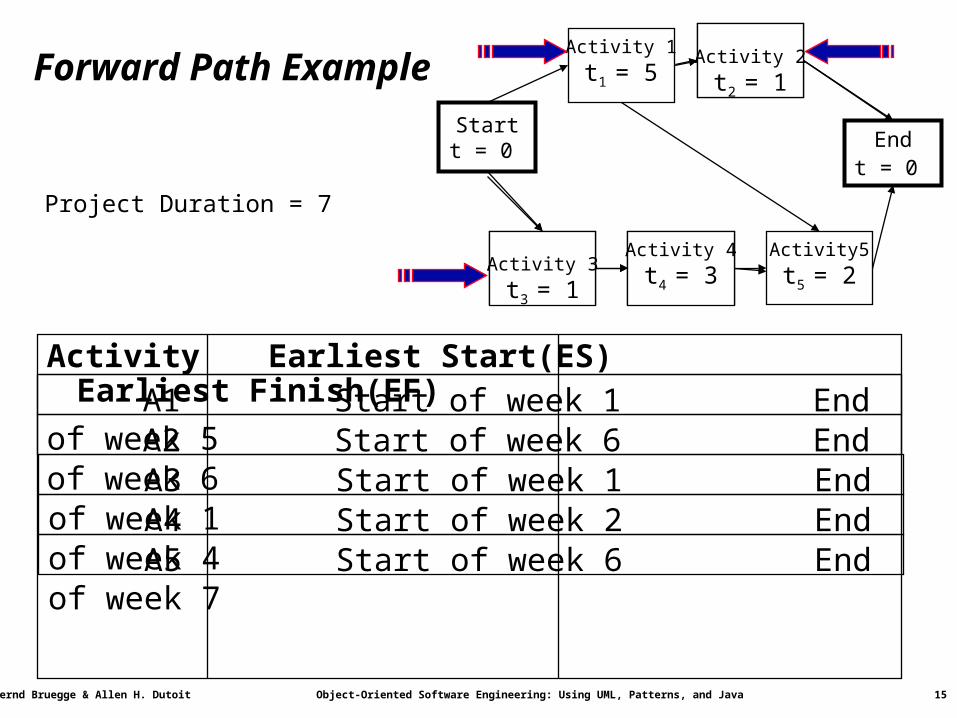
Forward Path Example
Activity Earliest Start(ES) Earliest Finish(EF)
Activity 3
tA = 1
Activity 4
tA = 3
Activity 2
t2 = 1
Startt = 0
Activity 1
t1 = 5
Endt = 0
Activity5
t5 = 2
A1 Start of week 1 End of week 5 A2 Start of week 6 End of week 6 A3 Start of week 1 End of week 1
A5 Start of week 6 End of week 7
A4 Start of week 2 End of week 4
Activity 3
t3 = 1
Activity 4
t4 = 3
Activity 2
t2 = 1
Project Duration = 7
Bernd Bruegge & Allen H. Dutoit Object-Oriented Software Engineering: Using UML, Patterns, and Java 16
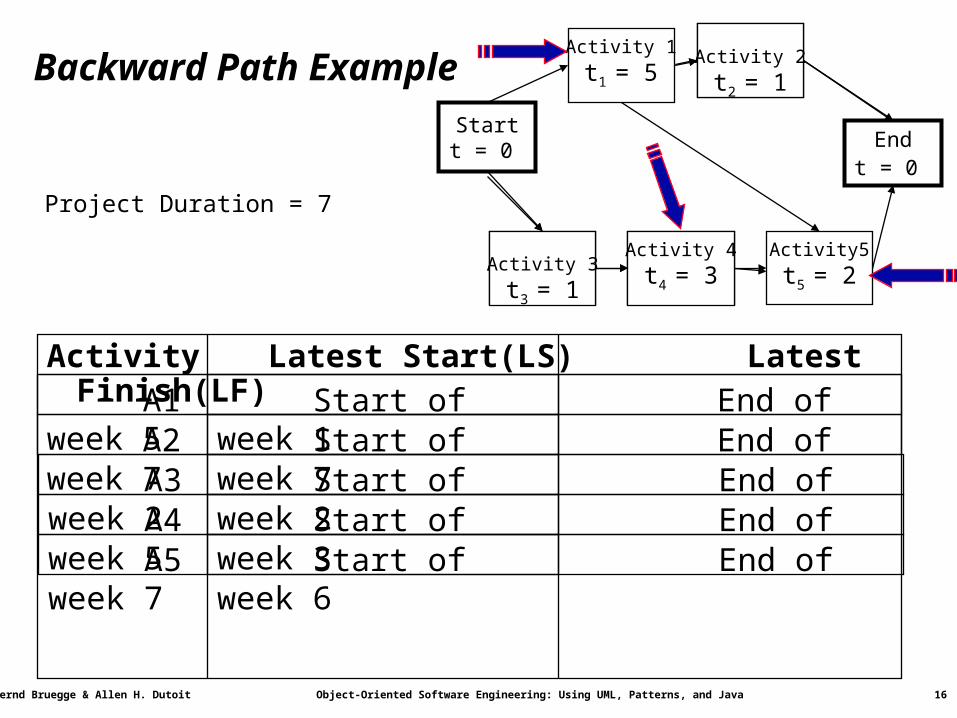
Backward Path Example
Activity Latest Start(LS) Latest Finish(LF)
Activity 3
tA = 1
Activity 4
tA = 3
Activity 2
t2 = 1
Startt = 0
Activity 1
t1 = 5
Endt = 0
Activity5
t5 = 2
A2 End of week 7 A3 End of week 2
A5 End of week 7
A1 End of week 5
A4 End of week 5
Activity 3
t3 = 1
Activity 4
t4 = 3
Activity 2
t2 = 1
Start of week 6
Project Duration = 7
Start of week 3
Start of week 1Start of week 7Start of week 2
Bernd Bruegge & Allen H. Dutoit Object-Oriented Software Engineering: Using UML, Patterns, and Java 17
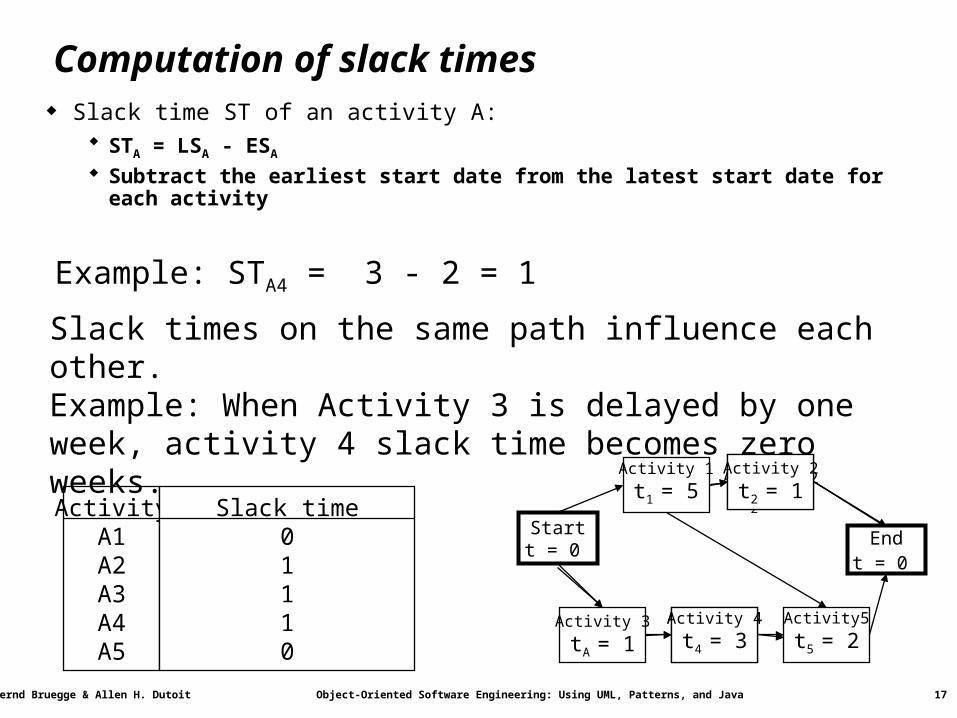
Computation of slack times Slack time ST of an activity A:
STA = LSA - ESA Subtract the earliest start date from the latest start date for each activity
Activity 3
tA = 1Activity 4
tA = 3
Activity 2
t2 = 1Startt = 0
Activity 1
t1 = 5
Endt = 0
Activity5
t5 = 2Activity 4
t4 = 3
Activity 2
t2 = 1Activity
A1A2A3A4A5
Slack time01110
Slack times on the same path influence each other. Example: When Activity 3 is delayed by one week, activity 4 slack time becomes zero weeks.
Example: STA4 = 3 - 2 = 1
Bernd Bruegge & Allen H. Dutoit Object-Oriented Software Engineering: Using UML, Patterns, and Java 18
Path types in dependency graphs
Critical path: Any path in a dependency diagram, in which all activities have zero slack time.
Noncritical path: Any path with at least one activity that has a nonzero slack time.
Overcritical path: A path with at least one activity that has a negative slack time. Overcritical paths should be considered as serious warnings: Your
plan contains unreal time estimates Any dependency diagram with no fixed intermediate milestones
has at least one critical path. A project schedule with fixed intermediate milestones might
have no critical path Example: The analysis review must be done 1 month after project
start, the estimated time for all activities before the review is 3 weeks.
Bernd Bruegge & Allen H. Dutoit Object-Oriented Software Engineering: Using UML, Patterns, and Java 19
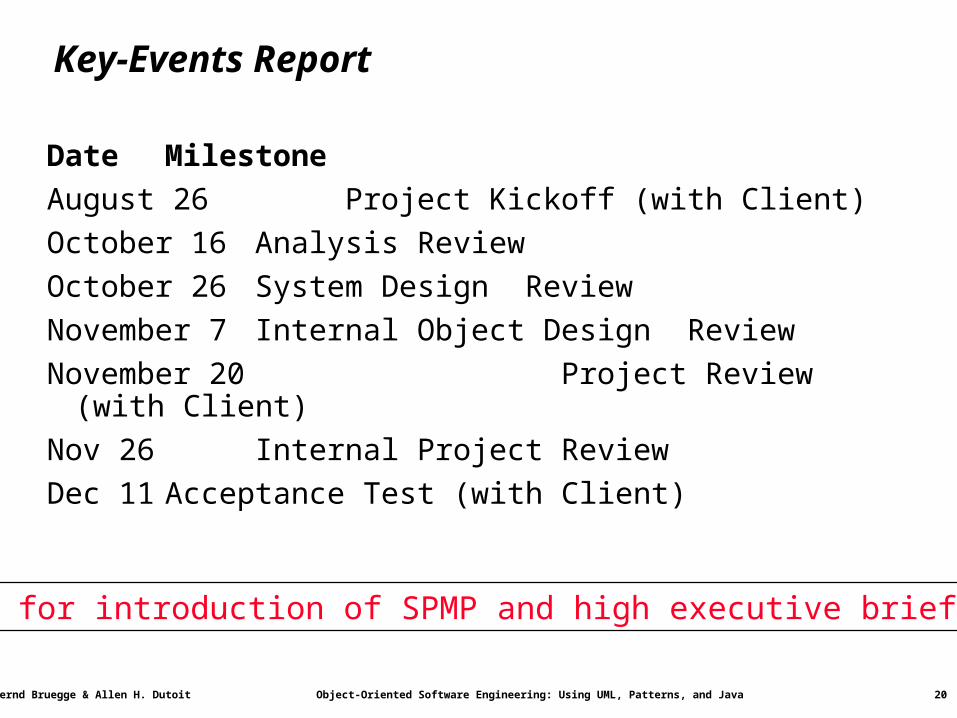
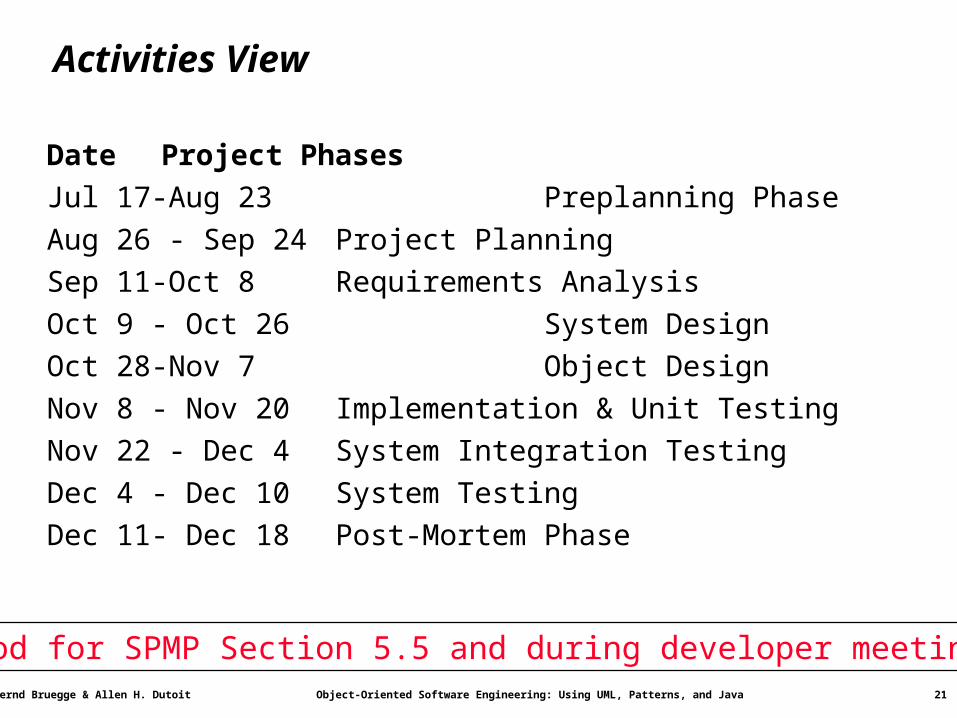
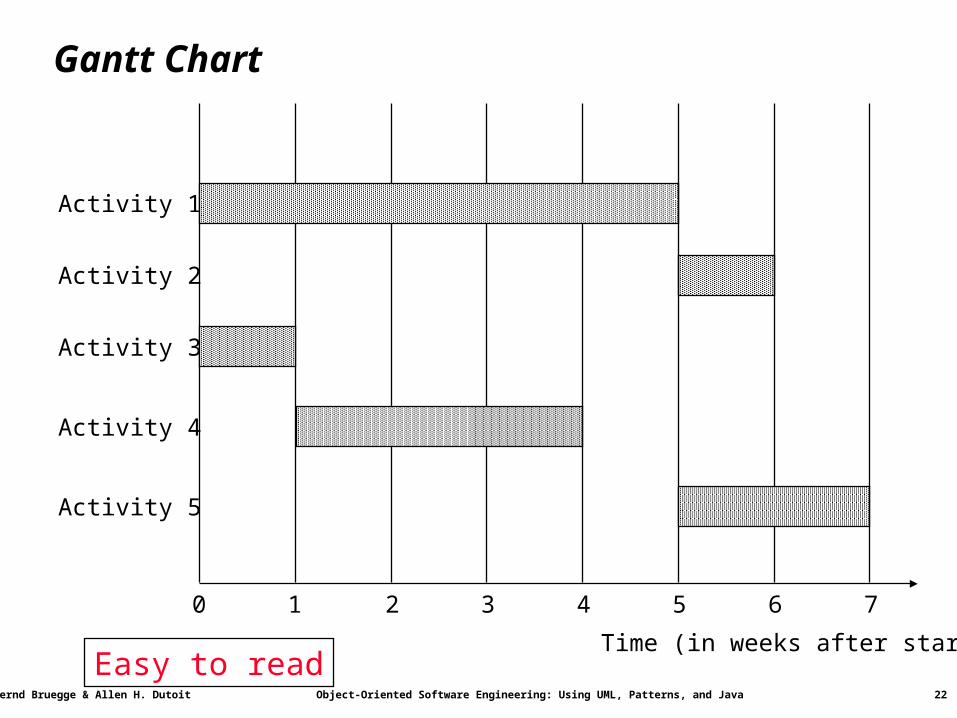
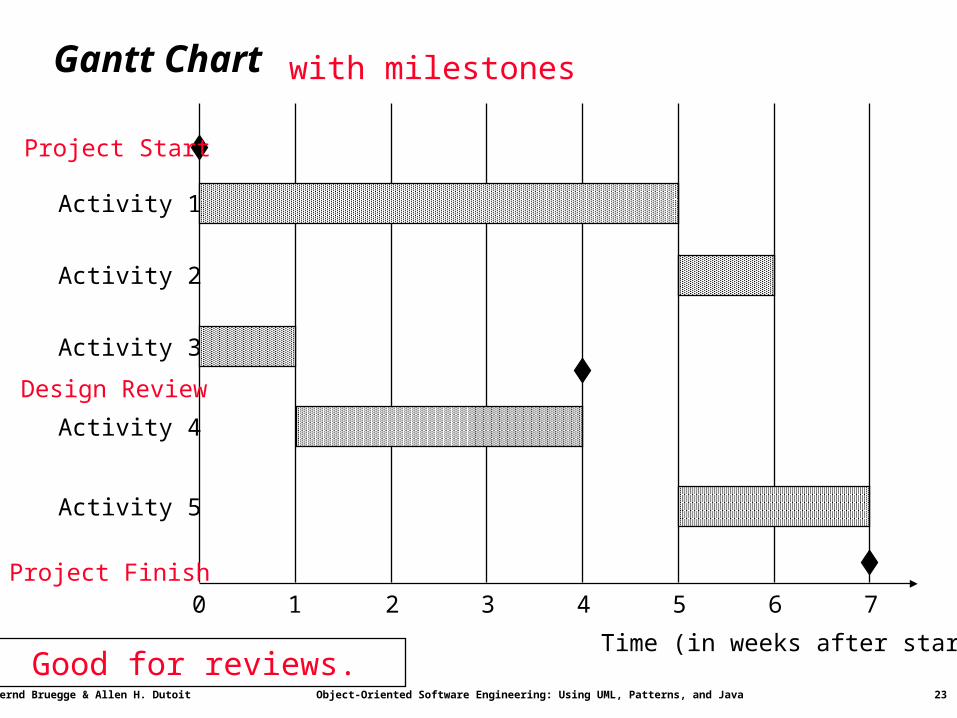
Frequently used formats for dependency graphs
Milestone View (“Key-Events report”): A table that lists milestones and the dates on which you plan to
reach them.
Activities View: A table that lists the activities and the dates on which you plan to
start and end them
Gantt chart View: A graphical illustrating on a timeline when each activity will start,
be performed and end.
Combined Gantt Chart and Milestone View: The Gantt Chart contains activities as well as milestones.
Bernd Bruegge & Allen H. Dutoit Object-Oriented Software Engineering: Using UML, Patterns, and Java 20
Key-Events Report
Date Milestone
August 26 Project Kickoff (with Client)
October 16 Analysis Review
October 26 System Design Review
November 7 Internal Object Design Review
November 20 Project Review (with Client)
Nov 26 Internal Project Review
Dec 11 Acceptance Test (with Client)
Good for introduction of SPMP and high executive briefings
Bernd Bruegge & Allen H. Dutoit Object-Oriented Software Engineering: Using UML, Patterns, and Java 21
Activities View
Date Project Phases
Jul 17-Aug 23 Preplanning Phase
Aug 26 - Sep 24 Project Planning
Sep 11-Oct 8 Requirements Analysis
Oct 9 - Oct 26 System Design
Oct 28-Nov 7 Object Design
Nov 8 - Nov 20 Implementation & Unit Testing
Nov 22 - Dec 4 System Integration Testing
Dec 4 - Dec 10 System Testing
Dec 11- Dec 18 Post-Mortem Phase
Good for SPMP Section 5.5 and during developer meetings
Bernd Bruegge & Allen H. Dutoit Object-Oriented Software Engineering: Using UML, Patterns, and Java 22
Gantt Chart
Time (in weeks after start)
Activity 1
Activity 2
1 2 3 4 5 6 70
Activity 3
Activity 4
Activity 5
Easy to read
Bernd Bruegge & Allen H. Dutoit Object-Oriented Software Engineering: Using UML, Patterns, and Java 23
Gantt Chart
Time (in weeks after start)
Activity 1
Activity 2
1 2 3 4 5 6 70
Activity 3
Activity 4
Activity 5
Project Start
Project Finish
with milestones
Good for reviews.
Design Review
Bernd Bruegge & Allen H. Dutoit Object-Oriented Software Engineering: Using UML, Patterns, and Java 24
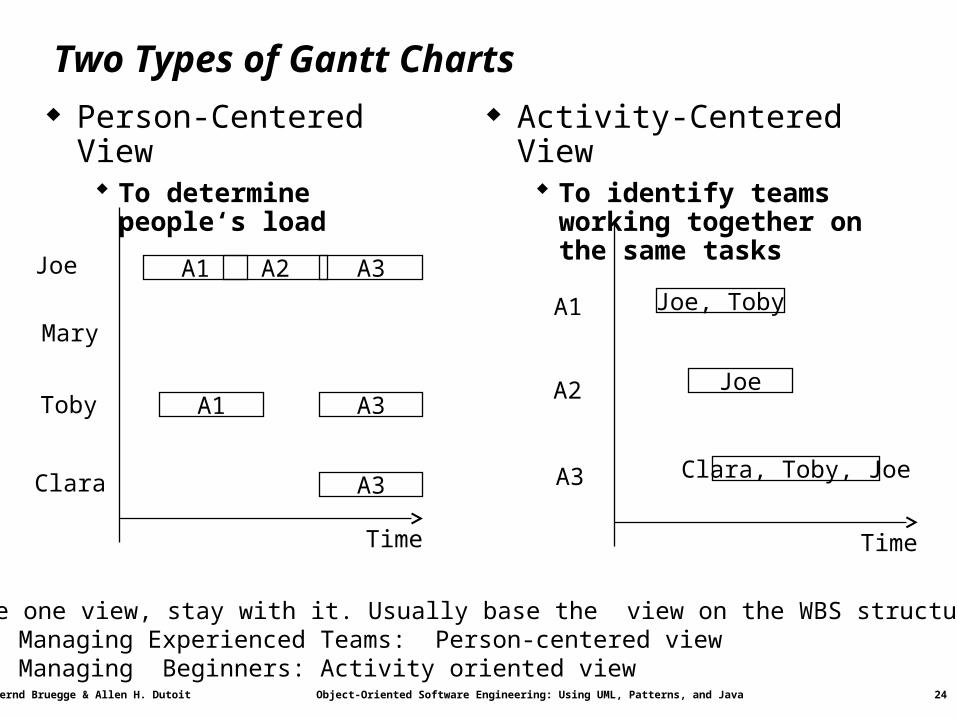
Two Types of Gantt Charts Person-Centered View
To determine people‘s load
Activity-Centered View To identify teams working
together on the same tasks
Time Time
Joe
Mary
Toby
Clara
A1 A3Joe, Toby
A1 A3
A1
A2
A3
Joe
A2
Clara, Toby, JoeA3
Choose one view, stay with it. Usually base the view on the WBS structureManaging Experienced Teams: Person-centered viewManaging Beginners: Activity oriented view
Bernd Bruegge & Allen H. Dutoit Object-Oriented Software Engineering: Using UML, Patterns, and Java 25
Tools support for Establishing Schedules Tool support for
Graphical user interface for entering activity data Automatic computation of critical paths Multiple views (PERT, Gantt, table views) and switching between
these views Many products available. Examples
Fast Track (Demo) (http://www.aecsoft.com/downloads/demo/downloads_listindex.asp?bhcp=1)
Main view: Gantt Charts Microsoft Project
(http://www.microsoft.com/office/project/default.asp) PERT Charts, Gantt Charts, combined Milestone/Gantt Charts
Tool use and training beyond the scope of this class
Bernd Bruegge & Allen H. Dutoit Object-Oriented Software Engineering: Using UML, Patterns, and Java 27
How to develop an Initial Project Schedule
Identify all your activities (reuse a template if possible) Identify intermediate and final dates that must be met
Assign milestones to these dates
Identify all activities and milestones outside your project that may affect your project’s schedule
Identify “depends on” relationships between all these identified activities
Draw a dependency diagram for all identified activities and relationships
Analyze the diagram to determine critical paths and slack times of noncritical paths.
Example: Establish a schedule for system integration testing
Bernd Bruegge & Allen H. Dutoit Object-Oriented Software Engineering: Using UML, Patterns, and Java 28
Developing a Schedule for Integration Testing
Five Steps:
1. Start with System Decomposition
2. Determine your Integration Testing Strategy
3. Determine the Dependency Diagram (UML Activity Diagram)
4. Add Time Estimates
5. Visualize the activities on a time scale: Gantt Chart
See Bruegge&Dutoit 2003, Chapter 9 Testing
Bernd Bruegge & Allen H. Dutoit Object-Oriented Software Engineering: Using UML, Patterns, and Java 29
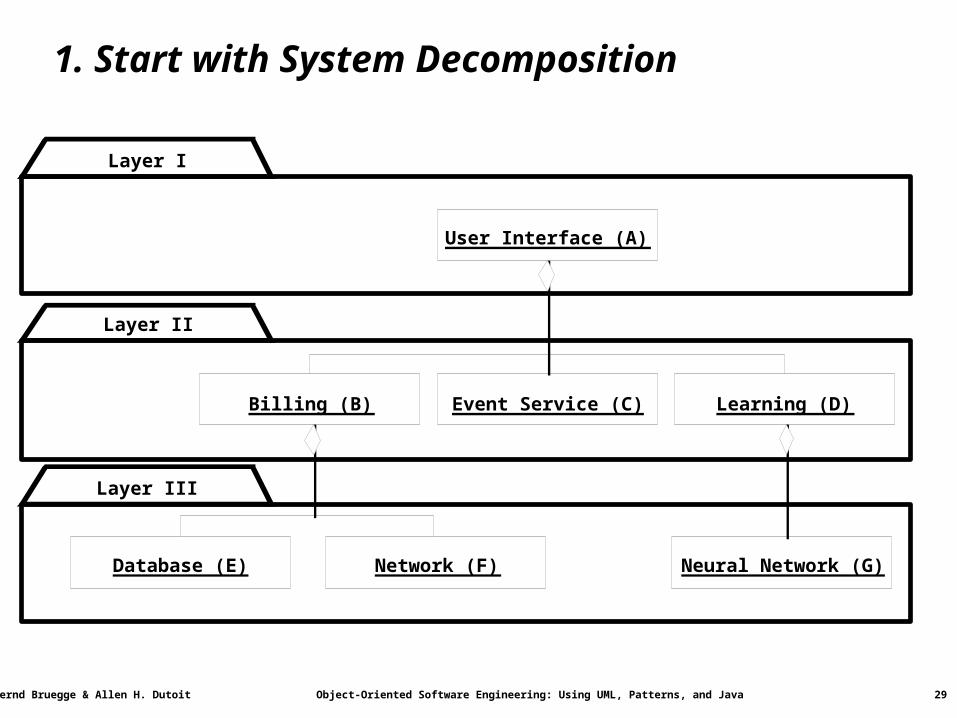
1. Start with System Decomposition
User Interface (A)
Billing (B) Event Service (C) Learning (D)
Database (E) Network (F) Neural Network (G)
Layer III
Layer II
Layer I
Bernd Bruegge & Allen H. Dutoit Object-Oriented Software Engineering: Using UML, Patterns, and Java 30
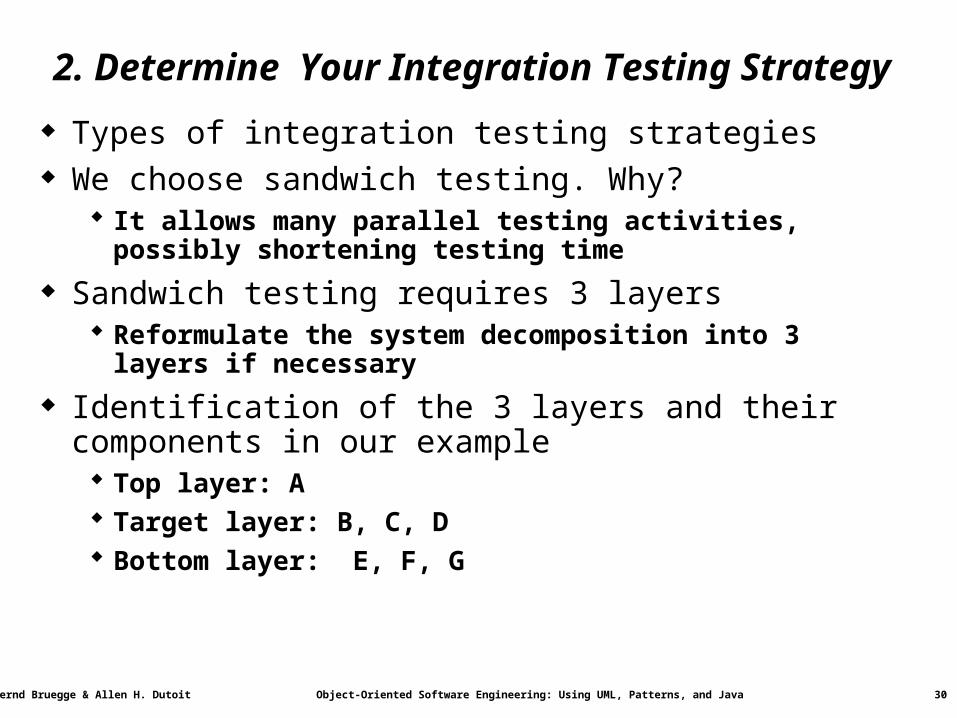
2. Determine Your Integration Testing Strategy
Types of integration testing strategies We choose sandwich testing. Why?
It allows many parallel testing activities, possibly shortening testing time
Sandwich testing requires 3 layers Reformulate the system decomposition into 3 layers if necessary
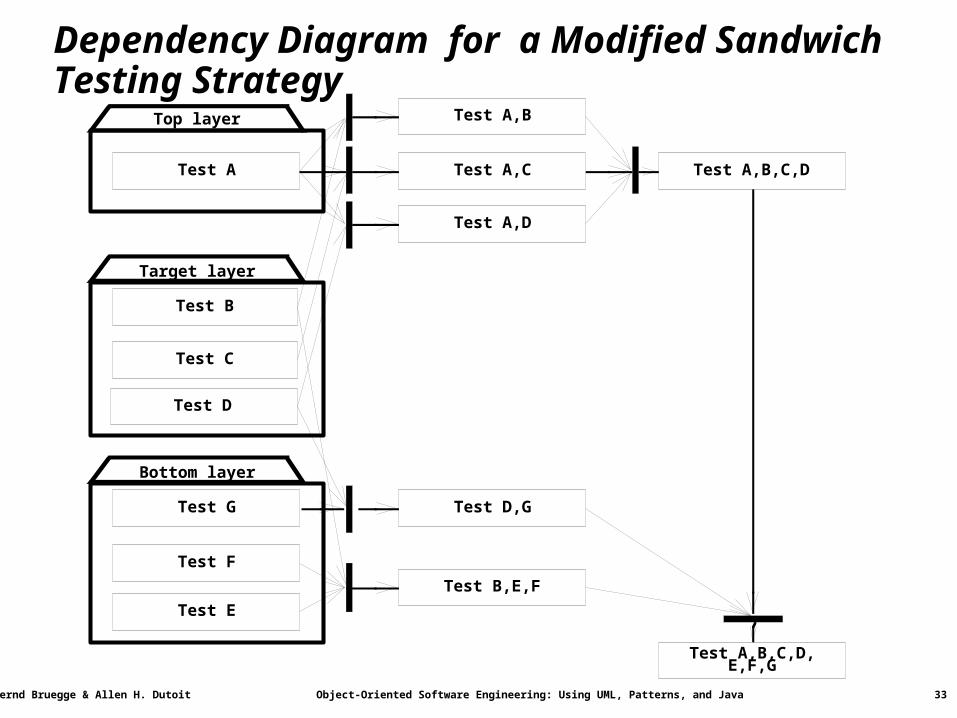
Identification of the 3 layers and their components in our example Top layer: A Target layer: B, C, D Bottom layer: E, F, G
Bernd Bruegge & Allen H. Dutoit Object-Oriented Software Engineering: Using UML, Patterns, and Java 31
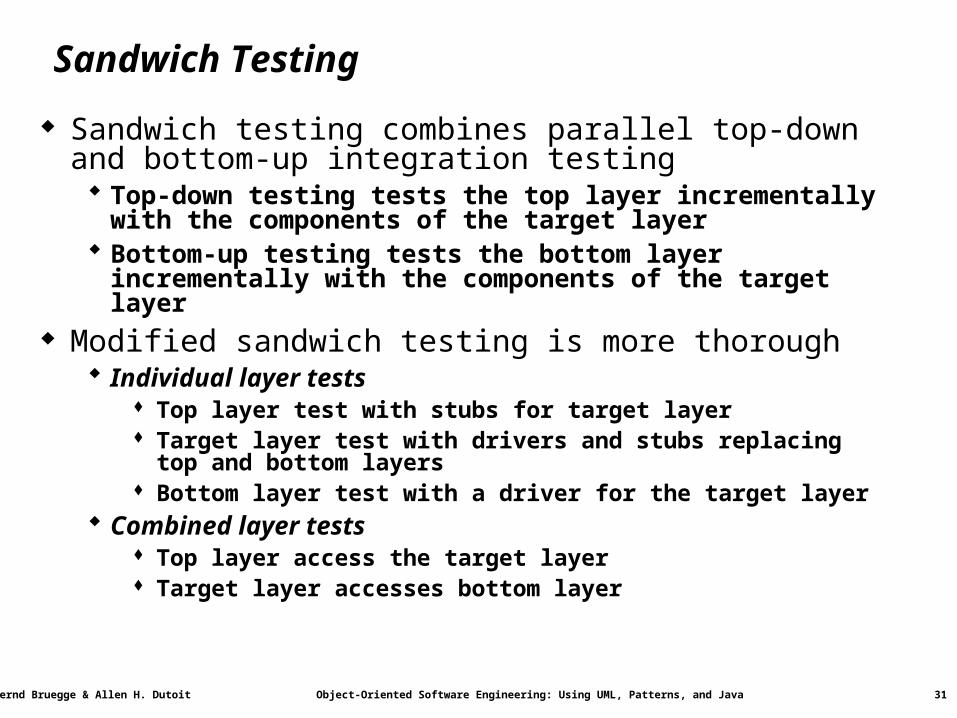
Sandwich Testing
Sandwich testing combines parallel top-down and bottom-up integration testing Top-down testing tests the top layer incrementally with the
components of the target layer Bottom-up testing tests the bottom layer incrementally with the
components of the target layer Modified sandwich testing is more thorough
Individual layer tests Top layer test with stubs for target layer Target layer test with drivers and stubs replacing top and bottom
layers Bottom layer test with a driver for the target layer
Combined layer tests Top layer access the target layer Target layer accesses bottom layer
Bernd Bruegge & Allen H. Dutoit Object-Oriented Software Engineering: Using UML, Patterns, and Java 32
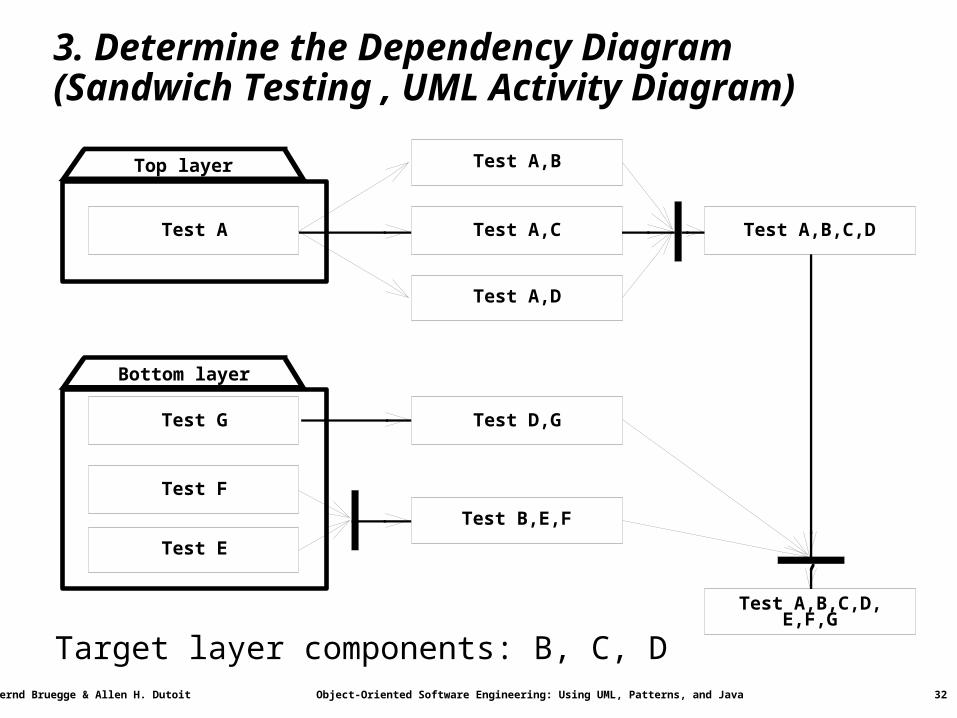
3. Determine the Dependency Diagram (Sandwich Testing , UML Activity Diagram)
Test A
Test G
Test B,E,F
Test D,G
Test A,D
Test A,B
Test A,C Test A,B,C,D
E,F,GTest A,B,C,D,
Test E
Test F
Top layer
Bottom layer
Target layer components: B, C, D
Bernd Bruegge & Allen H. Dutoit Object-Oriented Software Engineering: Using UML, Patterns, and Java 33
Dependency Diagram for a Modified Sandwich Testing Strategy
Test A
Test G
Test B,E,F
Test D,G
Test A,D
Test A,B
Test A,C Test A,B,C,D
E,F,GTest A,B,C,D,
Test E
Test F
Test B
Test C
Test D
Top layer
Target layer
Bottom layer
Bernd Bruegge & Allen H. Dutoit Object-Oriented Software Engineering: Using UML, Patterns, and Java 34
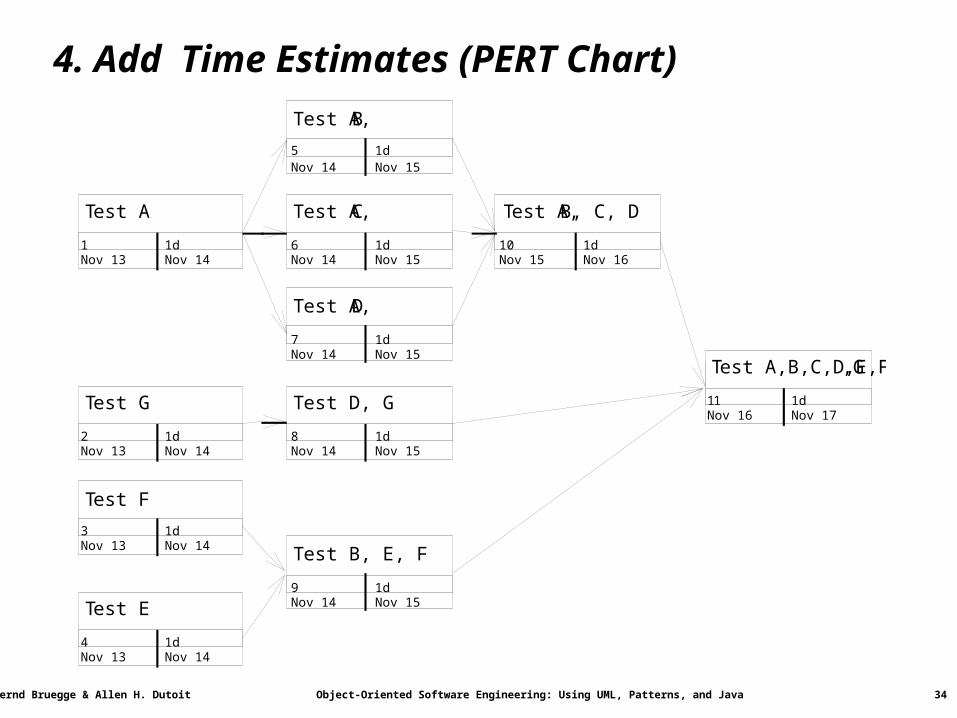
4. Add Time Estimates (PERT Chart)
Test A
1Nov 13
1dNov 14
Test A, B
5Nov 14
1dNov 15
Test A, C
6Nov 14
1dNov 15
Test A, D
7Nov 14
1dNov 15
Test A, B, C, D
10Nov 15
1dNov 16
Test G
2Nov 13
1dNov 14
Test F
3Nov 13
1dNov 14
Test E
4Nov 13
1dNov 14
Test D, G
8Nov 14
1dNov 15
Test B, E, F
9Nov 14
1dNov 15
Test A,B,C,D,E,F,G
11Nov 16
1dNov 17
Bernd Bruegge & Allen H. Dutoit Object-Oriented Software Engineering: Using UML, Patterns, and Java 35
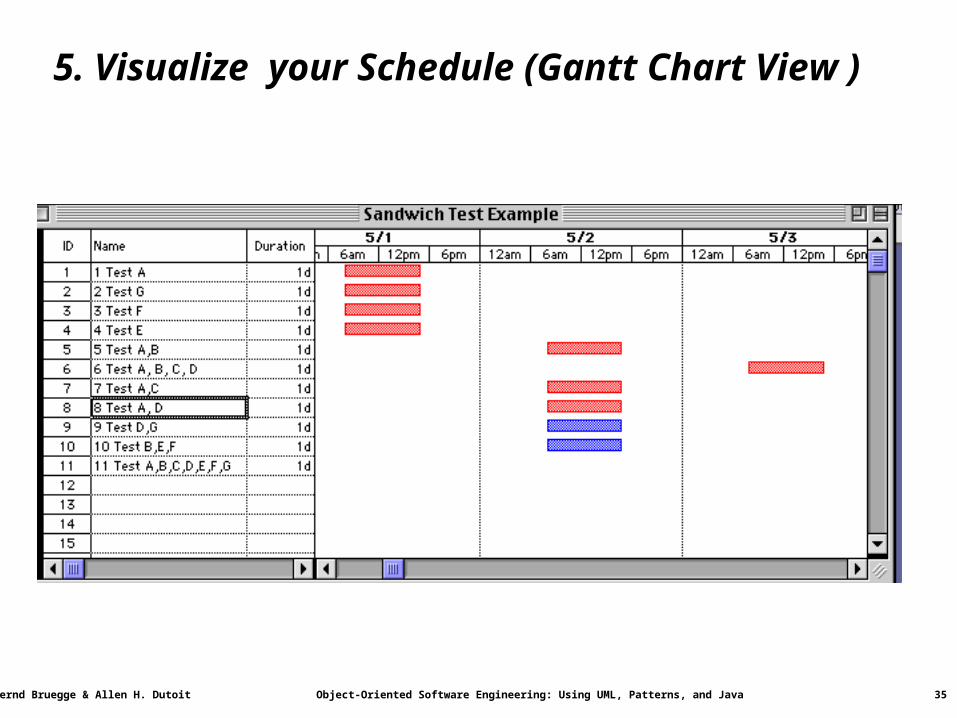
5. Visualize your Schedule (Gantt Chart View )
Bernd Bruegge & Allen H. Dutoit Object-Oriented Software Engineering: Using UML, Patterns, and Java 37
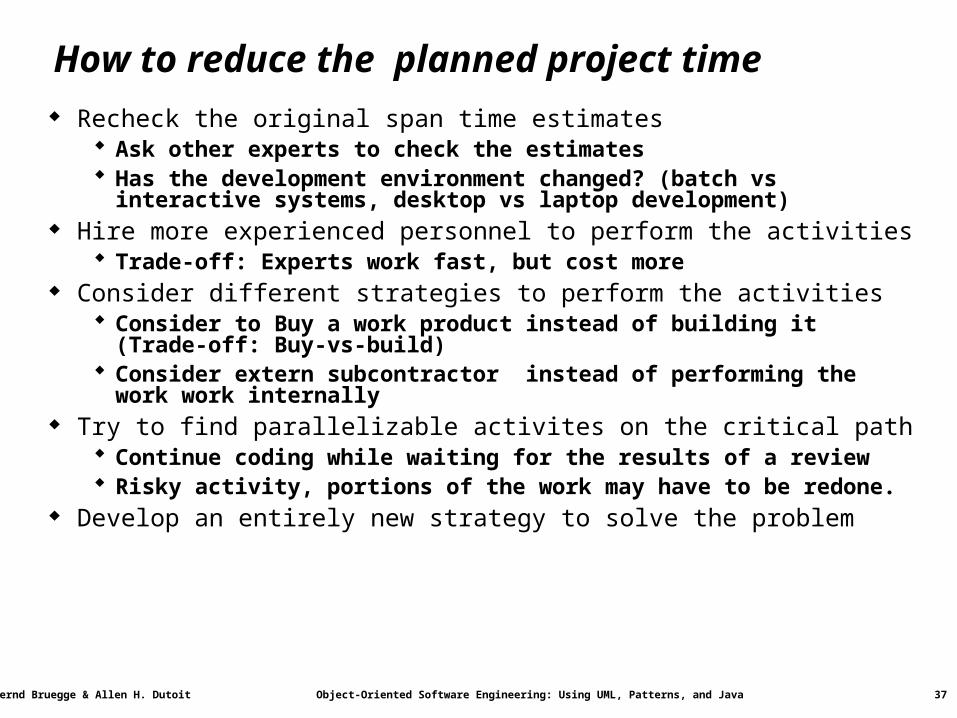
How to reduce the planned project time Recheck the original span time estimates
Ask other experts to check the estimates Has the development environment changed? (batch vs interactive systems,
desktop vs laptop development) Hire more experienced personnel to perform the activities
Trade-off: Experts work fast, but cost more Consider different strategies to perform the activities
Consider to Buy a work product instead of building it (Trade-off: Buy-vs-build)
Consider extern subcontractor instead of performing the work work internally
Try to find parallelizable activites on the critical path Continue coding while waiting for the results of a review Risky activity, portions of the work may have to be redone.
Develop an entirely new strategy to solve the problem
Bernd Bruegge & Allen H. Dutoit Object-Oriented Software Engineering: Using UML, Patterns, and Java 38
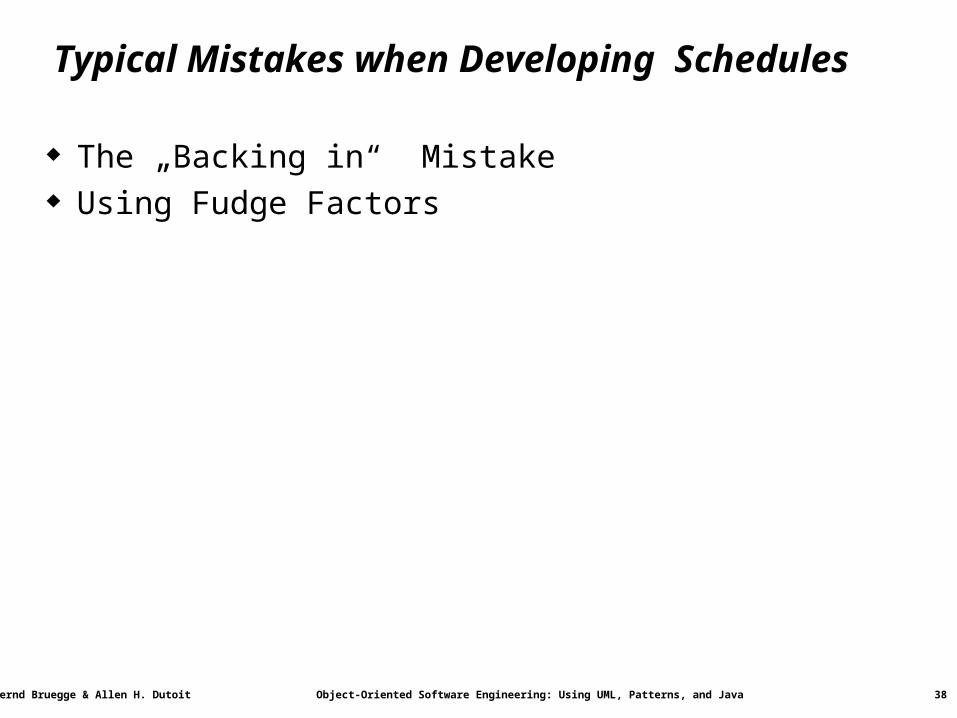
Typical Mistakes when Developing Schedules
The „Backing in“ Mistake Using Fudge Factors
Bernd Bruegge & Allen H. Dutoit Object-Oriented Software Engineering: Using UML, Patterns, and Java 39
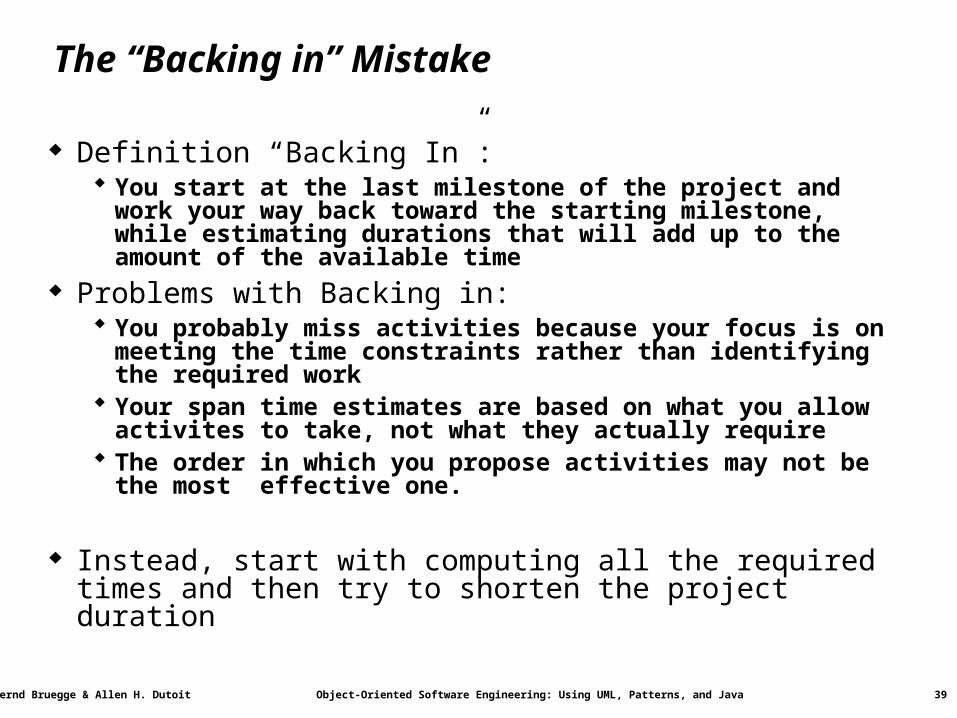
The “Backing in” Mistake
Definition “Backing In”: You start at the last milestone of the project and work your way
back toward the starting milestone, while estimating durations that will add up to the amount of the available time
Problems with Backing in: You probably miss activities because your focus is on meeting the
time constraints rather than identifying the required work Your span time estimates are based on what you allow activites to
take, not what they actually require The order in which you propose activities may not be the most
effective one.
Instead, start with computing all the required times and then try to shorten the project duration
Bernd Bruegge & Allen H. Dutoit Object-Oriented Software Engineering: Using UML, Patterns, and Java 40
Using Fudge Factors
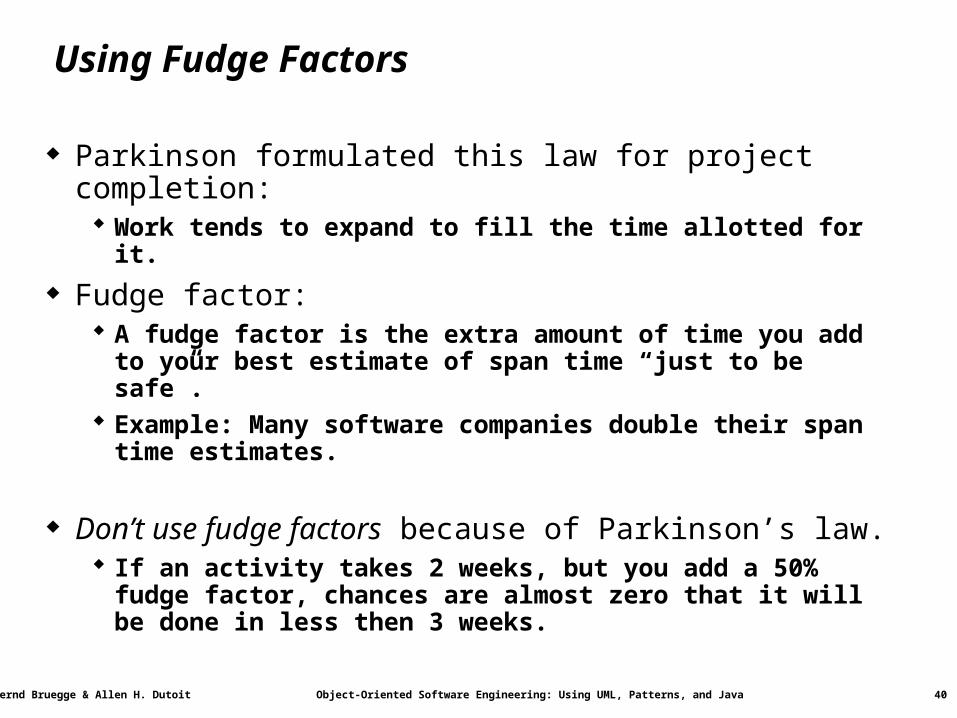
Parkinson formulated this law for project completion: Work tends to expand to fill the time allotted for it.
Fudge factor: A fudge factor is the extra amount of time you add to your best
estimate of span time “just to be safe”. Example: Many software companies double their span time
estimates.
Don’t use fudge factors because of Parkinson’s law. If an activity takes 2 weeks, but you add a 50% fudge factor,
chances are almost zero that it will be done in less then 3 weeks.
Bernd Bruegge & Allen H. Dutoit Object-Oriented Software Engineering: Using UML, Patterns, and Java 41
Heuristics for dealing with time
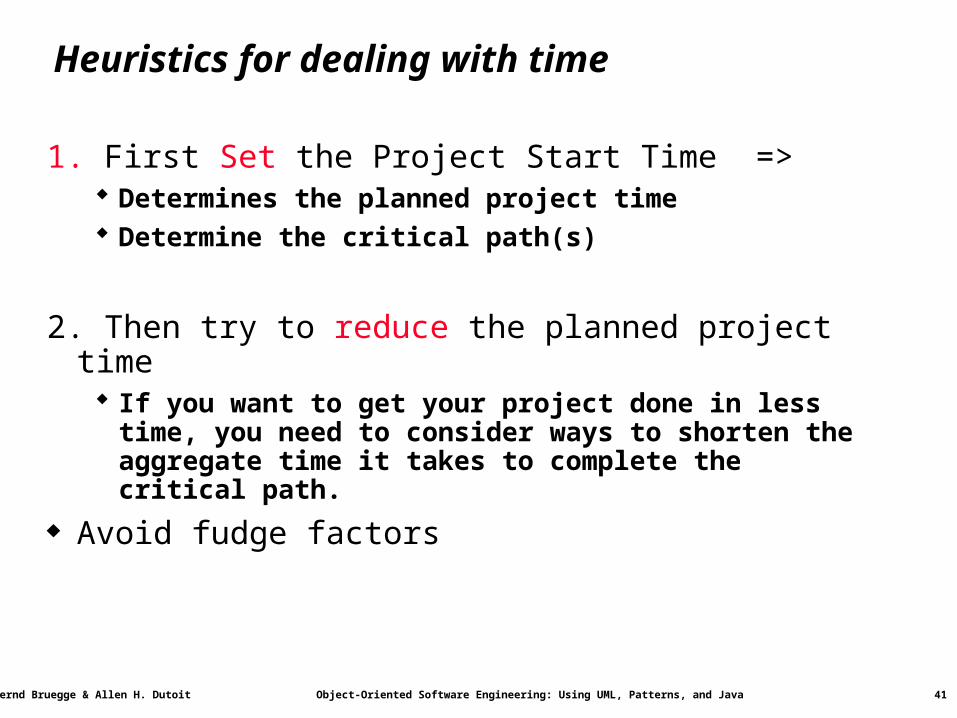
1. First Set the Project Start Time => Determines the planned project time Determine the critical path(s)
2. Then try to reduce the planned project time If you want to get your project done in less time, you need to
consider ways to shorten the aggregate time it takes to complete the critical path.
Avoid fudge factors
Bernd Bruegge & Allen H. Dutoit Object-Oriented Software Engineering: Using UML, Patterns, and Java 44
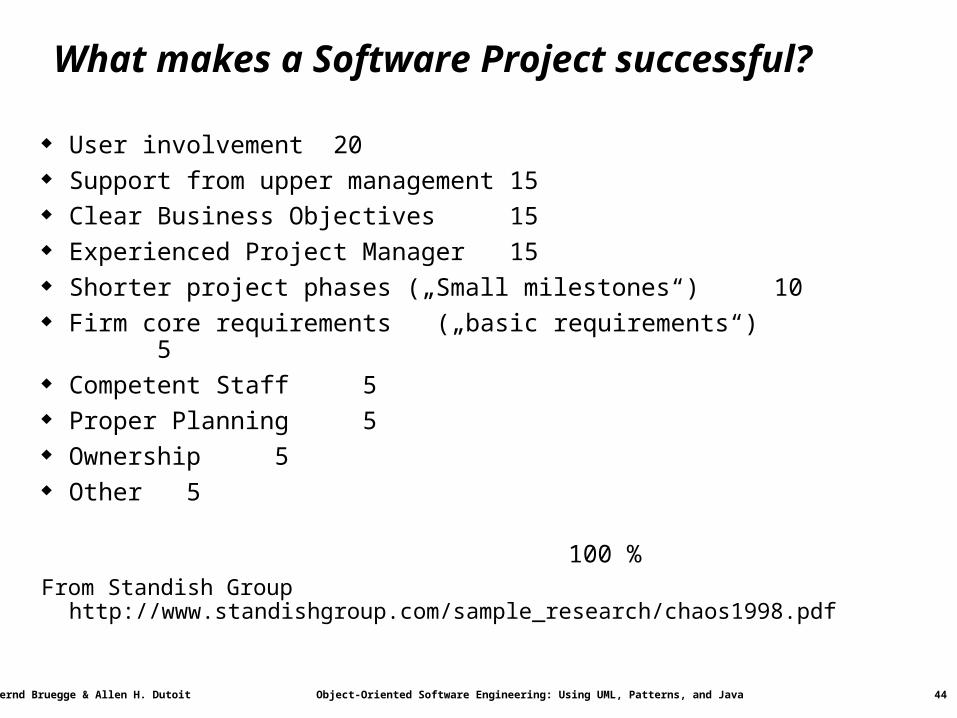
What makes a Software Project successful?
User involvement 20 Support from upper management 15 Clear Business Objectives 15 Experienced Project Manager 15 Shorter project phases („Small milestones“) 10 Firm core requirements („basic requirements“) 5 Competent Staff 5 Proper Planning 5 Ownership 5 Other 5
100 %From Standish Group http://www.standishgroup.com/sample_research/chaos1998.pdf
Bernd Bruegge & Allen H. Dutoit Object-Oriented Software Engineering: Using UML, Patterns, and Java 45
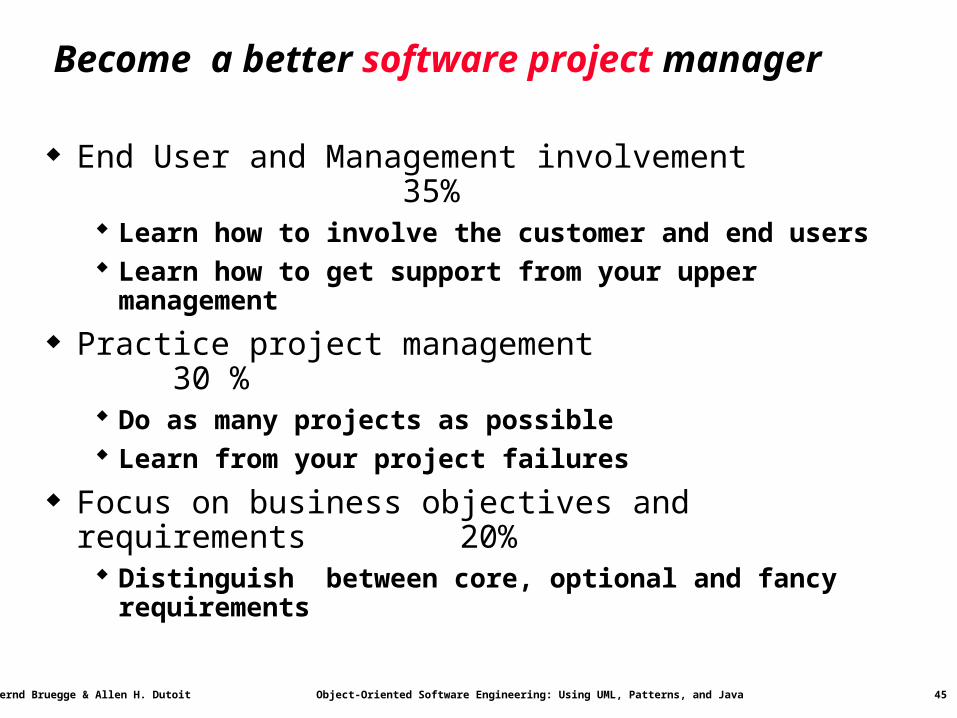
Become a better software project manager
End User and Management involvement 35% Learn how to involve the customer and end users Learn how to get support from your upper management
Practice project management 30 % Do as many projects as possible Learn from your project failures
Focus on business objectives and requirements 20% Distinguish between core, optional and fancy requirements
Bernd Bruegge & Allen H. Dutoit Object-Oriented Software Engineering: Using UML, Patterns, and Java 48
Summary
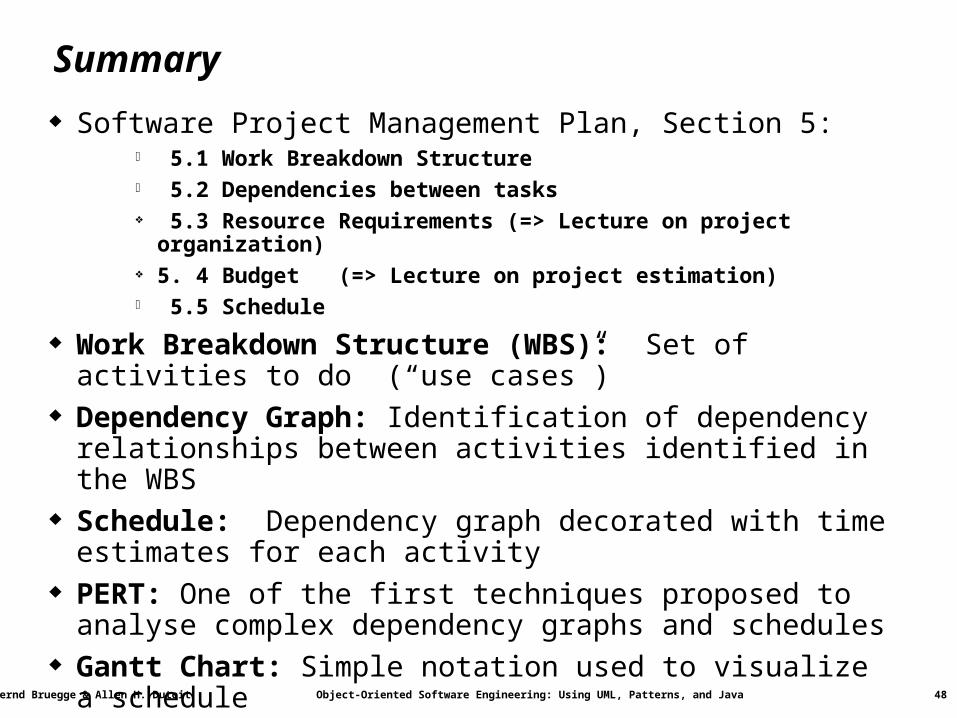
Software Project Management Plan, Section 5: 5.1 Work Breakdown Structure 5.2 Dependencies between tasks 5.3 Resource Requirements (=> Lecture on project organization) 5. 4 Budget (=> Lecture on project estimation) 5.5 Schedule
Work Breakdown Structure (WBS): Set of activities to do (“use cases”)
Dependency Graph: Identification of dependency relationships between activities identified in the WBS
Schedule: Dependency graph decorated with time estimates for each activity
PERT: One of the first techniques proposed to analyse complex dependency graphs and schedules
Gantt Chart: Simple notation used to visualize a schedule
Bernd Bruegge & Allen H. Dutoit Object-Oriented Software Engineering: Using UML, Patterns, and Java 49
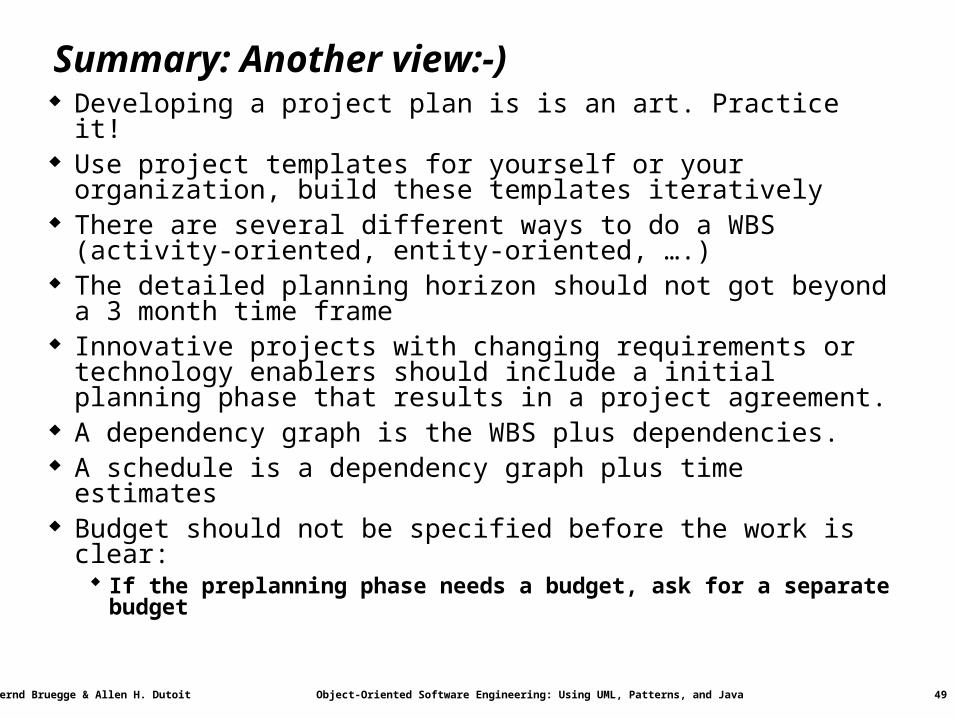
Summary: Another view:-) Developing a project plan is is an art. Practice it! Use project templates for yourself or your organization, build
these templates iteratively There are several different ways to do a WBS (activity-
oriented, entity-oriented, ….) The detailed planning horizon should not got beyond a 3 month
time frame Innovative projects with changing requirements or technology
enablers should include a initial planning phase that results in a project agreement.
A dependency graph is the WBS plus dependencies. A schedule is a dependency graph plus time estimates Budget should not be specified before the work is clear:
If the preplanning phase needs a budget, ask for a separate budget