Embed Size (px)
Citation preview
Using Tourism Brochures in Teaching Descriptive Writing to
the Tenth Grade Hotel Accommodation Students of
SMK Negeri 6 Palembang
UNDERGRADUATE THESIS
This thesis was accepted as one of the requirements to get the title of
Sarjana Pendidikan (S. Pd)
By
Mutiara Yusitaria
NIM. 12250093
English Education Study Program
Tarbiyah Faculty
UIN Raden Fatah Palembang
2017
USING TOURISM BROCHURES IN TEACHING DESCRIPTIVE WRITING TO
THE TENTH GRADE HOTEL ACCOMMODATION STUDENTS OF
SMK NEGERI 6 PALEMBANG
This thesis was written by Mutiara Yusitaria, Student Number 12250093 was
defended by the writer in the Final Examination and was approved by
the examination committee on, April 27𝑡ℎ, 2017
This thesis was accepted as one of the requirements to get
the title of Sarjana Pendidikan (S.Pd)
Palembang, April 𝟐𝟕𝒕𝒉, 2017
Universitas Islam Negeri Raden Fatah Palembang Fakultas Ilmu Tarbiyah dan Keguruan
Examination Committee Approval
Chairperson, Secretary,
Muhammad Isnaini, S.Ag., M.Pd Hj. Lenny Marzulina, M.Pd NIP. 197402012000031004 NIP. 197101312011012001
Member : Hj. Renny Kurnia Sari, M.Pd (...........................................)
NIP. 197906072008012015
Member : Janita Norena, M.Pd (...........................................)
Certified by,
Dean of Tarbiyah Faculty
Prof. Dr. H. KasinyoHarto, M.Ag
NIP. 197109111997031004
DEDICATION
This thesis is dedicated to :
Allah Subhanawata’ala, The greatest of the greats who has given rahmat
and hidayah. Allhamdulillah, Wasyukurillah, walailahaillallahu
Wallahuakbar.
My Prophet Muhammad Shallahu’alayhi wa sallam with his famillies, his
friends and his followers.
My Wonderful Parents, Drs. M. Yunus, M.M and Dra. Desy Isfianti.
Thank you for your endless love, support, prayer, care, and patience. You
are the real hero in my love.
My Dearest Brother and Sister, M. Naufal Rifqi and Salbina Trifenna.
Thank you for your support, care, love, prayer, and help.
My lovely grandma and grandpa. Farida and Ismail. Thankyou for the
support and motivation. You are my second parents in my life.
My Great Advisors, Hj. Lenny Marzulina, M.Pd and Nova Lingga Pitaloka,
M.Pd. A million thanks for your advice, guidance, and encouragement.
This thesis would not be done without your help.
My Academic Advisor is M. Holandyah, M.Pd and All of the lectures.
Thank you very much for knowledge that you gave to me.
My Examiners Hj. Renny Kurnia Sari, M.Pd and Janita Norena, M.Pd.
Thank you so much for your kindness.
My Beloved Supporter Ahmad Rizki, S.Pd. Thanks for your hand, patience,
your support, even moral, time and energy to make me stand so far,
always reminded me that Allah is your protector and many other you did
for me.
My Handstar Ade Kartika, S.Pd, Nadea Dini, ST, Bahana Astria, SP, and
Husnul Khotimah, SE. Thank you for supporting me when I was down,
never left my side and thank you for the crazy moment hehehe.. You are
like siblings of mine. I hope this friendship will never end.
Renota Asprilla Kelsaba, A.Md (Enote). Thanks for your support bro..
My Best Friends Robiah Adawiyah S.Pd and Rizki Fadhliyah S.Pd. Thanks
for the support, happiness and the unforgettable moment we shared.
My Best Edek Dian Fitriani, S.Pd and Agung Kurniawan, S.Pd. Thank you
so much for everything.
My Partners during I did my research Yunica, S.Pd, Ririn Khairunnisa,
S.Pd, Tria Novita, S.Pd, Mei Afriani, S.Pd, Tri Astuti, S.Pd, Syarifah Salwa,
S.Pd, and Kerisnin Otoyo, S.Pd. Thank you so much guys .
My Classmates PBI 03/2012. Thank you for the togetherness and
beautiful memories. Success for us.
SMK Negeri 6 Palembang. Thank you for the cooperative.
Motto:
You will see the brightest stars in the darkest night
Indeed, with hardship there will be ease (Al-Insyirah : 6)
ACKNOWLEDGEMENT
Alhamdulillah, all praise is to Allah for His grace and mercy, finally the
writer could finish this thesis. This thesis was written on the basis of the study
conducted at SMK Negeri 6 Palembang.
The writer would like to express her gratitude to her two advisors, Hj.
Lenny Marzulina, M.Pd and Nova Lingga Pitaloka, M.Pd who had generously
shared their knowledge, valuable advice, suggestions, guidance and
encouragement to the writer in writing thesis. The writer is also very grateful to
the Dean of Tarbiyah Faculty as well as his staff members, the Head of English
Education Study Program, academic advisor, and all the lectures who had taught
the writer during her study.
Furthermore, the writer would like to express her deepest appreciation to
the Headmaster of SMK Negeri 6 Palembang, the English teacher of the tenth
grade hotel accommodation, All of the teachers and staffs of SMK Negeri 6
Palembang, and the tenth grade hotel accommodation students of SMK Negeri 6
Palembang for cooperation.
The writer would also like to convey her deepest respect and love to her
parents, brother, sister, big family, her love and friends for their prayer and
support.
Palembang, March 2017
The Writer,
Mutiara Yusitaria
i
TABLE OF CONTENTS
page
ACKNOWLEDGEMENTS i
TABLE OF CONTENTS ii
ABSTRACT v
LIST OF TABLES vi
LIST OF FIGURES viii
LIST OF APPENDICES ix
LIST OF DOCUMENTATIONS x
I. INTRODUCTION
1.1 Background 1
1.2 Problems of the Study 6
1.3 Objectives of the Study 7
1.4 Significance of the Study 7
II. LITERATURE REVIEW
2.1 Theoretical Description 8
2.1.1 The Concept of Writing 8
2.1.2 The Concept of Teaching Writing 10
2.1.3 The Concept of Descriptive Writing 12
2.1.4 The Concept of Tourism Brochures as a Media 14
2.1.5 Teaching Descriptive Text by Using Tourism Brochures 16
2.2 Previous Related Studies 16
2.3 Hypotheses 18
2.4 Criteria of Hypotheses testing 19
2.5 Research Setting 20
ii
III. METHODS AND PROCEDURES
3.1 Research Design 21
3.2 Variables of the Study 22
3.3 Operational Definitions 23
3.4 Subject of the Study 24
3.4.1 Population 24
3.4.2 Sample 24
3.5 Data Collection 26
3.5.1 Test 26
3.5.1.1 Pretest 26
3.5.1.2 Posttest 27
3.6 Research Instrument Analysis 27
3.6.1 Validty Test 27
3.6.1.1 Content Validity 27
3.6.2 Reliablity Test 29
3.7 Data Analysis 29
3.7.1 Instrument Analysis 30
3.7.2 Data Description 30
3.7.2.1 Distribution of Data Frequency 31
3.7.2.2 Descriptive Statistics 31
3.7.3 Prerequisite Analysis 31
3.7.3.1 Normality Test 31
3.7.3.2 Homogenity Test 32
3.7.4 Hypothesis Testing 32
IV. FINDINGS AND INTERPRETATION
4.1 Findings 33
4.1.1 Data Description 33
iii
4.1.1.1 Distribution of Data Frequency 33
1. The Result of Pretest Score in Control Group 33
2. The Result of Pretest Score in Experimental Group 35
3. The Result of Posttest Score in Control Group 37
4. The Result of Posttest Score in Experimental Group 39
4.1.1.2 Descriptive Statistics 41
1. The Result of Pretest Score in Control Group 41
2. The Result of Pretest Score in Experimental Group 42
3. The Result of Posttest Score in Control Group 42
4. The Result of Posttest Score in Experimental Group 43
4.1.2 Prerequisite Analysis 43
4.1.2.1 Normality Test 44
4.1.2.2 Homogenity Test 45
4.1.3 Result of Hypothesis Testing 46
1. The Result of Paired Sample T-test in Experimental 46
2. The Result of Independent Sample T-test
in Posttest Experimental and Control Groups 47
4.2 Interpretation 49
V. CONCLUSIONS AND SUGGESTIONS
5.1 Conclusions 53
5.2 Suggestions 54
REFERENCES 55
APPENDINCES
iv
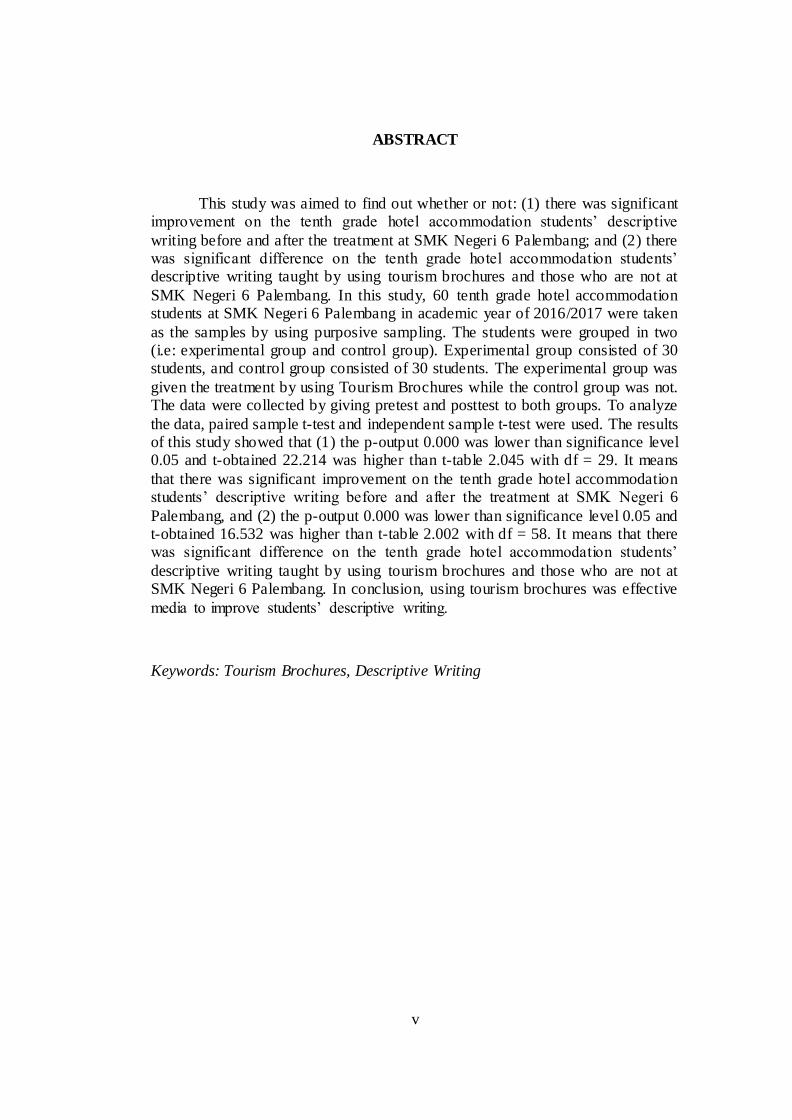
ABSTRACT
This study was aimed to find out whether or not: (1) there was significant improvement on the tenth grade hotel accommodation students’ descriptive
writing before and after the treatment at SMK Negeri 6 Palembang; and (2) there was significant difference on the tenth grade hotel accommodation students’ descriptive writing taught by using tourism brochures and those who are not at
SMK Negeri 6 Palembang. In this study, 60 tenth grade hotel accommodation students at SMK Negeri 6 Palembang in academic year of 2016/2017 were taken
as the samples by using purposive sampling. The students were grouped in two (i.e: experimental group and control group). Experimental group consisted of 30 students, and control group consisted of 30 students. The experimental group was
given the treatment by using Tourism Brochures while the control group was not. The data were collected by giving pretest and posttest to both groups. To analyze
the data, paired sample t-test and independent sample t-test were used. The results of this study showed that (1) the p-output 0.000 was lower than significance level 0.05 and t-obtained 22.214 was higher than t-table 2.045 with df = 29. It means
that there was significant improvement on the tenth grade hotel accommodation students’ descriptive writing before and after the treatment at SMK Negeri 6
Palembang, and (2) the p-output 0.000 was lower than significance level 0.05 and t-obtained 16.532 was higher than t-table 2.002 with df = 58. It means that there was significant difference on the tenth grade hotel accommodation students’
descriptive writing taught by using tourism brochures and those who are not at SMK Negeri 6 Palembang. In conclusion, using tourism brochures was effective
media to improve students’ descriptive writing.
Keywords: Tourism Brochures, Descriptive Writing
v
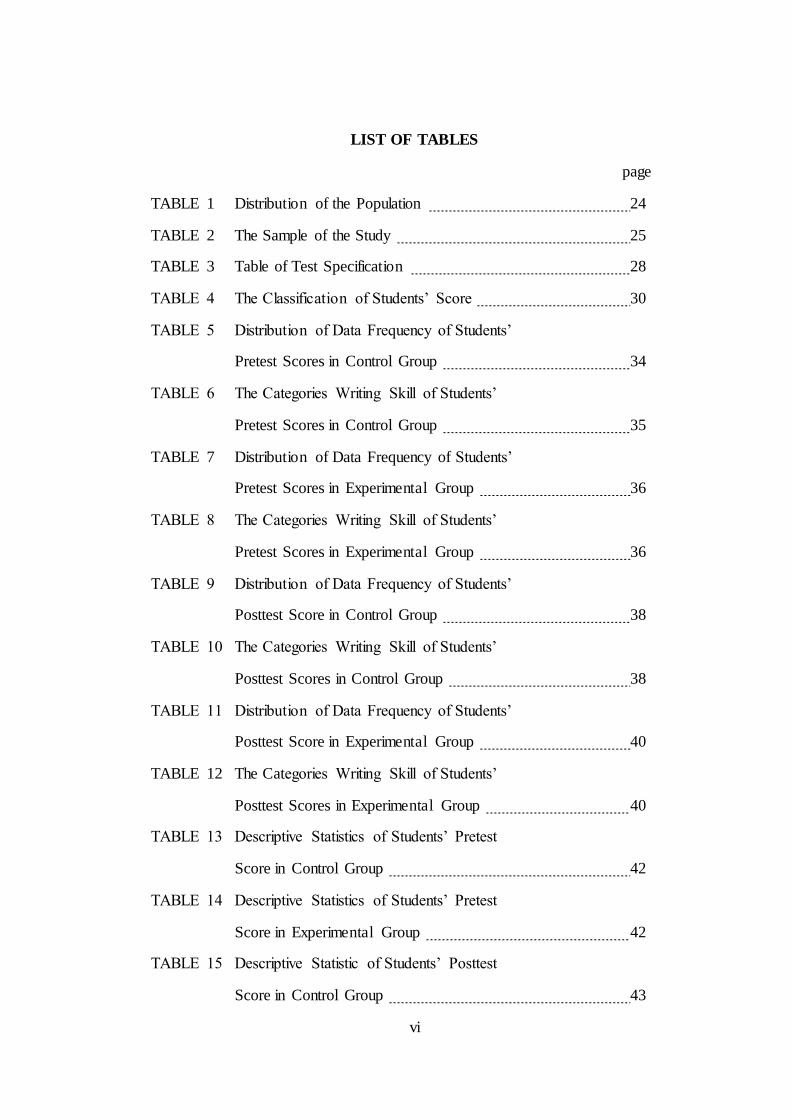
LIST OF TABLES
page
TABLE 1 Distribution of the Population 24
TABLE 2 The Sample of the Study 25
TABLE 3 Table of Test Specification 28
TABLE 4 The Classification of Students’ Score 30
TABLE 5 Distribution of Data Frequency of Students’
Pretest Scores in Control Group 34
TABLE 6 The Categories Writing Skill of Students’
Pretest Scores in Control Group 35
TABLE 7 Distribution of Data Frequency of Students’
Pretest Scores in Experimental Group 36
TABLE 8 The Categories Writing Skill of Students’
Pretest Scores in Experimental Group 36
TABLE 9 Distribution of Data Frequency of Students’
Posttest Score in Control Group 38
TABLE 10 The Categories Writing Skill of Students’
Posttest Scores in Control Group 38
TABLE 11 Distribution of Data Frequency of Students’
Posttest Score in Experimental Group 40
TABLE 12 The Categories Writing Skill of Students’
Posttest Scores in Experimental Group 40
TABLE 13 Descriptive Statistics of Students’ Pretest
Score in Control Group 42
TABLE 14 Descriptive Statistics of Students’ Pretest
Score in Experimental Group 42
TABLE 15 Descriptive Statistic of Students’ Posttest
Score in Control Group 43
vi
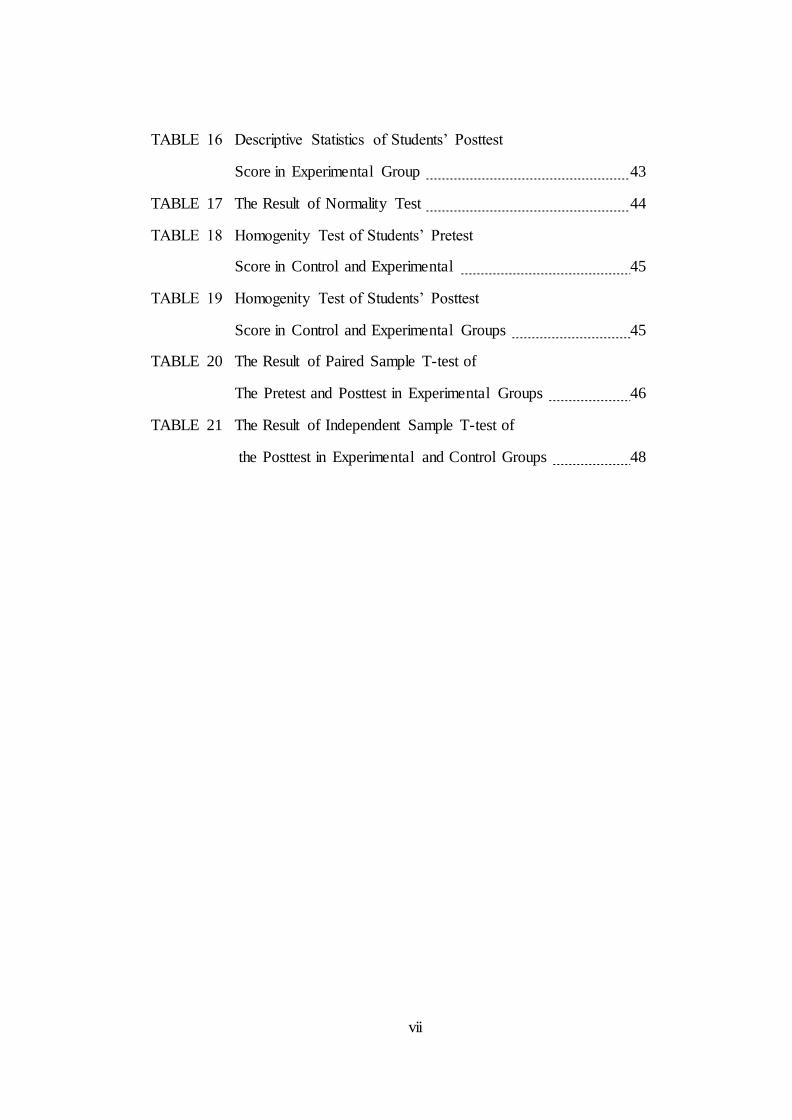
TABLE 16 Descriptive Statistics of Students’ Posttest
Score in Experimental Group 43
TABLE 17 The Result of Normality Test 44
TABLE 18 Homogenity Test of Students’ Pretest
Score in Control and Experimental 45
TABLE 19 Homogenity Test of Students’ Posttest
Score in Control and Experimental Groups 45
TABLE 20 The Result of Paired Sample T-test of
The Pretest and Posttest in Experimental Groups 46
TABLE 21 The Result of Independent Sample T-test of
the Posttest in Experimental and Control Groups 48
vii
LIST OF FIGURES
page
FIGURE 1 Process of Writing 9
FIGURE 2 Pretest-Posttest Non-equivalent Groups Design 21
viii
LIST OF APPENDICES
Appendix 1 Teaching Schedule
Appendix 2 Writing Test Instrument
Appendix 3 Writing Rubric
Appendix 4 Raters Scoring in Pretest-Posttest in Control and Experimental Group
Appendix 5 Output Analysis by Using SPSS
Appendix 6 Validity and Reliability Test Result
Appendix 7 Validator Sheet
Appendix 8 Syllabus
Appendix 9 Lesson Plan
Appendix 10 Brochures as Media and Source
Appendix 11 Students’ Descriptive Writing in the Pretest and Posttest of Experimental Group
Appendix 12 Students’ Attendance List in Experimental and Control Groups
Appendix 13 Research Gallery
ix
LIST OF DOCUMENTATIONS
1. Fotocopy KTM
2. Fotocopy Kwitansi Pembayaran
3. Pengesahan Judul Skripsi
4. Penunjukan Dosen Pembimbing Skripsi
5. SK Pembimbing
6. SK Penelitian
7. SK Telah melaksanakan penelitian
8. SK Bebas Teori
9. SK Lulus Ujian Komprehensif
10. Rekapitulasi Ujian Komprehensif
11. Fotocopy Pembayaran Ujian Kompre dan Munaqasah
12. SK Kelengkapan dan Keaslian Berkas Munaqasah
13. Hasil Ujian Skripsi
14. Formulir Konsultasi Skripsi
15. Transkrip Nilai
16. Sertifikat TOEFL
17. Sertifikat Ospek
18. Sertifikat BTA
19. Sertifikat Intensive Bahasa Arab
20. Sertifikat Intensive Bahasa Inggris
21. Sertifikat Puskom
22. Sertifikat KKN
x
CHAPTER I
INTRODUCTION
This chapter presents: (1) background, (2) problems of the study, (3)
objectives of the study, and (4) significance of the study.
1.1 Background
People use language to express their mind, wishes and ideas. Language is
a tool of communication of human society (Zhang, 2013). Language is not only
used for daily conversation but also used in education, research and science both
spoken and written. English is one of them. The main role of English as an
international language is to enable people around the world to communicate and
interact (Latifah, 2016, p.1). Since English becomes an International language and
includes in one of the lessons for national exam, there are many qualified schools
improve their English teaching and learning quality. In Indonesia, Ministry of
National Education and Culture number 096/1967 decided that English is
stipulated as the first foreign language for all indonesian students from lower
secondary education to university levels (Bera, 2009).
Speaking, reading, writing, and listening are the four skills which are
needed to master English. Among these four skills, writing is one of the important
skills of a language. According to Mayers (2005), writing is an action – a process
of discovering and organizing your ideas, putting them on paper, reshaping them
and revising. Writing can be said as a means of communication between the writer
and the reader (Gayatri, 2015). Moreover, according to Spelkova and Hurst (2008),
1
writing is connected with speaking in several different ways. Therefore, effective
writing is a skill that is grounded in the cognitive domain. It involves learning,
comprehension, application and synthesis of new knowledge (Defazio, Jones,
Tennant & Hook, 2010).
Writing activity can give an important contribution to human life because,
writing is a fundamental language skill that is vital to academic success and a
basic requirement for participation in civic life and global economy (Graham &
Perin, 2007). In the same way, Harmer (2004, p.4) states that writing is used for a
wide variety of purposes and it is produced in many different forms. Thus, in the
global era people need to write letter, proposal, thesis, and paper in English to
work in a prestigious company and to study abroad. Furthermore, as reported in
Kompas.com, writing activity can keep the sharpness of the brain (Pininta, 2016).
However, writing is often considered much more “difficult” perhaps
because of attitudes towards the value of written texts and notions associated with
“correctness” and the gravity of errors (Spelkova & Hurst, 2008) and writing is
considered as the most difficult skill because it involves many aspects of language
such as grammar, spelling, vocabulary, idiom, and culture (Valette, 1977, p. 217).
Then, writing habit in Indonesia is lower than reading habit (Khak, 2011). It is
proven that due to the lack of publication in international journals, Indonesian
universities’ ranking dropped drastically in QS World University Rankings 2013
for 100 levels down (Nurfuadah, 2013). Moreover, as reported in Kompas.com,
writing culture in Indonesia is lower than Vietnam because Vietnam could
produce 15,000 new titles a year, while Indonesia is at most 12,000 titles (Bagun,
2
2009). The last, Scopus and Scimago as the indexers of many journals in the
world note that from 1996 – 2013 and Indonesia is in the 6th place with the
number of journal publication 25.481. This number is far from satisfying
compared to Malaysia is in the 37th place with the number 125.084 and Singapore
is in the 32nd place with the number of journal publication 171.037 (Subekti,
2015). It can be concluded that writing habit in Indonesia is low and writing habit
in Indonesia should be improved.
In relation to writing skill in education field, students have to able to
express their thoughts in writing to develop their ideas. It is obvious that students
need to be taught not only how to communicate orally, but also how to
communicate in written form. Beside that, students still face many problems in
writing. Seyabi and Tuzlukova (2014) explain that there are five main types of
writing problems: (1) deciding how to start an essay/paragraph; (2) not knowing
how to write a correct English sentence; (3) putting the ideas together in a
coherent way; (4) choosing the right vocabulary to express ideas; and (5) not
having enough ideas about the topics that the teachers ask to write about. While,
Harmer (2004) said, writing is a weird activity for students because they seldom
write even in their own language. In other hand, writing can be said as the most
boring activity for students in the classroom.
According to K-13 (school based curriculum) for the tenth grade students
of vocational high school, there are a variety of texts that must be learned such as
recount text, narrative text, descriptive text and procedure text. Among these four
texts, descriptive text is one of the genres that must be taught, so that the students
3
know how to describe any object (person, place or thing) in their surroundings
(Depdiknas, 2006). Students are demanded to be able to write a text to describe
people, thing, place, etc. Moreover, the roles of descriptive writing to students of
vocational high school are students can interact and communicate with tourist. It
should be described in detail, so the reader can get clear description of the object
(Faisal and Suwandita, 2013). Latifah (2016) investigated problems faced by
students in descriptive writing that students get confused to choose appropriate
words to describe a particular object in their mind, organizing their idea and also
grammar.
Furthermore, based on the informal interview with the tenth grade students
of SMK Negeri 6 Palembang. Most of the students were still confused to write
descriptive paragraph because it was hard for them to create the theme and put
down their idea in a blank paper and also they had limited words to describe
particular object or place. It was caused by their limited vocabulary, low
information or idea and inspiration to write and the minimum grammatical
knowledge.
Therefore, this study needs media to make an easy way to write.
According to Howard (1998), the teaching that uses visual aids will almost
certainly be better. Similarly, Werff (2003) agrees that pictures are good sources
material for practicing speaking, listening, writing, vocabulary, and grammar, it
can stimulate students to come up with their many more effective and enjoyable
activities. Without any media it is difficult for students to find out inspiration and
information, especially for those who have low imagination. Therefore, media are
4
helpful in teaching learning process and one of the media is tourism brochure.
According to Kurniawan and Rosa (2013, p.3), tourism brochure is a booklet
containing information or advertisement of business. While, tourism brochure is
one of the teaching media that can be used in teaching descriptive text, it gives
visual aid to students in learning writing descriptive text (Putri, 2012). There are
much information in the tourism brochure that can be used for teaching English
especially and it will be much more effective to improve students’ descriptive
writing skill.
Tourism brochure gives them a context, a real-world purpose for writing,
and strong motivation to find the words and develop the writing skills that will
serve their needs (Johari, 2008). The features of tourism brochure consist of
pictures and places such as hotels, resorts, restaurants and brief descripcion of
each place, cost, food or sport etc. Because tourism brochures consist picture and
brief description place and other, it will help students on finding the idea,
information, new vocabullary and construction the grammar (Kurniawan & Rosa,
2013) and then, the good criteria for brochure that are a brochure should be clear,
attractive, brief, and a good brochure will grab the attention of the reader, provide
needed information while inspiring the reader to take action (Pennisi, Gunawan,
Major, & Winder, 2011).
Teaching English by using tourism brochure in vacational high school will
be more helpful for students because they can learn and pratice English beside
that, focuses on novice level, novice level is a level for beginners and here are
some basic compotences for the class X in vocational high school that are related
5
in novice level is describing objects, place, undestand basic social expressions for
life importance and understand foreign words (Sari & Rozani, 2013).
To strengthen the current study, the similar studies are found. The first is
research conducted by Sari and Rozani (2013), reporting that there was a
significant improvement toward students’ English skills. Furthermore, the second
is the research conducted by Gayatri (2015), showing that there was a significant
improvement in students’ descriptive writing achievement by using tourism
brochure as a media. The last is a research conducted by Ismawarningtyas (2015),
this study showed that the students became more active and enthusiastic in
learning vocabulary items by using tourism brochures.
Finally, based on the problems and condition above, a research entitled
“Using Tourism Brochures in Teaching Descriptive Writing to the Tenth Grade
Hotel Accommodation Students of SMK Negeri 6 Palembang” was conducted.
1.2 Problems of the Study
Based on the background above, this study aims at answering the
following questions:
1. Is there any significant improvement on the tenth grade hotel
accommodation students’ descriptive writing before and after the
treatment at SMK Negeri 6 Palembang?
2. Is there any significant difference on the tenth grade hotel
accommodation students’ descriptive writing taught by using tourism
brochures and those who are not at SMK Negeri 6 Palembang?
6
1.3 Objectives of the Study
The objectives of this study are to find out:
1. Whether or not there is any significant improvement on the tenth grade
hotel accommodation students’ descriptive writing before and after the
treatment at SMK Negeri 6 Palembang.
2. Whether or not there is any significant difference on the tenth grade hotel
accommodation students’ descriptive writing taught by using tourism
brochures and those who are not at SMK Negeri 6 Palembang.
1.4 Significance of the Study
The results of this study are expected to give the beneficial contribution
for teachers of English, students or learners, and the next researchers.
For teachers, this study will give meaningful information to English
teachers in helping them to improve students descriptive writing skill through
tourism brochures as the media in descriptive paragraph.
For students, this study will be helpful to improve students’ achievement
in descriptive writing skill through the use of tourism brochures and to motivate
students to write in English.
For the next researchers, the result of this study is expected to be useful in
providing the references for those who intend to conduct with similar variables
and help them as the guide in developing their research.
7
CHAPTER II
LITERATURE REVIEW
This chapter presents: (1) theoretical description, (2) previous related
studies, (3) hypotheses, (4) criteria of hypotheses testing, and (5) research setting.
2.1 Theoretical Description
2.1.1 The Concept of Writing
According to Meyers (2005), writing is an action - a process of
discovering and organizing your ideas, putting them on paper, and reshaping and
revising them. Writing is one of the important skills of a language (Faisal &
Suwandhita, 2013). Effective writing is a skill that is grounded in the cognitive
domain. It involves learning, comprehension, application and synthesis of new
knowledge (Defazio, Jones, Tennant & Hook, 2010). Writing is very important to
support communication among human being, through writing, they can also
transfer information and knowledge to others. Brown (2001) states that written
products are often the result of thinking, drafting, and revising procedures that
require specialized skills that not everyone develops naturally.
According to Brown (2001), witing has produced writing pedagogy that
focuses students on how to generate ideas, how to organize them coherently, how
to use discourse markers and rhetorical conventions to put them cohesively into a
written text, how to revise text for clear meaning, how to edit text for appropriate
grammar, and how to produce final product. Similary, according to Nunan (2003),
writing can be defined by a series of contrast. The first, writing is both a physical
8
and a mental act. Writing is the physical act of commiting words or ideas to some
medium and writing is the mental work of investing ideas, thinking about how to
express them, and organizing them into statements and paragraphs that will be
clear to a reader. The second, writing is both to express and impress. Writers
typically serve two masters: themselves, and their own desires to express an idea
or feeling, and readers also called the audience, who need to have ideas expressed
in certain ways. Writers must then choose the best form for their writing,
depending on its purpose. The third, it is both a process and a product. The writer
imagines, organizes, drafts, edits, reads, and rereads.
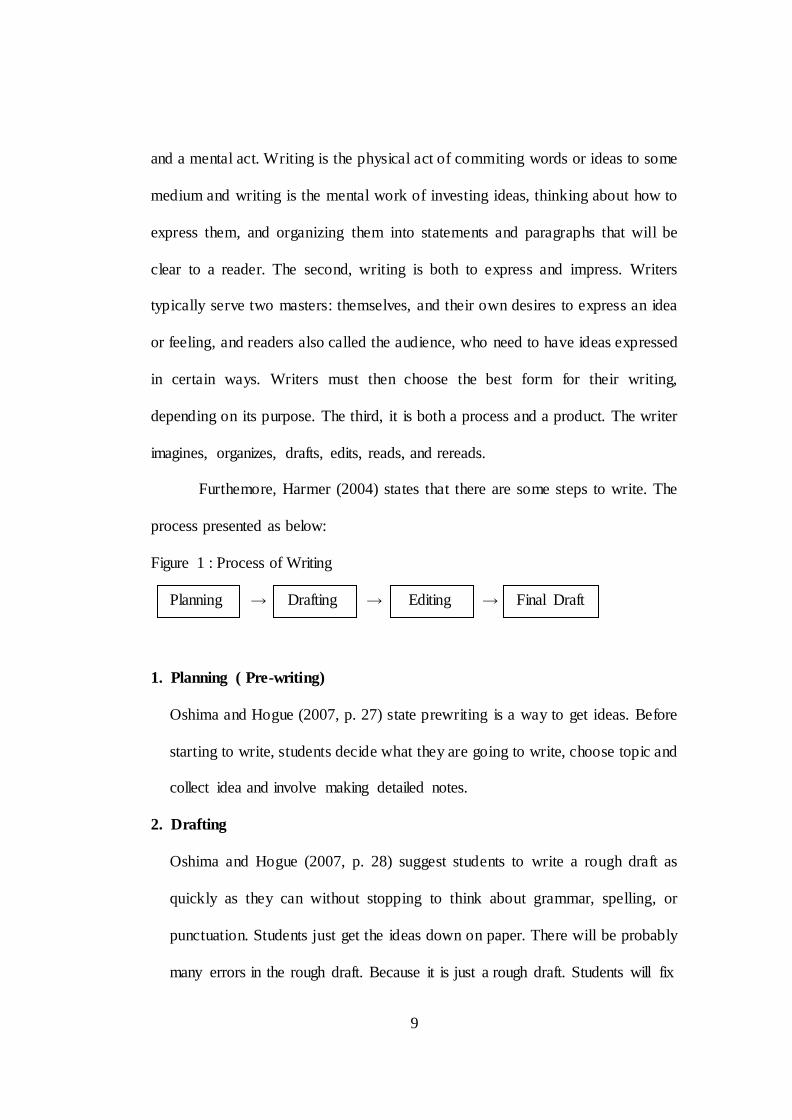
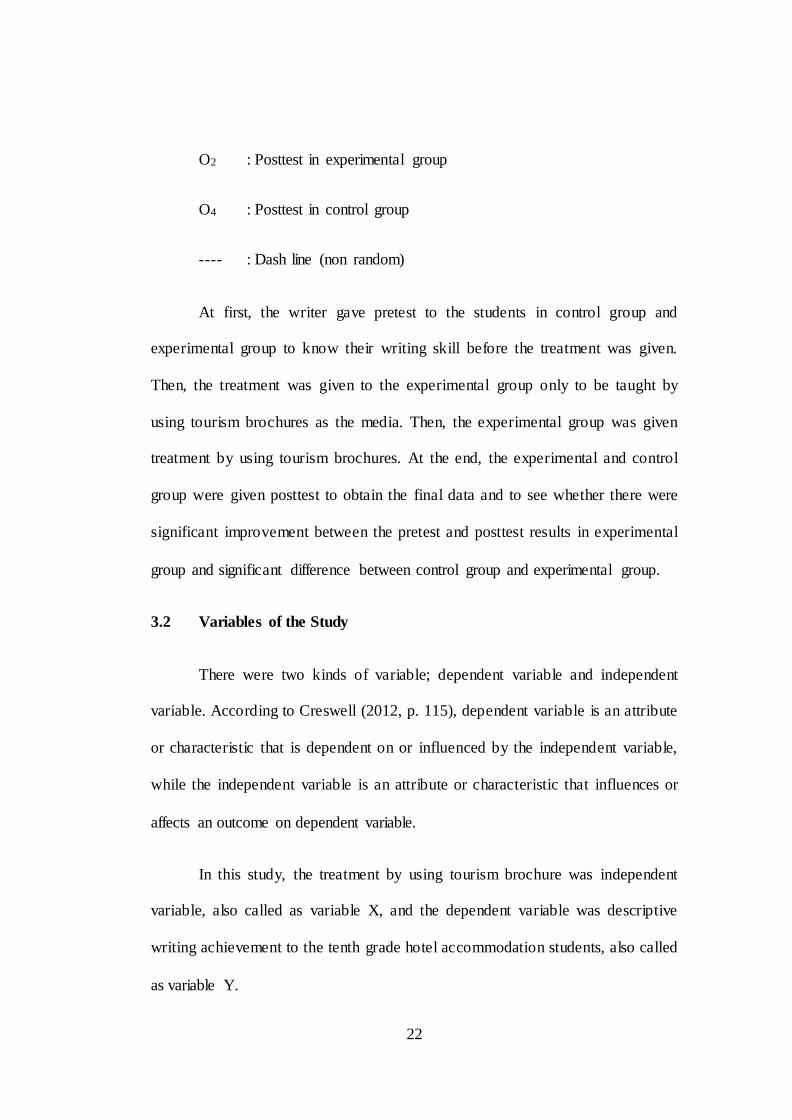
Furthemore, Harmer (2004) states that there are some steps to write. The
process presented as below:
Figure 1 : Process of Writing
→ → →
1. Planning ( Pre-writing)
Oshima and Hogue (2007, p. 27) state prewriting is a way to get ideas. Before
starting to write, students decide what they are going to write, choose topic and
collect idea and involve making detailed notes.
2. Drafting
Oshima and Hogue (2007, p. 28) suggest students to write a rough draft as
quickly as they can without stopping to think about grammar, spelling, or
punctuation. Students just get the ideas down on paper. There will be probably
many errors in the rough draft. Because it is just a rough draft. Students will fix
9
Planning Drafting Editing Final Draft
the errors later. One dimension of a good writing is writers’ ability to visualize
the audience.
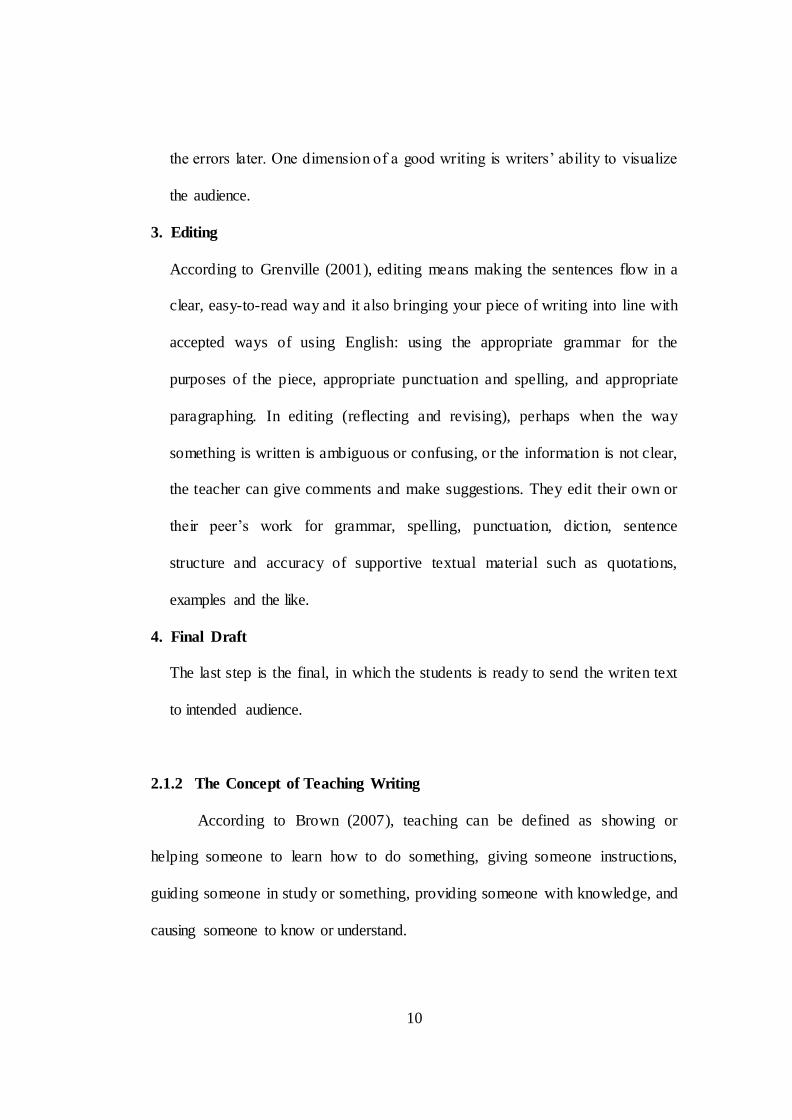
3. Editing
According to Grenville (2001), editing means making the sentences flow in a
clear, easy-to-read way and it also bringing your piece of writing into line with
accepted ways of using English: using the appropriate grammar for the
purposes of the piece, appropriate punctuation and spelling, and appropriate
paragraphing. In editing (reflecting and revising), perhaps when the way
something is written is ambiguous or confusing, or the information is not clear,
the teacher can give comments and make suggestions. They edit their own or
their peer’s work for grammar, spelling, punctuation, diction, sentence
structure and accuracy of supportive textual material such as quotations,
examples and the like.
4. Final Draft
The last step is the final, in which the students is ready to send the writen text
to intended audience.
2.1.2 The Concept of Teaching Writing
According to Brown (2007), teaching can be defined as showing or
helping someone to learn how to do something, giving someone instructions,
guiding someone in study or something, providing someone with knowledge, and
causing someone to know or understand.
10
In the holy Quran Surah An-Nahl (125), it is explained about teaching in islam is
a compulsory.
“Invite to the way of your Lord with wisdom and good instruction, and argue with
them in a way that is best. Indeed, your Lord is most knowing of who has strayed
from His way, and He is most knowing of who is (rightly) guided.” (QS. 16:125).
In this Surah, there are three principles in the implementation of the delivery
methods, they are: preaching, teaching and communication.
However, writing is a skill which requires organization of ideas to be
communicated in a text ( Inderawati & Hayati, 2011). The writing skill are
complex and sometimes difficult to teach, requiring mastery not only of
grammatical and rhetorical devices but also of conceptual and judgemental
elements (Heaton, 2005). In teaching writing the result have to be achieved at the
end of teaching and the process of writing must take the students learn how to
write in a right way. Even, learning to write in English as a foreign language is an
uphill struggle for most students. Furthermore, students need to know how to
write, how to put written reports together, how to reply advertisement and
increasingly how to write using electronic media (Faisal & Suwandhita, 2013).
11
Raimes (1983) mentions at least there are two main reasons for teaching writing.
First, writing is about communicative reasons while meeting a new culture.
Second, writing can work as an important learning tool. More specifically, Raimes
(1983) states that writing helps our students learn. because? (1) writing reinforces
the grammatical structures, idioms, and vocabulary that we have been teaching
our students; (2) when our students write, they also have a chance to be
adventurous with the language, to go beyond what they have just learned to say, to
take risks; (3) when they write, they necessarily become very involved with the
language; the effort to express ideas and the constant use of eye, hand, and brain
is a unique way to reinforce learning.
2.1.3 The Concept of Descriptive Writing
Based on K13 (School Based Curriculum) for Senior High
School/Vocational High School, some text types are taught to the students, and
descriptive text is one of the texts that should be learned by the tenth grade
students. According to Kane (2000), descriptive text is description about sensory
experience how something looks, sounds, tastes. The purpose of descriptive text is
to describe and reveal a particular person, place, or thing in details or specific to
make the reader be able to visualize the description (Harmenita & Tiarina, 2013).
It can be concluded that descriptive text is used to describe everything, which is
seen by writer in detail.
According to Siahaan and Shinoda (2008), the characteristics of
descriptive text are:
12
1. Text Function
The text function or usually called social purpose. The social function of
this paragraph is to describe a particular person, place or thing.
2. Generic Structure
According to Siahaan & Shinoda (2008), descriptive text is a text
containing two components namely identification and description.
Descriptive text has:
1) Identification : identifies phenomenon to be described.
2) Description : describes parts, characteristics, and qualities.
The identification is to identify the object to describe, while the description
to describe parts, characteristics, and the qualities of the part of the object.
3. Language Features of Descriptive Text
According to Gerot & Wignell cited in Mursyid (2011), language features
of descriptive text are:
a) Focus on the specific participants
b) Using attributive and identify process
c) Using Simple Present Tense
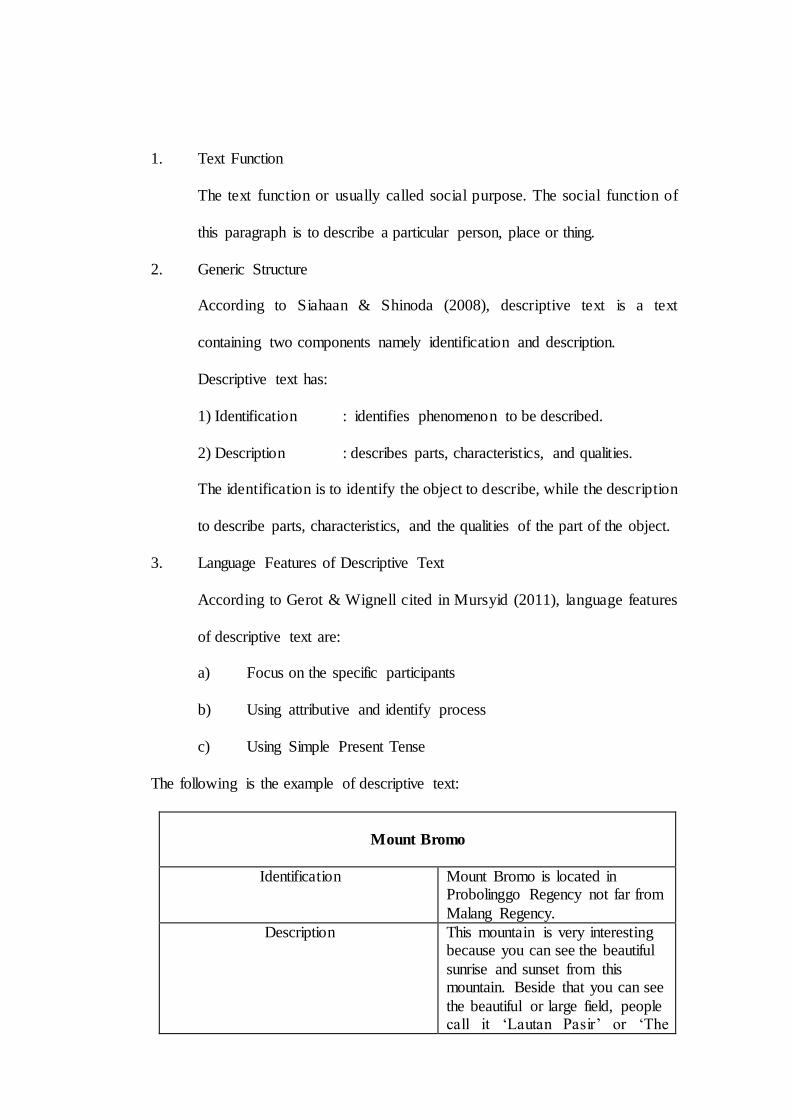
The following is the example of descriptive text:
Mount Bromo
Identification Mount Bromo is located in Probolinggo Regency not far from
Malang Regency.
Description This mountain is very interesting because you can see the beautiful
sunrise and sunset from this mountain. Beside that you can see
the beautiful or large field, people call it ‘Lautan Pasir’ or ‘The
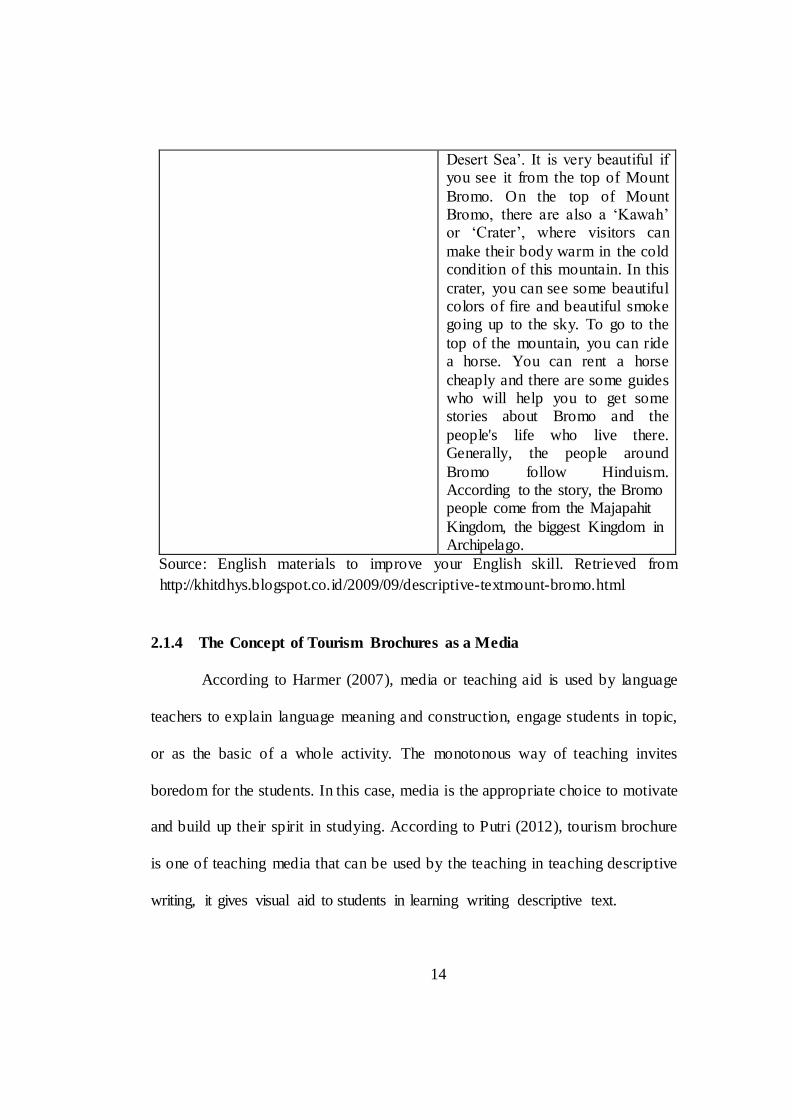
Desert Sea’. It is very beautiful if you see it from the top of Mount
Bromo. On the top of Mount Bromo, there are also a ‘Kawah’ or ‘Crater’, where visitors can
make their body warm in the cold condition of this mountain. In this
crater, you can see some beautiful colors of fire and beautiful smoke going up to the sky. To go to the
top of the mountain, you can ride a horse. You can rent a horse
cheaply and there are some guides who will help you to get some stories about Bromo and the
people's life who live there. Generally, the people around
Bromo follow Hinduism. According to the story, the Bromo people come from the Majapahit
Kingdom, the biggest Kingdom in Archipelago.
Source: English materials to improve your English skill. Retrieved from
http://khitdhys.blogspot.co.id/2009/09/descriptive-textmount-bromo.html
2.1.4 The Concept of Tourism Brochures as a Media
According to Harmer (2007), media or teaching aid is used by language
teachers to explain language meaning and construction, engage students in topic,
or as the basic of a whole activity. The monotonous way of teaching invites
boredom for the students. In this case, media is the appropriate choice to motivate
and build up their spirit in studying. According to Putri (2012), tourism brochure
is one of teaching media that can be used by the teaching in teaching descriptive
writing, it gives visual aid to students in learning writing descriptive text.
14
The good criteria for brochure are a brochure should be clear, attractive, brief, and
a good brochure will grab the attention of the reader, provide needed information
while inspiring the reader to take action (Pennisi, Gunawan, Major, & Winder,
2011). As the media, brochure was applied for teaching in the classroom. A
brochure is an informational pamphlet or leaflet advertising an organization,
business, event, product, or service (Pennisi, Gunawan, Major, & Winder, 2011).
Brochures also provide colorful pictures and simple explanation about something
or place. By looking at the pictures, students are expected to get inspiration to
write a descriptive text. Tourism brochure can help teachers in arise students’
curiosity and imagination, it will stimulate and improve student’s imagination
with paying attention and keeping their eyes on brochure (Thompson, 2008).
According to Sari and Rozani (2013), brochures have some advantages as
media for teaching English, such as:
a. Students feel comfort and enjoy in studying.
b. Brochures can help students to explore new vocabularies to develop their
English skill.
c. Brochures can help students get new information and generate their ideas
d. Brochures are easy to apply, simple and colorful.
Kurniawan and Rosa (2013) define tourism brochure as a booklet that
contains specific information or advertisement of business. The features of
tourism brochure consist pictures of places, facilities, and a brief description of
the place.
15
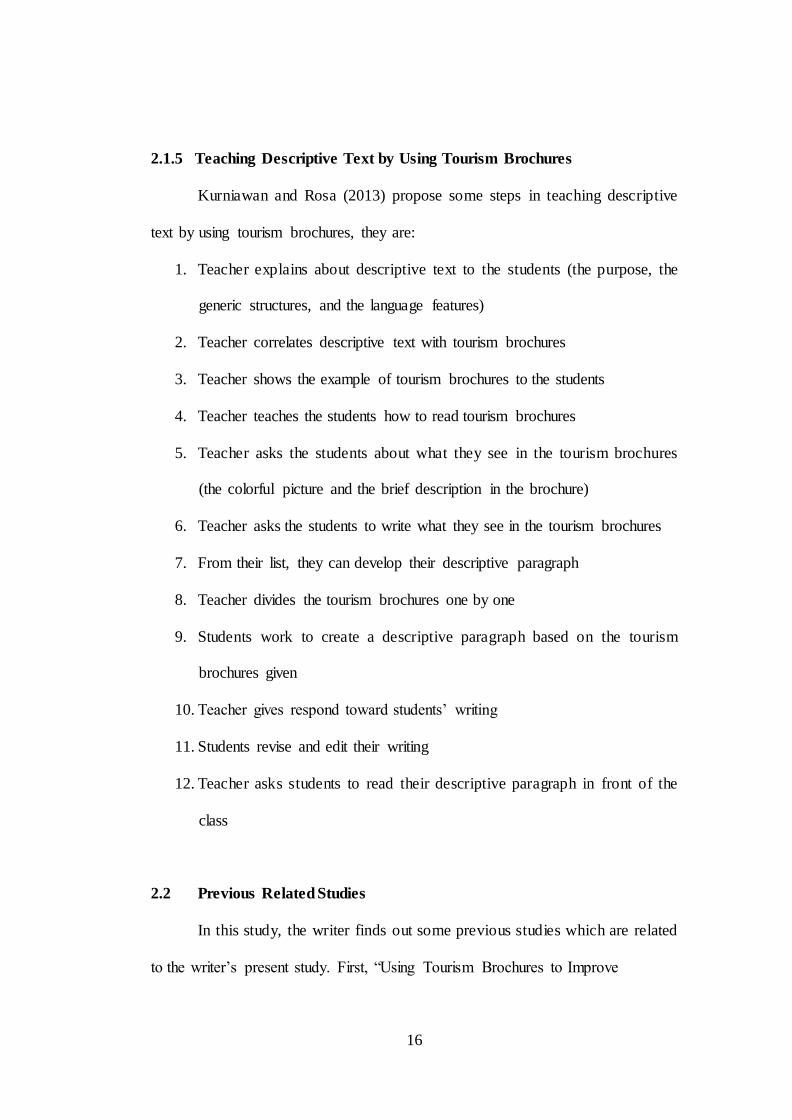
2.1.5 Teaching Descriptive Text by Using Tourism Brochures
Kurniawan and Rosa (2013) propose some steps in teaching descriptive
text by using tourism brochures, they are:
1. Teacher explains about descriptive text to the students (the purpose, the
generic structures, and the language features)
2. Teacher correlates descriptive text with tourism brochures
3. Teacher shows the example of tourism brochures to the students
4. Teacher teaches the students how to read tourism brochures
5. Teacher asks the students about what they see in the tourism brochures
(the colorful picture and the brief description in the brochure)
6. Teacher asks the students to write what they see in the tourism brochures
7. From their list, they can develop their descriptive paragraph
8. Teacher divides the tourism brochures one by one
9. Students work to create a descriptive paragraph based on the tourism
brochures given
10. Teacher gives respond toward students’ writing
11. Students revise and edit their writing
12. Teacher asks students to read their descriptive paragraph in front of the
class
2.2 Previous Related Studies
In this study, the writer finds out some previous studies which are related
to the writer’s present study. First, “Using Tourism Brochures to Improve
16
Descriptive Writing Achievement of The Tenth Grade Student of SMA Negeri 14
Palembang” written by Gayatri in 2015. In the study, the researcher found that
there was a significant improvement in students’ descriptive writing achievement
by using tourism brochure as the media. In the beginning, students’ scores were
low, but after applying the media, their scores increased and students’ motivation
in studying became higher. It also showed that tourism brochure is effective to be
media in teaching and learning activity. The difference is the reseacher choose the
venue for research in Senior High School but the writer in Vocational High
School. While, there are several similarities between this study and writer’s study.
Those are: (1) both studies using tourism brochures a media to teach english; (2)
both studies choose a descriptive writing skill; and (3) both studies choose the
level of students is the tenth grade students.
Second, “The Use Of Tourism Brochures as Media to Improve Students’
Motivation in Learning Vocabullary at The Eight Grade of Junior High School”
written by Ismawarningtyas in 2015. The result of the study showed that the
students became more active and enthusiastic in learning vocabulary items by
using tourism brochures; it was proved by the result of the study. The tests result
also showed that there was improvement in the students motivation and tourism
brochures are effective to improve the students motivation in learning vocabulary
items. The similarity is both, the researchers and the writer use tourism brochure
as a media. While, the difference is the level of the students chosen by the
researcher was the eight grade of Junior High School, but the writer chose the
tenth grade of Vocational High School.
17
Third, “Improving Class XI IPS Students’ Speaking Achievement by
Using Brochure at SMA Negeri 1 Kencong”. Written by Prima in 2012. Based on
the results of his research, the use of brochure in the English teaching and learning
process of speaking could improve the students’ speaking achievement both in
process achievement proven by more than 70% students who were active in the
teaching and learning process, and product achievement proven by more than 75%
students achieved the standard score required by the school that is 70. It proved
that using brochure as media to teach English is valuable. It means the use of
brochure was able to make the students active in class. The similarity between this
studies and writer’s study is both studies using brochures as a media. There are
several differences between this study and researcher’s study. Those are: (1) the
writer chose writing skill, and the researcher chose speaking skill. (2) the level of
the students chosen by the researcher was the eleventh grade of Senior High
School, but the writer chose the tenth grade of Vocational High School.
2.3 Hypotheses
In this study there are two hypotheses proposed. They are null hypothesis
(Ho) and alternative hypothesis (Ha). The hypotheses are as follows:
𝐻𝑜1: There is no significant improvement on the tenth grade hotel
accommodation students’ descriptive writing before and after the
treatment at SMK Negeri 6 Palembang.
18
𝐻𝑎1: There is a significant improvement on the tenth grade hotel
accommodation students’ descriptive writing before and after the
treatment at SMK Negeri 6 Palembang.
𝐻𝑜2: There is no significant difference on the tenth grade hotel accommodation
students’ descriptive writing taught by using tourism brochures and those
who are not at SMK Negeri 6 Palembang
𝐻𝑎2: There is a significant difference on the tenth grade hotel accommodation
students’ descriptive writing taught by using tourism brochures and those
who are not at SMK Negeri 6 Palembang.
2.4 Criteria of Hypotheses Testing
The criteria of hypotheses testing is as follows:
1. If the p-output (sig.2 tailed) is lower than 0,05 level and t-obtained is
higher than t-table 2,045 (with df = 29), the null hypothesis (Ho) is
rejected, and the alternative hypothesis (Ha) is accepted.
If the p-output (sig.2-tailed) is higher than 0,05 level and t-obtained is
lower than t-table 2,045 (with df = 29), the null hypothesis (Ho) is
accepted, and the alternative hypothesis (Ha) is rejected.
2. If the p-output (sig.2 tailed) is lower than 0,05 level and t-obtained is
higher than t-table 2,002 (with df = 58), the null hypothesis (Ho) is
rejected, and the alternative hypothesis (Ha) is accepted.
19
If the p-output (sig.2 tailed) is higher than 0,05 level and t-obtained is
lower than t-table 2,002 (with df = 58), the null hypothesis (Ho) is
accepted, and the alternative hypothesis (Ha) is rejected.
2.5 Research Setting
This study conducted in SMK Negeri 6 Palembang. It is located at Jl.
Mayor Ruslan Kel. Duku Kec. Ilir Timur 2 Palembang 30114 Sumatera Selatan.
SMK Negeri 6 Palembang is Tourism Vocational High School group and
certificate of accreditation for SMK Negeri 6 Palembang is standard international.
The Headmaster of SMK Negeri Palembang is Bambang Riadi, S.Pd, M.Pd.
SMK Negeri 6 Palembang has many students. It is about 1200 students from class
X until class XII. There are 5 Major: Hotel Accommodation, Food & Beverage
Product, Fashion & Garment, Skin Beauty and Hair Beauty. In this study the
writer focused on the tenth grade hotel accommodation students. In the tenth
grade hotel accommodation students, there are four classes: X PR 1, X PR 2, X
PR 3 and X PR 4. This study concern in the class X PR 1 and X PR 2 as subject
study.
20
CHAPTER III
METHODS AND PROCEDURES
This chapter presents: (1) research design, (2) variables of the study, (3)
operational definitions, (4) subject of the study, (5) data collection, (6) research
instrument analysis, and (7) data analysis.
3.1 Research Design
Experimental design was used in conducting this study. The method of this
study used the Pretest-Posttest Non-equivalent control groups design. It involved
two classes an experimental and a control group.
Cohen (2007, p. 302) defines the figure of Pretest-Posttest Non-equivalent
Groups Design as follows:
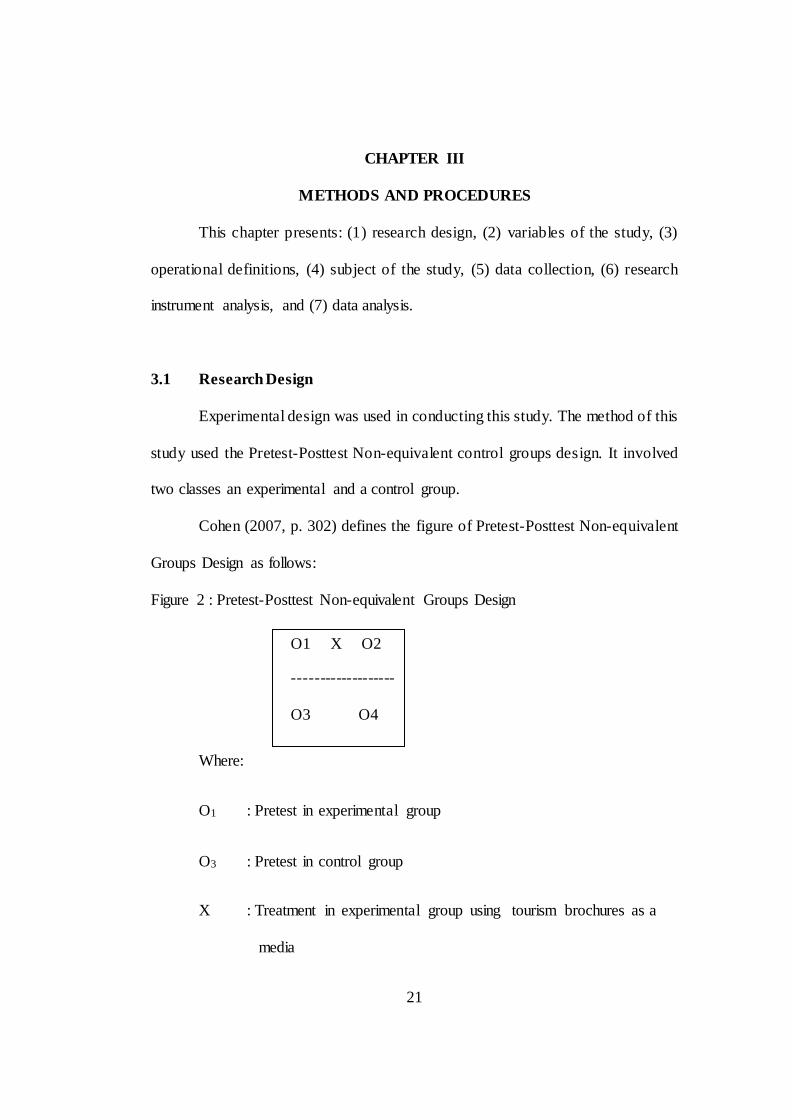
Figure 2 : Pretest-Posttest Non-equivalent Groups Design
Where:
O1 : Pretest in experimental group
O3 : Pretest in control group
X : Treatment in experimental group using tourism brochures as a
media
21
O1 X O2
-------------------
O3 O4
O2 : Posttest in experimental group
O4 : Posttest in control group
---- : Dash line (non random)
At first, the writer gave pretest to the students in control group and
experimental group to know their writing skill before the treatment was given.
Then, the treatment was given to the experimental group only to be taught by
using tourism brochures as the media. Then, the experimental group was given
treatment by using tourism brochures. At the end, the experimental and control
group were given posttest to obtain the final data and to see whether there were
significant improvement between the pretest and posttest results in experimental
group and significant difference between control group and experimental group.
3.2 Variables of the Study
There were two kinds of variable; dependent variable and independent
variable. According to Creswell (2012, p. 115), dependent variable is an attribute
or characteristic that is dependent on or influenced by the independent variable,
while the independent variable is an attribute or characteristic that influences or
affects an outcome on dependent variable.
In this study, the treatment by using tourism brochure was independent
variable, also called as variable X, and the dependent variable was descriptive
writing achievement to the tenth grade hotel accommodation students, also called
as variable Y.
22
3.3 Operational Definitions
The title of this thesis is “Using Tourism Brochures in Teaching
Descriptive Writing to the Tenth Grade Hotel Accommodation Students of SMK
Negeri 6 Palembang”. To avoid the possibility of misinterpretation about some
terms in this study, some terms need to be explained, they are: tourism brochure,
teaching and descriptive writing.
Firstly, the word Tourism Brochure means a booklet consisting of
information about places that can be visited by people. Besides pictures, students
can also get some brief information about the place and the facilities through
tourism brochure. Tourism brochures such as Bromo, Tidung Island, Eiffel Tower
in Paris, Karimun Java Island, and Limas House were used in this study.
Second, teaching is helping someone to learn how to do something, giving
someone instructions, guiding someone, providing someone with knowledge, and
causing someone to know or understand.
Third , descriptive writing is writing activity of descriptive text which the
writer can describe something, people or place. Descriptive writing materials are
describing building and place. The generic structure of descriptive text is
identification and description. In this study, the descriptive writing was measured
by writing test.
23
3.4 Subject of the Study
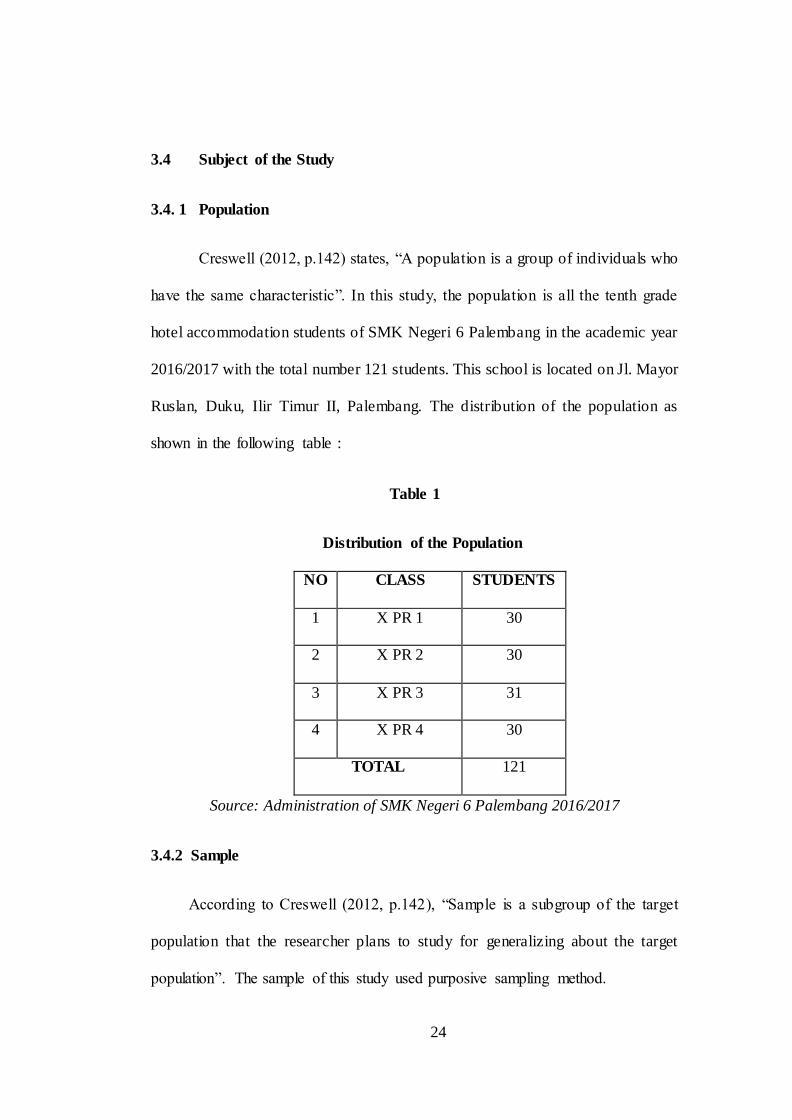
3.4. 1 Population
Creswell (2012, p.142) states, “A population is a group of individuals who
have the same characteristic”. In this study, the population is all the tenth grade
hotel accommodation students of SMK Negeri 6 Palembang in the academic year
2016/2017 with the total number 121 students. This school is located on Jl. Mayor
Ruslan, Duku, Ilir Timur II, Palembang. The distribution of the population as
shown in the following table :
Table 1
Distribution of the Population
NO CLASS STUDENTS
1 X PR 1 30
2 X PR 2 30
3 X PR 3 31
4 X PR 4 30
TOTAL 121
Source: Administration of SMK Negeri 6 Palembang 2016/2017
3.4.2 Sample
According to Creswell (2012, p.142), “Sample is a subgroup of the target
population that the researcher plans to study for generalizing about the target
population”. The sample of this study used purposive sampling method.
24
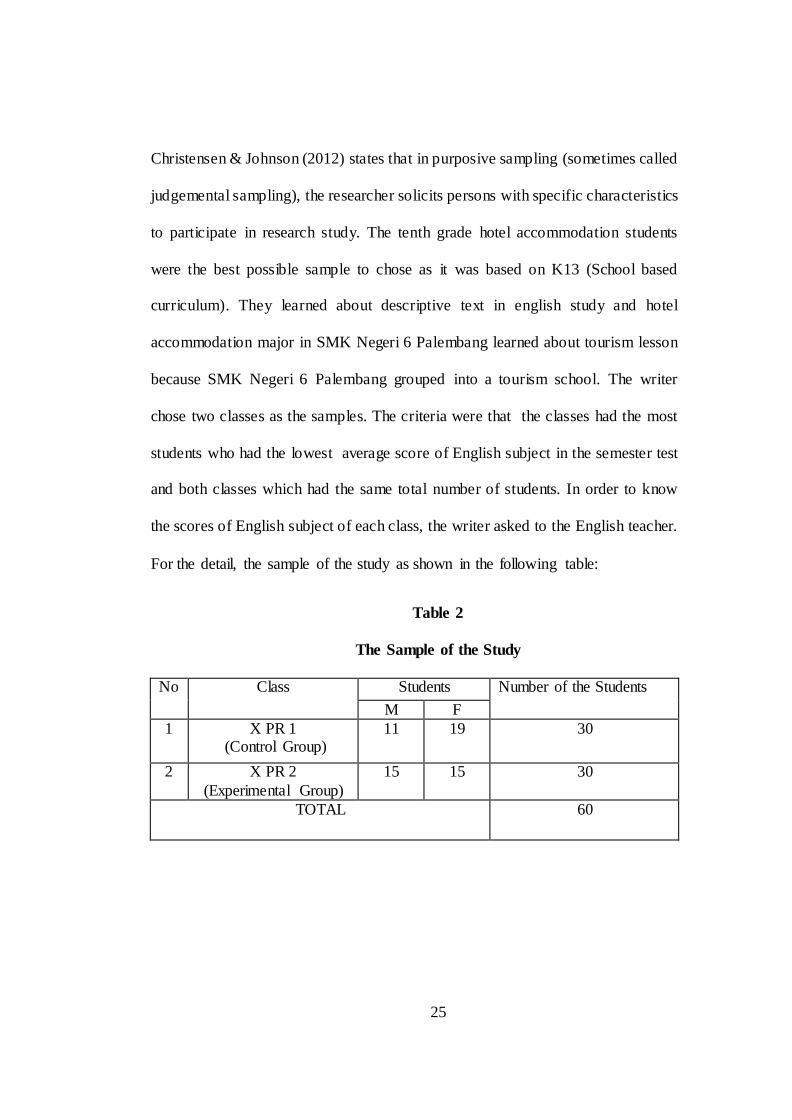
Christensen & Johnson (2012) states that in purposive sampling (sometimes called
judgemental sampling), the researcher solicits persons with specific characteristics
to participate in research study. The tenth grade hotel accommodation students
were the best possible sample to chose as it was based on K13 (School based
curriculum). They learned about descriptive text in english study and hotel
accommodation major in SMK Negeri 6 Palembang learned about tourism lesson
because SMK Negeri 6 Palembang grouped into a tourism school. The writer
chose two classes as the samples. The criteria were that the classes had the most
students who had the lowest average score of English subject in the semester test
and both classes which had the same total number of students. In order to know
the scores of English subject of each class, the writer asked to the English teacher.
For the detail, the sample of the study as shown in the following table:
Table 2
The Sample of the Study
No Class Students Number of the Students
M F
1 X PR 1 (Control Group)
11 19 30
2 X PR 2
(Experimental Group)
15 15 30
TOTAL 60
25
3.5 Data Collection
3.5.1 Test
The technique used by the writer to collect the data was test. In this study
writing test was used. Writing test was used to measure students’ writing
achievement in descriptive writing before and after treatment. The students were
given some topic after that, they chose one topic and made a paragraph descriptive
writing. Test was taken form syllabus in K-13 about descriptive teks. The purpose
of the test was to know the result in teaching by using Tourism Brochures as a
Media. The test was conducted twice; pretest and posttest. Those tests were given
to the students in the experimental and control groups. The purpose of giving
them test was to know the progress of students writing ability scores before and
after treatment.
3.5.1.1 Pretest
The pretest was given to both groups before the treatment in the
experimental group. The pretest was administered to control and experimental
group to know students’ english writing achievement before treatment. The
purpose of given pretest to the students was to know the ability of the students in
learning writing before the writing was given through Tourism Brochures as a
Media.
26
3.5.1.2 Posttest
The posttest was administrated to control group and experiment group
after pretest and treatment to know students’ english writing ability score after
treatment. The result of this test was compared to the result pretest in order to
know the effect of teaching descriptive writing through Tourism Brochures as a
Media to the students’ writing achievement. From the posttest, the writer was able
to get the data that could be used to measure the students’ progression taught by
using Tourism Brochures as a Media.
3.6 Research Instrument Analysis
3.6.1 Validity Test
Cresswell (2012, p. 159) puts forward the definition of validity as follows:
Validity is the development of sound evidence to demonstrate that the best
interpretation (of scores about the concept or construct that the test is assumed to
measure) matches its proposed use. In this study, the writer used content validty.
3.6.1.1 Content Validty
Content validity refers to judgments on the content and logical structure
of an instrument as it is to be used in a particular study (Frankel et al., 2012,
p.162). In order to judge whether or not a test has content validity, a specification
of the skills or structures should be made based on the curriculum and syallabus.
In this study, the writing test was arranged based on the objective of the study,
curriculum, and syllabus. The result analysis in content validity was described in
27
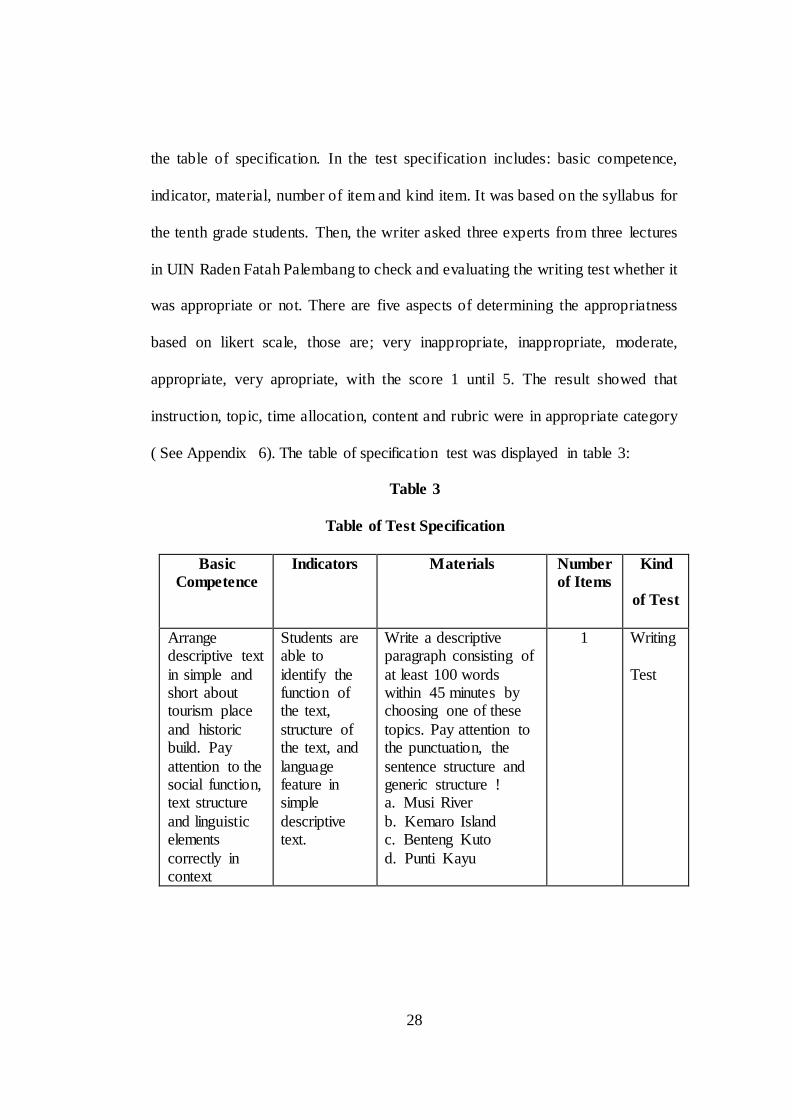
the table of specification. In the test specification includes: basic competence,
indicator, material, number of item and kind item. It was based on the syllabus for
the tenth grade students. Then, the writer asked three experts from three lectures
in UIN Raden Fatah Palembang to check and evaluating the writing test whether it
was appropriate or not. There are five aspects of determining the appropriatness
based on likert scale, those are; very inappropriate, inappropriate, moderate,
appropriate, very apropriate, with the score 1 until 5. The result showed that
instruction, topic, time allocation, content and rubric were in appropriate category
( See Appendix 6). The table of specification test was displayed in table 3:
Table 3
Table of Test Specification
Basic
Competence
Indicators Materials Number
of Items
Kind
of Test
Arrange descriptive text
in simple and short about tourism place
and historic build. Pay
attention to the social function, text structure
and linguistic elements
correctly in context
Students are able to
identify the function of the text,
structure of the text, and
language feature in simple
descriptive text.
Write a descriptive paragraph consisting of
at least 100 words within 45 minutes by choosing one of these
topics. Pay attention to the punctuation, the
sentence structure and generic structure ! a. Musi River
b. Kemaro Island c. Benteng Kuto
d. Punti Kayu
1 Writing
Test
28
3.6.2 Reliability Test
According to Creswell (2012, p159), defines reliability as the stability and
consistency of scores from an instrument. Reliability test measures whether
research instrument used for pretest and posttest activities was reliable or not.
The score of reliability were obtained from writing test analysis which is done
twice using the same sample and instruments.
To estimate the reliability of the test, the writer used inter-rater reliability.
According to Creswell (2012, p.161), inter-rater reliability is a procedure used
when making observations of behavior. It involves observations made by two or
more individuals of an individual’s or several individuals’ behavior. Moreover,
according to Brown (2004, p.35), inter-rater reliability is a common occurrence
for classroom teachers because of unclear scoring criteria, fatigue, bias toward
particular “good” and “bad” students, or simple carelessness.
Further, the reliabilty of writing test was obtained. It was measured based
on the result of expert judgement. Then, writing test was reliable. The result
showed that writing test with instruction, topic, time allocation, content and rubric
were appropriate (See Appendix 6).
3.7 Data Analysis
In analyzing the data, t-test was used to find out the significant
improvement in experimental class and significant difference for both group. T-
test was used to compare two means. The data was analyzed by using the
Statistical Package for Social Science (SPSS) version 16.
29
3.7.1 Instrument Analysis
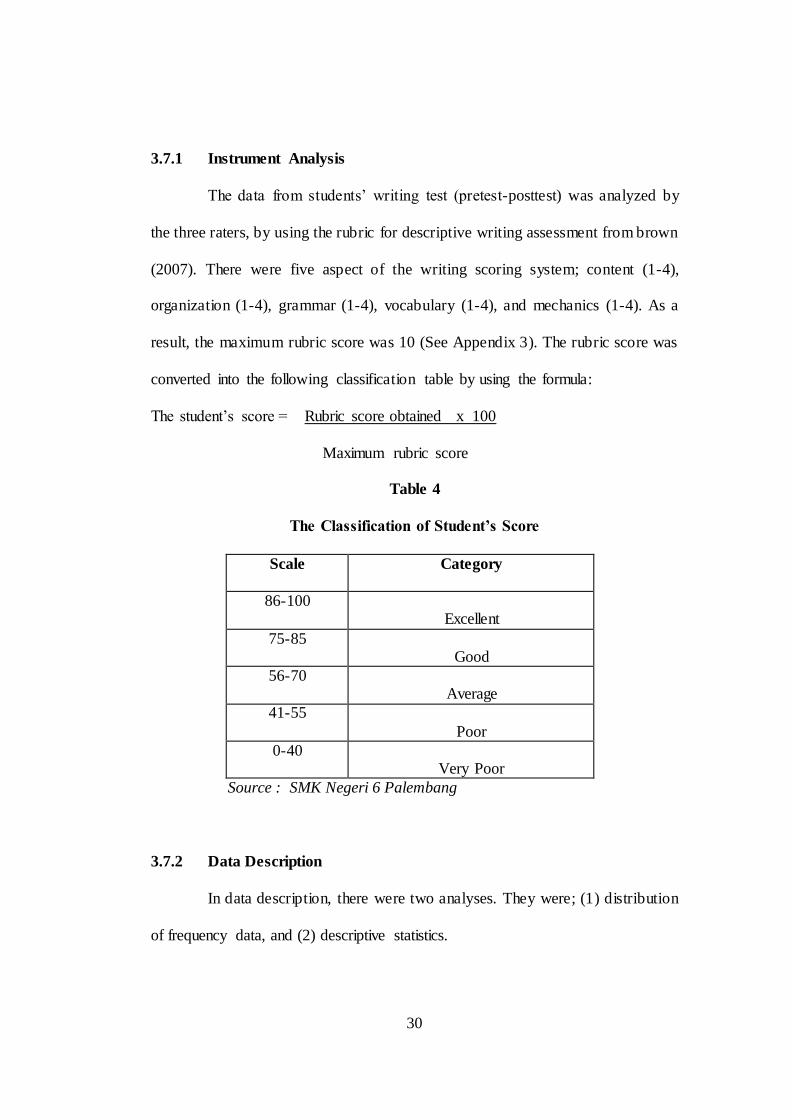
The data from students’ writing test (pretest-posttest) was analyzed by
the three raters, by using the rubric for descriptive writing assessment from brown
(2007). There were five aspect of the writing scoring system; content (1-4),
organization (1-4), grammar (1-4), vocabulary (1-4), and mechanics (1-4). As a
result, the maximum rubric score was 10 (See Appendix 3). The rubric score was
converted into the following classification table by using the formula:
The student’s score = Rubric score obtained x 100
Maximum rubric score
Table 4
The Classification of Student’s Score
Scale Category
86-100 Excellent
75-85 Good
56-70 Average
41-55
Poor
0-40 Very Poor
Source : SMK Negeri 6 Palembang
3.7.2 Data Description
In data description, there were two analyses. They were; (1) distribution
of frequency data, and (2) descriptive statistics.
30
3.7.2.1 Distribution of Data Frequency
In distribution of frequency data. The students score, frequency,
percentage were achieved. The distribution of frequency data were from the result
of pretest and posttest score in experimental group and the result of pretest and
posttest score in control group. Then, the distribution of frequency data was
displayed in a table analysis.
3.7.2.2 Descriptive Statistics
In descriptive statistics. Number of sample, the lowest score, the highest
score, mean, standard deviation, and standard error of mean were obtained.
Descriptive statistics were obtained from students’ pretest and postest score in
control and experimental groups.
3.7.3 Prerequisite Analysis
Prerequisite Analysis was an analysis which was done before testing the
research hypotheses. It measured whether or not the obtained data from students’
pretest and posttest score in both groups were normal and homogeny.
3.7.3.1 Normality Test
Normality test was used to measure whether the obtained data (data from
pretest and posttest in experimental and control) was normal or not. In measuring
normality test, one-sample Kolmogronov Smrinov was used. The data were
classified into normal whenever the p-output was higher than 0,05. (Flynn, 2003)
31
3.7.3.2 Homogenity Test
Homogenity test was used to measure the obtained scores whether it is
homogenity or not. In homogenity test, Levene Statistics was used. The data were
homogen whenever p-output was higher than 0,05 levels (Flynn, 2003).
3.7.4 Hypothesis Testing
In measuring the significant improvement and significant difference on
students’ descriptive writing by using Tourism Brochures as a Media, as follows:
Firstly, in measuring a significant improvement, paired t-test was used
for testing the students’ pretest to postest score in writing by using Tourism
Brochures as a Media in experimental group. A significant improvement was
found whenever the p-output was lower than 0,05 and t-obtained was higher than
t-table 2,045 (with df = 29).
Second, in measuring a significant difference, independent sample t-test
was used for testing the students’ posttest score in writing in control and
experimental groups. A significant difference was found whenever the p-output
was lower than 0,05 and t-obtained was higher than t-table 2,002 (with df = 58).
32
CHAPTER IV
FINDINGS AND INTERPRETATION
This chapter presents: (1) findings, and (2) interpretation.
4.1 Findings
The findings of this study were to find out: data description, prerequisite
analysis and result of hypothesis testing.
4.1.1 Data Description
Two analyses were done in data descriptions. They were distributions of
data frequency and descriptive statistics.
4.1.1.1 Distribution of Data Frequency
In the distribution of data frequency, the score, frequency, and percentage
were analyzed. The distribution of data frequency were obtained from: (1) the
result of pretest score in control group, (2) the result of pretest score in
experimental group, (3) the result of posttest score in control group and (4) the
result of posttest score in experimental group.
1) The Result of Pretest Score in Control Group
The result of distribution data frequency in pretest score of control group
showed that two students got the score 25 (6.70%), one student got the score 26
(3.33%), one one student got the score 27 (3.33%), one student got the score 28
(3.33%), two students got the score 29 (6.70%), two students got the score 30
33
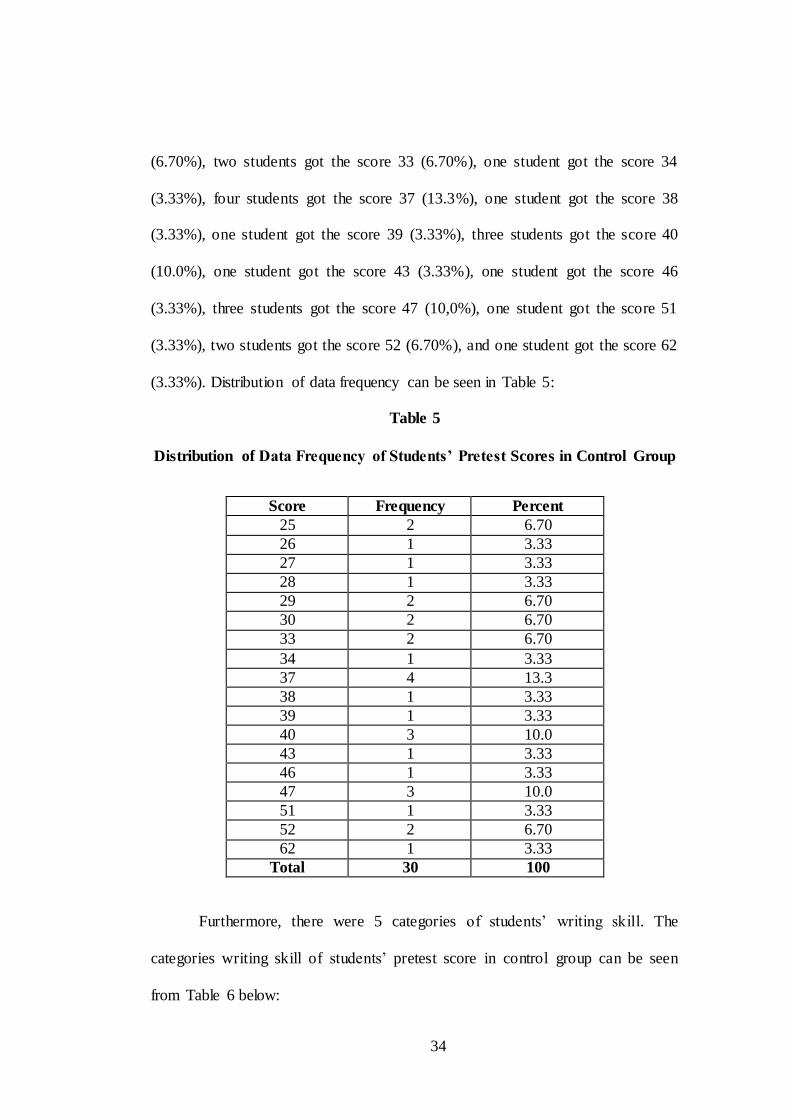
(6.70%), two students got the score 33 (6.70%), one student got the score 34
(3.33%), four students got the score 37 (13.3%), one student got the score 38
(3.33%), one student got the score 39 (3.33%), three students got the score 40
(10.0%), one student got the score 43 (3.33%), one student got the score 46
(3.33%), three students got the score 47 (10,0%), one student got the score 51
(3.33%), two students got the score 52 (6.70%), and one student got the score 62
(3.33%). Distribution of data frequency can be seen in Table 5:
Table 5
Distribution of Data Frequency of Students’ Pretest Scores in Control Group
Score Frequency Percent
25 2 6.70
26 1 3.33
27 1 3.33
28 1 3.33
29 2 6.70
30 2 6.70
33 2 6.70
34 1 3.33
37 4 13.3
38 1 3.33
39 1 3.33
40 3 10.0
43 1 3.33
46 1 3.33
47 3 10.0
51 1 3.33
52 2 6.70
62 1 3.33
Total 30 100
Furthermore, there were 5 categories of students’ writing skill. The
categories writing skill of students’ pretest score in control group can be seen
from Table 6 below:
34
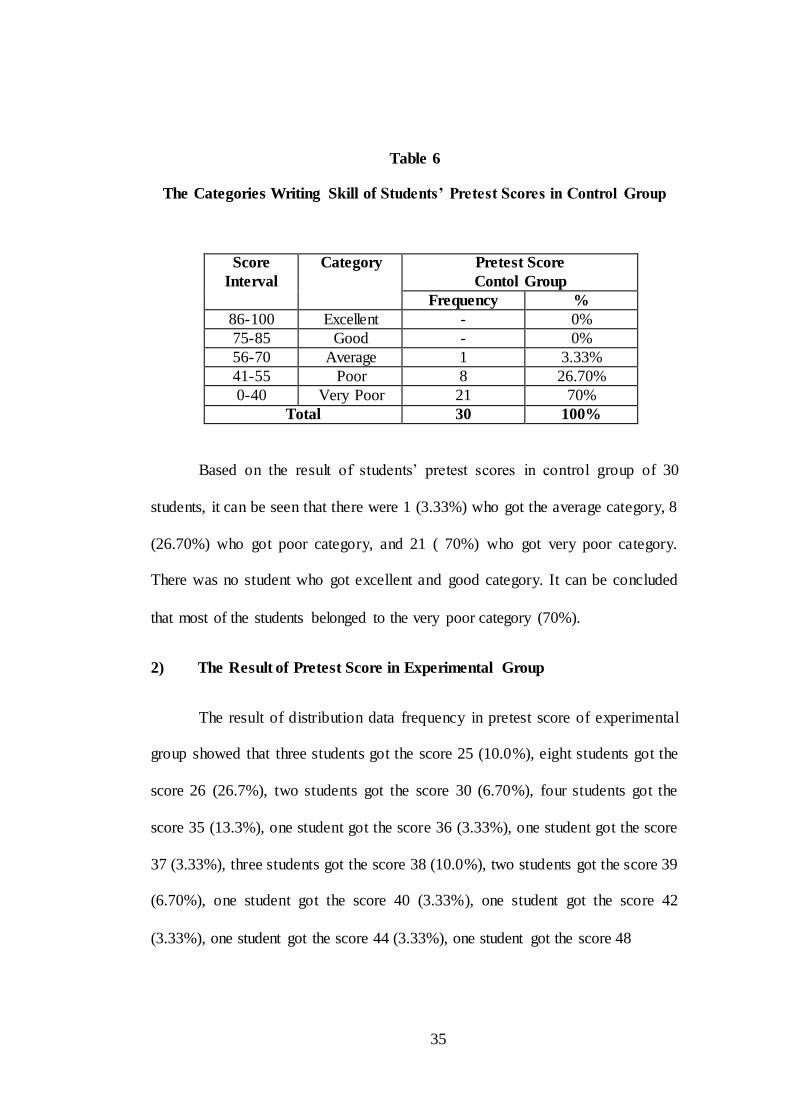
Table 6
The Categories Writing Skill of Students’ Pretest Scores in Control Group
Score
Interval
Category Pretest Score
Contol Group
Frequency %
86-100 Excellent - 0%
75-85 Good - 0%
56-70 Average 1 3.33%
41-55 Poor 8 26.70%
0-40 Very Poor 21 70%
Total 30 100%
Based on the result of students’ pretest scores in control group of 30
students, it can be seen that there were 1 (3.33%) who got the average category, 8
(26.70%) who got poor category, and 21 ( 70%) who got very poor category.
There was no student who got excellent and good category. It can be concluded
that most of the students belonged to the very poor category (70%).
2) The Result of Pretest Score in Experimental Group
The result of distribution data frequency in pretest score of experimental
group showed that three students got the score 25 (10.0%), eight students got the
score 26 (26.7%), two students got the score 30 (6.70%), four students got the
score 35 (13.3%), one student got the score 36 (3.33%), one student got the score
37 (3.33%), three students got the score 38 (10.0%), two students got the score 39
(6.70%), one student got the score 40 (3.33%), one student got the score 42
(3.33%), one student got the score 44 (3.33%), one student got the score 48
35
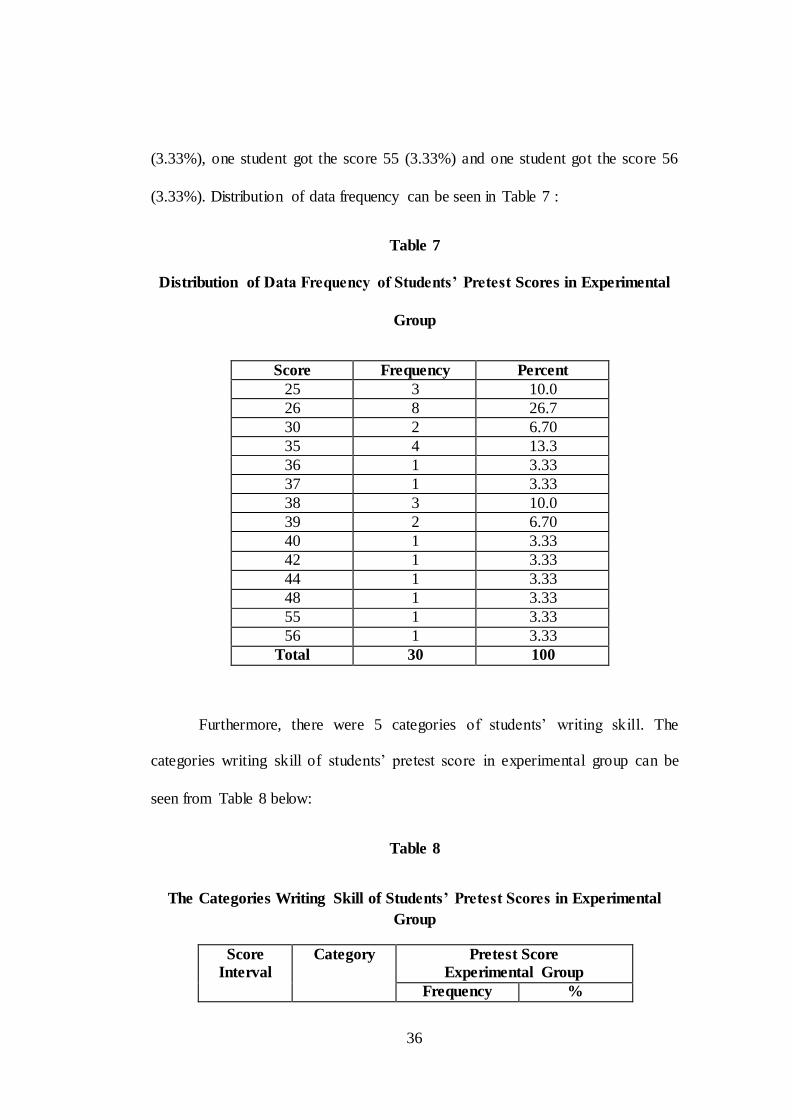
(3.33%), one student got the score 55 (3.33%) and one student got the score 56
(3.33%). Distribution of data frequency can be seen in Table 7 :
Table 7
Distribution of Data Frequency of Students’ Pretest Scores in Experimental
Group
Score Frequency Percent
25 3 10.0
26 8 26.7
30 2 6.70
35 4 13.3
36 1 3.33
37 1 3.33
38 3 10.0
39 2 6.70
40 1 3.33
42 1 3.33
44 1 3.33
48 1 3.33
55 1 3.33
56 1 3.33
Total 30 100
Furthermore, there were 5 categories of students’ writing skill. The
categories writing skill of students’ pretest score in experimental group can be
seen from Table 8 below:
Table 8
The Categories Writing Skill of Students’ Pretest Scores in Experimental
Group
36
Score
Interval
Category Pretest Score
Experimental Group
Frequency %
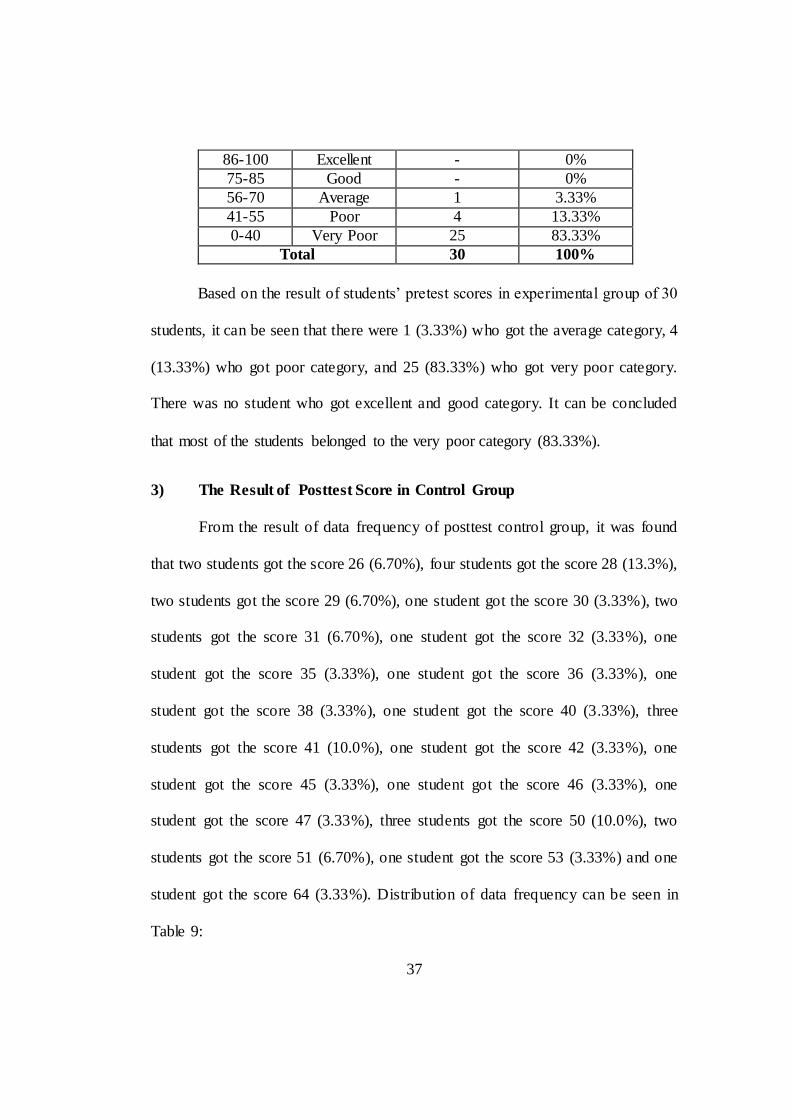
Based on the result of students’ pretest scores in experimental group of 30
students, it can be seen that there were 1 (3.33%) who got the average category, 4
(13.33%) who got poor category, and 25 (83.33%) who got very poor category.
There was no student who got excellent and good category. It can be concluded
that most of the students belonged to the very poor category (83.33%).
3) The Result of Posttest Score in Control Group
From the result of data frequency of posttest control group, it was found
that two students got the score 26 (6.70%), four students got the score 28 (13.3%),
two students got the score 29 (6.70%), one student got the score 30 (3.33%), two
students got the score 31 (6.70%), one student got the score 32 (3.33%), one
student got the score 35 (3.33%), one student got the score 36 (3.33%), one
student got the score 38 (3.33%), one student got the score 40 (3.33%), three
students got the score 41 (10.0%), one student got the score 42 (3.33%), one
student got the score 45 (3.33%), one student got the score 46 (3.33%), one
student got the score 47 (3.33%), three students got the score 50 (10.0%), two
students got the score 51 (6.70%), one student got the score 53 (3.33%) and one
student got the score 64 (3.33%). Distribution of data frequency can be seen in
Table 9:
37
86-100 Excellent - 0%
75-85 Good - 0%
56-70 Average 1 3.33%
41-55 Poor 4 13.33%
0-40 Very Poor 25 83.33%
Total 30 100%
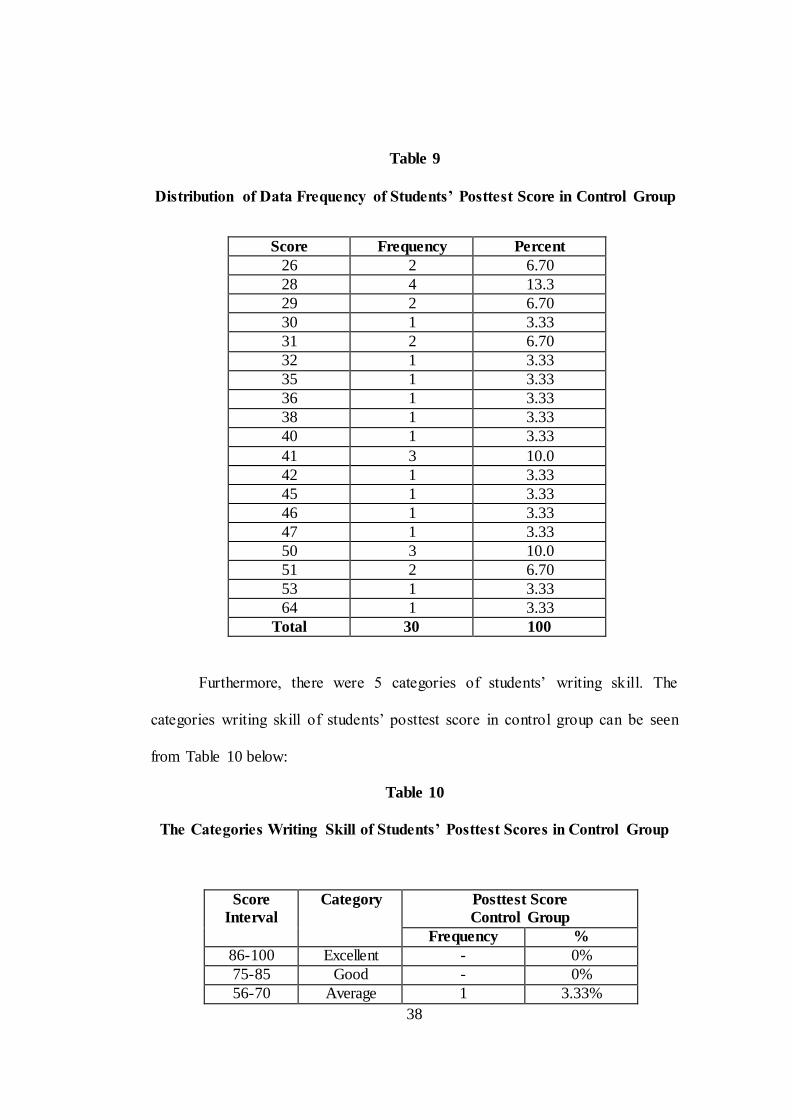
Table 9
Distribution of Data Frequency of Students’ Posttest Score in Control Group
Score Frequency Percent
26 2 6.70
28 4 13.3
29 2 6.70
30 1 3.33
31 2 6.70
32 1 3.33
35 1 3.33
36 1 3.33
38 1 3.33
40 1 3.33
41 3 10.0
42 1 3.33
45 1 3.33
46 1 3.33
47 1 3.33
50 3 10.0
51 2 6.70
53 1 3.33
64 1 3.33
Total 30 100
Furthermore, there were 5 categories of students’ writing skill. The
categories writing skill of students’ posttest score in control group can be seen
from Table 10 below:
Table 10
The Categories Writing Skill of Students’ Posttest Scores in Control Group
Score
Interval
Category Posttest Score
Control Group
Frequency %
86-100 Excellent - 0%
75-85 Good - 0%
56-70 Average 1 3.33%
38
41-55 Poor 13 43.33%
0-40 Very Poor 16 53.33%
Total 30 100%
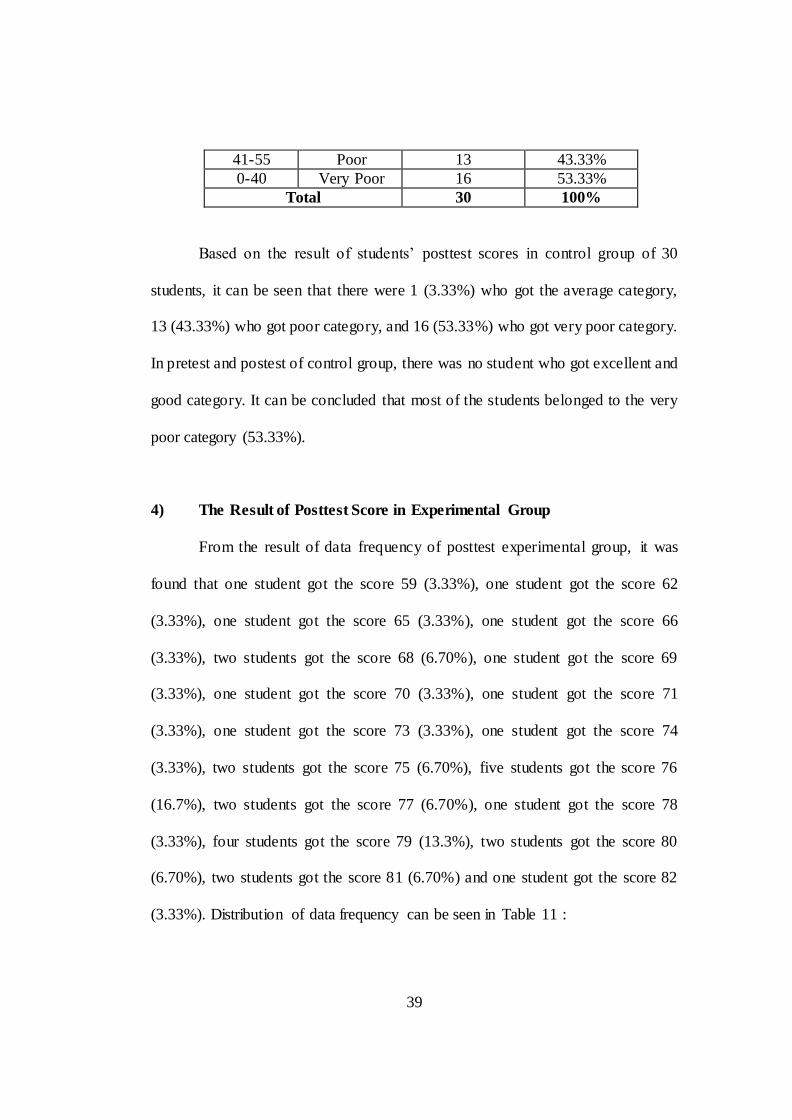
Based on the result of students’ posttest scores in control group of 30
students, it can be seen that there were 1 (3.33%) who got the average category,
13 (43.33%) who got poor category, and 16 (53.33%) who got very poor category.
In pretest and postest of control group, there was no student who got excellent and
good category. It can be concluded that most of the students belonged to the very
poor category (53.33%).
4) The Result of Posttest Score in Experimental Group
From the result of data frequency of posttest experimental group, it was
found that one student got the score 59 (3.33%), one student got the score 62
(3.33%), one student got the score 65 (3.33%), one student got the score 66
(3.33%), two students got the score 68 (6.70%), one student got the score 69
(3.33%), one student got the score 70 (3.33%), one student got the score 71
(3.33%), one student got the score 73 (3.33%), one student got the score 74
(3.33%), two students got the score 75 (6.70%), five students got the score 76
(16.7%), two students got the score 77 (6.70%), one student got the score 78
(3.33%), four students got the score 79 (13.3%), two students got the score 80
(6.70%), two students got the score 81 (6.70%) and one student got the score 82
(3.33%). Distribution of data frequency can be seen in Table 11 :
39
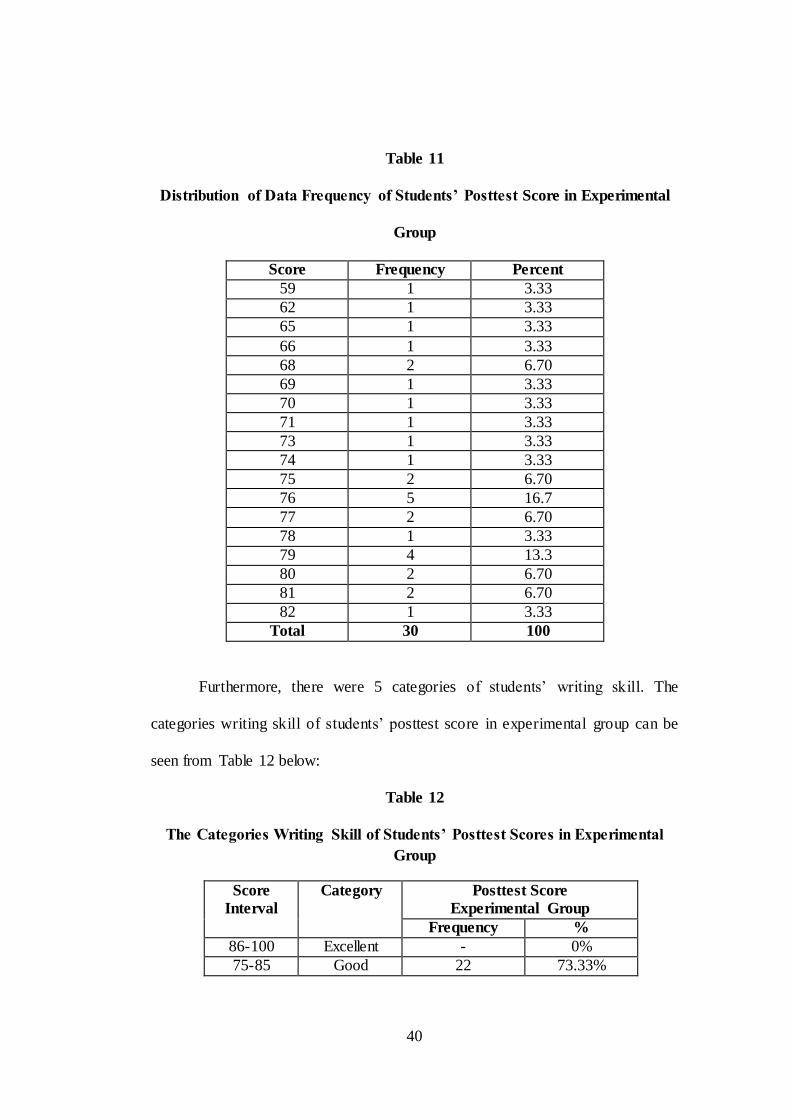
Table 11
Distribution of Data Frequency of Students’ Posttest Score in Experimental
Group
Score Frequency Percent
59 1 3.33
62 1 3.33
65 1 3.33
66 1 3.33
68 2 6.70
69 1 3.33
70 1 3.33
71 1 3.33
73 1 3.33
74 1 3.33
75 2 6.70
76 5 16.7
77 2 6.70
78 1 3.33
79 4 13.3
80 2 6.70
81 2 6.70
82 1 3.33
Total 30 100
Furthermore, there were 5 categories of students’ writing skill. The
categories writing skill of students’ posttest score in experimental group can be
seen from Table 12 below:
Table 12
The Categories Writing Skill of Students’ Posttest Scores in Experimental
Group
Score
Interval
Category Posttest Score
Experimental Group
Frequency %
86-100 Excellent - 0%
75-85 Good 22 73.33%
40
56-70 Average 8 26.70%
41-55 Poor - 0%
0-40 Very Poor - 0%
Total 30 100%
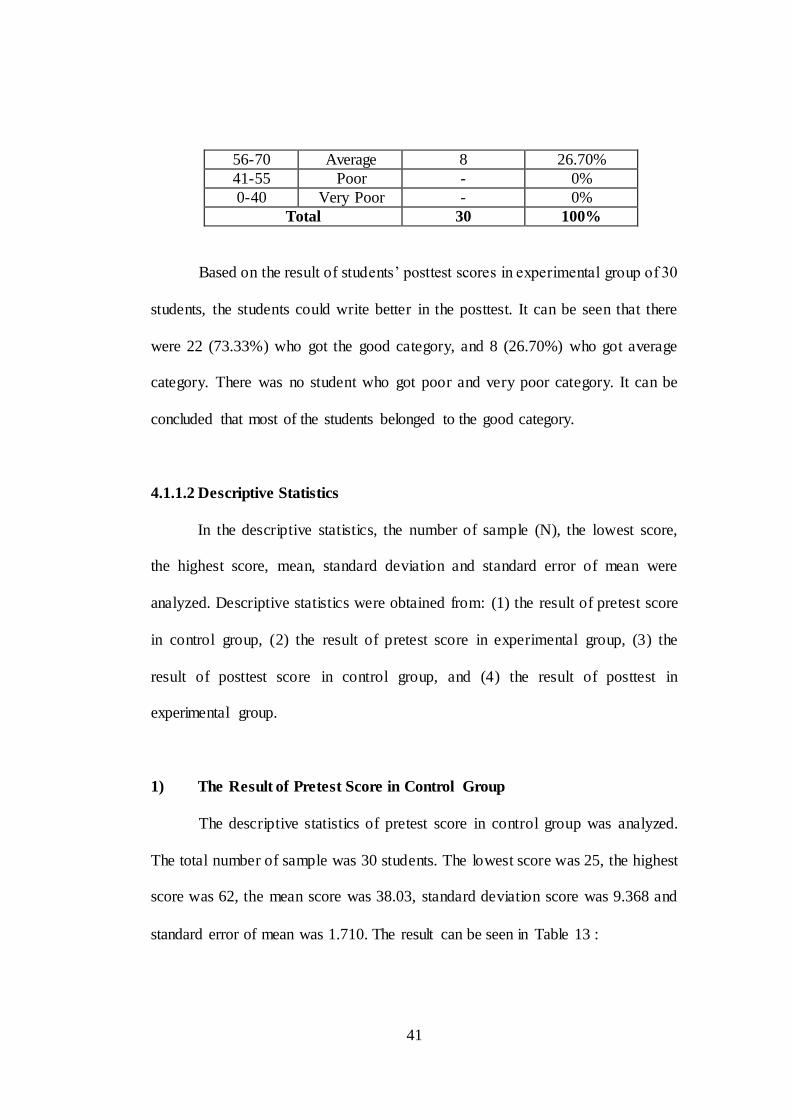
Based on the result of students’ posttest scores in experimental group of 30
students, the students could write better in the posttest. It can be seen that there
were 22 (73.33%) who got the good category, and 8 (26.70%) who got average
category. There was no student who got poor and very poor category. It can be
concluded that most of the students belonged to the good category.
4.1.1.2 Descriptive Statistics
In the descriptive statistics, the number of sample (N), the lowest score,
the highest score, mean, standard deviation and standard error of mean were
analyzed. Descriptive statistics were obtained from: (1) the result of pretest score
in control group, (2) the result of pretest score in experimental group, (3) the
result of posttest score in control group, and (4) the result of posttest in
experimental group.
1) The Result of Pretest Score in Control Group
The descriptive statistics of pretest score in control group was analyzed.
The total number of sample was 30 students. The lowest score was 25, the highest
score was 62, the mean score was 38.03, standard deviation score was 9.368 and
standard error of mean was 1.710. The result can be seen in Table 13 :
41
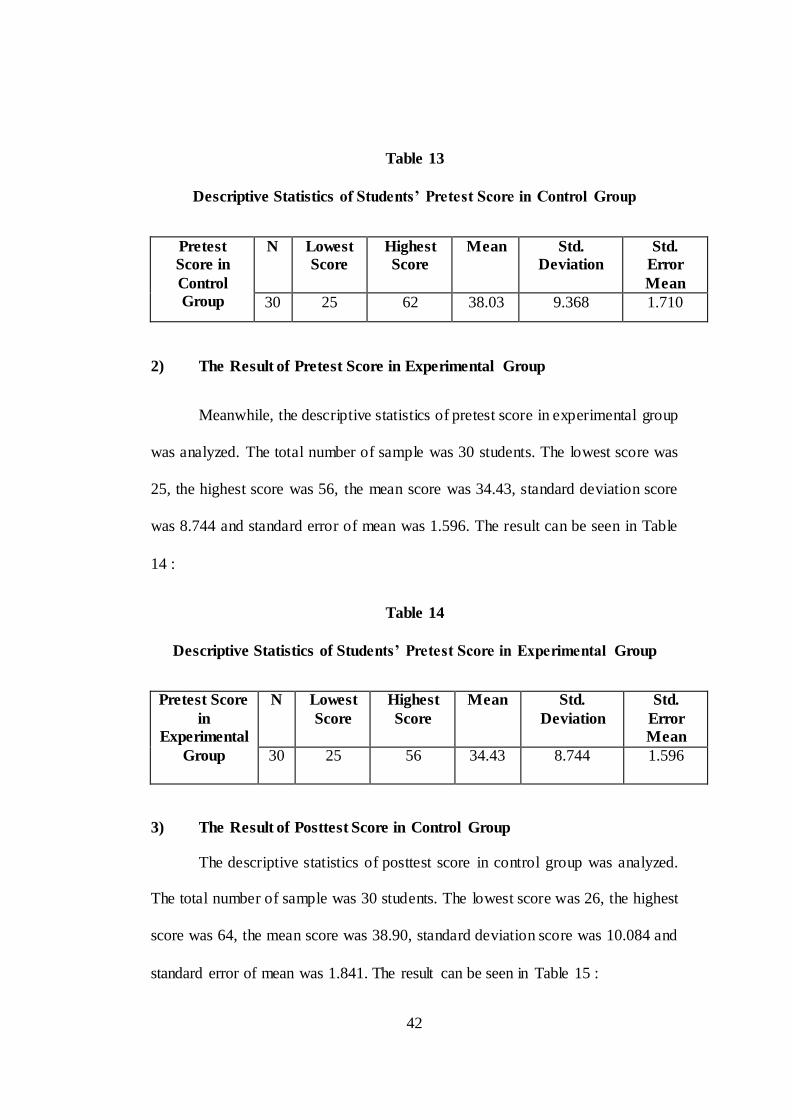
Table 13
Descriptive Statistics of Students’ Pretest Score in Control Group
Pretest
Score in
Control
Group
N Lowest
Score
Highest
Score
Mean Std.
Deviation
Std.
Error
Mean
30 25 62 38.03 9.368 1.710
2) The Result of Pretest Score in Experimental Group
Meanwhile, the descriptive statistics of pretest score in experimental group
was analyzed. The total number of sample was 30 students. The lowest score was
25, the highest score was 56, the mean score was 34.43, standard deviation score
was 8.744 and standard error of mean was 1.596. The result can be seen in Table
14 :
Table 14
Descriptive Statistics of Students’ Pretest Score in Experimental Group
Pretest Score
in
Experimental
Group
N Lowest
Score
Highest
Score
Mean Std.
Deviation
Std.
Error
Mean
30 25 56 34.43 8.744 1.596
3) The Result of Posttest Score in Control Group
The descriptive statistics of posttest score in control group was analyzed.
The total number of sample was 30 students. The lowest score was 26, the highest
score was 64, the mean score was 38.90, standard deviation score was 10.084 and
standard error of mean was 1.841. The result can be seen in Table 15 :
42
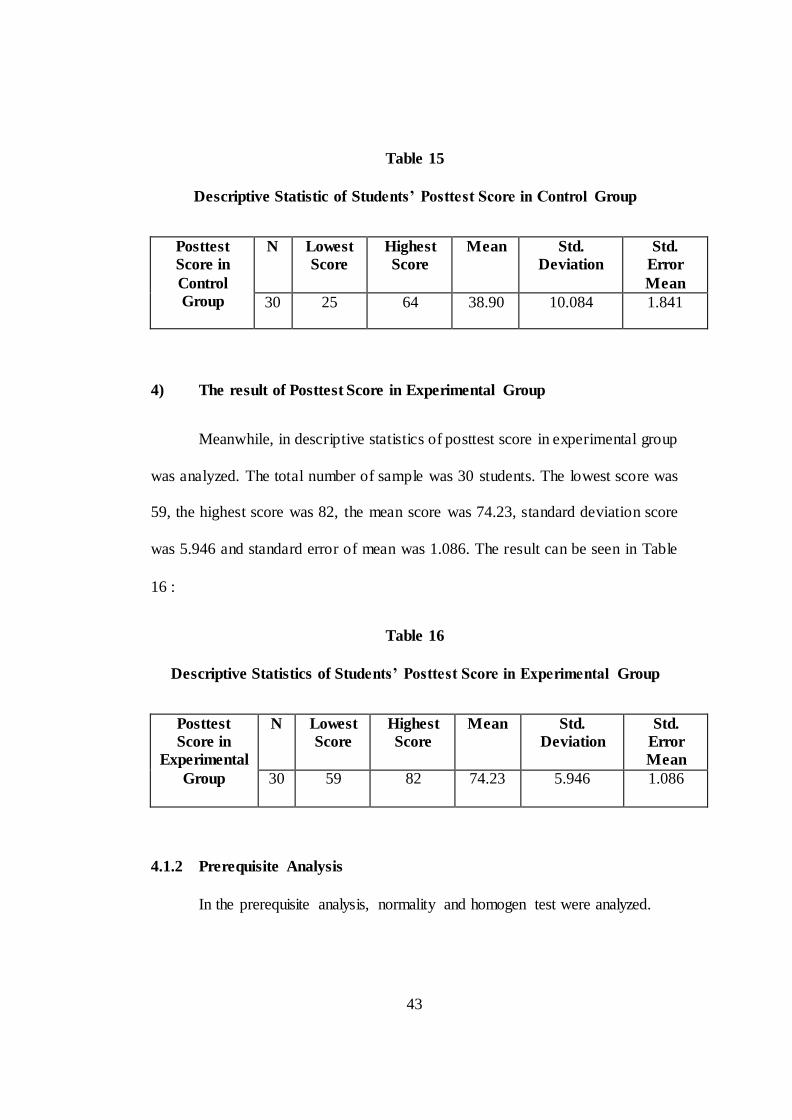
Table 15
Descriptive Statistic of Students’ Posttest Score in Control Group
Posttest
Score in
Control
Group
N Lowest
Score
Highest
Score
Mean Std.
Deviation
Std.
Error
Mean
30 25 64 38.90 10.084 1.841
4) The result of Posttest Score in Experimental Group
Meanwhile, in descriptive statistics of posttest score in experimental group
was analyzed. The total number of sample was 30 students. The lowest score was
59, the highest score was 82, the mean score was 74.23, standard deviation score
was 5.946 and standard error of mean was 1.086. The result can be seen in Table
16 :
Table 16
Descriptive Statistics of Students’ Posttest Score in Experimental Group
Posttest
Score in
Experimental
Group
N Lowest
Score
Highest
Score
Mean Std.
Deviation
Std.
Error
Mean
30 59 82 74.23 5.946 1.086
4.1.2 Prerequisite Analysis
In the prerequisite analysis, normality and homogen test were analyzed.
43
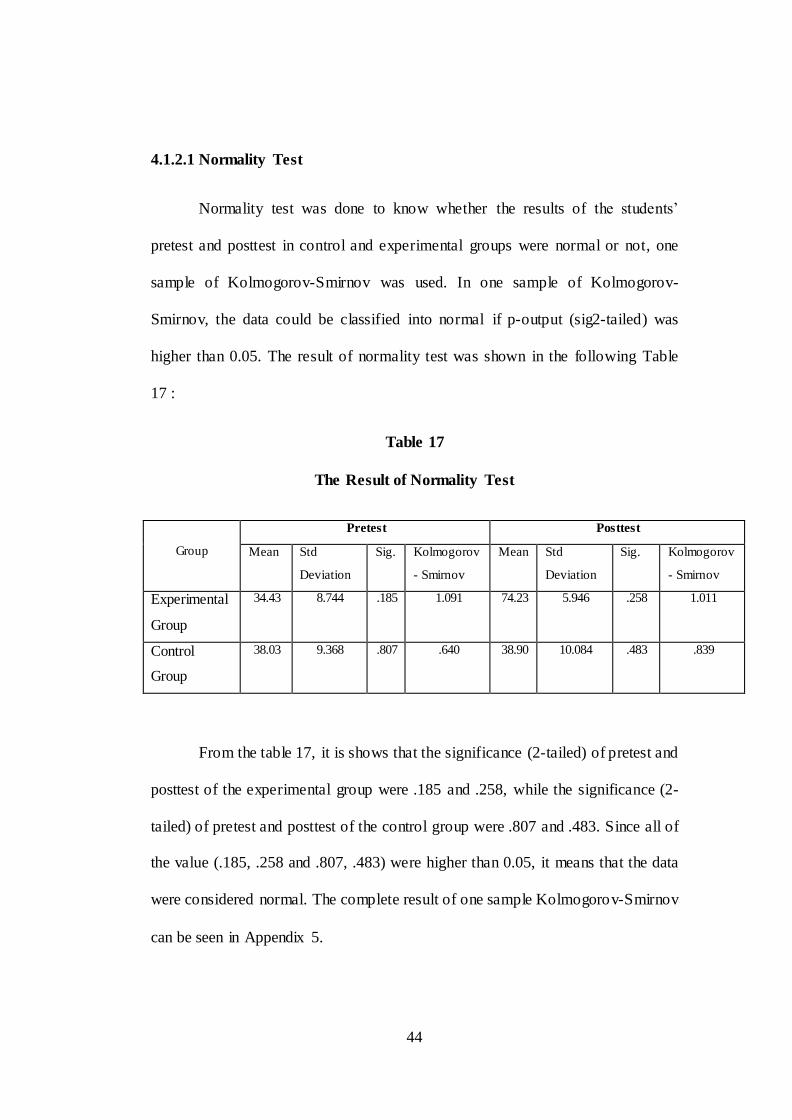
4.1.2.1 Normality Test
Normality test was done to know whether the results of the students’
pretest and posttest in control and experimental groups were normal or not, one
sample of Kolmogorov-Smirnov was used. In one sample of Kolmogorov-
Smirnov, the data could be classified into normal if p-output (sig2-tailed) was
higher than 0.05. The result of normality test was shown in the following Table
17 :
Table 17
The Result of Normality Test
Group
Pretest Posttest
Mean Std
Deviation
Sig. Kolmogorov
- Smirnov
Mean Std
Deviation
Sig. Kolmogorov
- Smirnov
Experimental
Group
34.43 8.744 .185 1.091 74.23 5.946 .258 1.011
Control
Group
38.03 9.368 .807 .640 38.90 10.084 .483 .839
From the table 17, it is shows that the significance (2-tailed) of pretest and
posttest of the experimental group were .185 and .258, while the significance (2-
tailed) of pretest and posttest of the control group were .807 and .483. Since all of
the value (.185, .258 and .807, .483) were higher than 0.05, it means that the data
were considered normal. The complete result of one sample Kolmogorov-Smirnov
can be seen in Appendix 5.
44
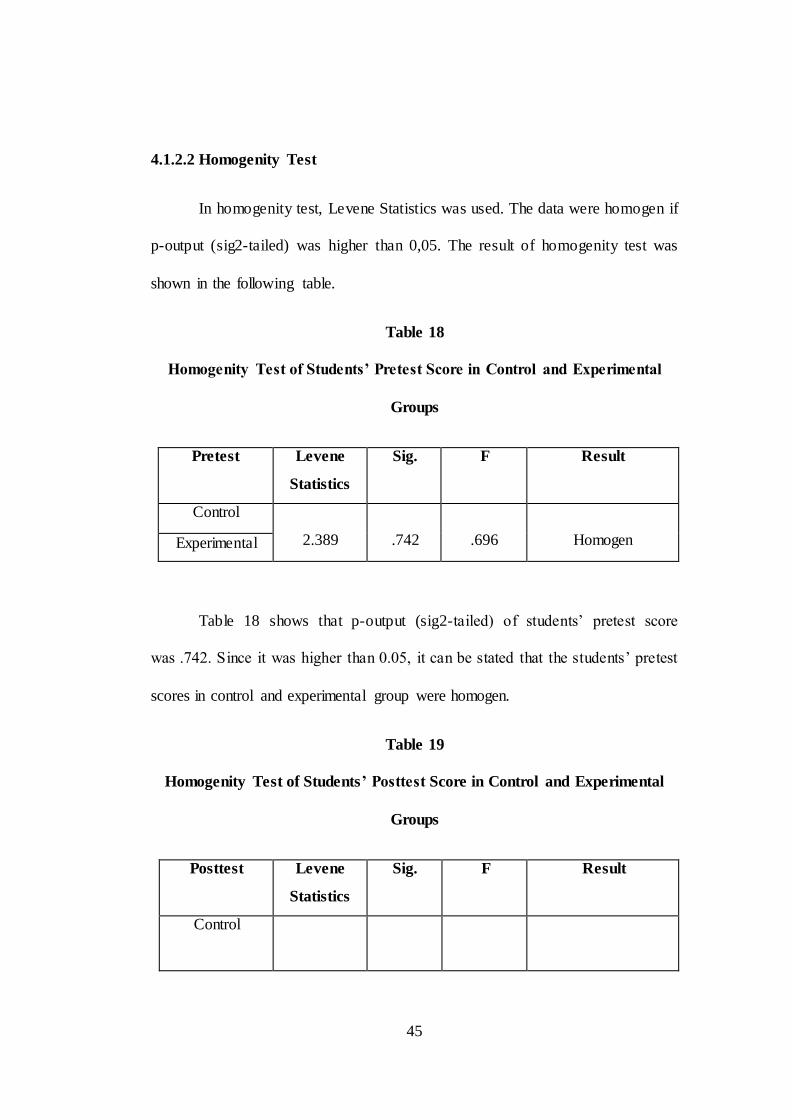
4.1.2.2 Homogenity Test
In homogenity test, Levene Statistics was used. The data were homogen if
p-output (sig2-tailed) was higher than 0,05. The result of homogenity test was
shown in the following table.
Table 18
Homogenity Test of Students’ Pretest Score in Control and Experimental
Groups
Pretest Levene
Statistics
Sig. F Result
Control
2.389
.742
.696
Homogen Experimental
Table 18 shows that p-output (sig2-tailed) of students’ pretest score
was .742. Since it was higher than 0.05, it can be stated that the students’ pretest
scores in control and experimental group were homogen.
Table 19
Homogenity Test of Students’ Posttest Score in Control and Experimental
Groups
Posttest Levene
Statistics
Sig. F Result
Control
45
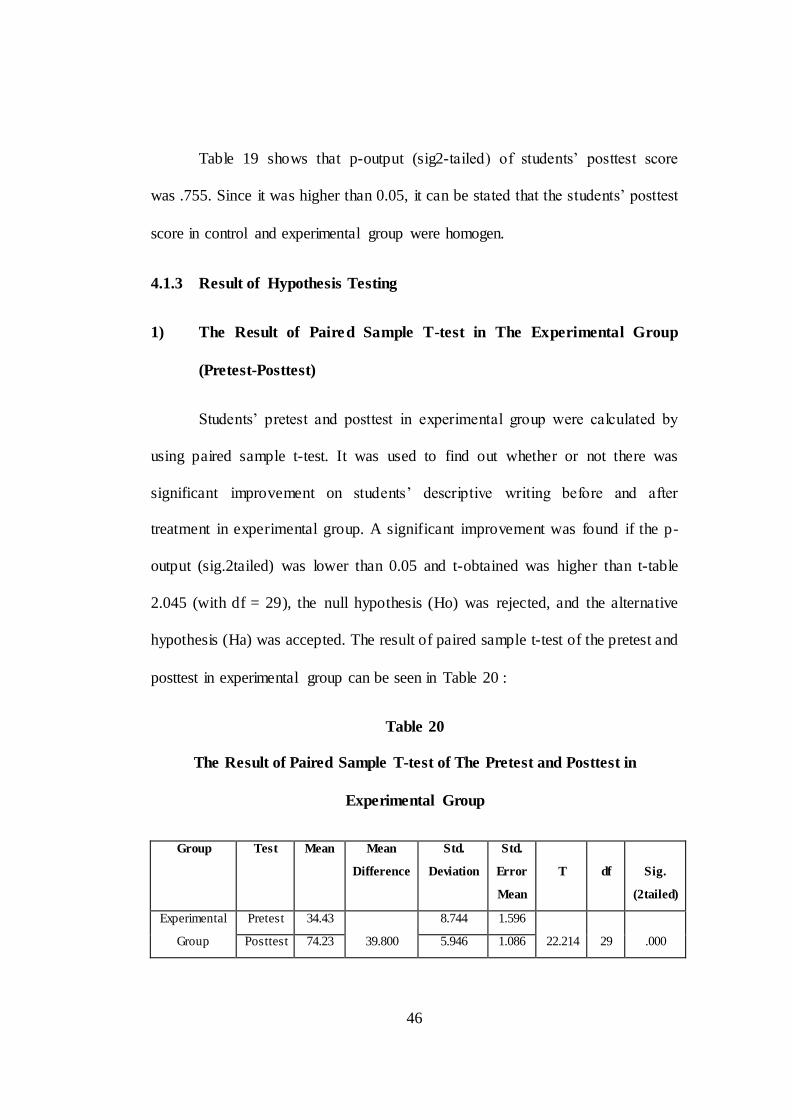
Table 19 shows that p-output (sig2-tailed) of students’ posttest score
was .755. Since it was higher than 0.05, it can be stated that the students’ posttest
score in control and experimental group were homogen.
4.1.3 Result of Hypothesis Testing
1) The Result of Paired Sample T-test in The Experimental Group
(Pretest-Posttest)
Students’ pretest and posttest in experimental group were calculated by
using paired sample t-test. It was used to find out whether or not there was
significant improvement on students’ descriptive writing before and after
treatment in experimental group. A significant improvement was found if the p-
output (sig.2tailed) was lower than 0.05 and t-obtained was higher than t-table
2.045 (with df = 29), the null hypothesis (Ho) was rejected, and the alternative
hypothesis (Ha) was accepted. The result of paired sample t-test of the pretest and
posttest in experimental group can be seen in Table 20 :
Table 20
The Result of Paired Sample T-test of The Pretest and Posttest in
Experimental Group
Group Test Mean Mean
Difference
Std.
Deviation
Std.
Error
Mean
T
df
Sig.
(2tailed)
Experimental
Group
Pretest 34.43
39.800
8.744 1.596
22.214
29
.000 Posttest 74.23 5.946 1.086
46
Based on the result of paired sample t-test in the experimental group, the mean
score of the posttest (74.23) was higher than the mean score of the pretest (34.43),
with the mean difference of pretest and posttest was 24.181. The standard
deviations of the posttest and pretest were 5.946 and 8.744 The standard error
means of the posttest and pretest were 1.086 and 1.596. Since the p-output (sig. 2-
tailed) of the experimental group was less than 0.05 (0.000 < 0.05), and t-obtained
was higher than t-table (22.214> 2.045), it can be said that the null hypothesis
(Ho) was rejected and the alternative hypothesis (Ha) was accepted. In conclusion,
it can be claimed that there was significant improvement on students’ descriptive
writing before and after treatment.
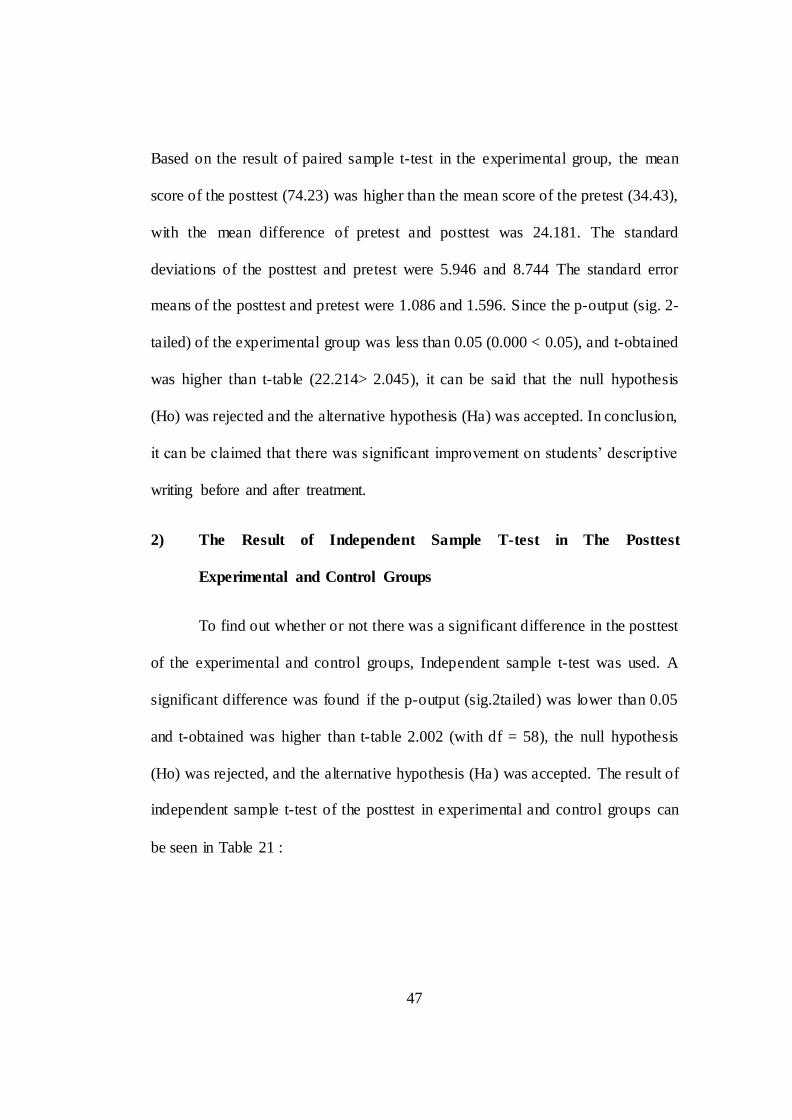
2) The Result of Independent Sample T-test in The Posttest
Experimental and Control Groups
To find out whether or not there was a significant difference in the posttest
of the experimental and control groups, Independent sample t-test was used. A
significant difference was found if the p-output (sig.2tailed) was lower than 0.05
and t-obtained was higher than t-table 2.002 (with df = 58), the null hypothesis
(Ho) was rejected, and the alternative hypothesis (Ha) was accepted. The result of
independent sample t-test of the posttest in experimental and control groups can
be seen in Table 21 :
47
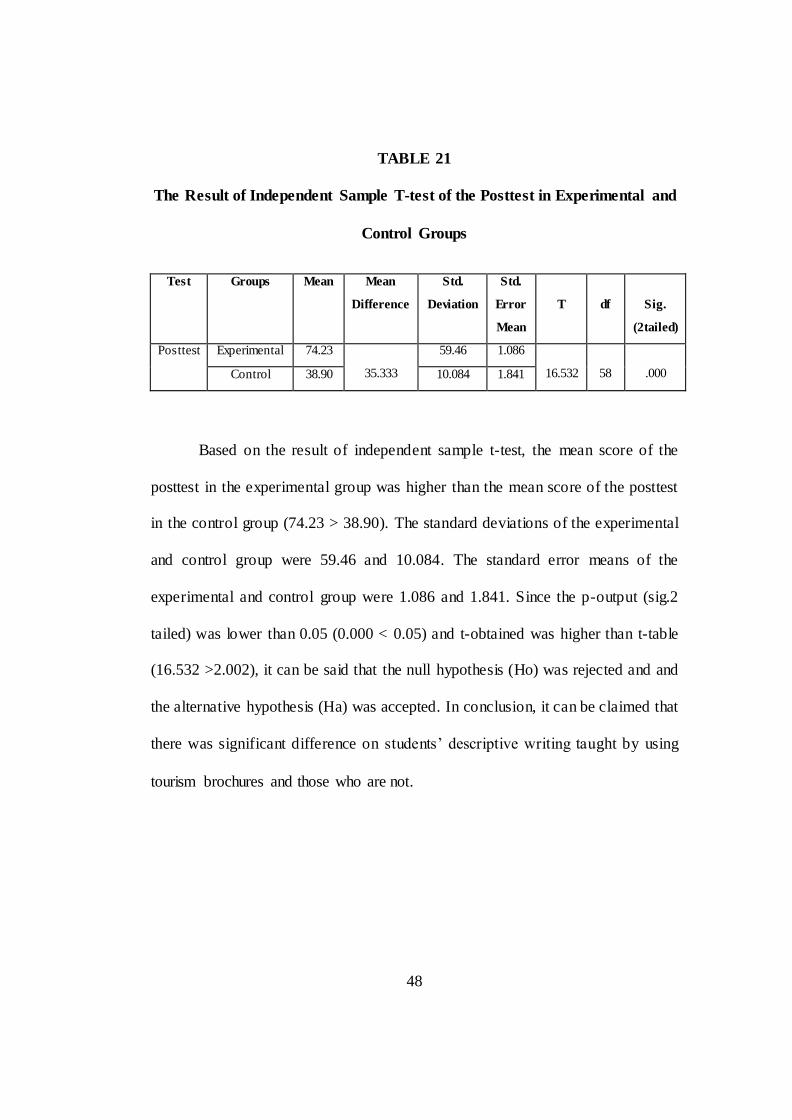
TABLE 21
The Result of Independent Sample T-test of the Posttest in Experimental and
Control Groups
Test Groups Mean Mean
Difference
Std.
Deviation
Std.
Error
Mean
T
df
Sig.
(2tailed)
Posttest Experimental 74.23
35.333
59.46 1.086
16.532
58
.000 Control 38.90 10.084 1.841
Based on the result of independent sample t-test, the mean score of the
posttest in the experimental group was higher than the mean score of the posttest
in the control group (74.23 > 38.90). The standard deviations of the experimental
and control group were 59.46 and 10.084. The standard error means of the
experimental and control group were 1.086 and 1.841. Since the p-output (sig.2
tailed) was lower than 0.05 (0.000 < 0.05) and t-obtained was higher than t-table
(16.532 >2.002), it can be said that the null hypothesis (Ho) was rejected and and
the alternative hypothesis (Ha) was accepted. In conclusion, it can be claimed that
there was significant difference on students’ descriptive writing taught by using
tourism brochures and those who are not.
48
4.2 Interpretation
Some interpretations were made based on the findings above. First, the
writer measured significant improvement on students’ descriptive writing before
and after treatment (pretest – posttest) in experimental group. The writer used
paired sample t-test to measure the significant improvement on students’ pretest
and posttest experimental group. From the result of paired sample t-test in the
experimental group, the mean score of students’ posttest was higher than the mean
score in pretest. The experimental group showed a significant improvement from
pretest to posttest. Furthermore, the result also showed that the p-output
(sig2tailed) of students’ pretest and posttest in experimental group was 0.000 and
t-obtained was 22.214. It means p-output 0.000 was lower than 0.05 and t-
obtained 22.214 was higher than t-table 2.045 (with df = 29). (See Appendix 5).
From the result, it could be interpreted that Ha was accepted and Ho was rejected.
It means that, there was significant improvement on students’ descriptive writing
before and after treatment (pretest-posttest) in experimental group. Therefore,
Tourism Brochures can be used in teaching descriptive writing.
There were some reasons which proved that there was significant
improvement (before and after treatment). In the first meeting in experimental
group, the writer gave pretest. The students felt confuse to make a paragraph and
the students were difficult to generate ideas. In the second meeting, the writer
explained about descriptive text and simple present tense. The students showed
their welcome espression but still looked embarrassed. Some students said that
they have forgot about simple present lesson, but after the writer explained about
49
it, they understood about the lesson. In the third meeting, the writer gave the
treatment by using Tourism Brochures in the experimental group while the control
group was not given treatment. The students were enthusiastic with Tourism
Brochure media implementation in learning process. They were interested and had
fun with Tourism Brochure because Tourism Brochure consist of picture. It is also
strengthened by Werff (2003) pictures are good sources material for practicing
speaking, listening, writing, vocabulary, and grammar, it can stimulate students to
come up with their many more effective and enjoyable activities. Next meeting,
students could express their ideas and easier to got vocabulary. When teaching
learning process was running, the students never did any negative things in the
class and the students always showed their spirit in learning process. The most
important, the use of tourism brochure in the experimental group gave a good
contribution in improving students’ descriptive writing achievement. It could be
seen from the result posttest which was better than pretest. Similarly by Gayatri
(2015), the result of her research showed that the improvement in descriptive
writing by using tourism brochure in experimental group happened in all writing
aspects, such as, organization, word choice, sentence structure, ideas, and
mechanics.
Second, the writer measured significant difference in the posttest of the
experimental and control groups. The writer used Independent sample t-test to
measure the significant difference on students’ posttest experimental and control
groups. The result of independent sample t-test showed that there was significant
difference between the mean score of the posttest in the experimental group was
50
higher than the mean score of the posttest in the control group (74.23 > 38.90).
Furthermore, the result also showed that the p-output (sig2tailed) of students’
posttest in the experimental and control groups was 0.000 and t-obtained was
16.532. It means p-output (0.000) was lower than 0.05 and t-obtained 16.532 was
higher than t-table 2.002 (with df = 58). (See appendix 5). From the result, it
could be interpreted that Ha was accepted and Ho was rejected. It means that,
there was significant difference in the posttest between experimental and control
group (students’ descriptive writing taught by using tourism brochures and those
who are not).
There were some reasons which proved that Ha was accepted and there
was significant difference. First, in experimental group that was taught by using
tourism brochures as the media was better than the control group that was not
given treatment. Second, the use of tourism brochures in experimental group
could improve the students’ score from pretest to posttest. Using tourism brochure
in experimental group made the students got more knowledge and information,
new vocabulary and generate ideas. Similarly, Prima (2012) states that the use of
tourism brochures in the classroom was valuable and it could make students more
active in teaching and learning process. It was proved by the improvement of
students’ score in the posttest. In line with the prima’s study, the writer also found
the significant difference on students’ descriptive writing taught by using tourism
brochures and those who are not.
From the result above, there are some reasons why tourism brochures
could be considered as the media for teaching descriptive writing, and especially
51
Tourism Brochures was effective source to teach descriptive writing. According
to Kurniawan and Rosa (2013), tourism brochures consists of the colorful picture,
and brief information/description. Furthemore, it helped students to generate their
idea in writing and it provided more information and it gave more stimulation for
them to explore all their ideas, from the picture that can help the students to get
some vocabularies that they need to arrange. It was also supported by Sari and
Rozani (2013), the use of tourism brochures as the media can make students feel
comfort and enjoy in studying, get new vocabularies about the object to be
described and tourism brochures are one of media that some teachers could
consider to use it in teaching english.
In conclusion, tourism brochure was effective media to improve
descriptive writing achievement and tourism brochures had some advantages for
teacher and students.
52
CHAPTER V
CONCLUSIONS AND SUGGESTIONS
This chapter presents : (1) conclusions and (2) suggestions based on the
findings and interpretation in the previous chapter.
5.1 Conclusions
Based on the findings and interpretations presented in the previous chapter,
it can be concluded that there was a significant improvement on the tenth grade
hotel accommodation students’ descriptive writing before and after the treatment
at SMK Negeri 6 Palembang and there was a significant difference on the tenth
grade hotel accommodation students’ descriptive writing taught by using tourism
brochures and those who are not at SMK Negeri 6 Palembang. The students in
experimental group who were taught by using tourism brochures showed better
improvement in writing test (pretest – posttest). It can be seen from students'
progress in learning writing process. The students were enjoyed, became active
and had spirit in learning writing. They were not lazy to make a paragraph
because tourism brochures helped the students explore and generate their ideas to
be described. Moreover, the students became more confident in expressing their
ideas. It means that tourism brochure can improve students’ descriptive writing
achievement and tourism brochures was effective media in teaching descriptive
writing.
53
5.2 Suggestions
Based on the conclusion above. Some suggestions are offered to the
english teacher, students, and next researchers.
For English teacher, teachers should be more creative and innovative in
teaching English. The teachers should also motivate the students and give positive
response toward the students. Therefore, Toursim Brochures can be used as a
media in teaching descriptive writing in class because the students will not be
afraid to write and be more confident to put their idea in writing descriptive.
For students, the writer also suggest the students to be active and creative
in the classroom. The students should be more confident in expressing their idea,
read more books to enlarge their knowledge. The students should try to write
more often because the effective way to improve writing skill is keep practicing.
Therefore, they should enrich their vocabulary and improve their grammar in
writing.
For next researchers, the writer also hopes that this study can be reference
for the next study related. The lacks and the weaknesses of this study hopefully
can be completed by the next researcher. Overall, the writer hopes that this study
will be something useful for everyone.
54
REFERENCES
Bagun, R. (2009, August 5). KG fair ingin tingkatkan minat membaca dan menulis. Kompas. Retrieved from http://tekno.kompas.com/read/2009/08/05/15371544/kg.fair.ingin.tingkatk
an.minat.membaca
Bera, L. K. (2009, August 1). Belajar bahasa Inggris, lebih cepat lebih baik. Kupang Tribun News. Retrieved from http://kupang.tribunnews.com/2009/08/01/belajar-bahasa- inggris- lebih-
cepat-lebih-baik
Brown, H. D. (2001). Teaching by principles: An introduction to language pedagogy. San Francisco, CA: State University.
Brown, H. D. (2004). Langguage assessment: Principle and classroom practices. San Francisco, CA: Longman.
Brown, H. D. (2007). Principles of langguage learning and teaching (5th ed.). White Plains, NY: Pearson Education, Inc.
Christensen, L., & Johnson, B. (2012). Educational research: Quantitative, qualitative, and mixed approaches (4th ed). Thousand Oaks, California:
Sage Publication, Inc.
Cohen, L., Manion, L., & Morrison. (2007). Research methods in education
(6th ed). London: Routledge.
Creswell, J. W. (2012). Educational research: Planning, conducting, and evaluating, quantitative and qualitive reseacrh (4th ed.). Boston, MA: Pearson Education, Inc.
Defazio, J., Hook, S. A., Jones, J., & Tennant, F. (2010). The importance and impact of writing across the curriculum - a case study. Journal of the
Scholarship of Teaching and Learning, 10(2), 34-47.
Depdiknas. (2013). Modul dan silabus kelas X SMA/SMK/MAN Bahasa Inggris. Jakarta: Departemen Pendidikan dan Kebudayaan.
Faisal., & Suwandita, K. (2013). The effectiveness of FRESH technique to teach descriptive paragraph. Journal of Education and Learning, 7(4), 239-248.
Flynn, D. (2003). Students guide to SPSS. Barnard College - Columbia University. Retrieved from:
https://barnard.edu/sites/default/files/inline/student_user_guide_for_spss.p df
55
Fraenkel, J. R., Wallen, N. E., & Hyun, H. H. (2012). How to design and evaluate
research in education (8th ed.). New York, NY: McGraw-Hill.
Gayatri, L. (2015). Using tourism brochures to improve descriptive writing
achievement of the tenth grade students of SMA 14 Palembang. (Undergraduated Thesis). Sriwijaya University.
Graham, S., & Perin, D. (2007). Writing next: Effective strategies to improve writing of adolescents in middle and high school – A report to Carnegie
Corporation of New York. Washington, DC: Alliance for Excellent.
Grenville, K. (2001). Writing from start to finish: A six – step guide. Australia:
Allen & Unwin.
Harmenita, R. Y., & Tiarina, Y. (2013). Teaching writing a desciptive text by using environmental observation strategy. Journal of English Language Teaching, 1(2), 30-38.
Harmer, J. (2004). The practice of English language teaching. Essex, England: Pearson Education Limited.
Harmer, J. (2007). How to teach English. Essex, England: Pearson Education
Limited.
Heaton, J. B. (2005). Writing english language test. New York, NY: Longman,
Inc.
Howard, W. (1998). Communicative language teaching. Cambridge: Cambridge
University Press.
Inderawati, R., & Hayati, R. (2011). Short – term training model of academic writing to high school teachers. US-China Foreign Language, 9(8), 517- 523. Retrieved from http://eprints.unsri.ac.id/2723/1/Short-
Term_Training_Model_of_Academic_Writing_to_High_School_Teachers. pdf
Ismawarningtyas, G. M. (2015). The use of tourism brochures as media to improve students’ motivation in learning vocabulary. (Undergraduated
Thesis). Semarang State University. Retrieved from http://lib.unnes.ac.id/20516/1/2201411068-S.pdf
Johari, S. K. (2008). Building vocabulary and improving writing while developing a tourist brochure. English Teaching Forum. 2, 38-41. Retrieved from
https://americanenglish.state.gov/files/ae/resource_files/08-46-2-e.pdf
Kane, T. S. (2000). Oxford essential guide to writing. New York, NY: Barkleys
Books.
Khak, A. (2011, November 23). Tradisi menulis lebih rendah daripada minat baca.
Kompas. Retrieved from
56
http://edukasi.kompas.com/read/2011/11/23/10491011/Tradisi.Menulis.Le
bih.Rendah.daripada.Minat.Baca
Kurniawan, C., & Rosa, R. N. (2013). Using tourism brochure pictures to generate
ideas in improving junior high school student’s speaking ability. Journal of English Language Teaching, 1(2), 400-408.
Latifah, A. (2016). Teaching descriptive writing through fresh technique with cinquin to the tenth grade students of SMAN 1 Inderalaya.
(Undergraduated Thesis). Sriwijaya University.
Mayers, A. (2005). Gateways to academic writing: Effective sentence, paragraphs
and essays. White Plains, NY: Pearson Education.
Mursyid, M. P. (2011). Learning descriptive text. Retrieved from http://mmursyidpw.files.wordpress.com/2011/02/learning-description.pdf
Nunan, D. (2003). Practical english language teaching. New York: McGraw Hill.
Nurfuadah, R. N. (2013, September 10). Ini penyebab kampus RI lemah di dunia.
Okezone News. Retrieved from http://news.okezone.com/read/2013/09/10/373/863655/ini-penyebab-
kampus-ri-lemah-di-dunia
Oshima, A., & Hogue, A. (2007). Writing academic english (4th ed.). New York,
NY: Pearson Longman.
Pennisi, L. A., Gunawan, Y., Major, A. L., & Winder, A. (2011). How to create
an effective brochure. Retrieved from http://ianrpubs.unl.edu/live/g2028/build/g2028.pdf.
Pininta, A. (2016, April 7). Rajin menulis menjaga ketajaman otak. Kompas. Retrieved from
http://health.kompas.com/read/2016/04/07/160700323/Rajin.Menulis.Men jaga.Ketajaman.Otak
Prima, A. E. (2012). Improving class XI IPS 1 students’ speaking achievement by using brochures at SMA Negeri 1 Kencong. (Undergraduated Thesis).
Universitas Muhammadiyah, Surabaya.
Putri, T. T. (2012). The effectiveness of teaching writing descriptive text using
tourism brochures at the eight grade students of SMPN 1 Wonosobo in academic year 2012/2013. English Research Articels, 1(2).
Raimes, A. (1983). Techniques in teaching writing. Oxford: Oxford Univesity Press.
Sari, N., & Rozani, A. F. (2013). Using tourism brochures in teaching English at vocational high school of tourism. Journal of English Language Teaching,
1(2), 98-104.
57
Seyabi, F. A., & Tuzlukova, V. (2014). Writing problems and strategies: An
investigative study in the Omani school and univesity context. Asian Journal of Social Sciences & Humanities, 3(4), 37-48.
Siahaan, S., & Shinoda, K. (2008). English writing for junior high school.
Retrieved from https://www.google.com/search?q=Siahaan%2C+S+%26+Shinoda%2C+K
.+%282008%29.+English+writing+for+junior+high+school.Yogyakarta% 3A+Graha+Ilmu.&ie=utf-8&oe=utf- 8&aq=t&rls=org.mozilla:id:official&client=firefox-a&gws_rd=ssl
Spelkova, I., & Hurst, N. (2008). Teachers’ attitudes to skill and writing process
in Latvia and Portugal. Retrieved from http://web.letras.up.pt/nrhurst/Writing%20Article%20for%20APPI%20Jo urnal.pdf
Subekti, N. B. (2015, April 13). Rangking publikasi ilmiah internasional
Indonesia. Sindo News. Retrieved from http://nasional.sindonews.com/read/988644/162/rangking-publikasi- ilmiah- internasional- indonesia-1428903924
Valette, R. (1977). Modern language testing. San Diego, CA: Harcourt Brace Jovanovich.
Werff, J. V. (2003). Using picture from megazines. The internet TESL Journal.
9(7).
Zhang, B. (2013). An analysis of spoken language and written language and how
they affect english language learning and teaching. Journal of Language Teaching and Research, 4(4), 1-5.
58
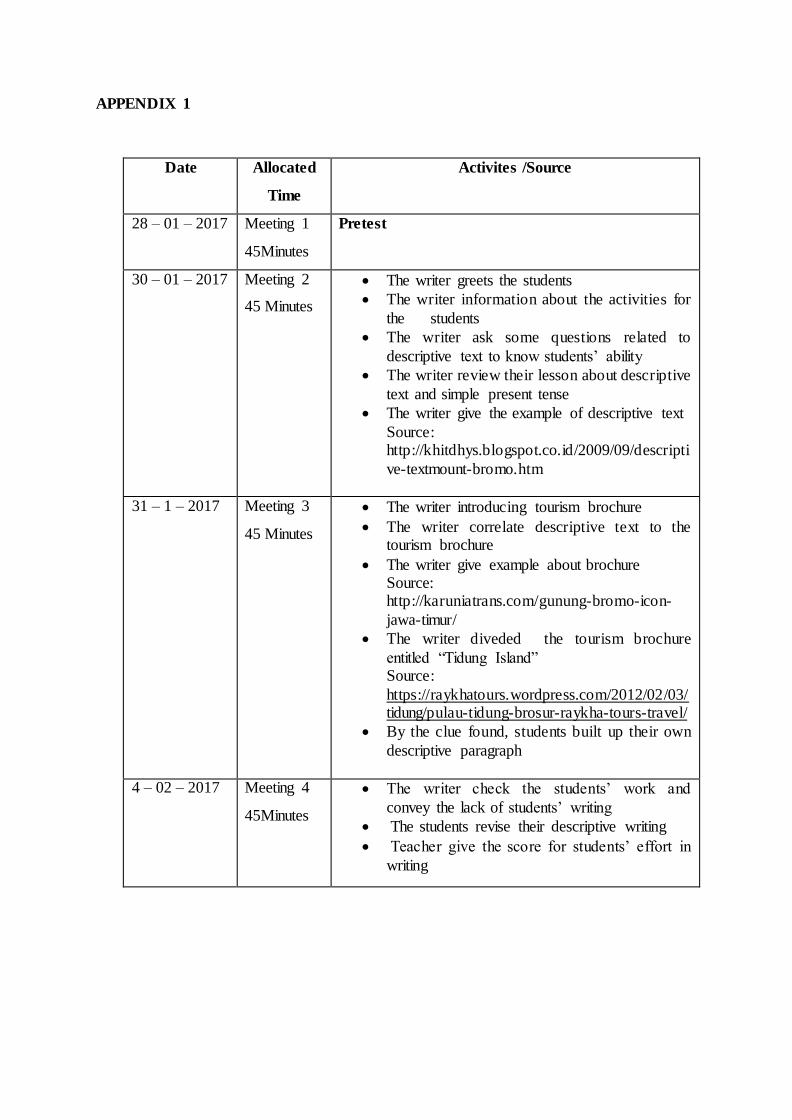
APPENDIX 1
Date Allocated
Time
Activites /Source
28 – 01 – 2017 Meeting 1
45Minutes
Pretest
30 – 01 – 2017 Meeting 2
45 Minutes
The writer greets the students
The writer information about the activities for
the students
The writer ask some questions related to
descriptive text to know students’ ability
The writer review their lesson about descriptive
text and simple present tense
The writer give the example of descriptive text
Source: http://khitdhys.blogspot.co.id/2009/09/descripti
ve-textmount-bromo.htm
31 – 1 – 2017 Meeting 3
45 Minutes
The writer introducing tourism brochure
The writer correlate descriptive text to the tourism brochure
The writer give example about brochure Source: http://karuniatrans.com/gunung-bromo-icon-
jawa-timur/
The writer diveded the tourism brochure
entitled “Tidung Island” Source:
https://raykhatours.wordpress.com/2012/02/03/tidung/pulau-tidung-brosur-raykha-tours-travel/
By the clue found, students built up their own
descriptive paragraph
4 – 02 – 2017 Meeting 4
45Minutes
The writer check the students’ work and
convey the lack of students’ writing
The students revise their descriptive writing
Teacher give the score for students’ effort in
writing
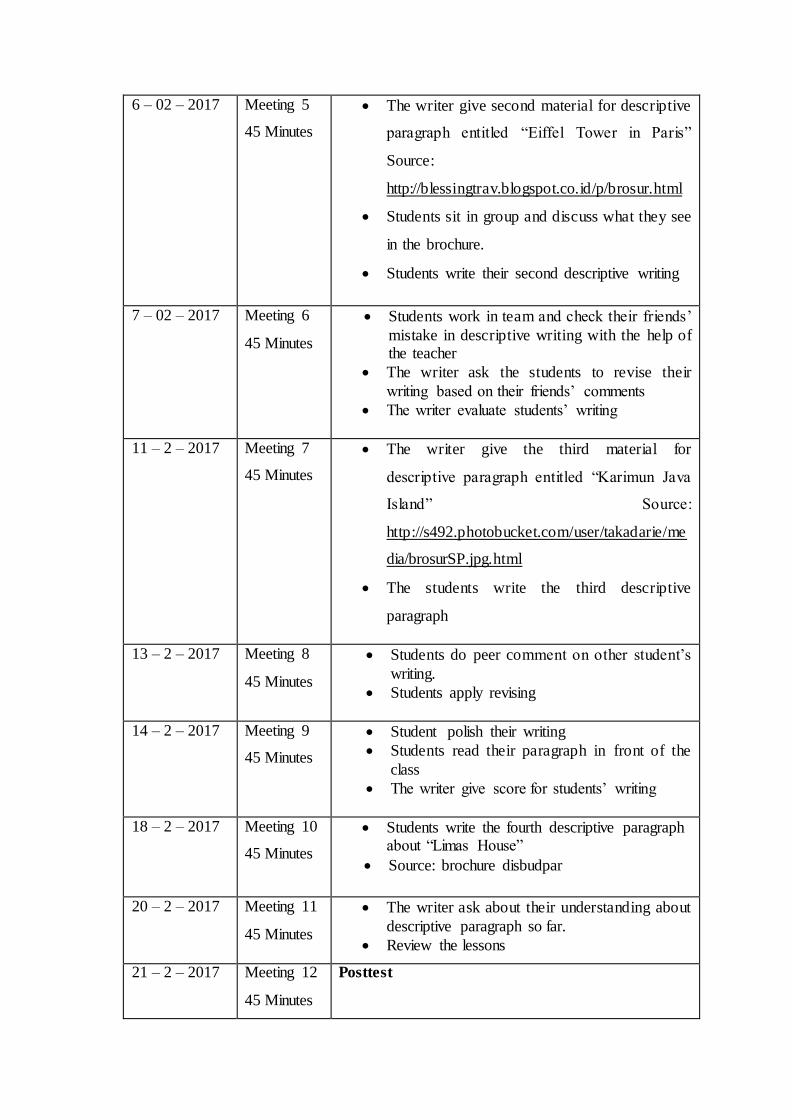
6 – 02 – 2017 Meeting 5
45 Minutes
The writer give second material for descriptive
paragraph entitled “Eiffel Tower in Paris”
Source:
http://blessingtrav.blogspot.co.id/p/brosur.html
Students sit in group and discuss what they see
in the brochure.
Students write their second descriptive writing
7 – 02 – 2017 Meeting 6
45 Minutes
Students work in team and check their friends’
mistake in descriptive writing with the help of the teacher
The writer ask the students to revise their
writing based on their friends’ comments
The writer evaluate students’ writing
11 – 2 – 2017 Meeting 7
45 Minutes
The writer give the third material for
descriptive paragraph entitled “Karimun Java
Island” Source:
http://s492.photobucket.com/user/takadarie/me
dia/brosurSP.jpg.html
The students write the third descriptive
paragraph
13 – 2 – 2017 Meeting 8
45 Minutes
Students do peer comment on other student’s
writing.
Students apply revising
14 – 2 – 2017 Meeting 9
45 Minutes
Student polish their writing
Students read their paragraph in front of the
class
The writer give score for students’ writing
18 – 2 – 2017 Meeting 10
45 Minutes
Students write the fourth descriptive paragraph about “Limas House”
Source: brochure disbudpar
20 – 2 – 2017 Meeting 11
45 Minutes
The writer ask about their understanding about
descriptive paragraph so far.
Review the lessons
21 – 2 – 2017 Meeting 12
45 Minutes
Posttest
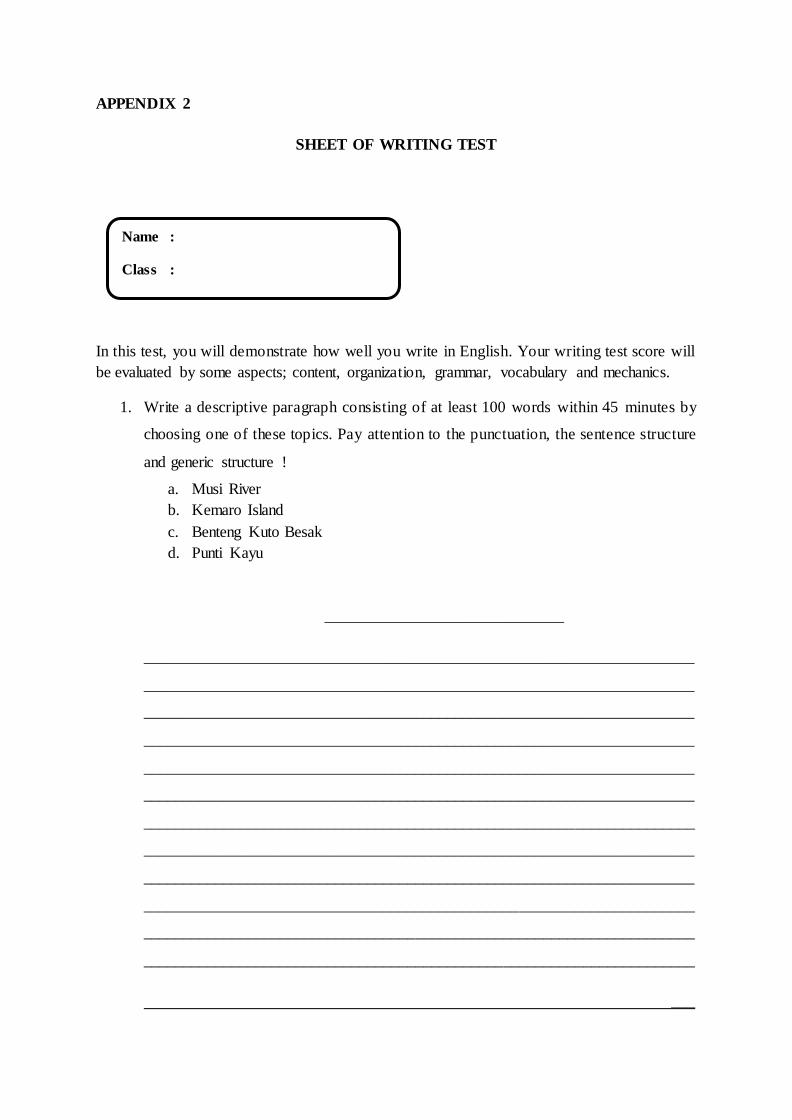
APPENDIX 2
SHEET OF WRITING TEST
In this test, you will demonstrate how well you write in English. Your writing test score will
be evaluated by some aspects; content, organization, grammar, vocabulary and mechanics.
1. Write a descriptive paragraph consisting of at least 100 words within 45 minutes by
choosing one of these topics. Pay attention to the punctuation, the sentence structure
and generic structure !
a. Musi River
b. Kemaro Island
c. Benteng Kuto Besak
d. Punti Kayu
______________________________
_____________________________________________________________________
_____________________________________________________________________
_____________________________________________________________________
_____________________________________________________________________
_____________________________________________________________________
_____________________________________________________________________
_____________________________________________________________________
_____________________________________________________________________
_____________________________________________________________________
_____________________________________________________________________
_____________________________________________________________________
_____________________________________________________________________
___
Name :
Class :

_____________________________________________________________________
_____________________________________________________________________
_____________________________________________________________________
_____________________________________________________________________
_____________________________________________________________________
_____________________________________________________________________
_____________________________________________________________________
_____________________________________________________________________
_____________________________________________________________________
_____________________________________________________________________
_____________________________________________________________________
_____________________________________________________________________
_____________________________________________________________________
_____________________________________________________________________
_____________________________________________________________________
_____________________________________________________________________
_____________________________________________________________________
_____________________________________________________________________
_____________________________________________________________________
_____________________________________________________________________
_____________________________________________________________________
_____________________________________________________________________
_____________________________________________________________________
_____________________________________________________________________
_____________________
_________
APPENDIX 3
Writing Rubric For Writing Descriptive Text
Aspect Score Performance Description Weighting
Content (C) 30%
- Topic - Details
4 The topic is complete and clear and the details are relating to the topic
3x 3 The topic is complete and clear but the details
are almost relating to the topic 2 The topic is complete and clear but the details
are not relating to the topic
1 The topic is not clear and the details are not relating to the topic
Organization (O) 20%
- Identification - Description
4 Identification is complete and description are arranged with proper connectives
2x 3 Identification is almost complete and
description are arranged with almost proper connectives
2 Identification is not complete and descriptions are arranged with few misuse of connectives
1 Identification is not complete and descriptions are arranged with misuse of connectives
Grammar
(G) 20%
- Use Present tense - Agreement
4 Very few grammatical or agreement inaccuracies
2x 3 Few grammatical or agreement inaccuracies
but not effect on meaning
2 Numerous grammatical or agreement inaccuracies
1 Frequent grammatical or agreement inaccuracies
Vocabulary
(V) 15%
4 Effective choice of words and word forms
1.5x 3 Few misuse of vocabularies, word forms, but
not change the meaning
2 Limited range confusing words and word forms
1 Very poor knowledge of words, word forms, and not understandable
Mechanics (M) 15%
- Spelling - Punctuation - Capitalization
4 It uses correct spelling, punctuation, and capitalization
1.5x 3 It has occasional errors of spelling,
punctuation, and capitalization 2 It has frequent errors of spelling, punctuation,
and capitalization
1 It is dominated by errors of spelling, punctuation and capitalization
Adapted from Brown (2007)
𝑆𝑐𝑜𝑟𝑒 =3C+2O+2G+1.5V+1.5M
40 𝑥 10
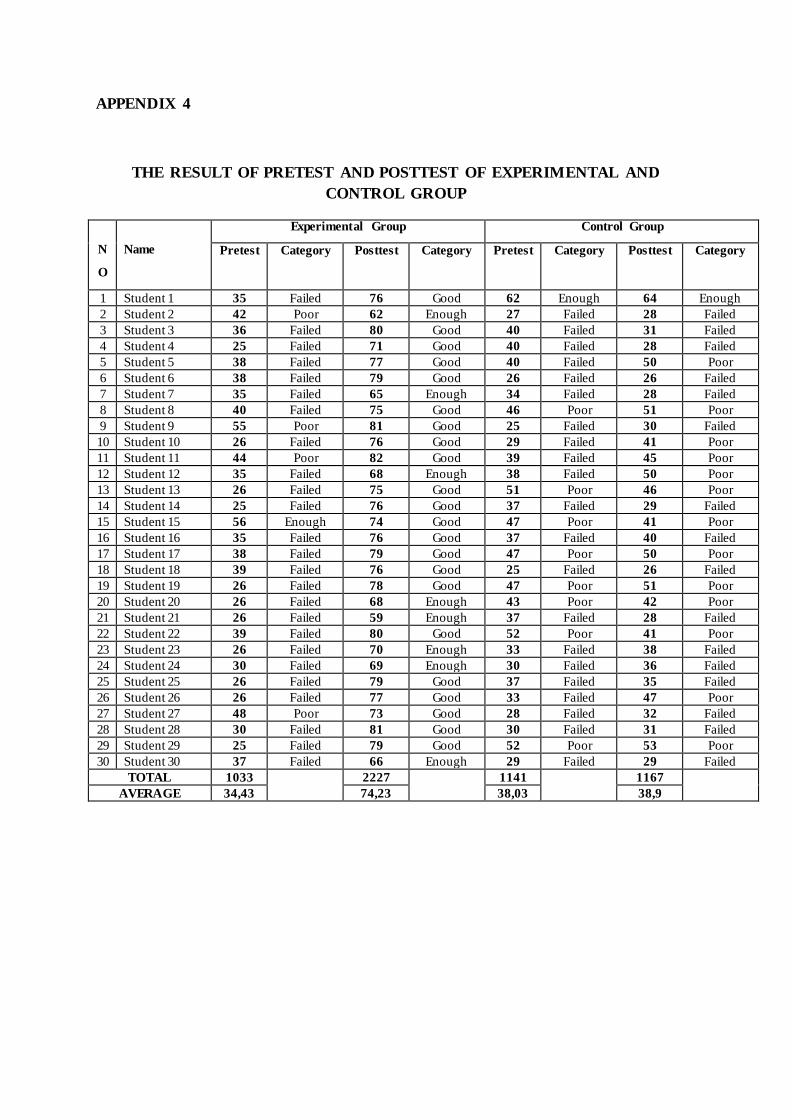
APPENDIX 4
THE RESULT OF PRETEST AND POSTTEST OF EXPERIMENTAL AND
CONTROL GROUP
N
O
Name
Experimental Group Control Group
Pretest
Category Posttest Category Pretest Category Posttest Category
1 Student 1 35 Failed 76 Good 62 Enough 64 Enough
2 Student 2 42 Poor 62 Enough 27 Failed 28 Failed
3 Student 3 36 Failed 80 Good 40 Failed 31 Failed
4 Student 4 25 Failed 71 Good 40 Failed 28 Failed
5 Student 5 38 Failed 77 Good 40 Failed 50 Poor
6 Student 6 38 Failed 79 Good 26 Failed 26 Failed
7 Student 7 35 Failed 65 Enough 34 Failed 28 Failed
8 Student 8 40 Failed 75 Good 46 Poor 51 Poor
9 Student 9 55 Poor 81 Good 25 Failed 30 Failed
10 Student 10 26 Failed 76 Good 29 Failed 41 Poor
11 Student 11 44 Poor 82 Good 39 Failed 45 Poor
12 Student 12 35 Failed 68 Enough 38 Failed 50 Poor
13 Student 13 26 Failed 75 Good 51 Poor 46 Poor
14 Student 14 25 Failed 76 Good 37 Failed 29 Failed
15 Student 15 56 Enough 74 Good 47 Poor 41 Poor
16 Student 16 35 Failed 76 Good 37 Failed 40 Failed
17 Student 17 38 Failed 79 Good 47 Poor 50 Poor
18 Student 18 39 Failed 76 Good 25 Failed 26 Failed
19 Student 19 26 Failed 78 Good 47 Poor 51 Poor
20 Student 20 26 Failed 68 Enough 43 Poor 42 Poor
21 Student 21 26 Failed 59 Enough 37 Failed 28 Failed
22 Student 22 39 Failed 80 Good 52 Poor 41 Poor
23 Student 23 26 Failed 70 Enough 33 Failed 38 Failed
24 Student 24 30 Failed 69 Enough 30 Failed 36 Failed
25 Student 25 26 Failed 79 Good 37 Failed 35 Failed
26 Student 26 26 Failed 77 Good 33 Failed 47 Poor
27 Student 27 48 Poor 73 Good 28 Failed 32 Failed
28 Student 28 30 Failed 81 Good 30 Failed 31 Failed
29 Student 29 25 Failed 79 Good 52 Poor 53 Poor
30 Student 30 37 Failed 66 Enough 29 Failed 29 Failed
TOTAL 1033 2227 1141 1167
AVERAGE 34,43 74,23 38,03 38,9
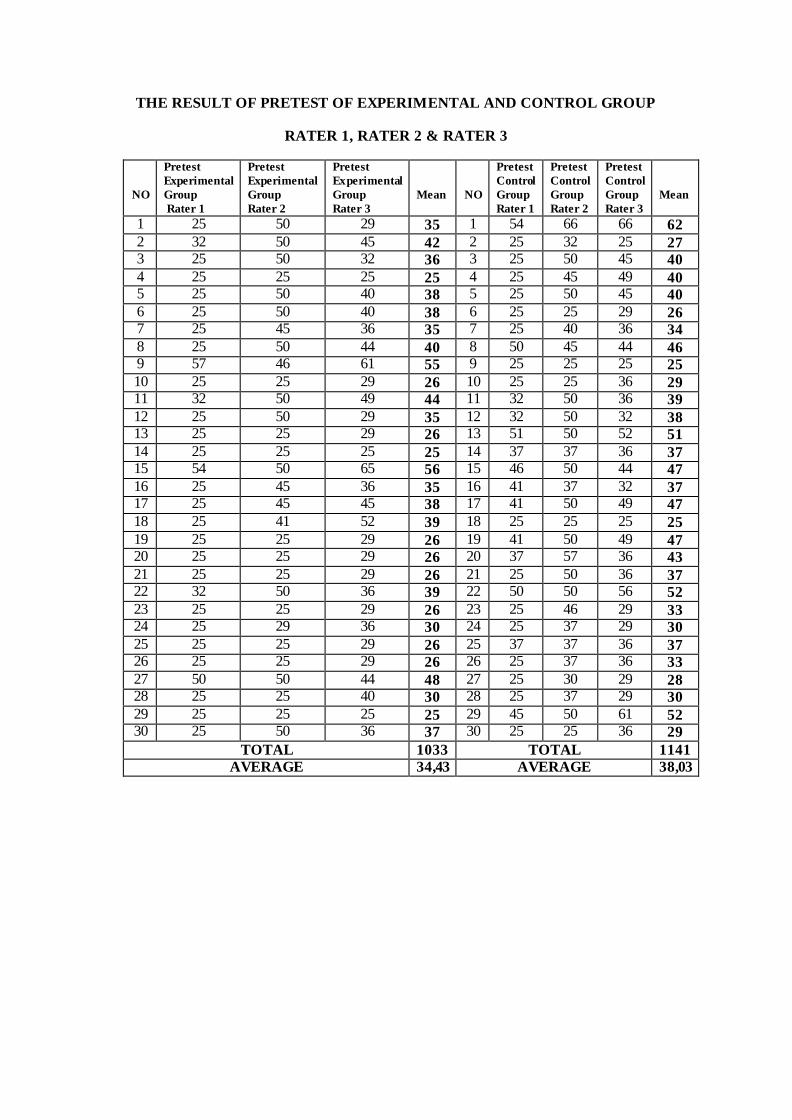
THE RESULT OF PRETEST OF EXPERIMENTAL AND CONTROL GROUP
RATER 1, RATER 2 & RATER 3
NO
Pretest
Experimental
Group
Rater 1
Pretest
Experimental
Group
Rater 2
Pretest
Experimental
Group
Rater 3
Mean
NO
Pretest
Control
Group
Rater 1
Pretest
Control
Group
Rater 2
Pretest
Control
Group
Rater 3
Mean
1 25 50 29 35 1 54 66 66 62
2 32 50 45 42 2 25 32 25 27 3 25 50 32 36 3 25 50 45 40
4 25 25 25 25 4 25 45 49 40 5 25 50 40 38 5 25 50 45 40
6 25 50 40 38 6 25 25 29 26 7 25 45 36 35 7 25 40 36 34
8 25 50 44 40 8 50 45 44 46 9 57 46 61 55 9 25 25 25 25
10 25 25 29 26 10 25 25 36 29 11 32 50 49 44 11 32 50 36 39
12 25 50 29 35 12 32 50 32 38 13 25 25 29 26 13 51 50 52 51
14 25 25 25 25 14 37 37 36 37 15 54 50 65 56 15 46 50 44 47
16 25 45 36 35 16 41 37 32 37 17 25 45 45 38 17 41 50 49 47
18 25 41 52 39 18 25 25 25 25
19 25 25 29 26 19 41 50 49 47 20 25 25 29 26 20 37 57 36 43
21 25 25 29 26 21 25 50 36 37 22 32 50 36 39 22 50 50 56 52
23 25 25 29 26 23 25 46 29 33 24 25 29 36 30 24 25 37 29 30
25 25 25 29 26 25 37 37 36 37 26 25 25 29 26 26 25 37 36 33
27 50 50 44 48 27 25 30 29 28 28 25 25 40 30 28 25 37 29 30
29 25 25 25 25 29 45 50 61 52 30 25 50 36 37 30 25 25 36 29
TOTAL 1033 TOTAL 1141
AVERAGE 34,43 AVERAGE 38,03
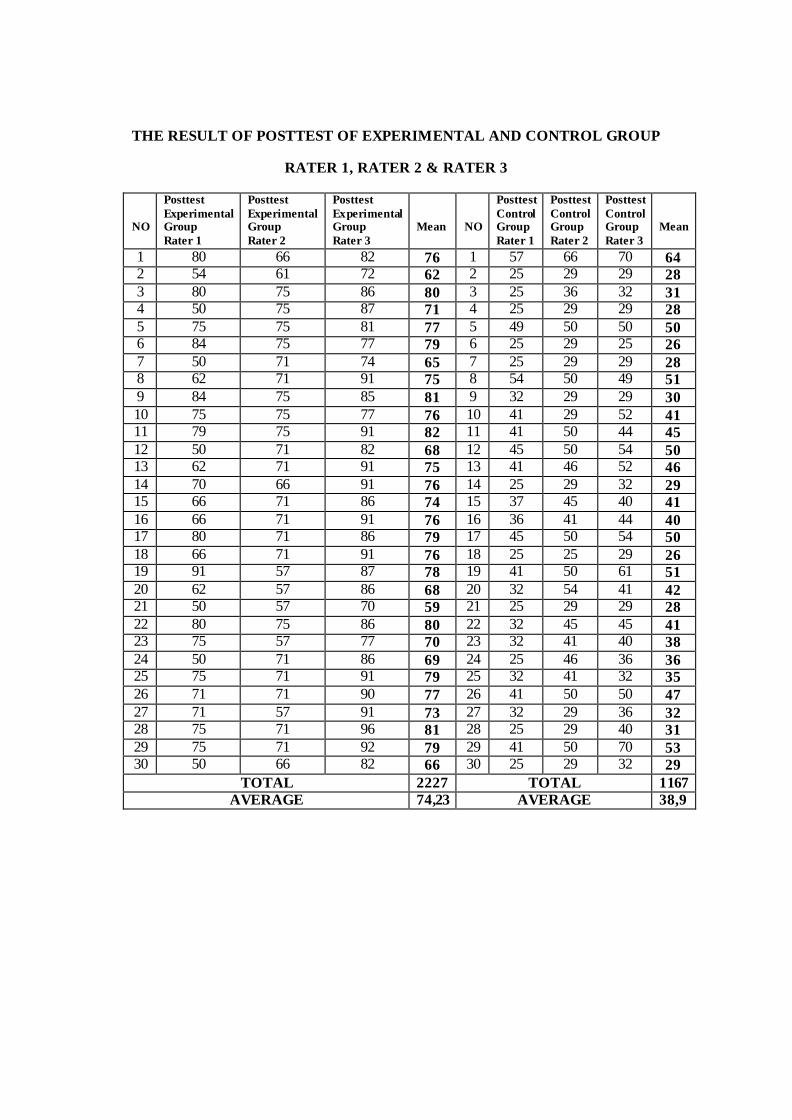
THE RESULT OF POSTTEST OF EXPERIMENTAL AND CONTROL GROUP
RATER 1, RATER 2 & RATER 3
NO
Posttest
Experimental Group
Rater 1
Posttest
Experimental Group
Rater 2
Posttest
Experimental Group
Rater 3
Mean
NO
Posttest
Control Group
Rater 1
Posttest
Control Group
Rater 2
Posttest
Control Group
Rater 3
Mean
1 80 66 82 76 1 57 66 70 64 2 54 61 72 62 2 25 29 29 28
3 80 75 86 80 3 25 36 32 31 4 50 75 87 71 4 25 29 29 28
5 75 75 81 77 5 49 50 50 50 6 84 75 77 79 6 25 29 25 26
7 50 71 74 65 7 25 29 29 28 8 62 71 91 75 8 54 50 49 51
9 84 75 85 81 9 32 29 29 30
10 75 75 77 76 10 41 29 52 41 11 79 75 91 82 11 41 50 44 45
12 50 71 82 68 12 45 50 54 50 13 62 71 91 75 13 41 46 52 46
14 70 66 91 76 14 25 29 32 29 15 66 71 86 74 15 37 45 40 41
16 66 71 91 76 16 36 41 44 40 17 80 71 86 79 17 45 50 54 50
18 66 71 91 76 18 25 25 29 26 19 91 57 87 78 19 41 50 61 51
20 62 57 86 68 20 32 54 41 42 21 50 57 70 59 21 25 29 29 28
22 80 75 86 80 22 32 45 45 41 23 75 57 77 70 23 32 41 40 38
24 50 71 86 69 24 25 46 36 36 25 75 71 91 79 25 32 41 32 35
26 71 71 90 77 26 41 50 50 47
27 71 57 91 73 27 32 29 36 32 28 75 71 96 81 28 25 29 40 31
29 75 71 92 79 29 41 50 70 53 30 50 66 82 66 30 25 29 32 29
TOTAL 2227 TOTAL 1167
AVERAGE 74,23 AVERAGE 38,9
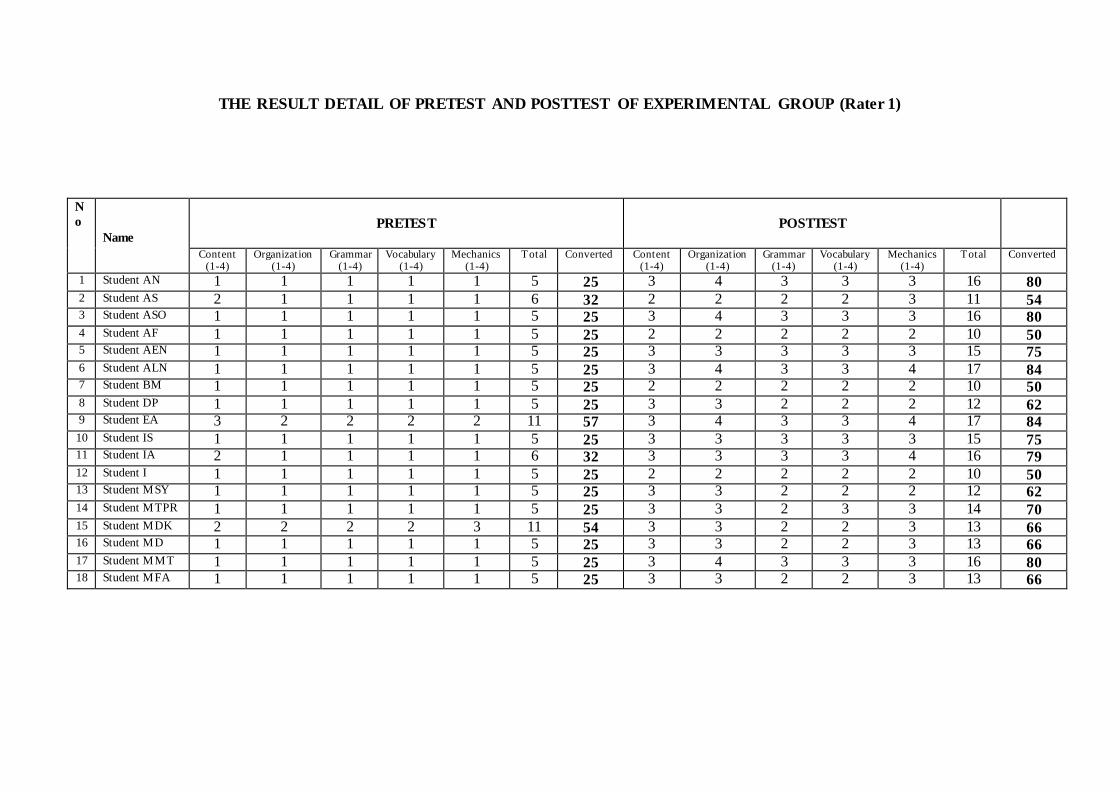
THE RESULT DETAIL OF PRETEST AND POSTTEST OF EXPERIMENTAL GROUP (Rater 1)
N
o
Name
PRETEST
POSTTEST
Content (1-4)
Organization (1-4)
Grammar (1-4)
Vocabulary (1-4)
Mechanics (1-4)
Total Converted Content (1-4)
Organization (1-4)
Grammar (1-4)
Vocabulary (1-4)
Mechanics (1-4)
Total Converted
1 Student AN 1 1 1 1 1 5 25 3 4 3 3 3 16 80 2 Student AS 2 1 1 1 1 6 32 2 2 2 2 3 11 54 3 Student ASO 1 1 1 1 1 5 25 3 4 3 3 3 16 80 4 Student AF 1 1 1 1 1 5 25 2 2 2 2 2 10 50 5 Student AEN 1 1 1 1 1 5 25 3 3 3 3 3 15 75 6 Student ALN 1 1 1 1 1 5 25 3 4 3 3 4 17 84 7 Student BM 1 1 1 1 1 5 25 2 2 2 2 2 10 50 8 Student DP 1 1 1 1 1 5 25 3 3 2 2 2 12 62 9 Student EA 3 2 2 2 2 11 57 3 4 3 3 4 17 84 10 Student IS 1 1 1 1 1 5 25 3 3 3 3 3 15 75 11 Student IA 2 1 1 1 1 6 32 3 3 3 3 4 16 79 12 Student I 1 1 1 1 1 5 25 2 2 2 2 2 10 50 13 Student MSY 1 1 1 1 1 5 25 3 3 2 2 2 12 62 14 Student MTPR 1 1 1 1 1 5 25 3 3 2 3 3 14 70 15 Student MDK 2 2 2 2 3 11 54 3 3 2 2 3 13 66 16 Student MD 1 1 1 1 1 5 25 3 3 2 2 3 13 66 17 Student MMT 1 1 1 1 1 5 25 3 4 3 3 3 16 80 18 Student MFA 1 1 1 1 1 5 25 3 3 2 2 3 13 66
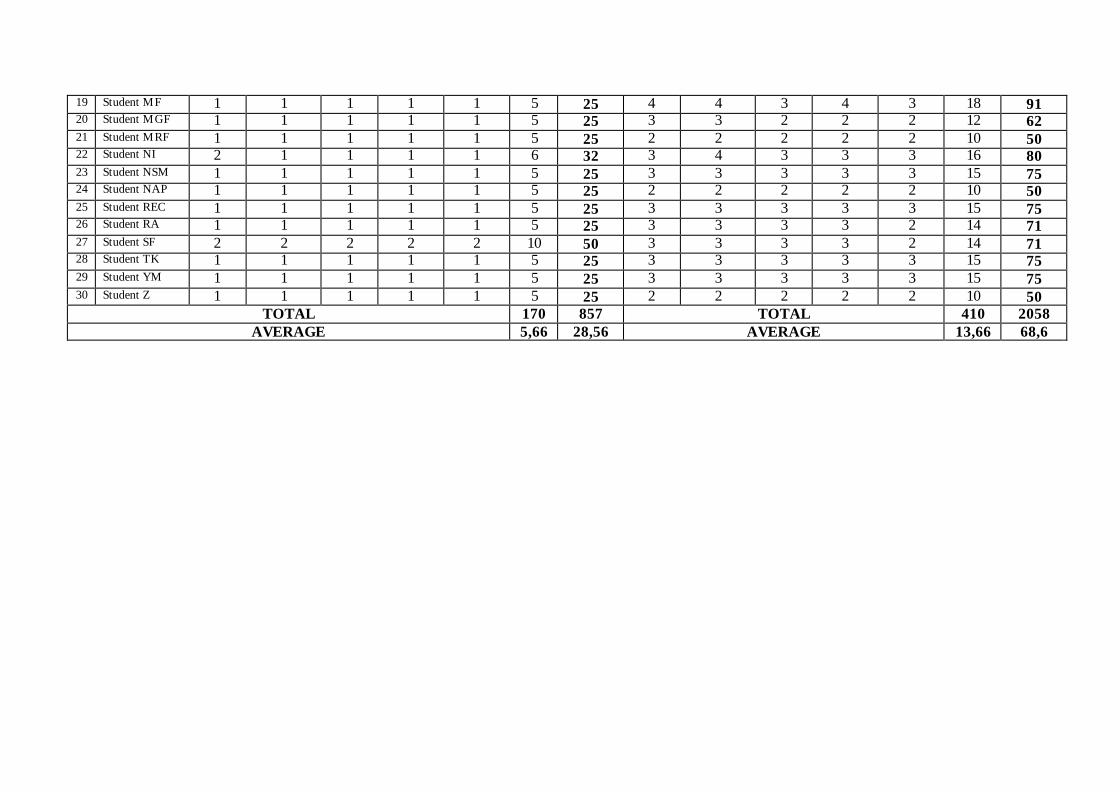
19 Student MF 1 1 1 1 1 5 25 4 4 3 4 3 18 91 20 Student MGF 1 1 1 1 1 5 25 3 3 2 2 2 12 62 21 Student MRF 1 1 1 1 1 5 25 2 2 2 2 2 10 50 22 Student NI 2 1 1 1 1 6 32 3 4 3 3 3 16 80 23 Student NSM 1 1 1 1 1 5 25 3 3 3 3 3 15 75 24 Student NAP 1 1 1 1 1 5 25 2 2 2 2 2 10 50 25 Student REC 1 1 1 1 1 5 25 3 3 3 3 3 15 75 26 Student RA 1 1 1 1 1 5 25 3 3 3 3 2 14 71 27 Student SF 2 2 2 2 2 10 50 3 3 3 3 2 14 71 28 Student TK 1 1 1 1 1 5 25 3 3 3 3 3 15 75 29 Student YM 1 1 1 1 1 5 25 3 3 3 3 3 15 75 30 Student Z 1 1 1 1 1 5 25 2 2 2 2 2 10 50
TOTAL 170 857 TOTAL 410 2058
AVERAGE 5,66 28,56 AVERAGE 13,66 68,6
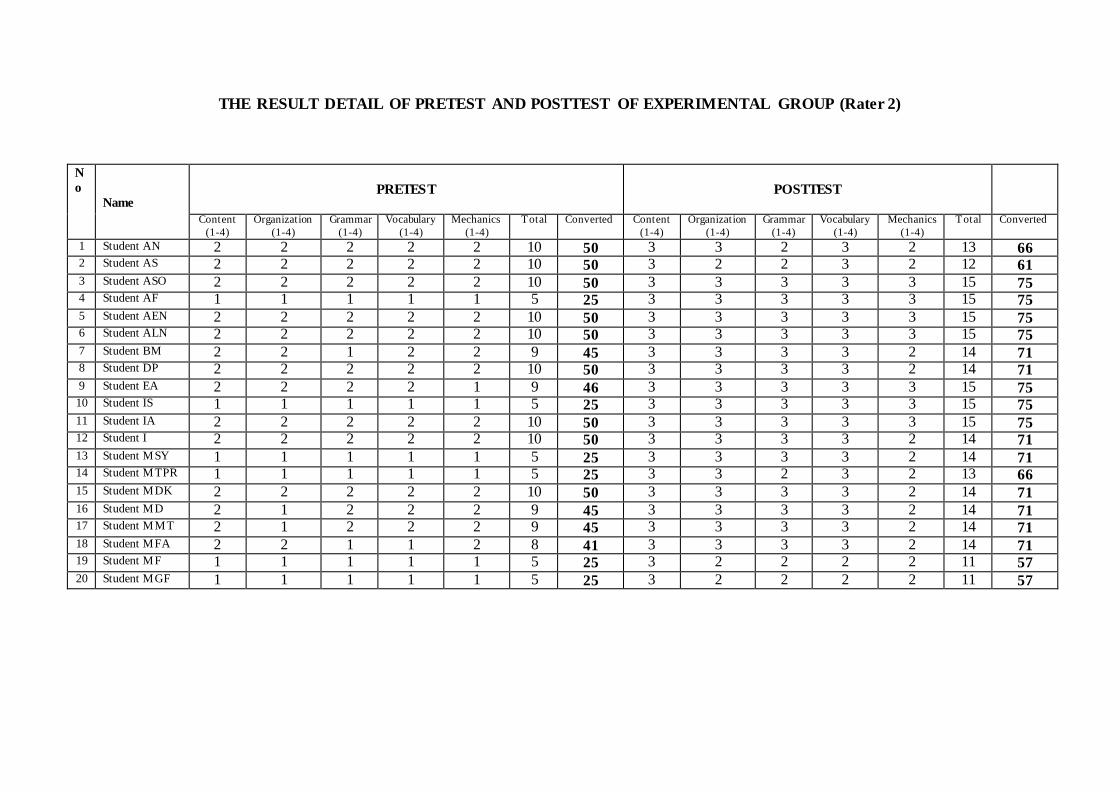
THE RESULT DETAIL OF PRETEST AND POSTTEST OF EXPERIMENTAL GROUP (Rater 2)
N
o
Name
PRETEST
POSTTEST
Content
(1-4)
Organization
(1-4)
Grammar
(1-4)
Vocabulary
(1-4)
Mechanics
(1-4)
Total Converted Content
(1-4)
Organization
(1-4)
Grammar
(1-4)
Vocabulary
(1-4)
Mechanics
(1-4)
Total Converted
1 Student AN 2 2 2 2 2 10 50 3 3 2 3 2 13 66 2 Student AS 2 2 2 2 2 10 50 3 2 2 3 2 12 61 3 Student ASO 2 2 2 2 2 10 50 3 3 3 3 3 15 75 4 Student AF 1 1 1 1 1 5 25 3 3 3 3 3 15 75 5 Student AEN 2 2 2 2 2 10 50 3 3 3 3 3 15 75 6 Student ALN 2 2 2 2 2 10 50 3 3 3 3 3 15 75 7 Student BM 2 2 1 2 2 9 45 3 3 3 3 2 14 71 8 Student DP 2 2 2 2 2 10 50 3 3 3 3 2 14 71 9 Student EA 2 2 2 2 1 9 46 3 3 3 3 3 15 75 10 Student IS 1 1 1 1 1 5 25 3 3 3 3 3 15 75 11 Student IA 2 2 2 2 2 10 50 3 3 3 3 3 15 75 12 Student I 2 2 2 2 2 10 50 3 3 3 3 2 14 71 13 Student MSY 1 1 1 1 1 5 25 3 3 3 3 2 14 71 14 Student MTPR 1 1 1 1 1 5 25 3 3 2 3 2 13 66 15 Student MDK 2 2 2 2 2 10 50 3 3 3 3 2 14 71 16 Student MD 2 1 2 2 2 9 45 3 3 3 3 2 14 71 17 Student MMT 2 1 2 2 2 9 45 3 3 3 3 2 14 71 18 Student MFA 2 2 1 1 2 8 41 3 3 3 3 2 14 71 19 Student MF 1 1 1 1 1 5 25 3 2 2 2 2 11 57 20 Student MGF 1 1 1 1 1 5 25 3 2 2 2 2 11 57
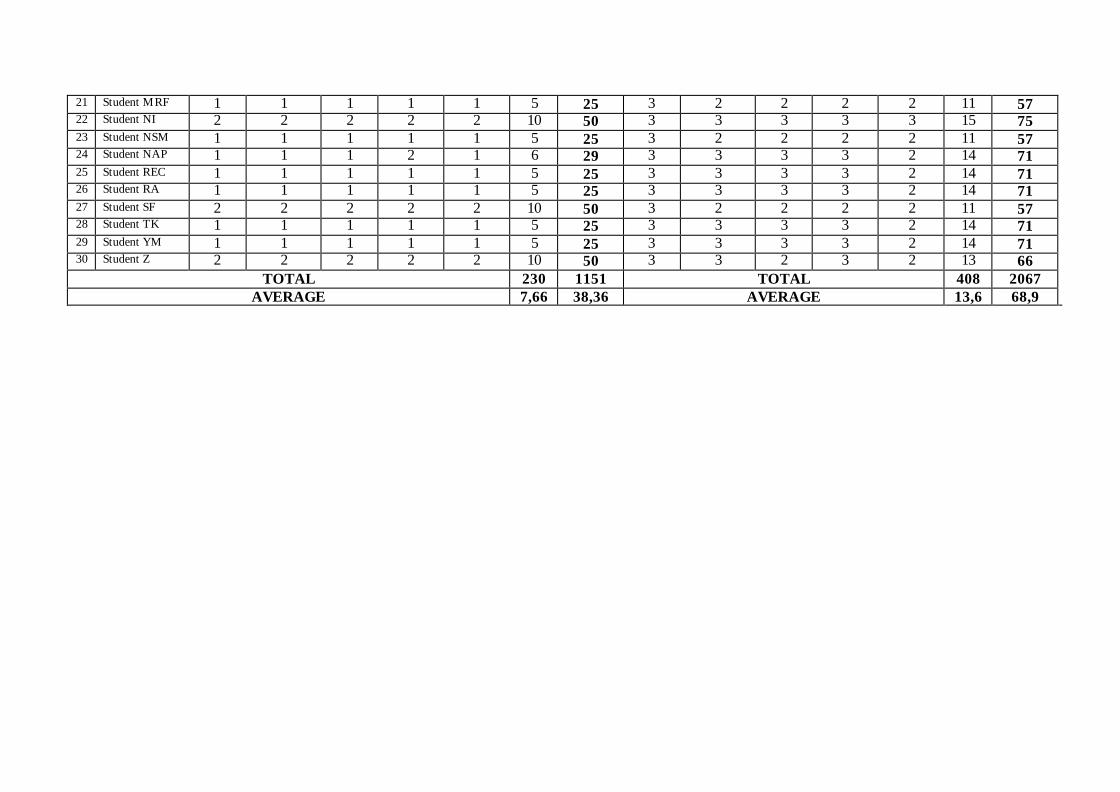
21 Student MRF 1 1 1 1 1 5 25 3 2 2 2 2 11 57 22 Student NI 2 2 2 2 2 10 50 3 3 3 3 3 15 75 23 Student NSM 1 1 1 1 1 5 25 3 2 2 2 2 11 57 24 Student NAP 1 1 1 2 1 6 29 3 3 3 3 2 14 71 25 Student REC 1 1 1 1 1 5 25 3 3 3 3 2 14 71 26 Student RA 1 1 1 1 1 5 25 3 3 3 3 2 14 71 27 Student SF 2 2 2 2 2 10 50 3 2 2 2 2 11 57 28 Student TK 1 1 1 1 1 5 25 3 3 3 3 2 14 71 29 Student YM 1 1 1 1 1 5 25 3 3 3 3 2 14 71 30 Student Z 2 2 2 2 2 10 50 3 3 2 3 2 13 66
TOTAL 230 1151 TOTAL 408 2067
AVERAGE 7,66 38,36 AVERAGE 13,6 68,9
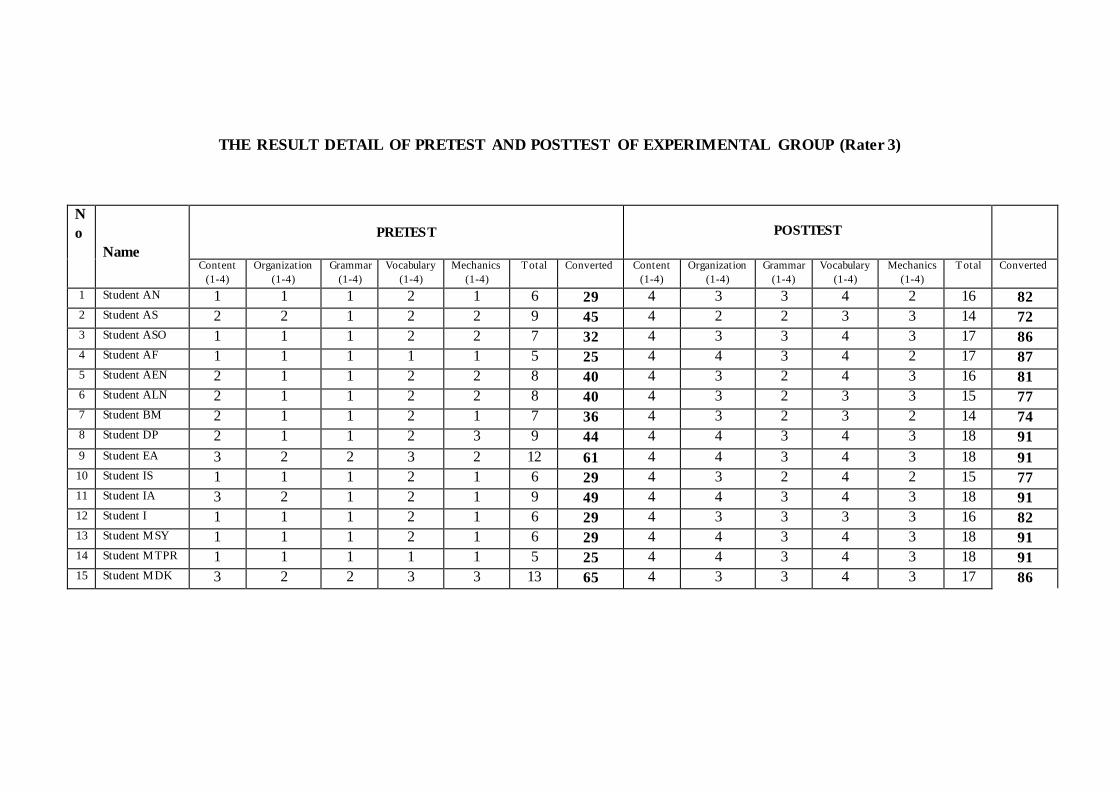
THE RESULT DETAIL OF PRETEST AND POSTTEST OF EXPERIMENTAL GROUP (Rater 3)
N
o
Name
PRETEST
POSTTEST
Content
(1-4)
Organization
(1-4)
Grammar
(1-4)
Vocabulary
(1-4)
Mechanics
(1-4)
Total Converted Content
(1-4)
Organization
(1-4)
Grammar
(1-4)
Vocabulary
(1-4)
Mechanics
(1-4)
Total Converted
1 Student AN 1 1 1 2 1 6 29 4 3 3 4 2 16 82
2 Student AS 2 2 1 2 2 9 45 4 2 2 3 3 14 72
3 Student ASO 1 1 1 2 2 7 32 4 3 3 4 3 17 86
4 Student AF 1 1 1 1 1 5 25 4 4 3 4 2 17 87
5 Student AEN 2 1 1 2 2 8 40 4 3 2 4 3 16 81
6 Student ALN 2 1 1 2 2 8 40 4 3 2 3 3 15 77
7 Student BM 2 1 1 2 1 7 36 4 3 2 3 2 14 74
8 Student DP 2 1 1 2 3 9 44 4 4 3 4 3 18 91
9 Student EA 3 2 2 3 2 12 61 4 4 3 4 3 18 91
10 Student IS 1 1 1 2 1 6 29 4 3 2 4 2 15 77
11 Student IA 3 2 1 2 1 9 49 4 4 3 4 3 18 91
12 Student I 1 1 1 2 1 6 29 4 3 3 3 3 16 82
13 Student MSY 1 1 1 2 1 6 29 4 4 3 4 3 18 91
14 Student MTPR 1 1 1 1 1 5 25 4 4 3 4 3 18 91
15 Student MDK 3 2 2 3 3 13 65 4 3 3 4 3 17 86
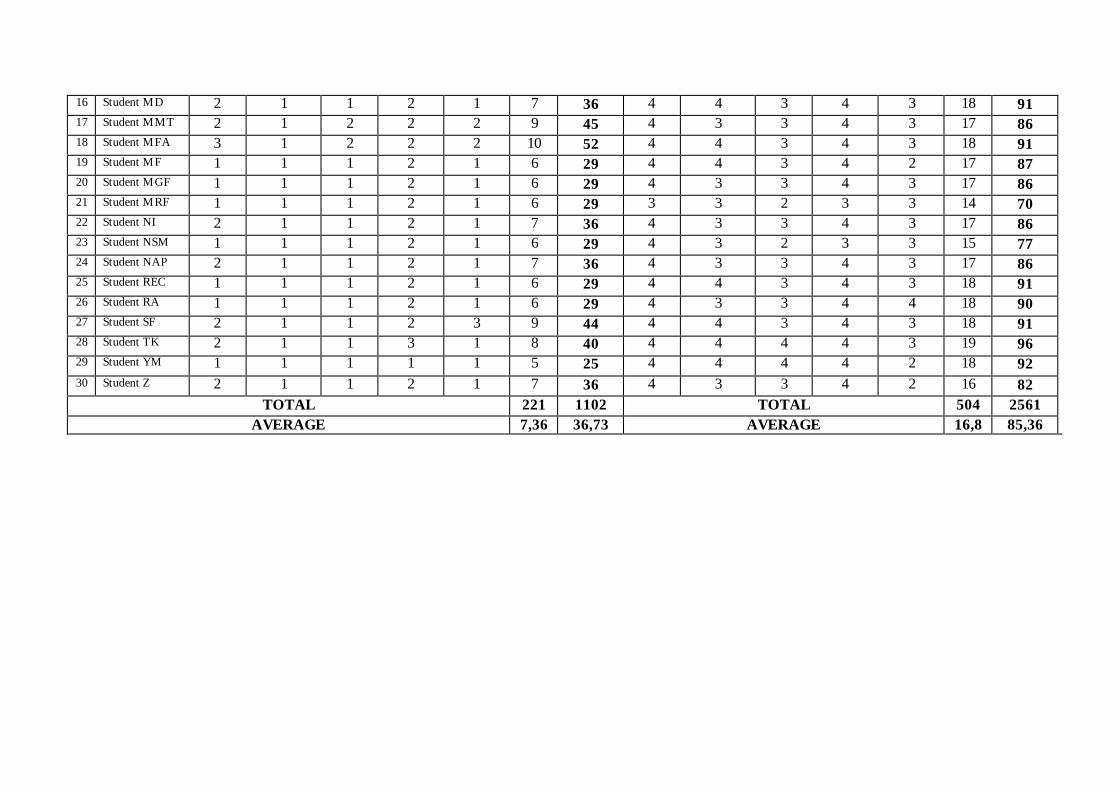
16 Student MD 2 1 1 2 1 7 36 4 4 3 4 3 18 91
17 Student MMT 2 1 2 2 2 9 45 4 3 3 4 3 17 86
18 Student MFA 3 1 2 2 2 10 52 4 4 3 4 3 18 91
19 Student MF 1 1 1 2 1 6 29 4 4 3 4 2 17 87
20 Student MGF 1 1 1 2 1 6 29 4 3 3 4 3 17 86
21 Student MRF 1 1 1 2 1 6 29 3 3 2 3 3 14 70
22 Student NI 2 1 1 2 1 7 36 4 3 3 4 3 17 86
23 Student NSM 1 1 1 2 1 6 29 4 3 2 3 3 15 77
24 Student NAP 2 1 1 2 1 7 36 4 3 3 4 3 17 86
25 Student REC 1 1 1 2 1 6 29 4 4 3 4 3 18 91
26 Student RA 1 1 1 2 1 6 29 4 3 3 4 4 18 90
27 Student SF 2 1 1 2 3 9 44 4 4 3 4 3 18 91
28 Student TK 2 1 1 3 1 8 40 4 4 4 4 3 19 96
29 Student YM 1 1 1 1 1 5 25 4 4 4 4 2 18 92
30 Student Z 2 1 1 2 1 7 36 4 3 3 4 2 16 82
TOTAL 221 1102 TOTAL 504 2561
AVERAGE 7,36 36,73 AVERAGE 16,8 85,36
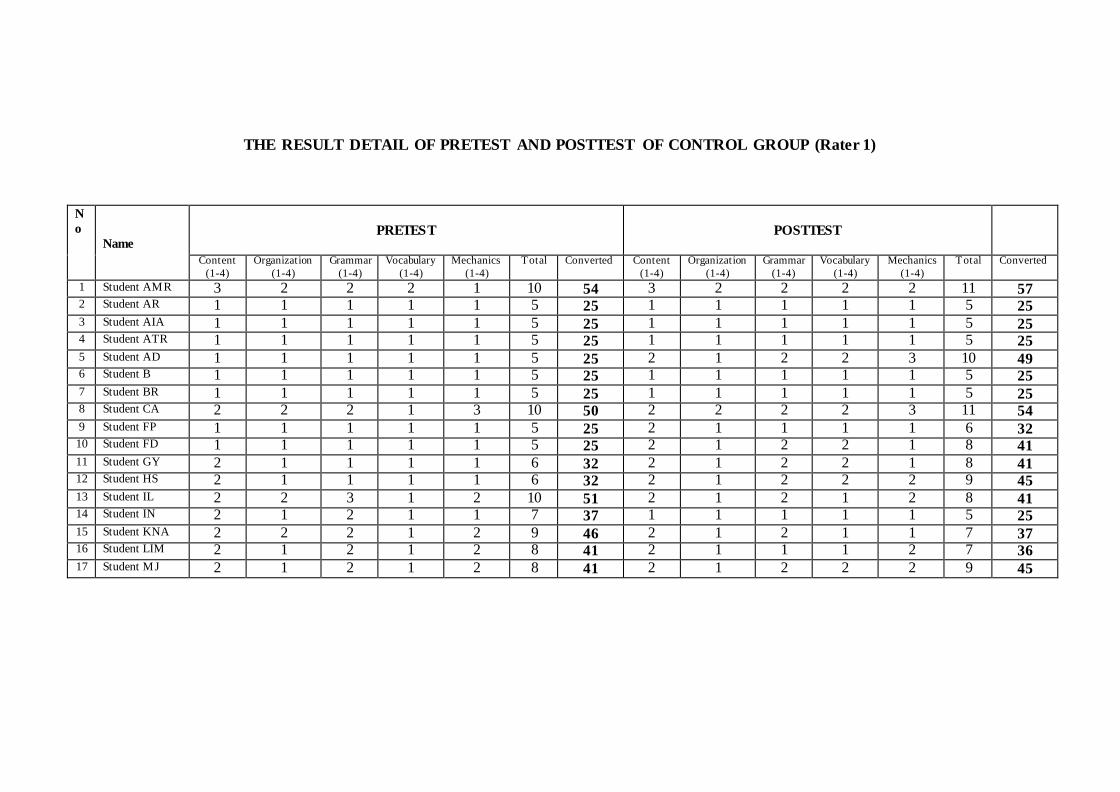
THE RESULT DETAIL OF PRETEST AND POSTTEST OF CONTROL GROUP (Rater 1)
N
o
Name
PRETEST
POSTTEST
Content
(1-4)
Organization
(1-4)
Grammar
(1-4)
Vocabulary
(1-4)
Mechanics
(1-4)
Total Converted Content
(1-4)
Organization
(1-4)
Grammar
(1-4)
Vocabulary
(1-4)
Mechanics
(1-4)
Total Converted
1 Student AMR 3 2 2 2 1 10 54 3 2 2 2 2 11 57 2 Student AR 1 1 1 1 1 5 25 1 1 1 1 1 5 25 3 Student AIA 1 1 1 1 1 5 25 1 1 1 1 1 5 25 4 Student ATR 1 1 1 1 1 5 25 1 1 1 1 1 5 25 5 Student AD 1 1 1 1 1 5 25 2 1 2 2 3 10 49 6 Student B 1 1 1 1 1 5 25 1 1 1 1 1 5 25 7 Student BR 1 1 1 1 1 5 25 1 1 1 1 1 5 25 8 Student CA 2 2 2 1 3 10 50 2 2 2 2 3 11 54 9 Student FP 1 1 1 1 1 5 25 2 1 1 1 1 6 32 10 Student FD 1 1 1 1 1 5 25 2 1 2 2 1 8 41 11 Student GY 2 1 1 1 1 6 32 2 1 2 2 1 8 41 12 Student HS 2 1 1 1 1 6 32 2 1 2 2 2 9 45 13 Student IL 2 2 3 1 2 10 51 2 1 2 1 2 8 41 14 Student IN 2 1 2 1 1 7 37 1 1 1 1 1 5 25 15 Student KNA 2 2 2 1 2 9 46 2 1 2 1 1 7 37 16 Student LIM 2 1 2 1 2 8 41 2 1 1 1 2 7 36 17 Student MJ 2 1 2 1 2 8 41 2 1 2 2 2 9 45
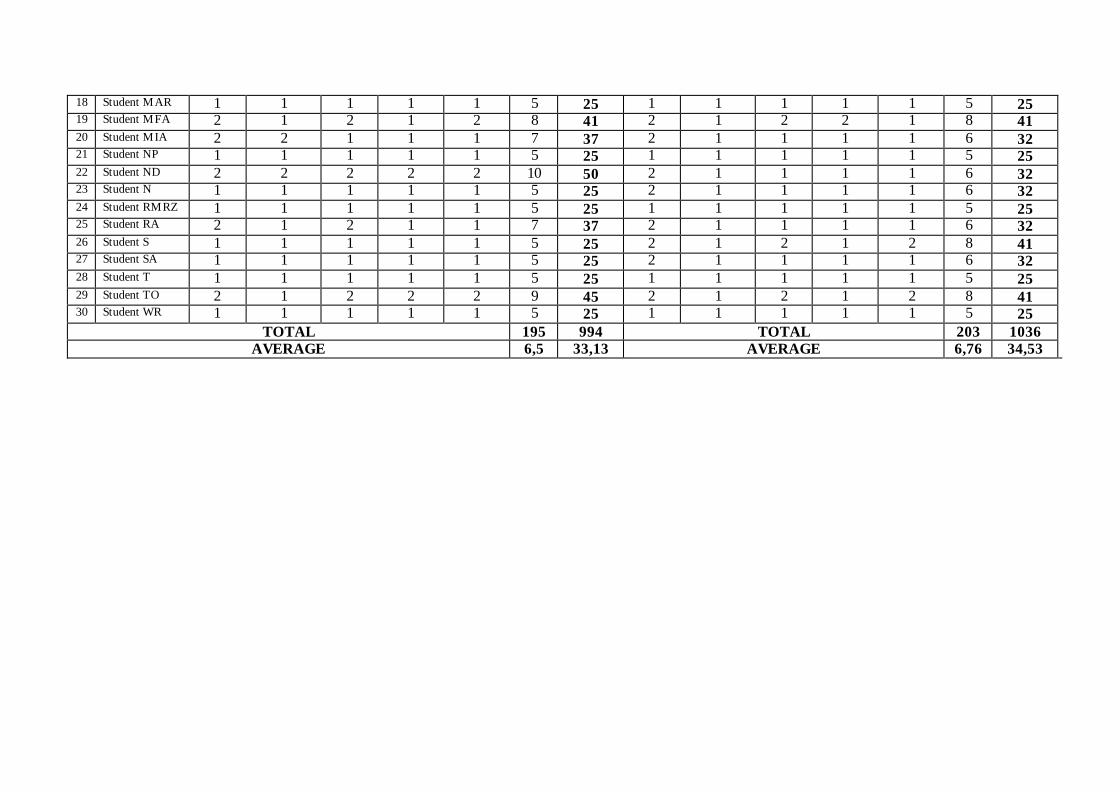
18 Student MAR 1 1 1 1 1 5 25 1 1 1 1 1 5 25 19 Student MFA 2 1 2 1 2 8 41 2 1 2 2 1 8 41 20 Student MIA 2 2 1 1 1 7 37 2 1 1 1 1 6 32 21 Student NP 1 1 1 1 1 5 25 1 1 1 1 1 5 25 22 Student ND 2 2 2 2 2 10 50 2 1 1 1 1 6 32 23 Student N 1 1 1 1 1 5 25 2 1 1 1 1 6 32 24 Student RMRZ 1 1 1 1 1 5 25 1 1 1 1 1 5 25 25 Student RA 2 1 2 1 1 7 37 2 1 1 1 1 6 32 26 Student S 1 1 1 1 1 5 25 2 1 2 1 2 8 41 27 Student SA 1 1 1 1 1 5 25 2 1 1 1 1 6 32 28 Student T 1 1 1 1 1 5 25 1 1 1 1 1 5 25 29 Student TO 2 1 2 2 2 9 45 2 1 2 1 2 8 41 30 Student WR 1 1 1 1 1 5 25 1 1 1 1 1 5 25
TOTAL 195 994 TOTAL 203 1036
AVERAGE 6,5 33,13 AVERAGE 6,76 34,53
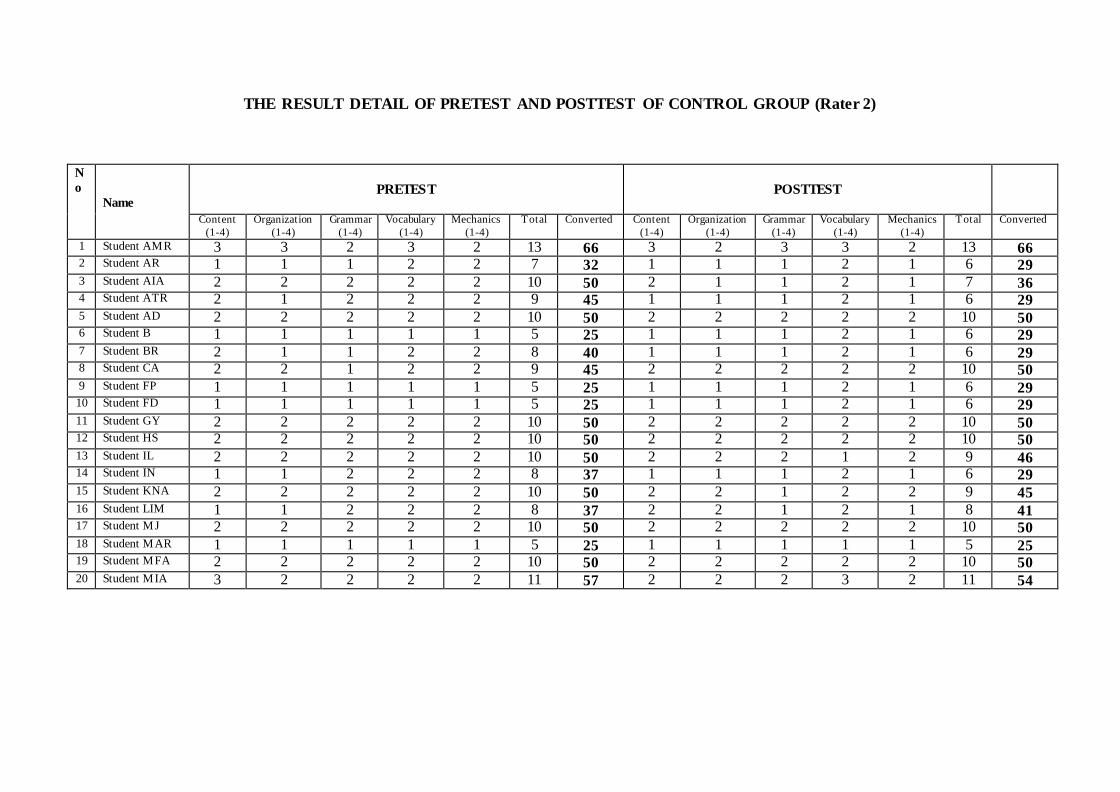
THE RESULT DETAIL OF PRETEST AND POSTTEST OF CONTROL GROUP (Rater 2)
N
o
Name
PRETEST
POSTTEST
Content
(1-4)
Organization
(1-4)
Grammar
(1-4)
Vocabulary
(1-4)
Mechanics
(1-4)
Total Converted Content
(1-4)
Organization
(1-4)
Grammar
(1-4)
Vocabulary
(1-4)
Mechanics
(1-4)
Total Converted
1 Student AMR 3 3 2 3 2 13 66 3 2 3 3 2 13 66 2 Student AR 1 1 1 2 2 7 32 1 1 1 2 1 6 29 3 Student AIA 2 2 2 2 2 10 50 2 1 1 2 1 7 36 4 Student ATR 2 1 2 2 2 9 45 1 1 1 2 1 6 29 5 Student AD 2 2 2 2 2 10 50 2 2 2 2 2 10 50 6 Student B 1 1 1 1 1 5 25 1 1 1 2 1 6 29 7 Student BR 2 1 1 2 2 8 40 1 1 1 2 1 6 29 8 Student CA 2 2 1 2 2 9 45 2 2 2 2 2 10 50 9 Student FP 1 1 1 1 1 5 25 1 1 1 2 1 6 29 10 Student FD 1 1 1 1 1 5 25 1 1 1 2 1 6 29 11 Student GY 2 2 2 2 2 10 50 2 2 2 2 2 10 50 12 Student HS 2 2 2 2 2 10 50 2 2 2 2 2 10 50 13 Student IL 2 2 2 2 2 10 50 2 2 2 1 2 9 46 14 Student IN 1 1 2 2 2 8 37 1 1 1 2 1 6 29 15 Student KNA 2 2 2 2 2 10 50 2 2 1 2 2 9 45 16 Student LIM 1 1 2 2 2 8 37 2 2 1 2 1 8 41 17 Student MJ 2 2 2 2 2 10 50 2 2 2 2 2 10 50 18 Student MAR 1 1 1 1 1 5 25 1 1 1 1 1 5 25 19 Student MFA 2 2 2 2 2 10 50 2 2 2 2 2 10 50 20 Student MIA 3 2 2 2 2 11 57 2 2 2 3 2 11 54
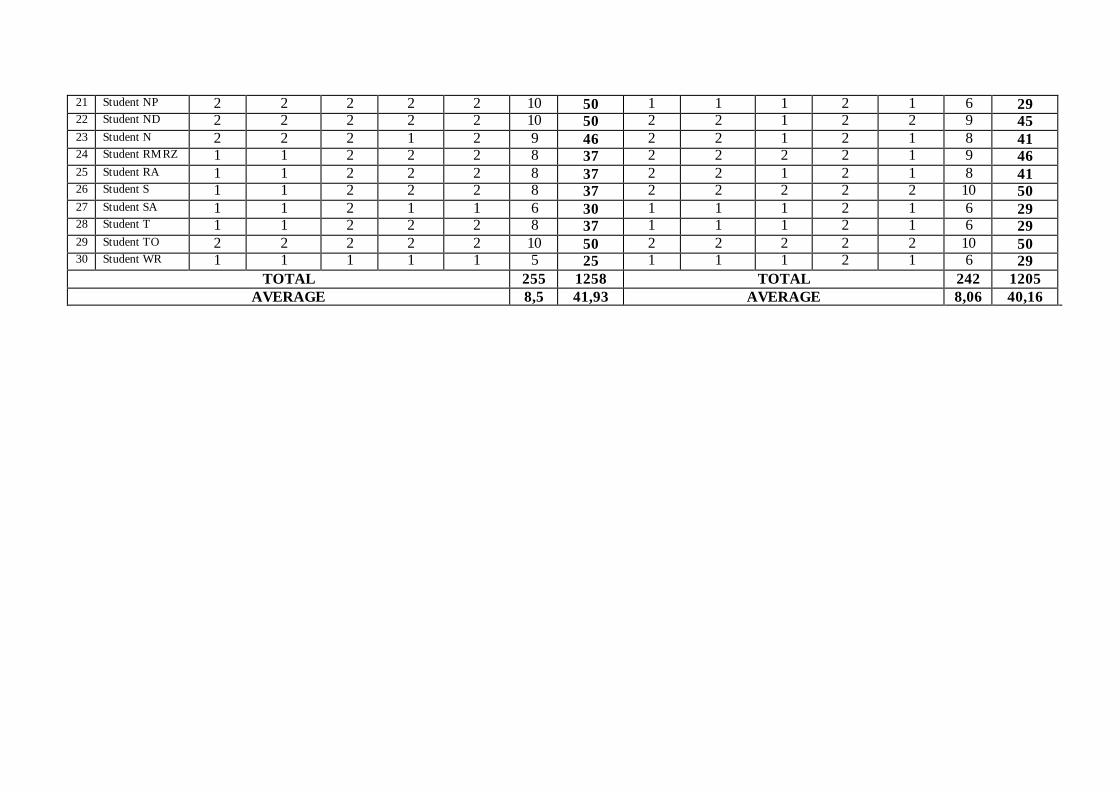
21 Student NP 2 2 2 2 2 10 50 1 1 1 2 1 6 29 22 Student ND 2 2 2 2 2 10 50 2 2 1 2 2 9 45 23 Student N 2 2 2 1 2 9 46 2 2 1 2 1 8 41 24 Student RMRZ 1 1 2 2 2 8 37 2 2 2 2 1 9 46 25 Student RA 1 1 2 2 2 8 37 2 2 1 2 1 8 41 26 Student S 1 1 2 2 2 8 37 2 2 2 2 2 10 50 27 Student SA 1 1 2 1 1 6 30 1 1 1 2 1 6 29 28 Student T 1 1 2 2 2 8 37 1 1 1 2 1 6 29 29 Student TO 2 2 2 2 2 10 50 2 2 2 2 2 10 50 30 Student WR 1 1 1 1 1 5 25 1 1 1 2 1 6 29
TOTAL 255 1258 TOTAL 242 1205
AVERAGE 8,5 41,93 AVERAGE 8,06 40,16
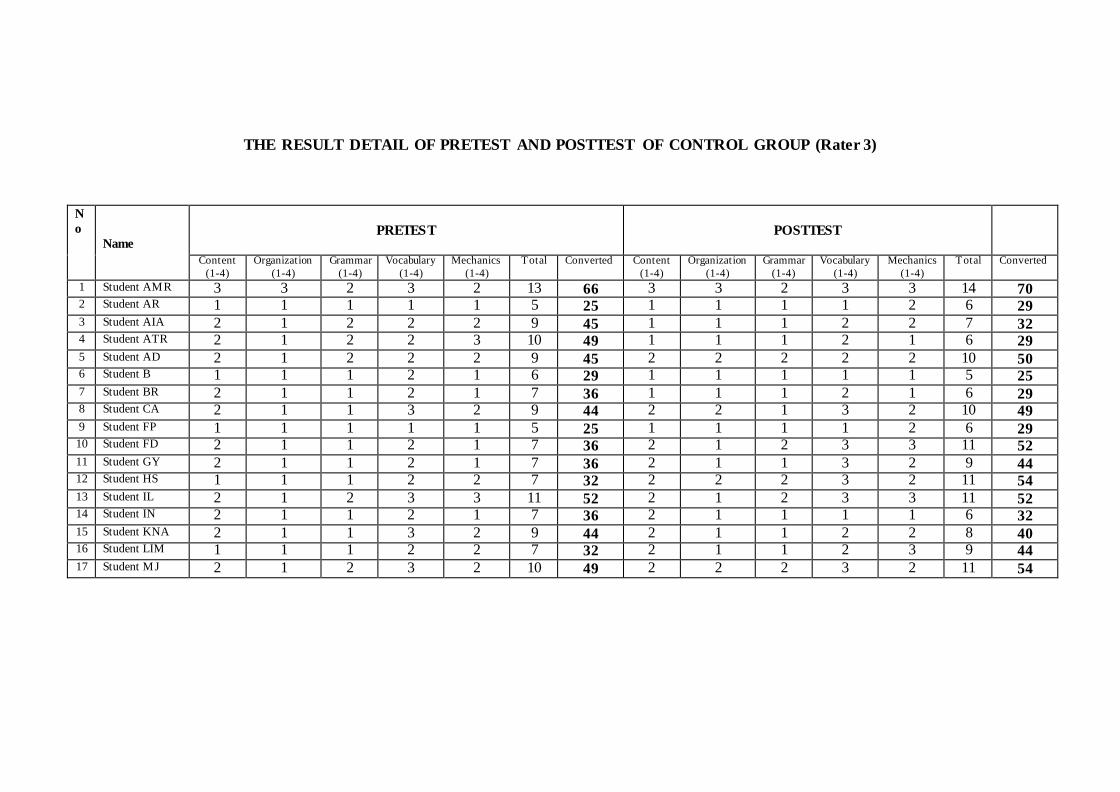
THE RESULT DETAIL OF PRETEST AND POSTTEST OF CONTROL GROUP (Rater 3)
N
o
Name
PRETEST
POSTTEST
Content
(1-4)
Organization
(1-4)
Grammar
(1-4)
Vocabulary
(1-4)
Mechanics
(1-4)
Total Converted Content
(1-4)
Organization
(1-4)
Grammar
(1-4)
Vocabulary
(1-4)
Mechanics
(1-4)
Total Converted
1 Student AMR 3 3 2 3 2 13 66 3 3 2 3 3 14 70 2 Student AR 1 1 1 1 1 5 25 1 1 1 1 2 6 29 3 Student AIA 2 1 2 2 2 9 45 1 1 1 2 2 7 32 4 Student ATR 2 1 2 2 3 10 49 1 1 1 2 1 6 29 5 Student AD 2 1 2 2 2 9 45 2 2 2 2 2 10 50 6 Student B 1 1 1 2 1 6 29 1 1 1 1 1 5 25 7 Student BR 2 1 1 2 1 7 36 1 1 1 2 1 6 29 8 Student CA 2 1 1 3 2 9 44 2 2 1 3 2 10 49 9 Student FP 1 1 1 1 1 5 25 1 1 1 1 2 6 29 10 Student FD 2 1 1 2 1 7 36 2 1 2 3 3 11 52 11 Student GY 2 1 1 2 1 7 36 2 1 1 3 2 9 44 12 Student HS 1 1 1 2 2 7 32 2 2 2 3 2 11 54 13 Student IL 2 1 2 3 3 11 52 2 1 2 3 3 11 52 14 Student IN 2 1 1 2 1 7 36 2 1 1 1 1 6 32 15 Student KNA 2 1 1 3 2 9 44 2 1 1 2 2 8 40 16 Student LIM 1 1 1 2 2 7 32 2 1 1 2 3 9 44 17 Student MJ 2 1 2 3 2 10 49 2 2 2 3 2 11 54

18 Student MAR 1 1 1 1 1 5 25 1 1 1 2 1 6 29 19 Student MFA 2 1 2 3 2 10 49 3 2 2 3 2 12 61 20 Student MIA 2 1 1 2 1 7 36 2 1 2 2 1 8 41 21 Student NP 2 1 1 2 1 7 36 1 1 1 2 1 6 29 22 Student ND 3 1 2 3 2 11 56 2 1 2 2 2 9 45 23 Student N 1 1 1 2 1 6 29 2 1 1 2 2 8 40 24 Student RMRZ 1 1 1 2 1 6 29 2 1 1 2 1 7 36 25 Student RA 2 1 1 2 1 7 36 1 1 1 2 2 7 32 26 Student S 2 1 1 2 1 7 36 2 2 2 3 1 10 50 27 Student SA 1 1 1 2 1 6 29 2 1 1 2 1 7 36 28 Student T 1 1 1 2 1 6 29 2 1 1 2 2 8 40 29 Student TO 3 2 2 2 3 12 61 3 2 3 3 3 14 70 30 Student WR 2 1 1 2 1 7 36 2 1 1 1 1 6 32
TOTAL 235 1168 TOTAL 254 1255
AVERAGE 7,83 38,93 AVERAGE 8,46 41,83
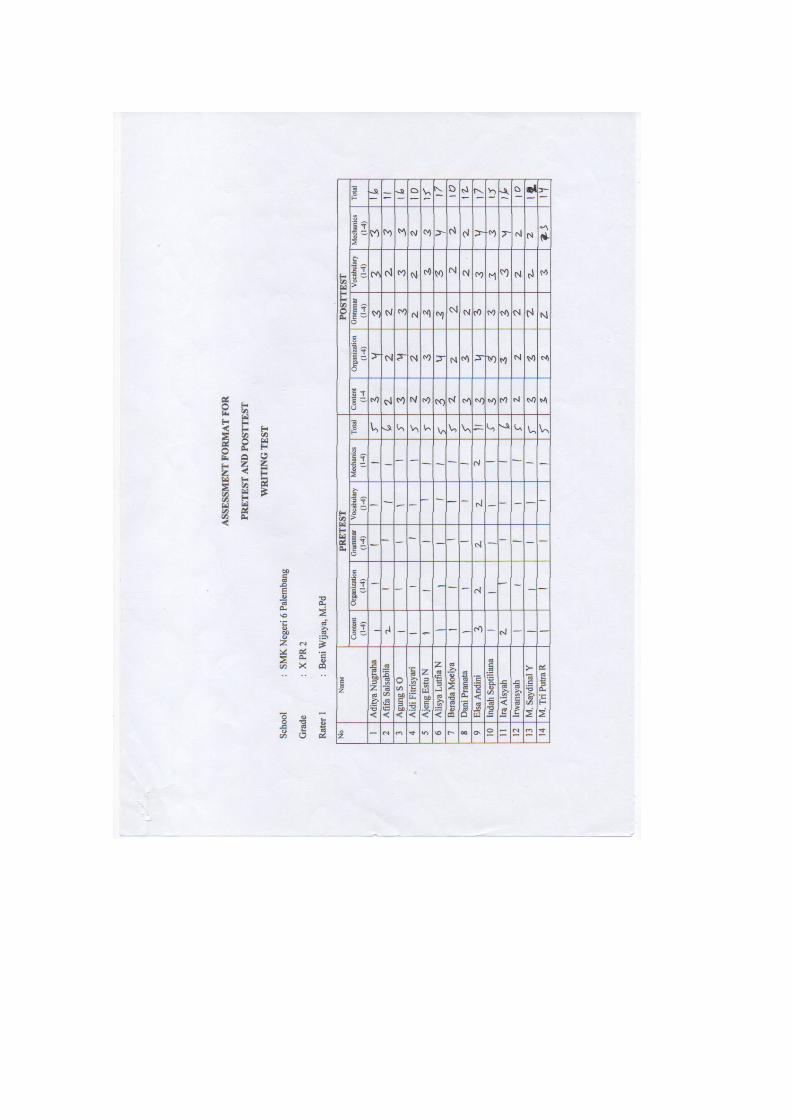
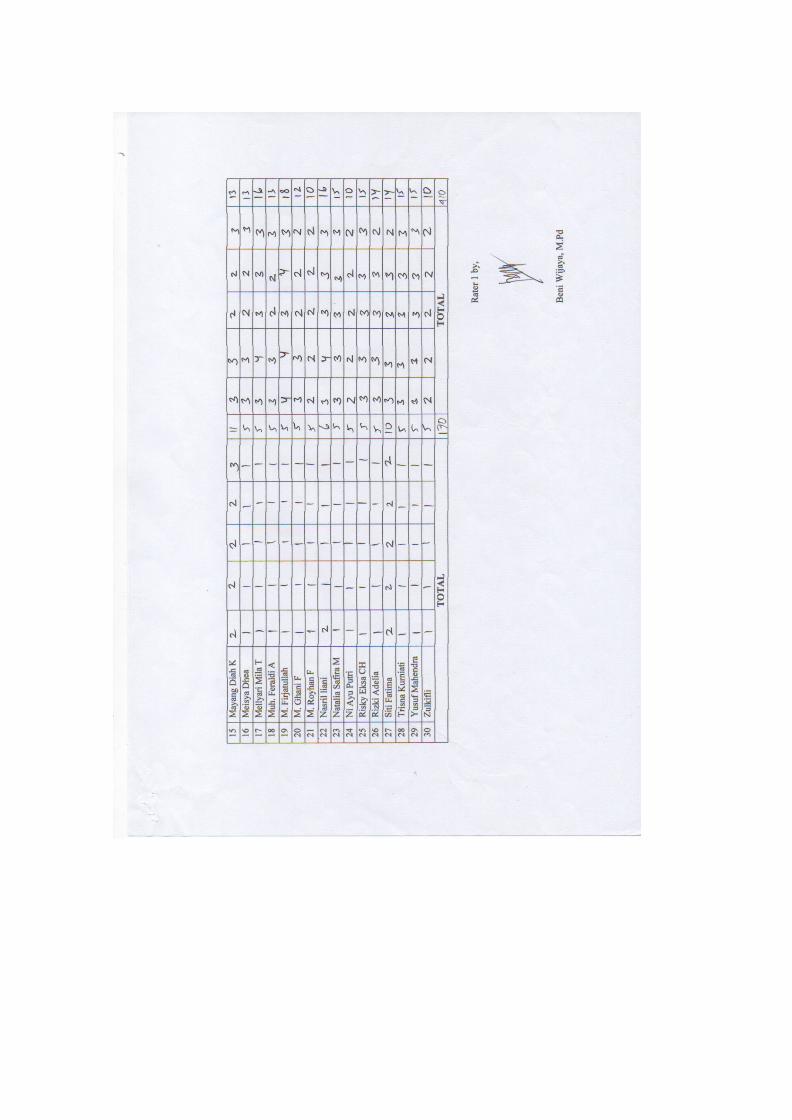
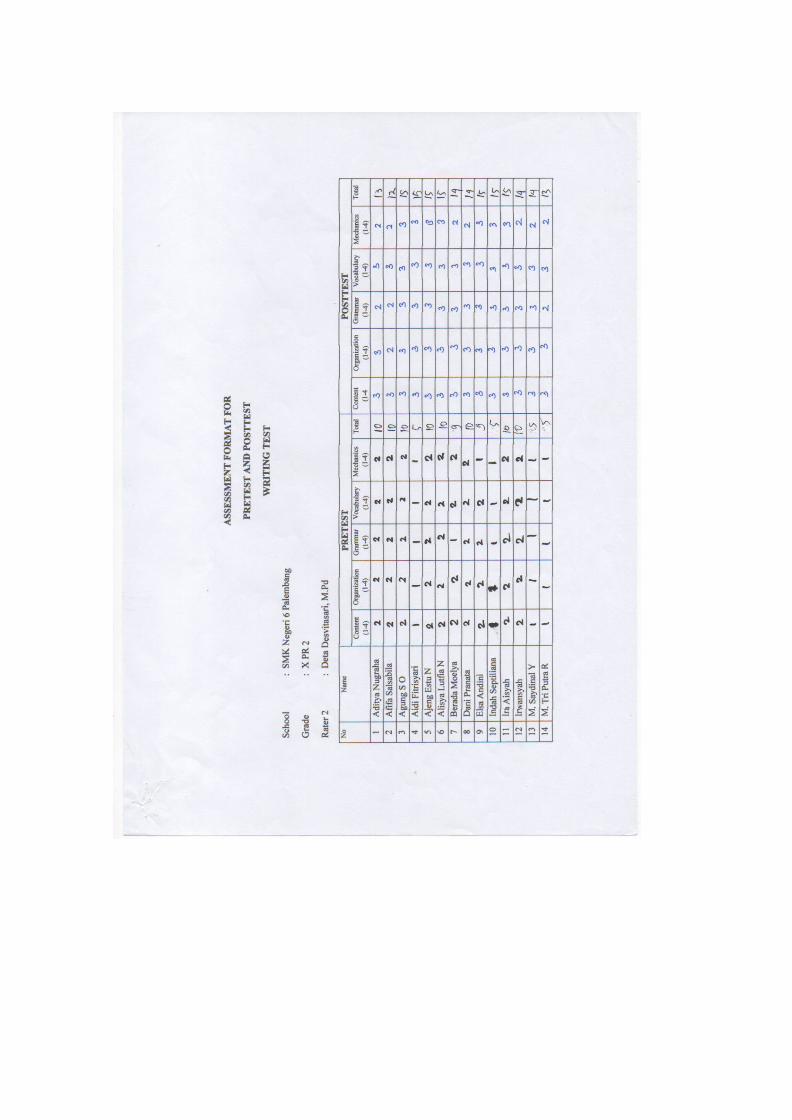
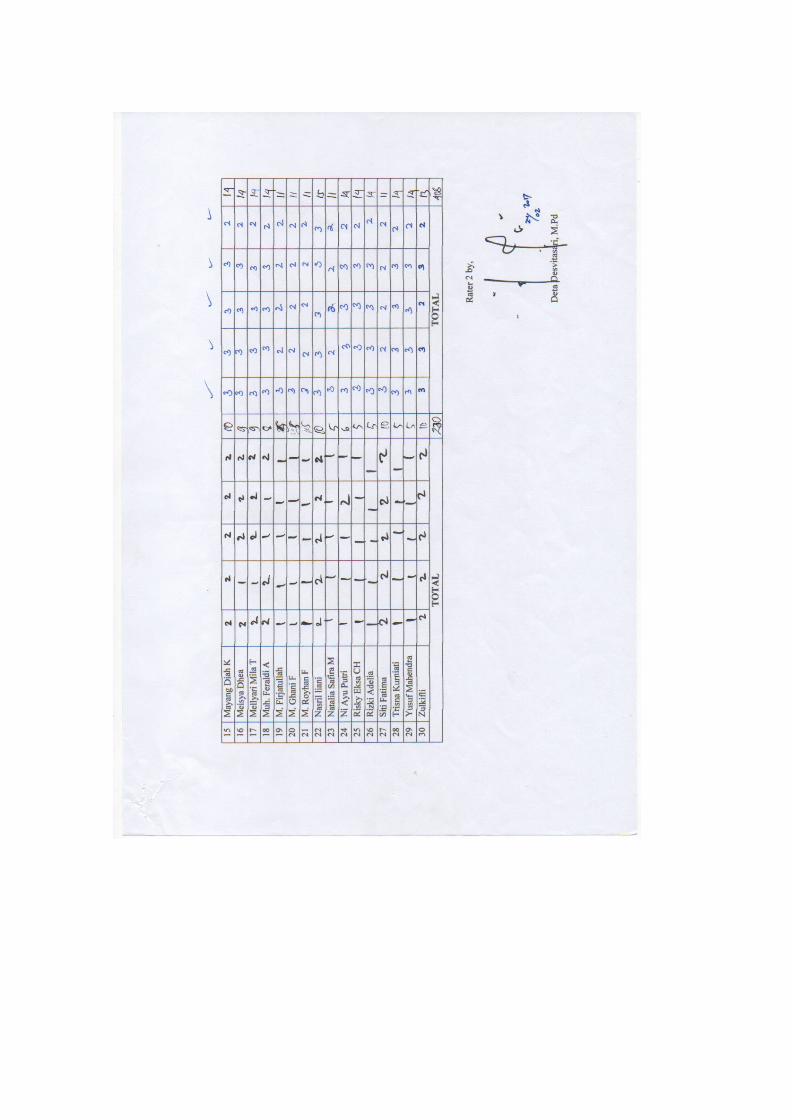
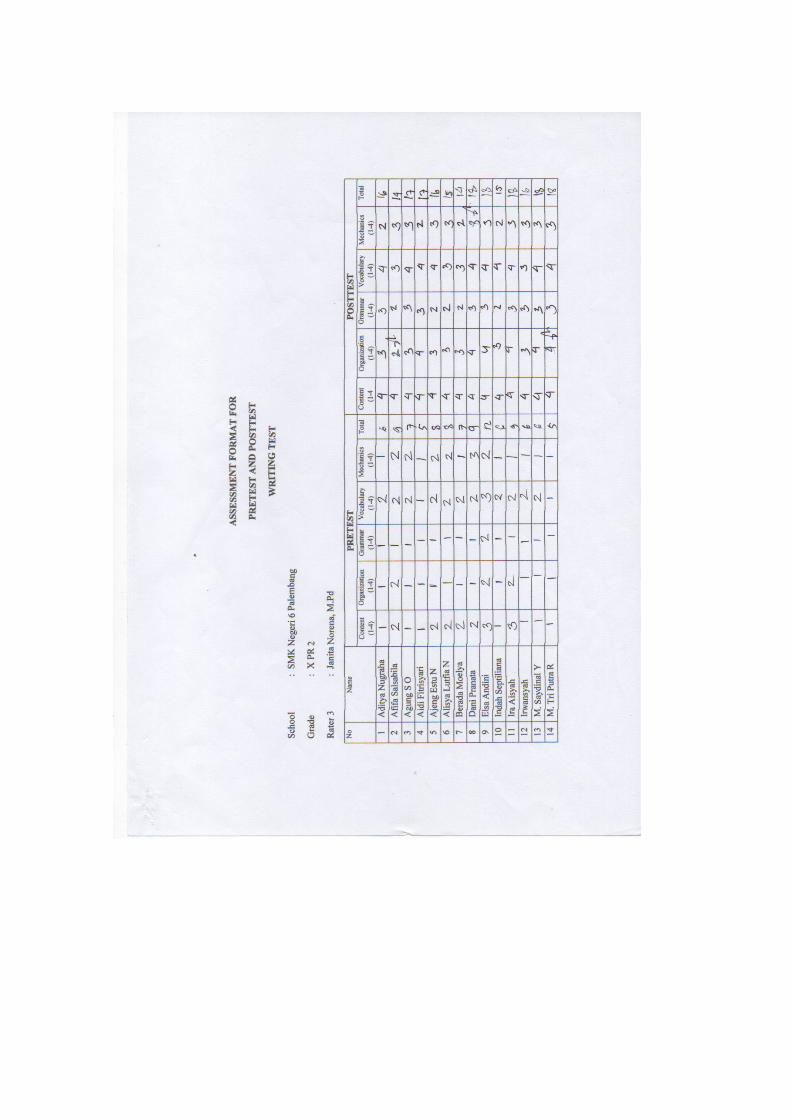
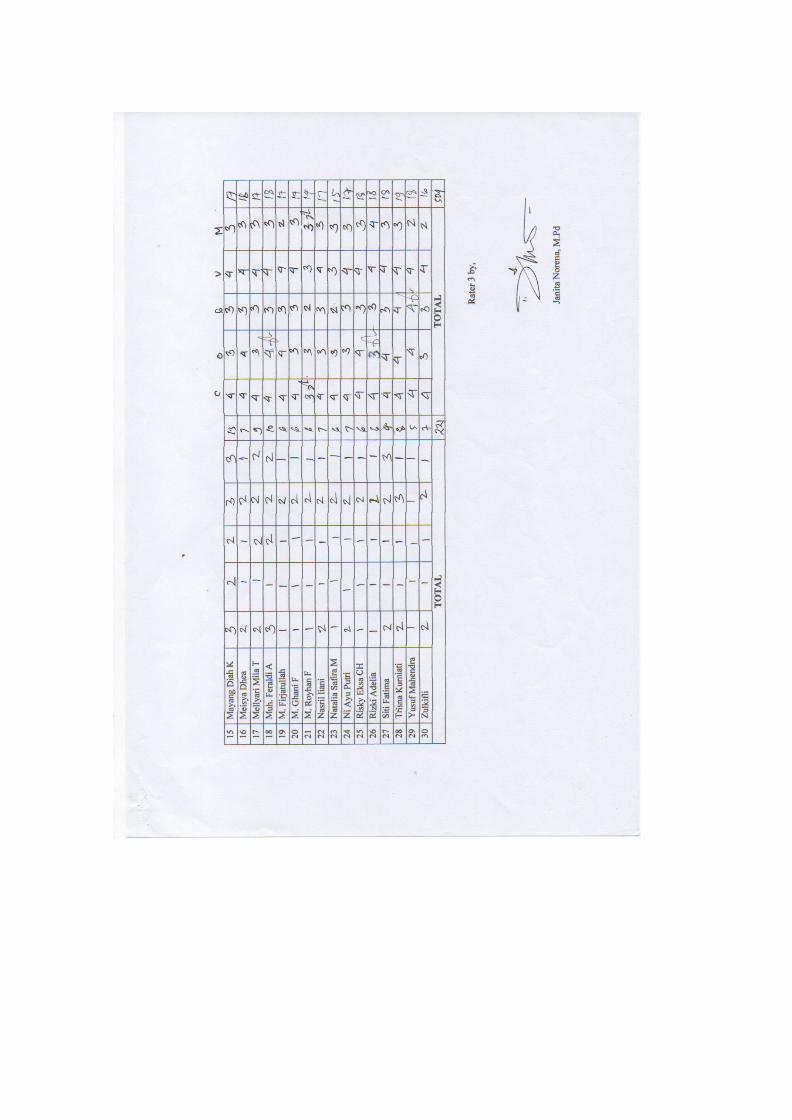
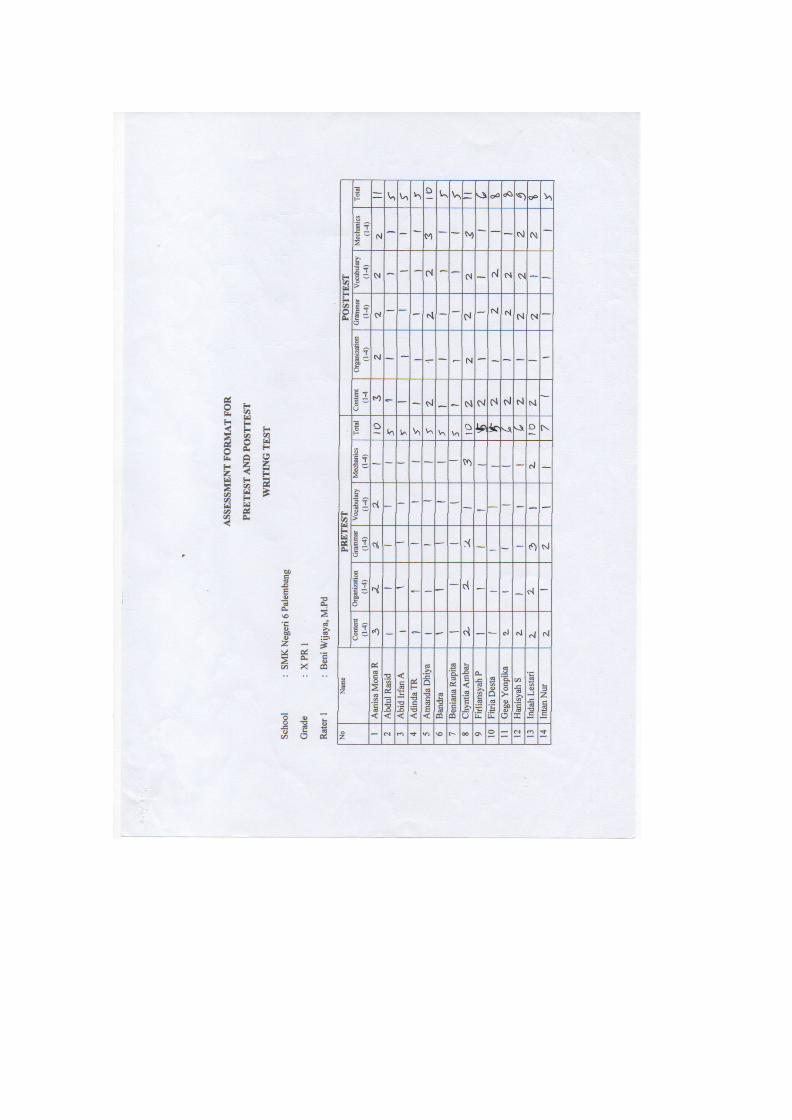
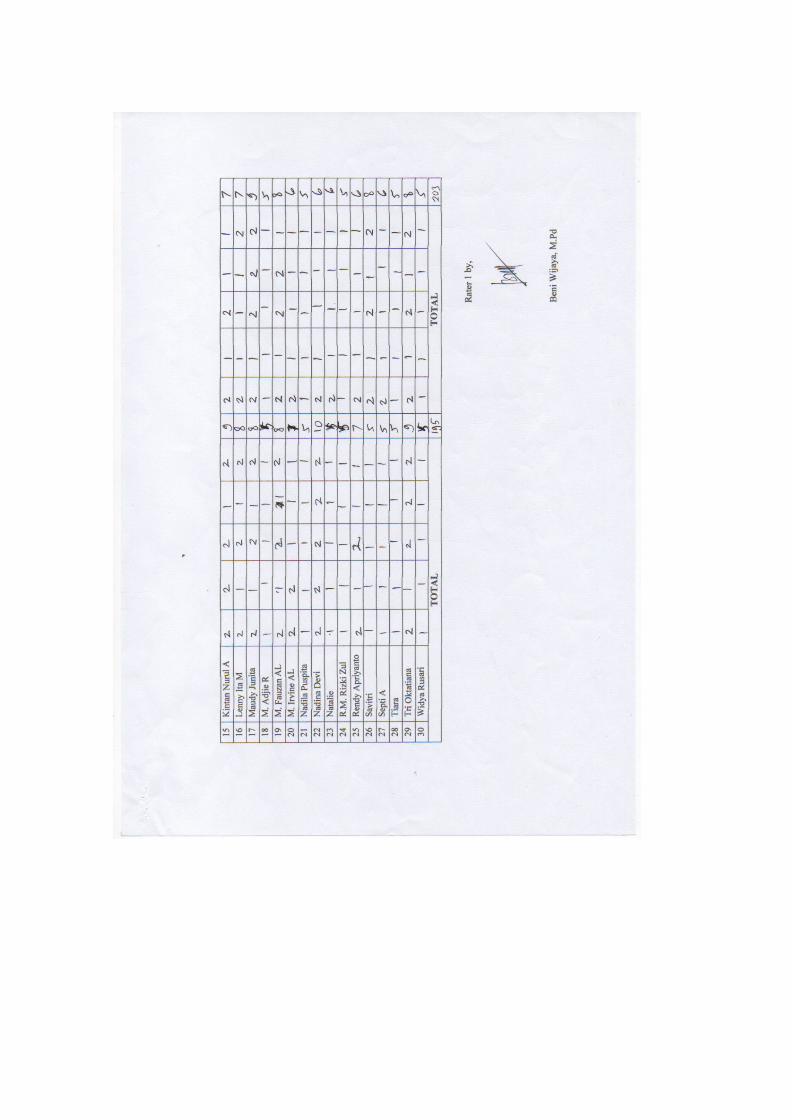
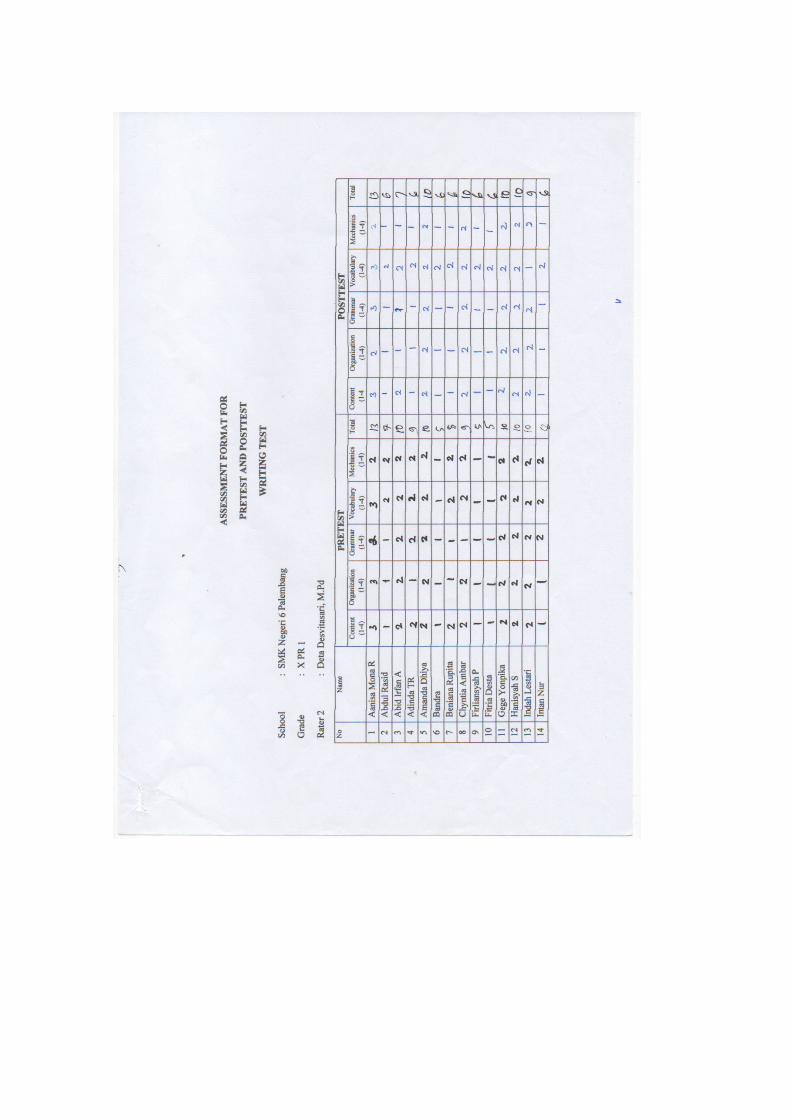
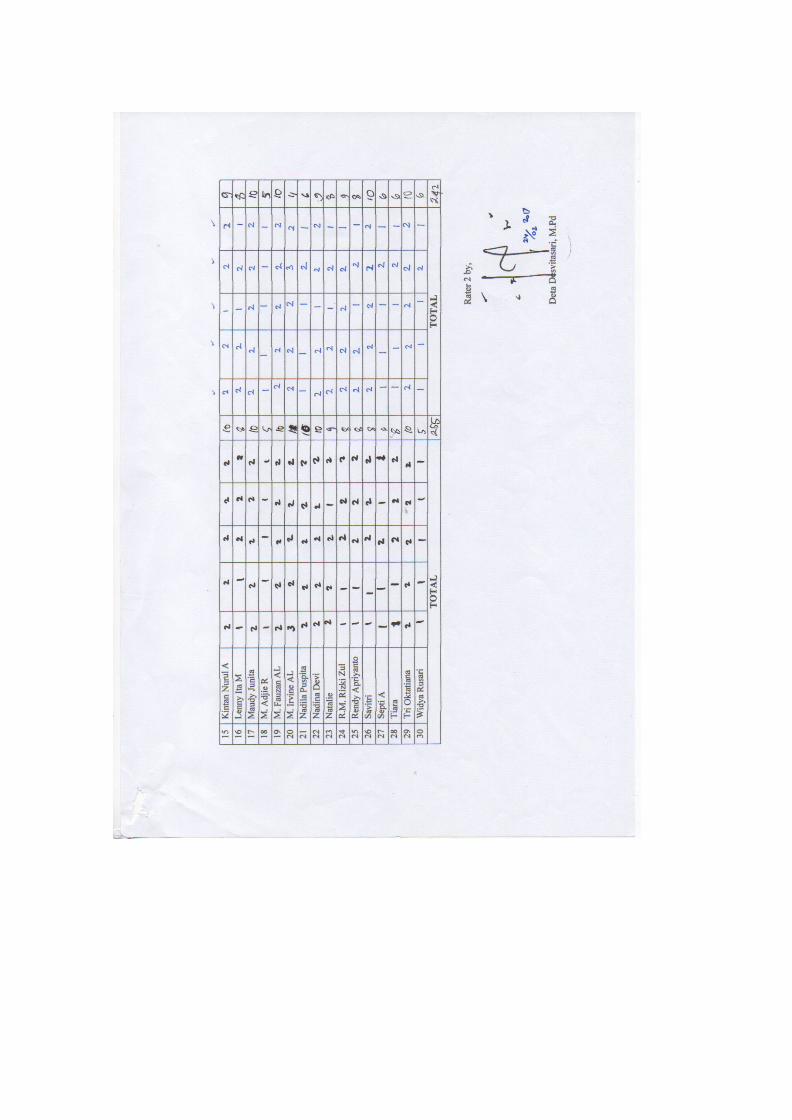
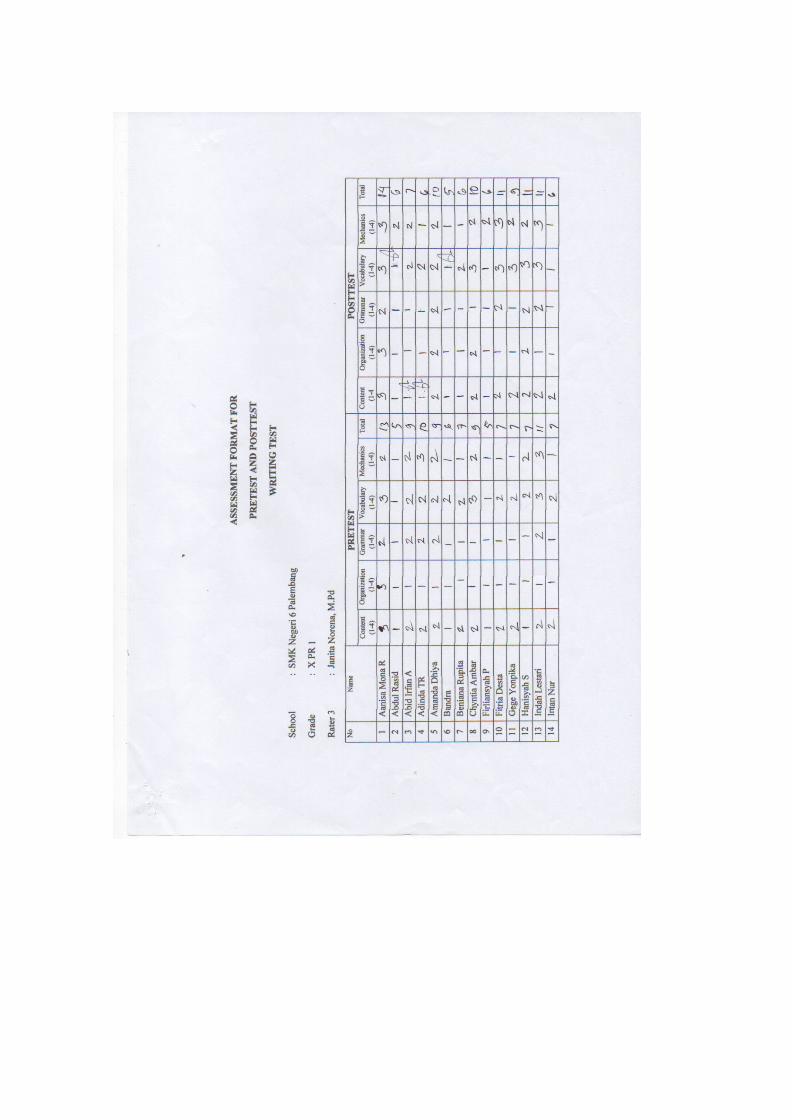
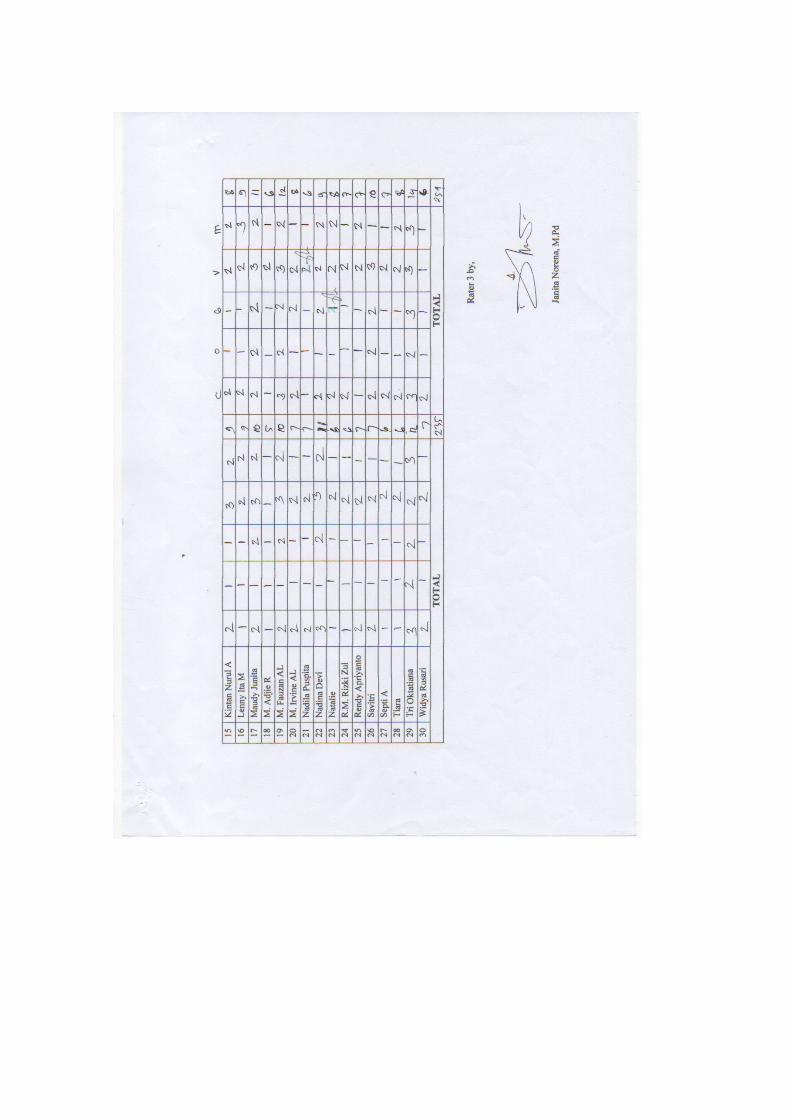
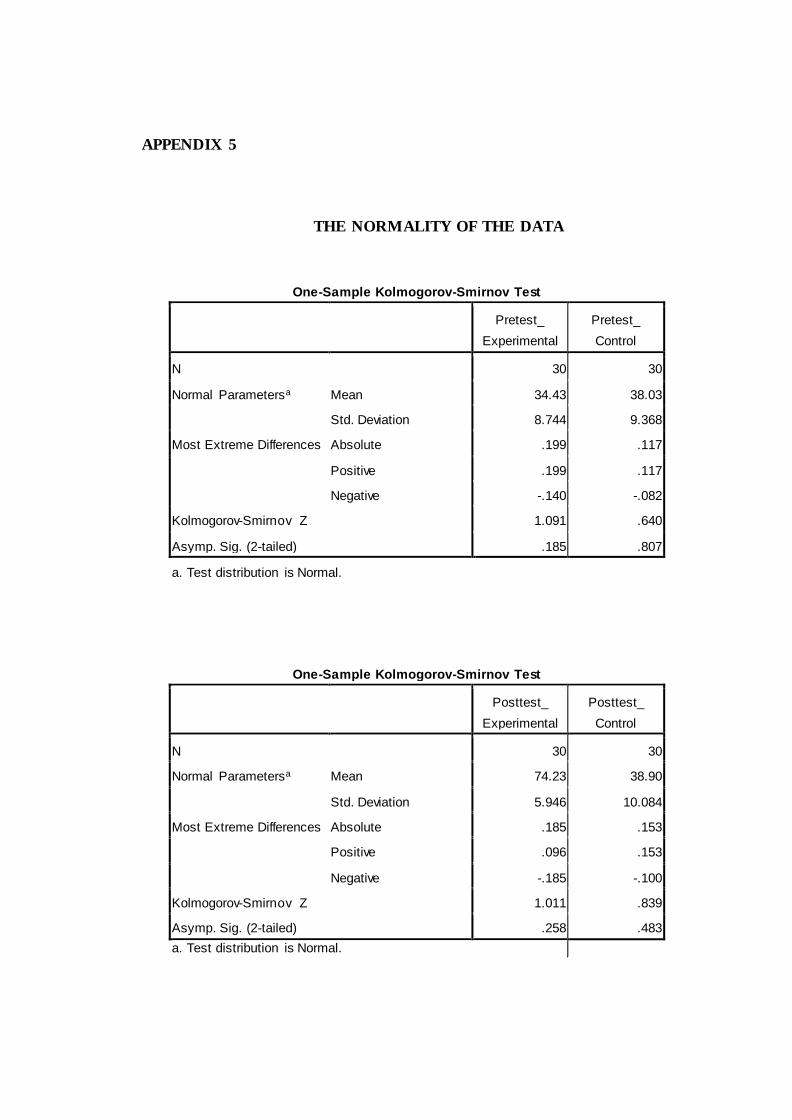
APPENDIX 5
THE NORMALITY OF THE DATA
One-Sample Kolmogorov-Smirnov Test
Pretest_
Experimental
Pretest_
Control
N 30 30
Normal Parametersa Mean 34.43 38.03
Std. Deviation 8.744 9.368
Most Extreme Differences Absolute .199 .117
Positive .199 .117
Negative -.140 -.082
Kolmogorov-Smirnov Z 1.091 .640
Asymp. Sig. (2-tailed) .185 .807
a. Test distribution is Normal.
One-Sample Kolmogorov-Smirnov Test
Posttest_
Experimental
Posttest_
Control
N 30 30
Normal Parametersa Mean 74.23 38.90
Std. Deviation 5.946 10.084
Most Extreme Differences Absolute .185 .153
Positive .096 .153
Negative -.185 -.100
Kolmogorov-Smirnov Z 1.011 .839
Asymp. Sig. (2-tailed) .258 .483
a. Test distribution is Normal.
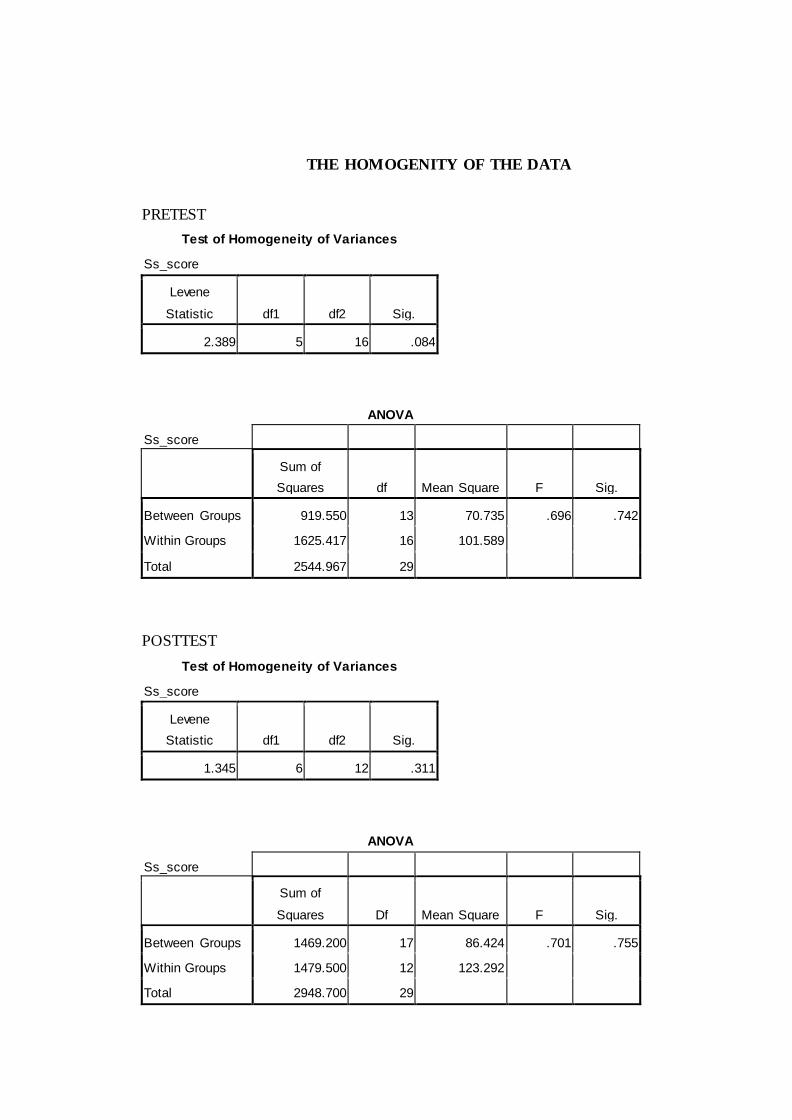
THE HOMOGENITY OF THE DATA
PRETEST
Test of Homogeneity of Variances
Ss_score
Levene
Statistic df1 df2 Sig.
2.389 5 16 .084
ANOVA
Ss_score
Sum of
Squares df Mean Square F Sig.
Between Groups 919.550 13 70.735 .696 .742
Within Groups 1625.417 16 101.589
Total 2544.967 29
POSTTEST
Test of Homogeneity of Variances
Ss_score
Levene
Statistic df1 df2 Sig.
1.345 6 12 .311
ANOVA
Ss_score
Sum of
Squares Df Mean Square F Sig.
Between Groups 1469.200 17 86.424 .701 .755
Within Groups 1479.500 12 123.292
Total 2948.700 29
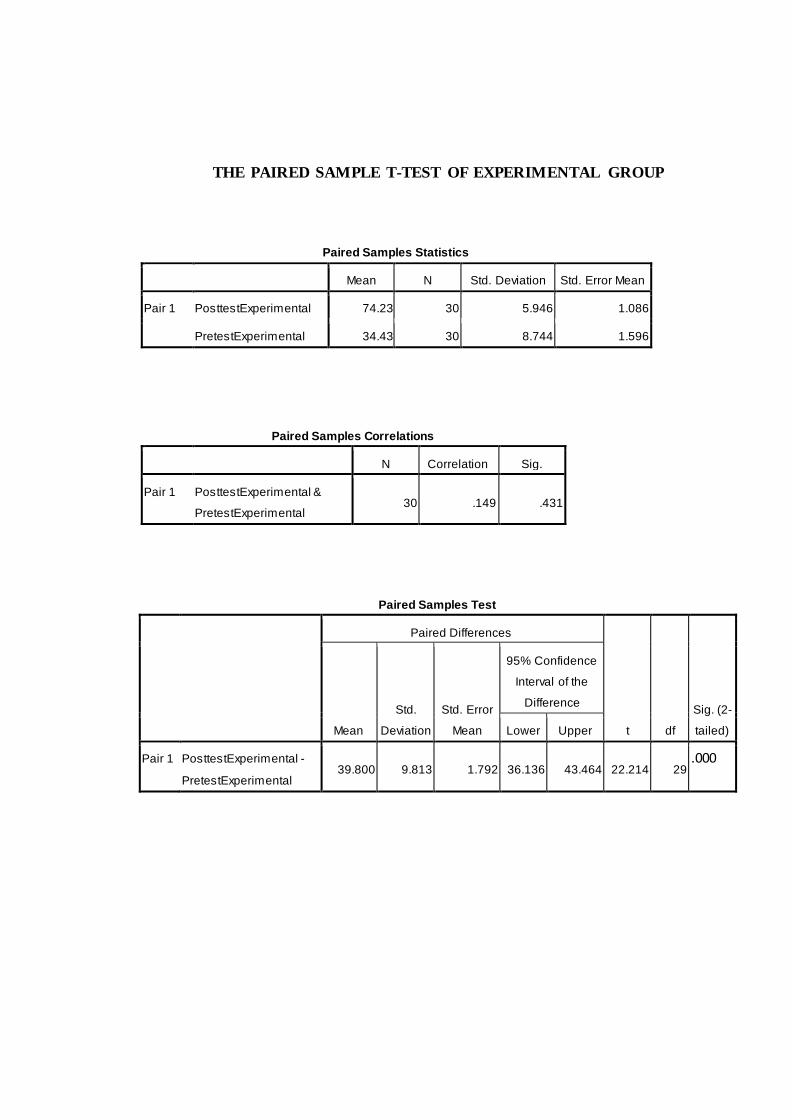
THE PAIRED SAMPLE T-TEST OF EXPERIMENTAL GROUP
Paired Samples Statistics
Mean N Std. Deviation Std. Error Mean
Pair 1 PosttestExperimental 74.23 30 5.946 1.086
PretestExperimental 34.43 30 8.744 1.596
Paired Samples Correlations
N Correlation Sig.
Pair 1 PosttestExperimental &
PretestExperimental 30 .149 .431
Paired Samples Test
Paired Differences
t df
Sig. (2-
tailed)
Mean
Std.
Deviation
Std. Error
Mean
95% Confidence
Interval of the
Difference
Lower Upper
Pair 1 PosttestExperimental -
PretestExperimental 39.800 9.813 1.792 36.136 43.464 22.214 29
.000
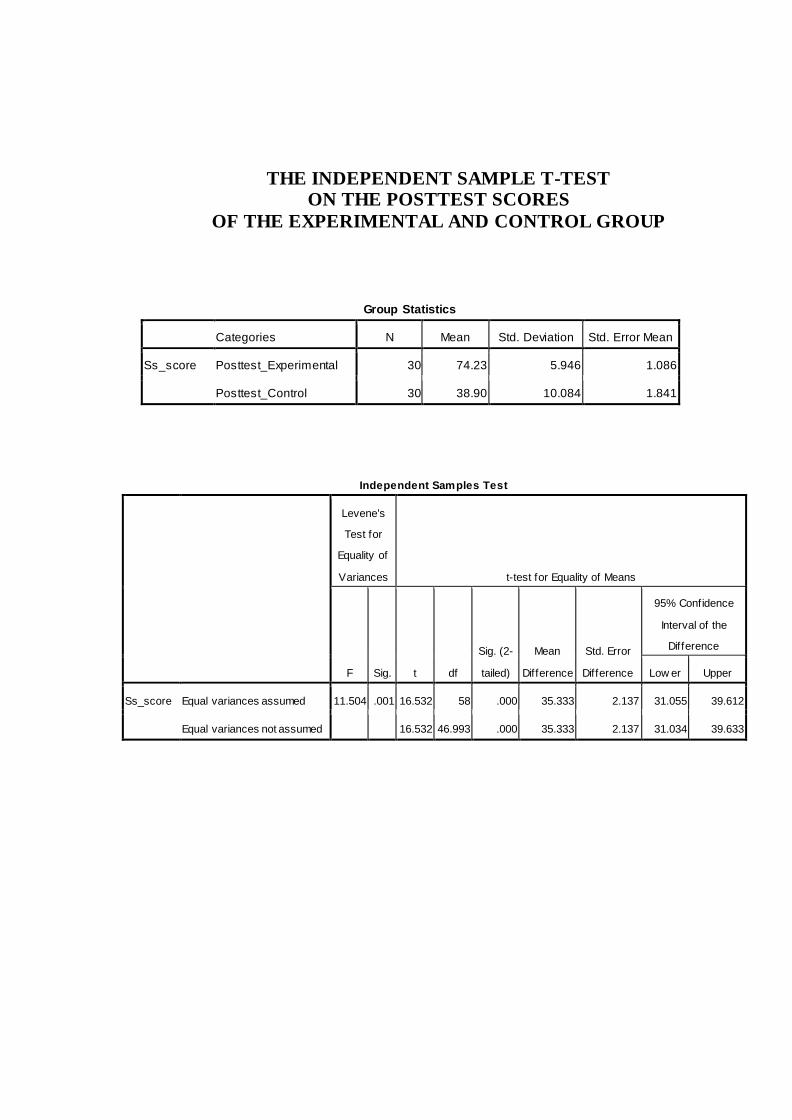
THE INDEPENDENT SAMPLE T-TEST ON THE POSTTEST SCORES
OF THE EXPERIMENTAL AND CONTROL GROUP
Group Statistics
Categories N Mean Std. Deviation Std. Error Mean
Ss_score Posttest_Experimental 30 74.23 5.946 1.086
Posttest_Control 30 38.90 10.084 1.841
Independent Samples Test
Levene's
Test for
Equality of
Variances t-test for Equality of Means
F Sig. t df
Sig. (2-
tailed)
Mean
Difference
Std. Error
Difference
95% Confidence
Interval of the
Difference
Low er Upper
Ss_score Equal variances assumed 11.504 .001 16.532 58 .000 35.333 2.137 31.055 39.612
Equal variances not assumed
16.532 46.993 .000 35.333 2.137 31.034 39.633
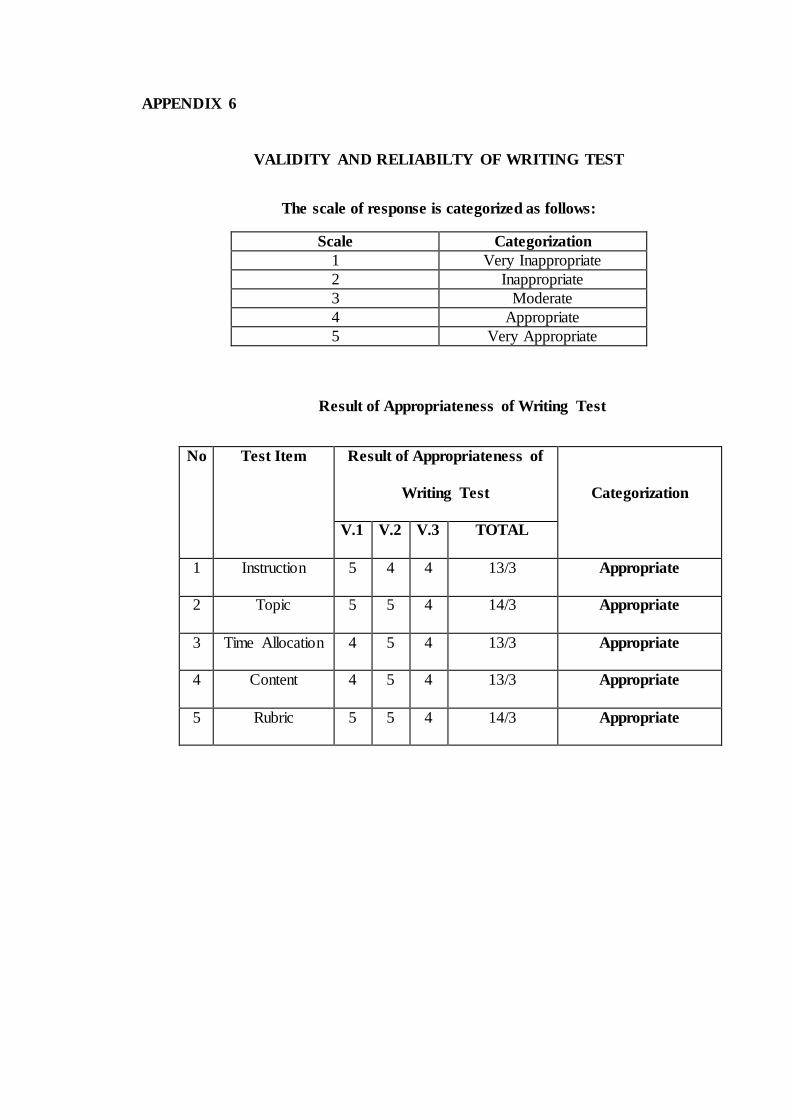
APPENDIX 6
VALIDITY AND RELIABILTY OF WRITING TEST
The scale of response is categorized as follows:
Scale Categorization
1 Very Inappropriate
2 Inappropriate
3 Moderate
4 Appropriate
5 Very Appropriate
Result of Appropriateness of Writing Test
No Test Item Result of Appropriateness of
Writing Test
Categorization
V.1 V.2 V.3 TOTAL
1 Instruction 5 4 4 13/3 Appropriate
2 Topic 5 5 4 14/3 Appropriate
3 Time Allocation 4 5 4 13/3 Appropriate
4 Content 4 5 4 13/3 Appropriate
5 Rubric 5 5 4 14/3 Appropriate
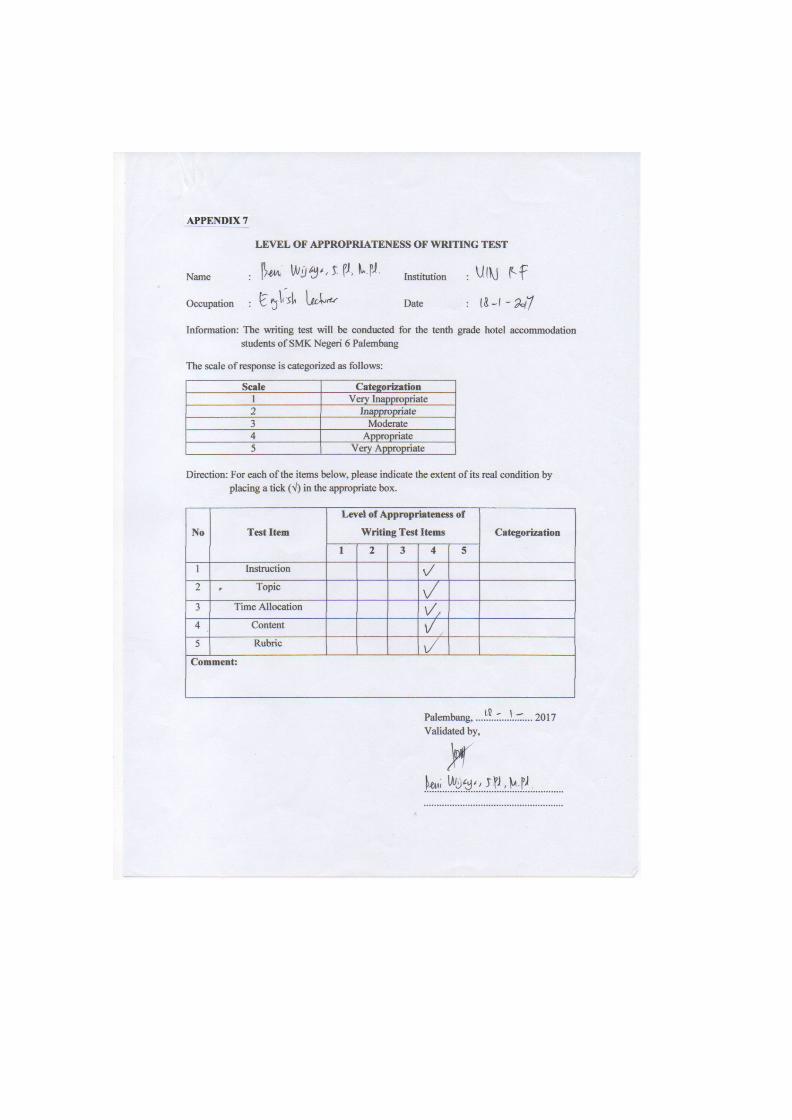
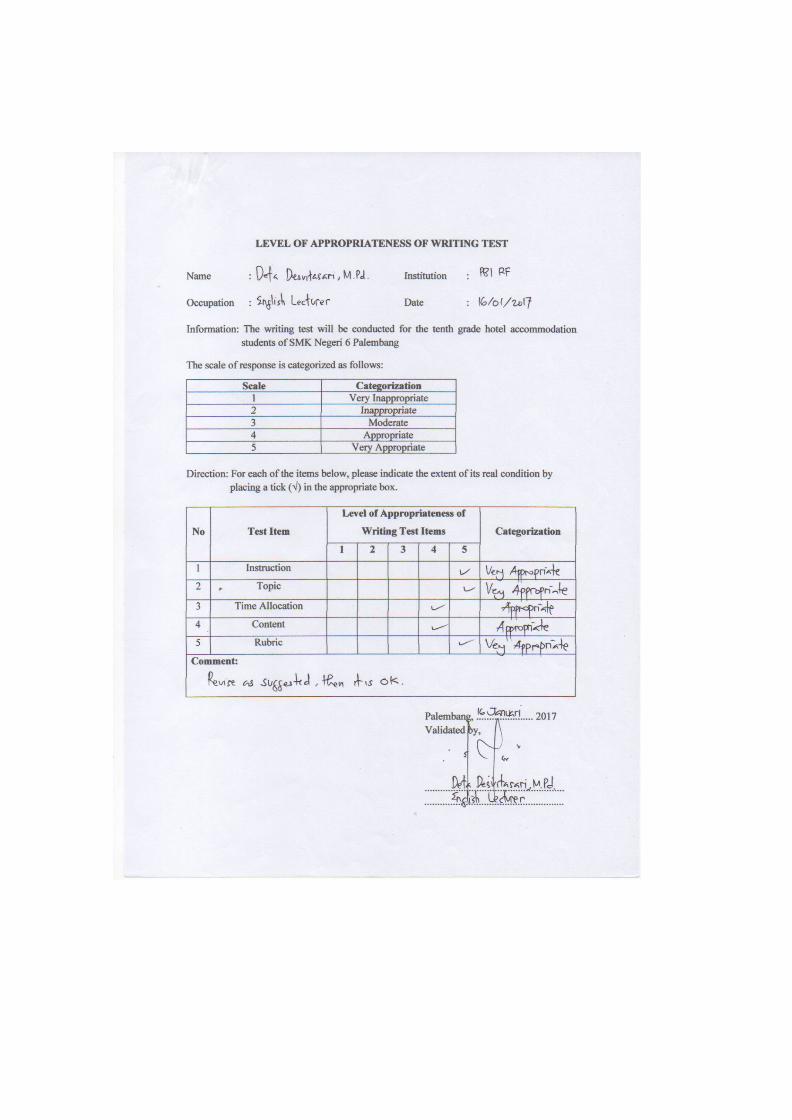
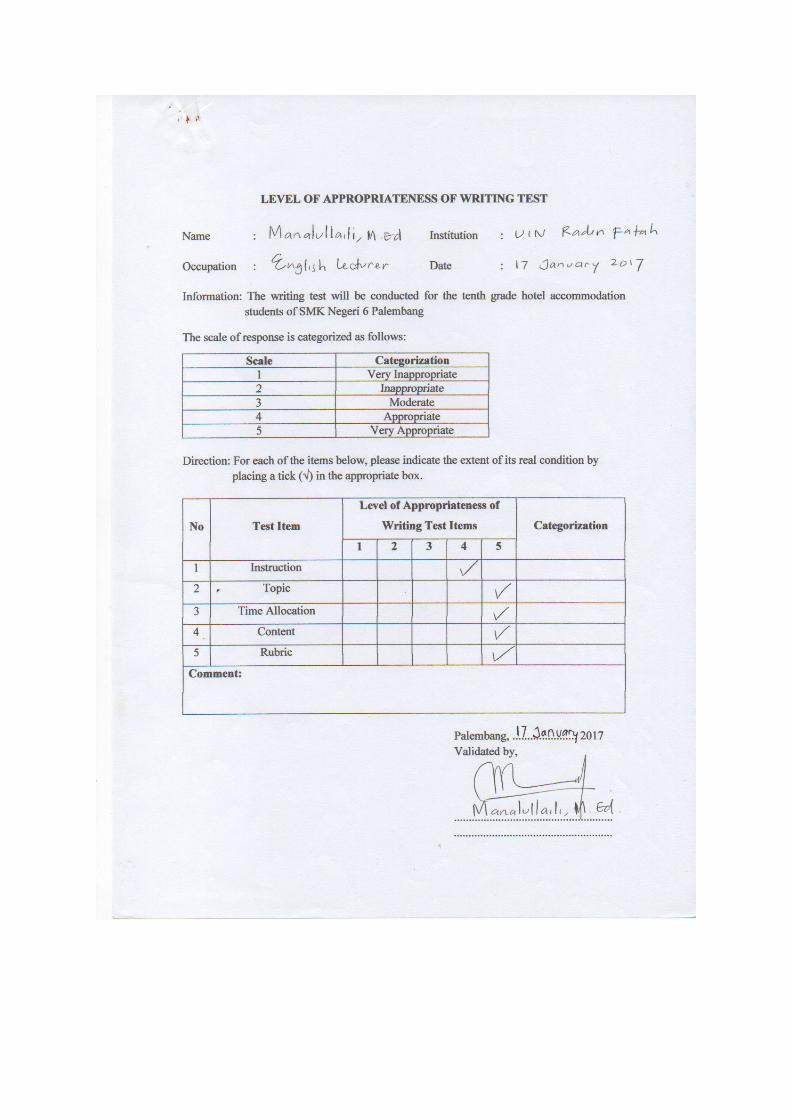
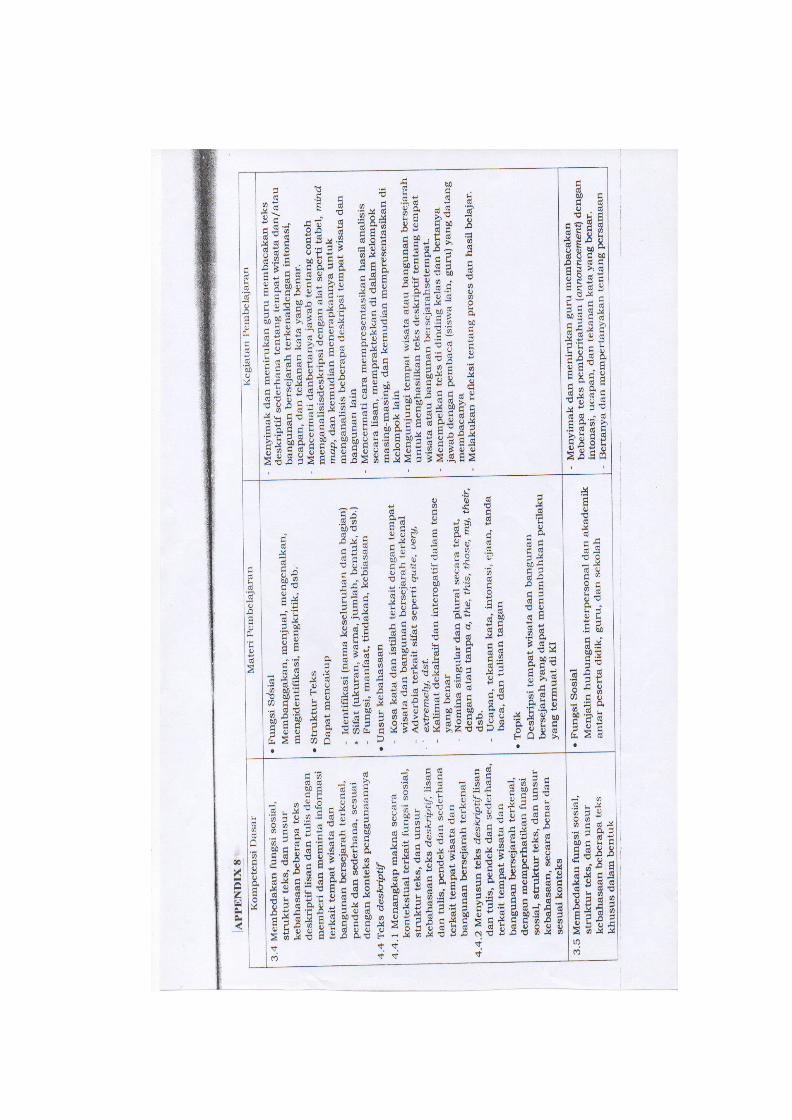
APPENDIX 9
LESSON PLAN
School : SMK Negeri 6 Palembang
Subject : English
Class : X PR 2
Topic : Descriptive Text
Allocation of time : 2 x 45 minutes
A. Main Competence
KI 1 : Concerning and practicing the value of their religion.
KI 2 : Exploring the attitude (honest, discipline, responsibility, care,
cooperation, piece, responsive and active)and shows the attitude as
problem solver in the country in effective interaction in social
society and take position ourselves as a reflection of the nation in
the association world.
KI 3 : Understand, apply, analyze, and evaluate factual knowledge,
conceptual, procedural in science, technology, arts, culture, and
humanities with human insight, national, state, and civilization-
related phenomena and events, as well as applying procedural
knowledge in a specific field of study according to their talents and
interests to solve the problem.
KI 4 : Tries, process, and serve in the concrete realm and abstract
domains associated with the development of the independently
learned in school, and was able to use the method according to the
rules of science.
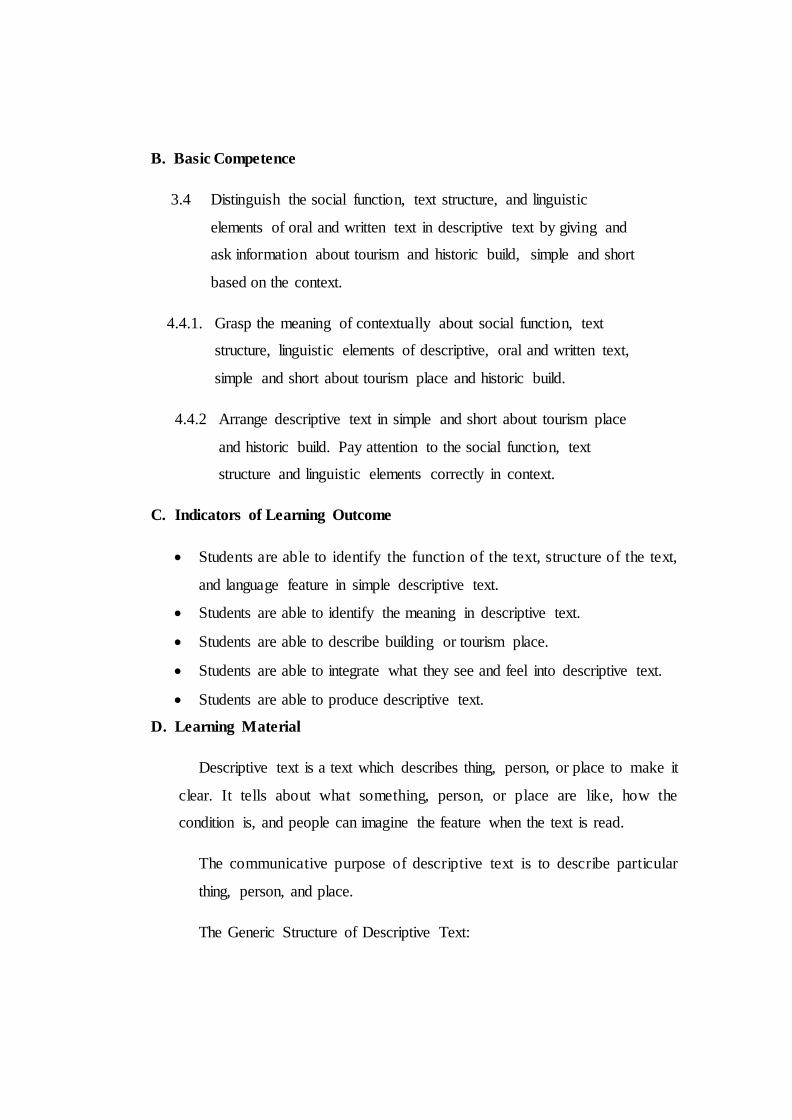
B. Basic Competence
3.4 Distinguish the social function, text structure, and linguistic
elements of oral and written text in descriptive text by giving and
ask information about tourism and historic build, simple and short
based on the context.
4.4.1. Grasp the meaning of contextually about social function, text
structure, linguistic elements of descriptive, oral and written text,
simple and short about tourism place and historic build.
4.4.2 Arrange descriptive text in simple and short about tourism place
and historic build. Pay attention to the social function, text
structure and linguistic elements correctly in context.
C. Indicators of Learning Outcome
Students are able to identify the function of the text, structure of the text,
and language feature in simple descriptive text.
Students are able to identify the meaning in descriptive text.
Students are able to describe building or tourism place.
Students are able to integrate what they see and feel into descriptive text.
Students are able to produce descriptive text.
D. Learning Material
Descriptive text is a text which describes thing, person, or place to make it
clear. It tells about what something, person, or place are like, how the
condition is, and people can imagine the feature when the text is read.
The communicative purpose of descriptive text is to describe particular
thing, person, and place.
The Generic Structure of Descriptive Text:
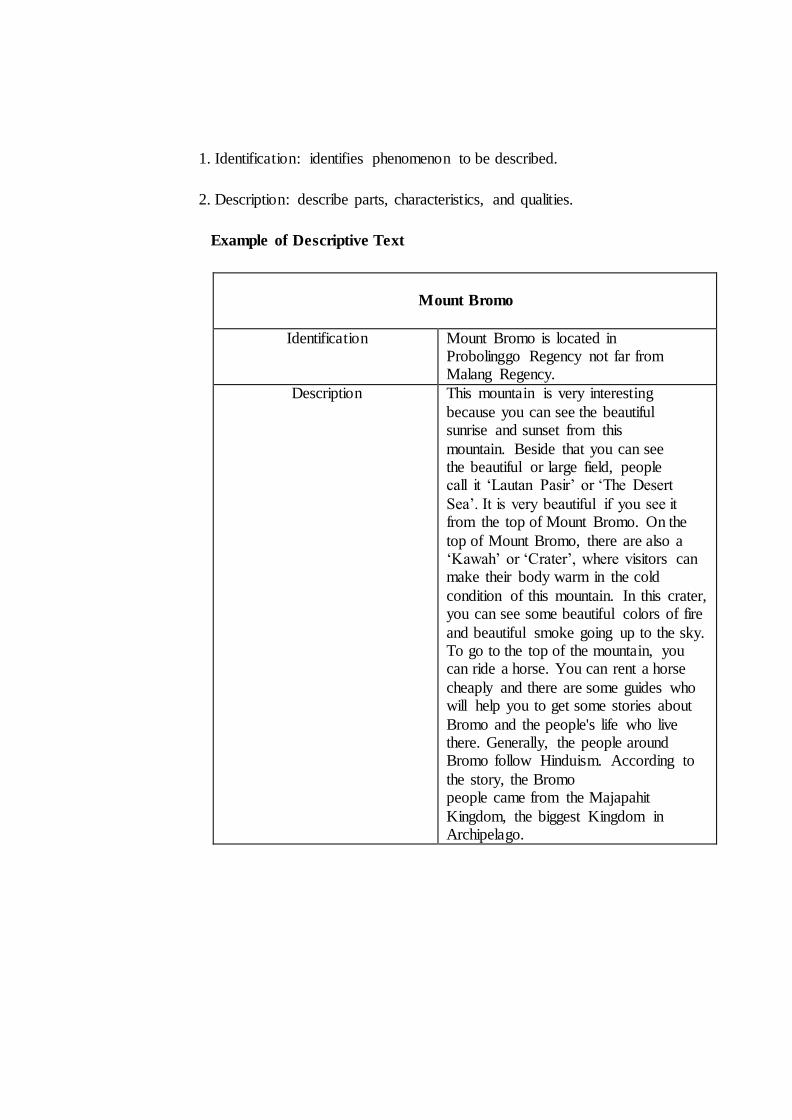
1. Identification: identifies phenomenon to be described.
2. Description: describe parts, characteristics, and qualities.
Example of Descriptive Text
Mount Bromo
Identification Mount Bromo is located in Probolinggo Regency not far from Malang Regency.
Description This mountain is very interesting
because you can see the beautiful sunrise and sunset from this
mountain. Beside that you can see the beautiful or large field, people call it ‘Lautan Pasir’ or ‘The Desert
Sea’. It is very beautiful if you see it from the top of Mount Bromo. On the
top of Mount Bromo, there are also a ‘Kawah’ or ‘Crater’, where visitors can make their body warm in the cold
condition of this mountain. In this crater, you can see some beautiful colors of fire
and beautiful smoke going up to the sky. To go to the top of the mountain, you can ride a horse. You can rent a horse
cheaply and there are some guides who will help you to get some stories about
Bromo and the people's life who live there. Generally, the people around Bromo follow Hinduism. According to
the story, the Bromo people came from the Majapahit
Kingdom, the biggest Kingdom in Archipelago.
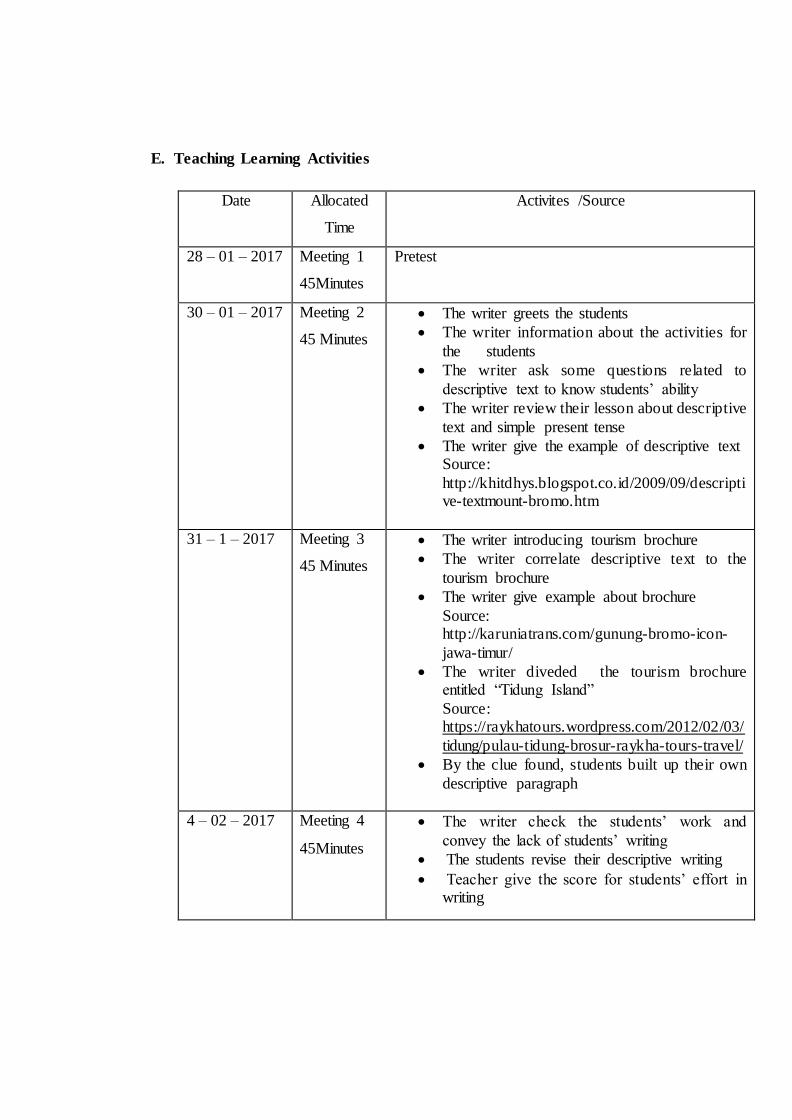
E. Teaching Learning Activities
Date Allocated
Time
Activites /Source
28 – 01 – 2017 Meeting 1
45Minutes
Pretest
30 – 01 – 2017 Meeting 2
45 Minutes
The writer greets the students
The writer information about the activities for
the students
The writer ask some questions related to
descriptive text to know students’ ability
The writer review their lesson about descriptive
text and simple present tense
The writer give the example of descriptive text Source:
http://khitdhys.blogspot.co.id/2009/09/descriptive-textmount-bromo.htm
31 – 1 – 2017 Meeting 3
45 Minutes
The writer introducing tourism brochure
The writer correlate descriptive text to the
tourism brochure
The writer give example about brochure
Source: http://karuniatrans.com/gunung-bromo-icon-
jawa-timur/
The writer diveded the tourism brochure entitled “Tidung Island”
Source: https://raykhatours.wordpress.com/2012/02/03/
tidung/pulau-tidung-brosur-raykha-tours-travel/
By the clue found, students built up their own
descriptive paragraph
4 – 02 – 2017 Meeting 4
45Minutes
The writer check the students’ work and
convey the lack of students’ writing
The students revise their descriptive writing
Teacher give the score for students’ effort in writing
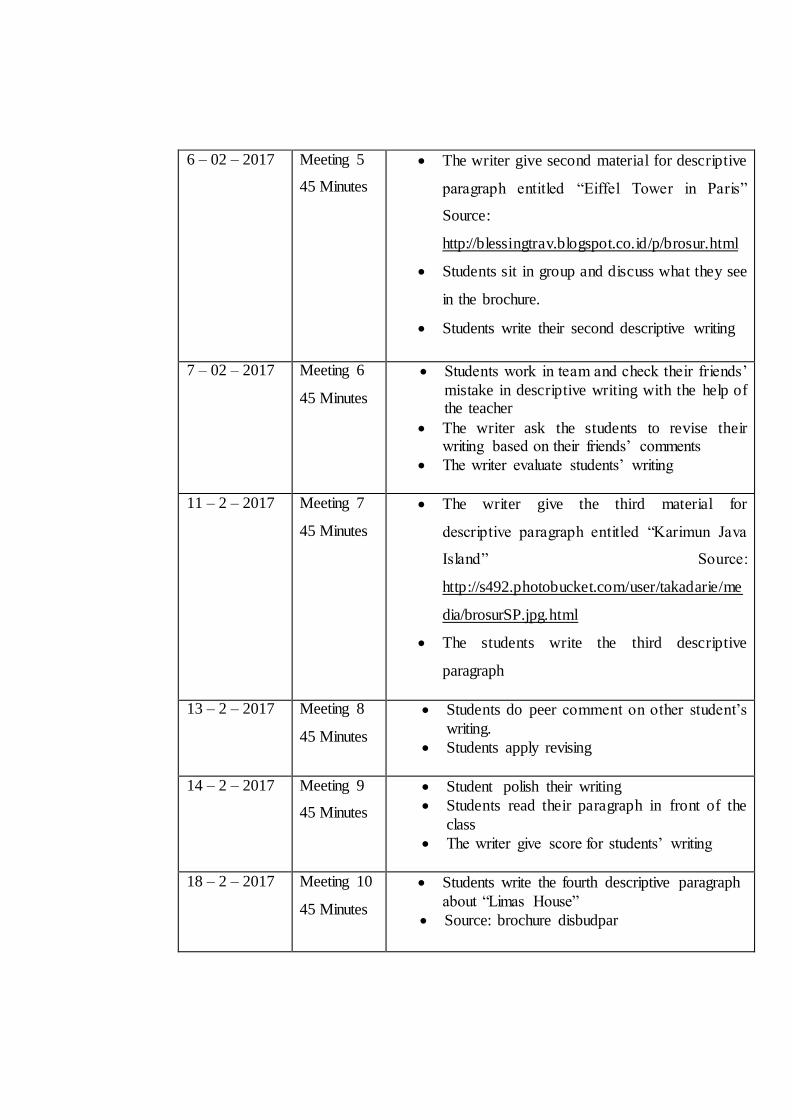
6 – 02 – 2017 Meeting 5
45 Minutes
The writer give second material for descriptive
paragraph entitled “Eiffel Tower in Paris”
Source:
http://blessingtrav.blogspot.co.id/p/brosur.html
Students sit in group and discuss what they see
in the brochure.
Students write their second descriptive writing
7 – 02 – 2017 Meeting 6
45 Minutes
Students work in team and check their friends’
mistake in descriptive writing with the help of the teacher
The writer ask the students to revise their writing based on their friends’ comments
The writer evaluate students’ writing
11 – 2 – 2017 Meeting 7
45 Minutes
The writer give the third material for
descriptive paragraph entitled “Karimun Java
Island” Source:
http://s492.photobucket.com/user/takadarie/me
dia/brosurSP.jpg.html
The students write the third descriptive
paragraph
13 – 2 – 2017 Meeting 8
45 Minutes
Students do peer comment on other student’s
writing.
Students apply revising
14 – 2 – 2017 Meeting 9
45 Minutes
Student polish their writing
Students read their paragraph in front of the
class
The writer give score for students’ writing
18 – 2 – 2017 Meeting 10
45 Minutes
Students write the fourth descriptive paragraph
about “Limas House”
Source: brochure disbudpar
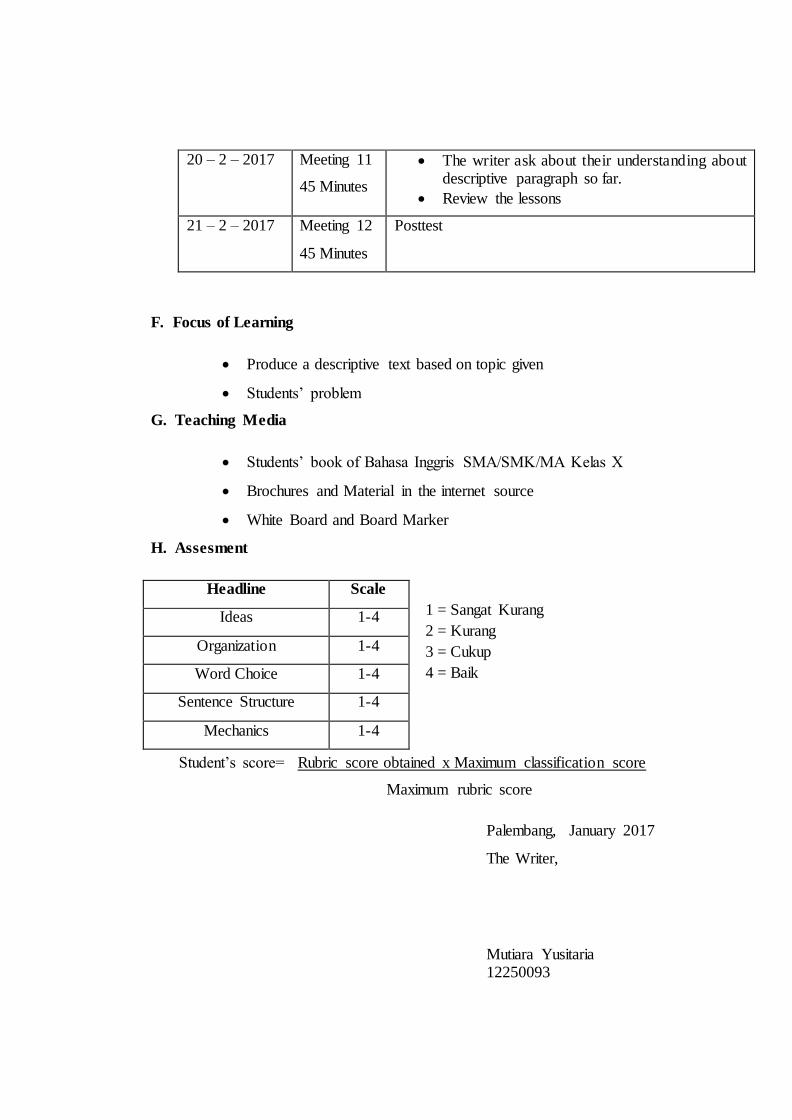
20 – 2 – 2017 Meeting 11
45 Minutes
The writer ask about their understanding about descriptive paragraph so far.
Review the lessons
21 – 2 – 2017 Meeting 12
45 Minutes
Posttest
F. Focus of Learning
Produce a descriptive text based on topic given
Students’ problem
G. Teaching Media
Students’ book of Bahasa Inggris SMA/SMK/MA Kelas X
Brochures and Material in the internet source
White Board and Board Marker
H. Assesment
1 = Sangat Kurang
2 = Kurang
3 = Cukup
4 = Baik
Student’s score= Rubric score obtained x Maximum classification score
Maximum rubric score
Palembang, January 2017
The Writer,
Mutiara Yusitaria 12250093
Headline Scale
Ideas 1-4
Organization 1-4
Word Choice 1-4
Sentence Structure 1-4
Mechanics 1-4
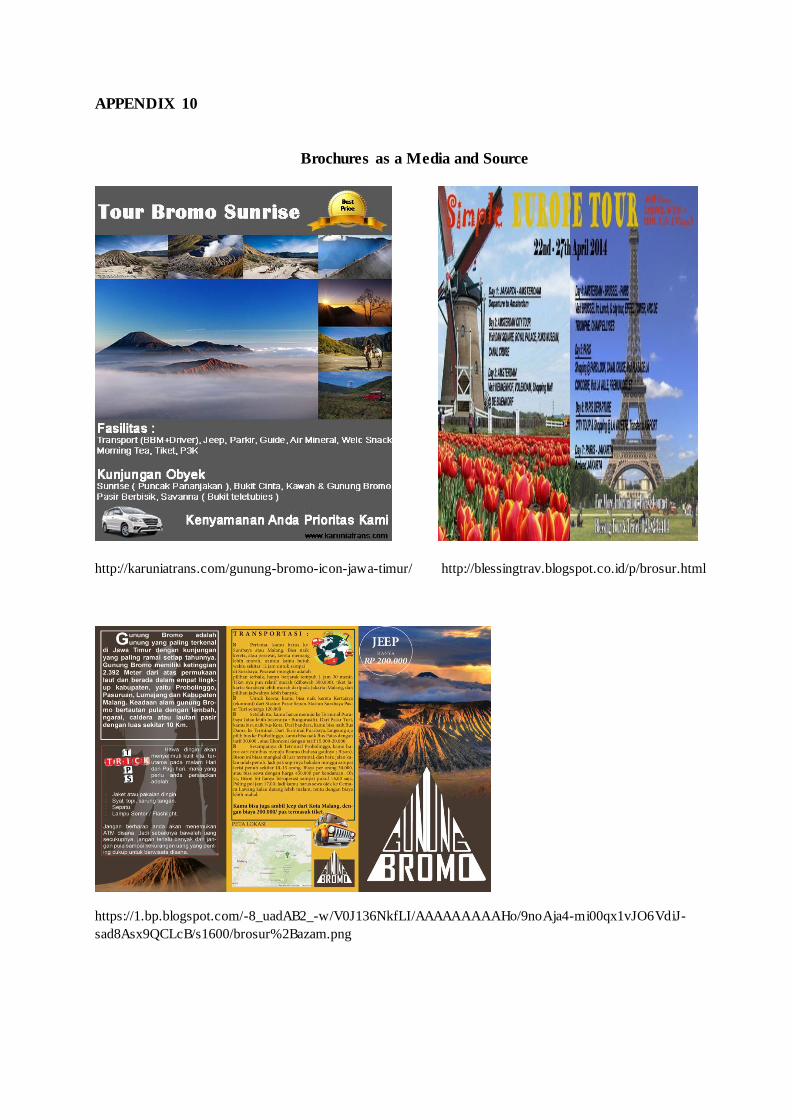
APPENDIX 10
Brochures as a Media and Source
http://karuniatrans.com/gunung-bromo-icon-jawa-timur/ http://blessingtrav.blogspot.co.id/p/brosur.html
https://1.bp.blogspot.com/-8_uadAB2_-w/V0J136NkfLI/AAAAAAAAAHo/9noAja4-mi00qx1vJO6VdiJ-
sad8Asx9QCLcB/s1600/brosur%2Bazam.png
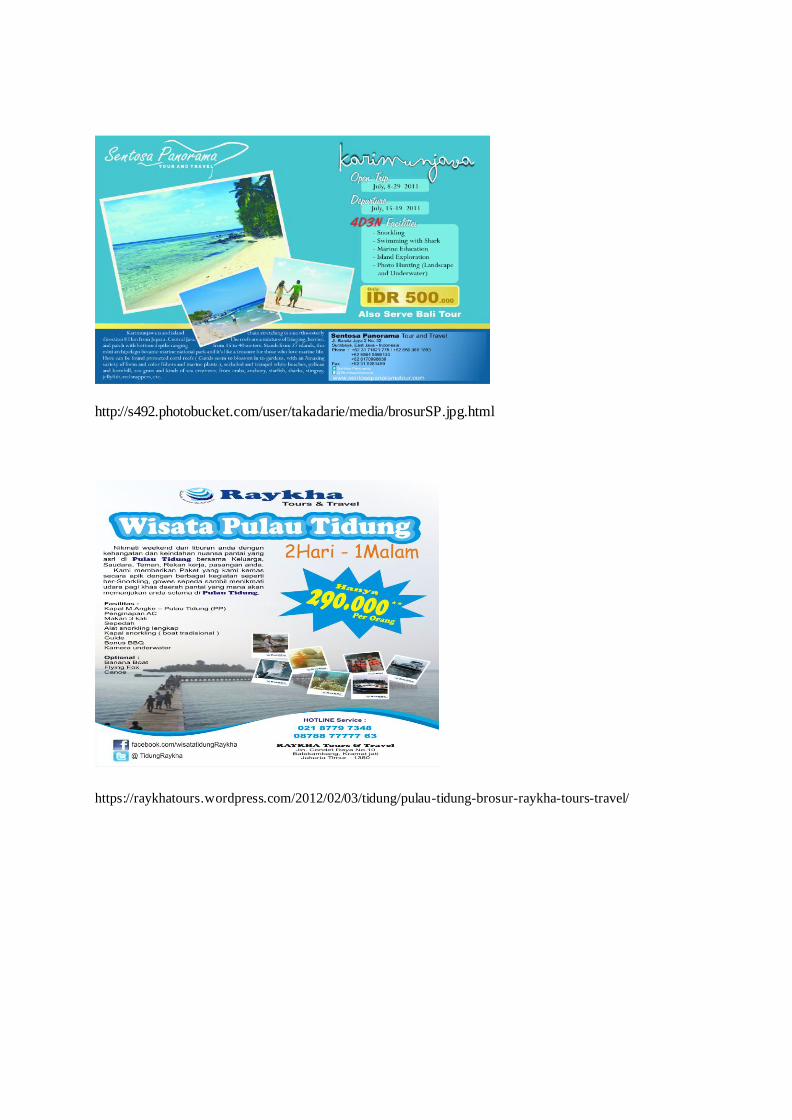
http://s492.photobucket.com/user/takadarie/media/brosurSP.jpg.html
https://raykhatours.wordpress.com/2012/02/03/tidung/pulau-tidung-brosur-raykha-tours-travel/
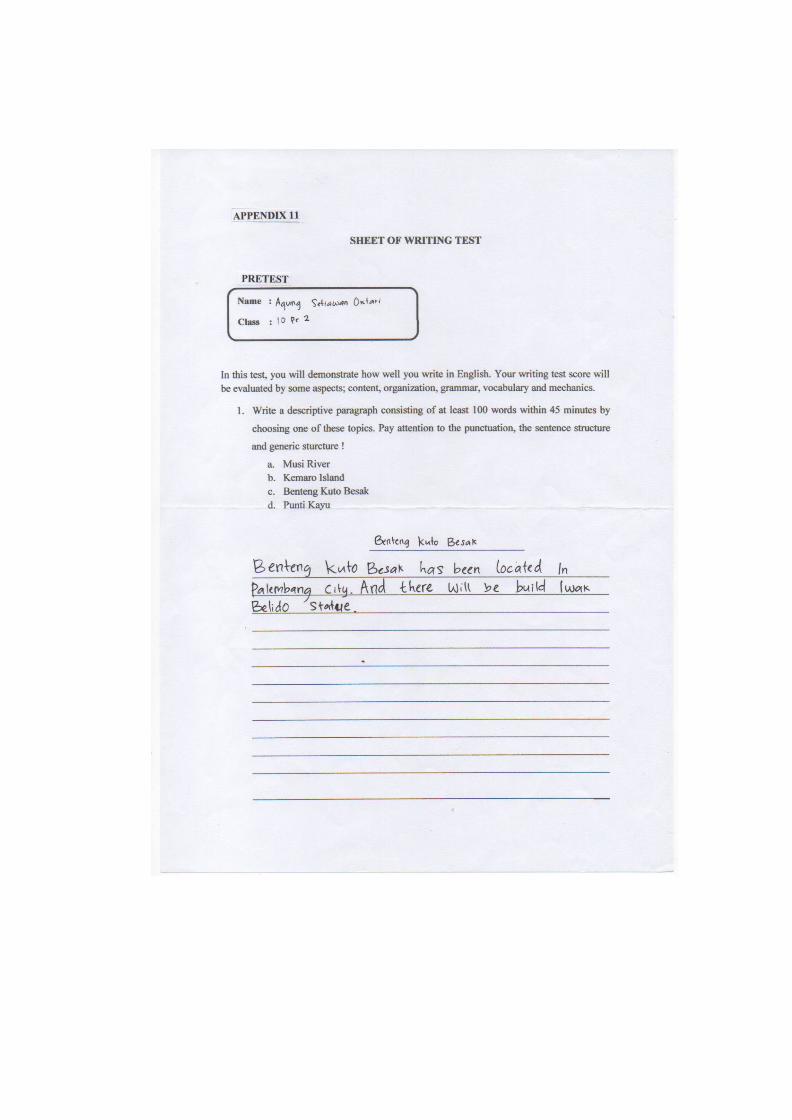
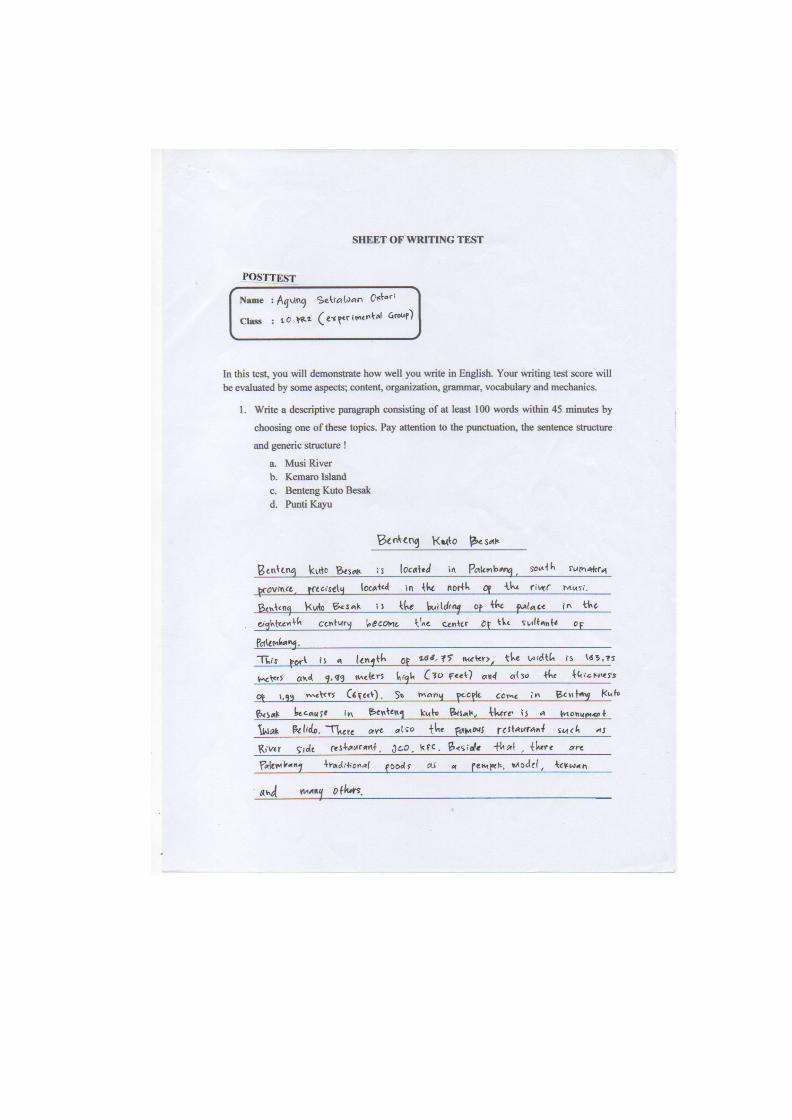
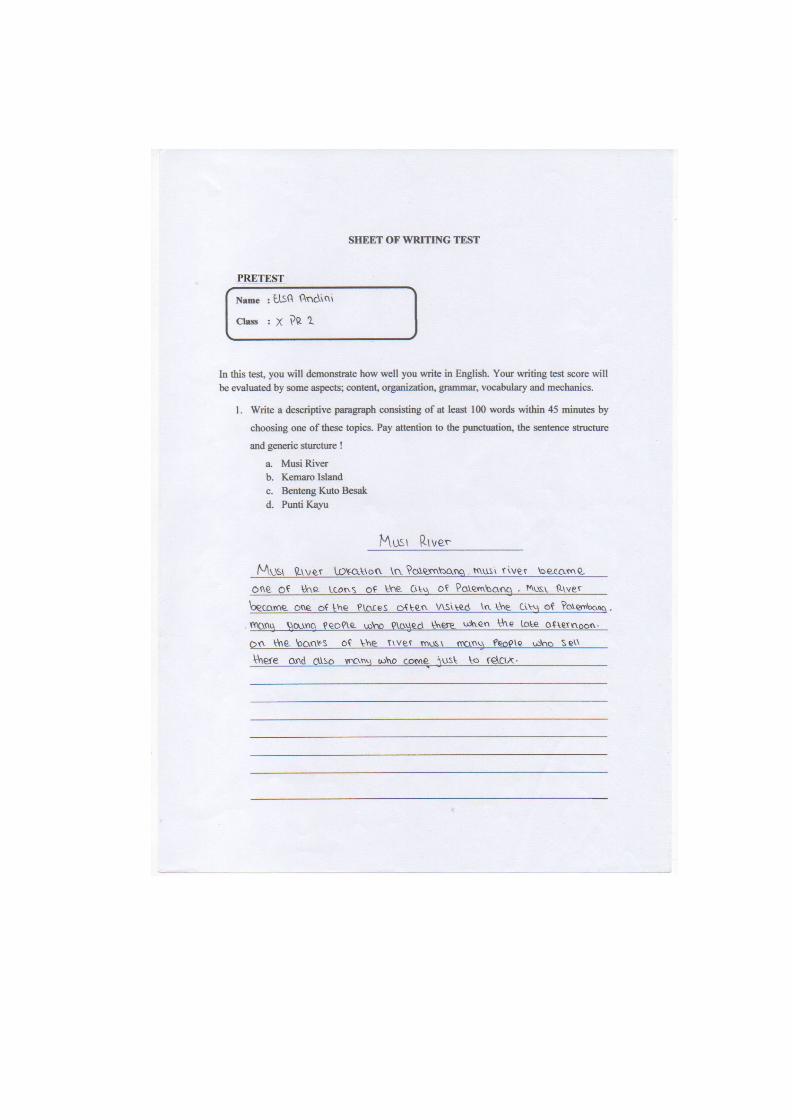
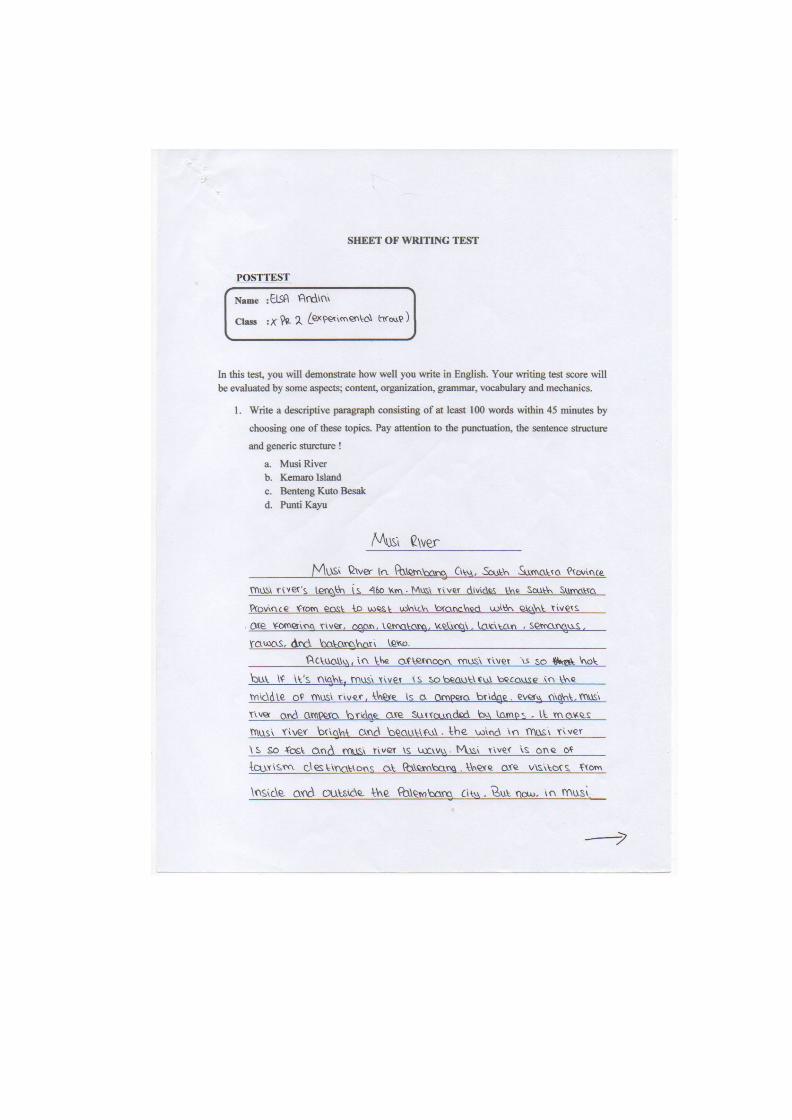

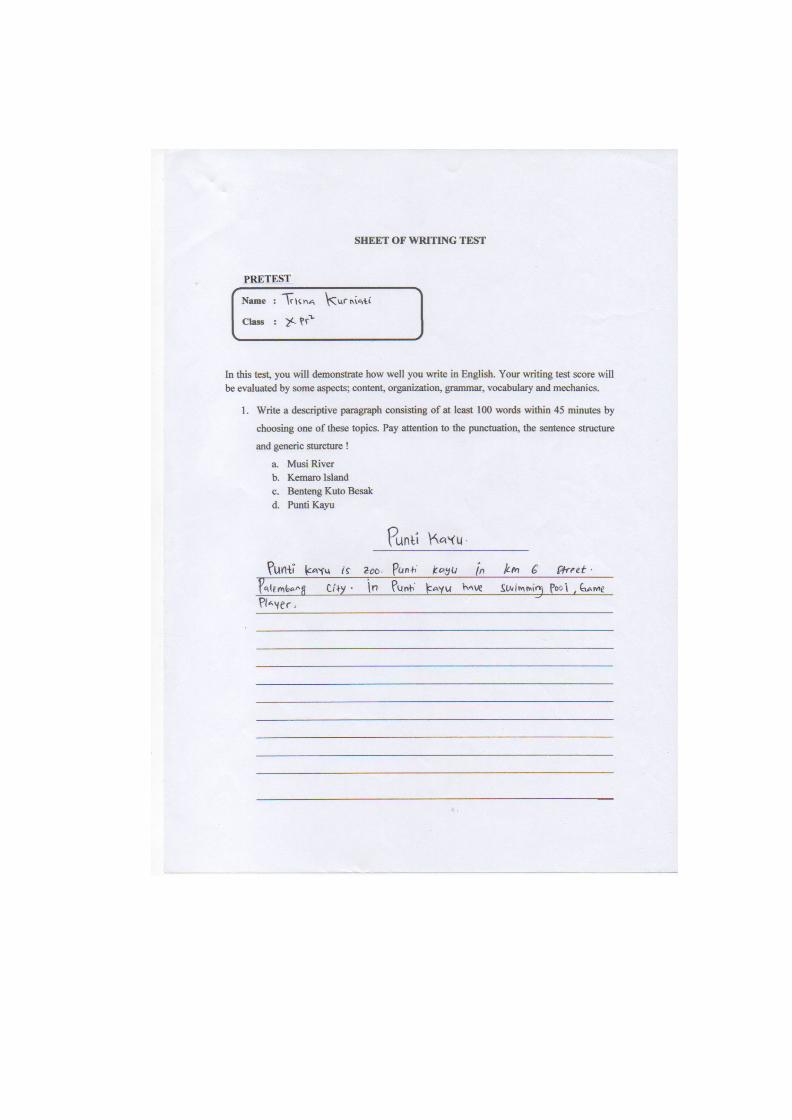
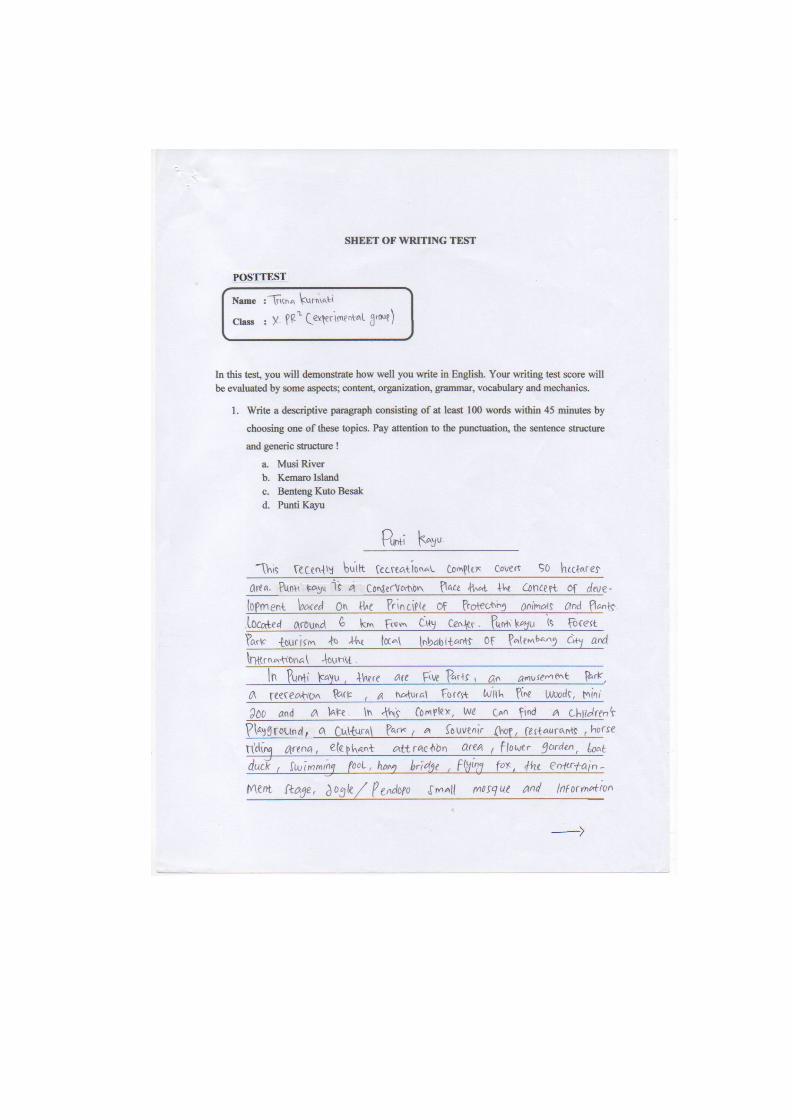

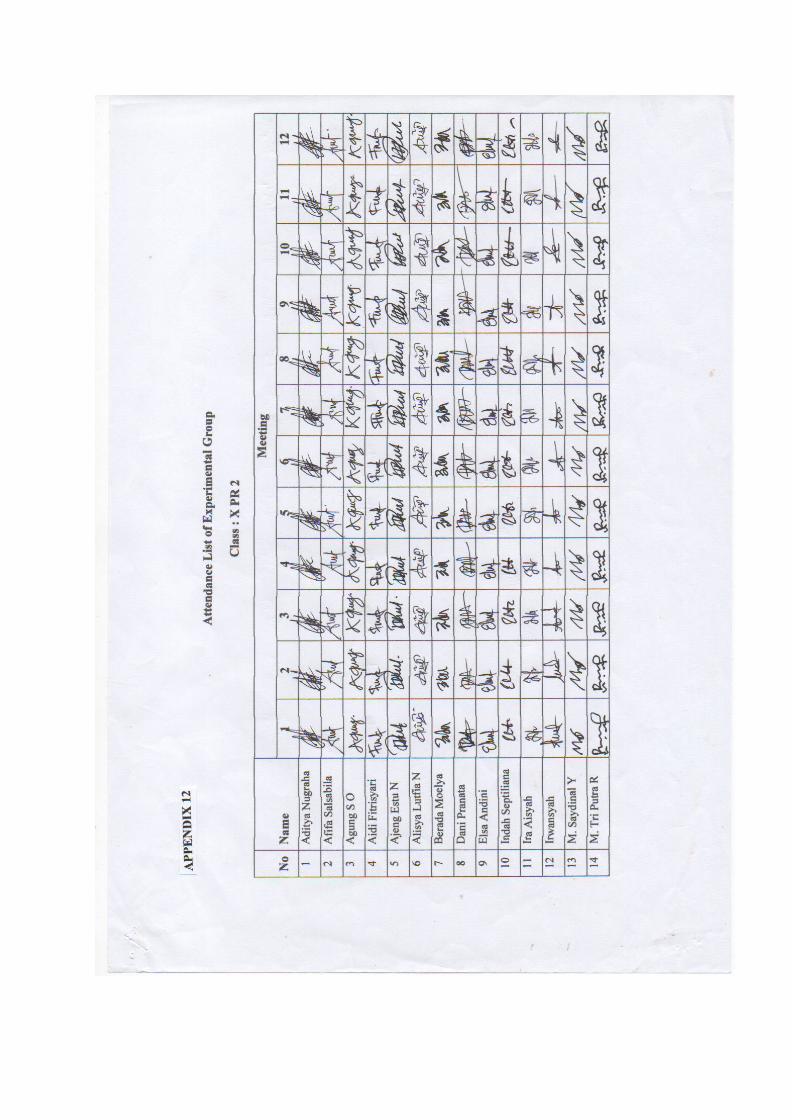
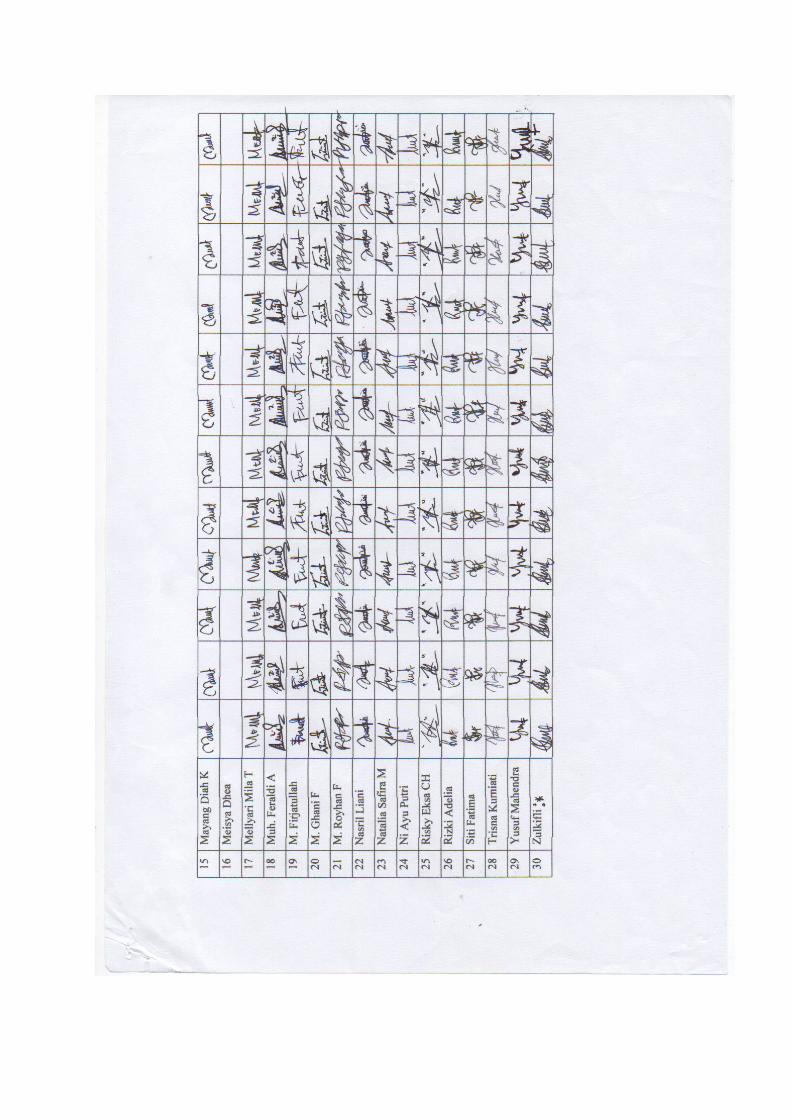
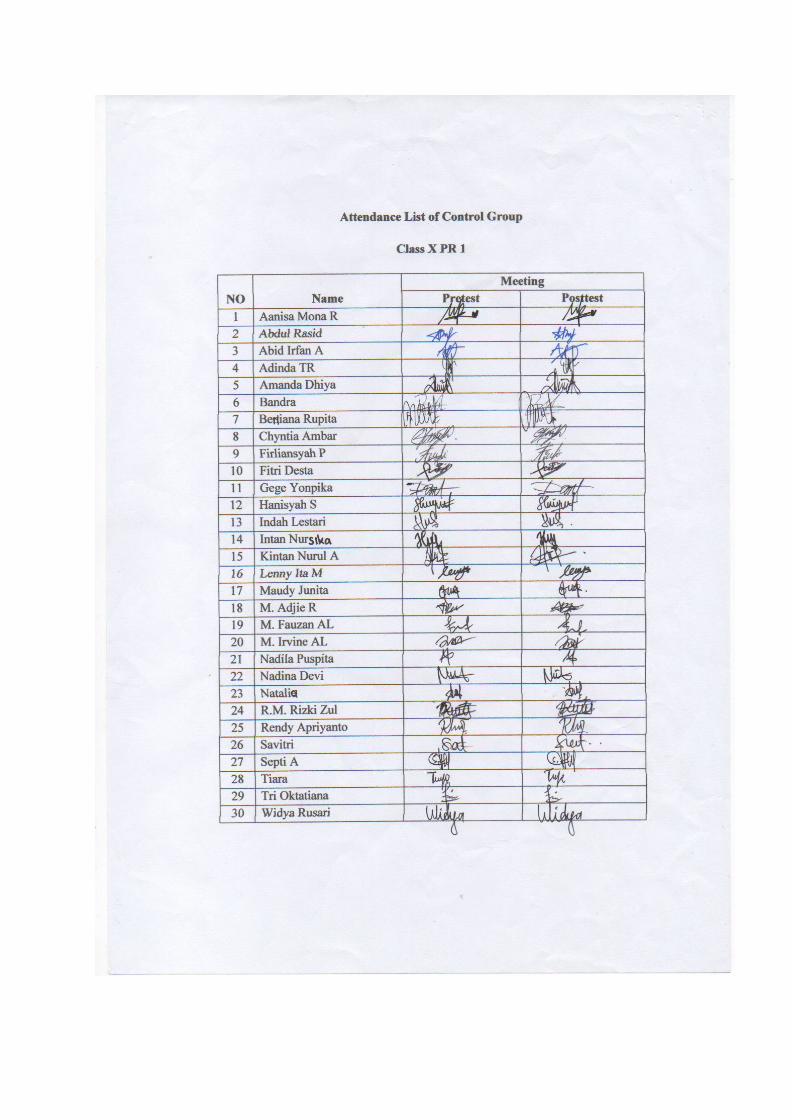
APPENDIX 13


![MBA Tourism Management [new layout] - Office of …grad.au.edu/graduate/download/content/file/general/Brochures/MBA/... · Good command of English 4. ... TR 6109 International Tourism](https://img.pdfslide.us/doc/110x75/5a9d67f77f8b9abd058cc7af/mba-tourism-management-new-layout-office-of-gradauedugraduatedownloadcontentfilegeneralbrochuresmbagood.jpg)