Embed Size (px)
DESCRIPTION
TIME 2014 Technology in Mathematics Education July 1 st - 5 th 2014, Krems , Austria. Using TI- Nspire 2D Graphs in a CAS Environment. Michel Beaudin, ÉTS, Montréal, Canada. Overview. Introduction Using a 2D Plot Window in a CAS Perspective - PowerPoint PPT Presentation
Citation preview
Using TI-Nspire 2D Graphs
in a CAS EnvironmentMichel Beaudin, ÉTS, Montréal, Canada
TIME 2014Technology in Mathematics Education
July 1st - 5th 2014, Krems, Austria
2
Overview
Introduction
Using a 2D Plot Window in a CAS Perspective• Plotting a circle and implicit differentiation• Helping students with inverse functions• A more complicated example• Intersection of 2 parametric curves• From piecewise to indicator functions• Geometric transformation and matrix stuff
3
Introduction
There are up to seven 2D plot windows in Npsire CAS.
We will start by plotting a simple curve using many Graph Entry/Edit styles.
Plotting these graphs will become an opportunity to use some nice features of Nspire CAS.
Namely the power of the math engine, the built-in geometry package and the possibility of using animations.
4
Introduction
The most important consequence will be the following: we will be using these 2D graph windows to do more and not less mathematics!
It will become and opportunity to make connections between subjects that may look different but are, in fact, related. Computer Algebra allows this.
5
Introduction
(Since OS 3.2) The 2D plot window graph Entry/Edit accepts up to 7 different types but 2D implicit plots are still missing.
Slider bars, animations, dynamic geometry, styles and colors make each of these 2D plot windows very attractive and useful for teaching mathematics and sciences.
6
Using a 2D Plot Window in a CAS Perspective
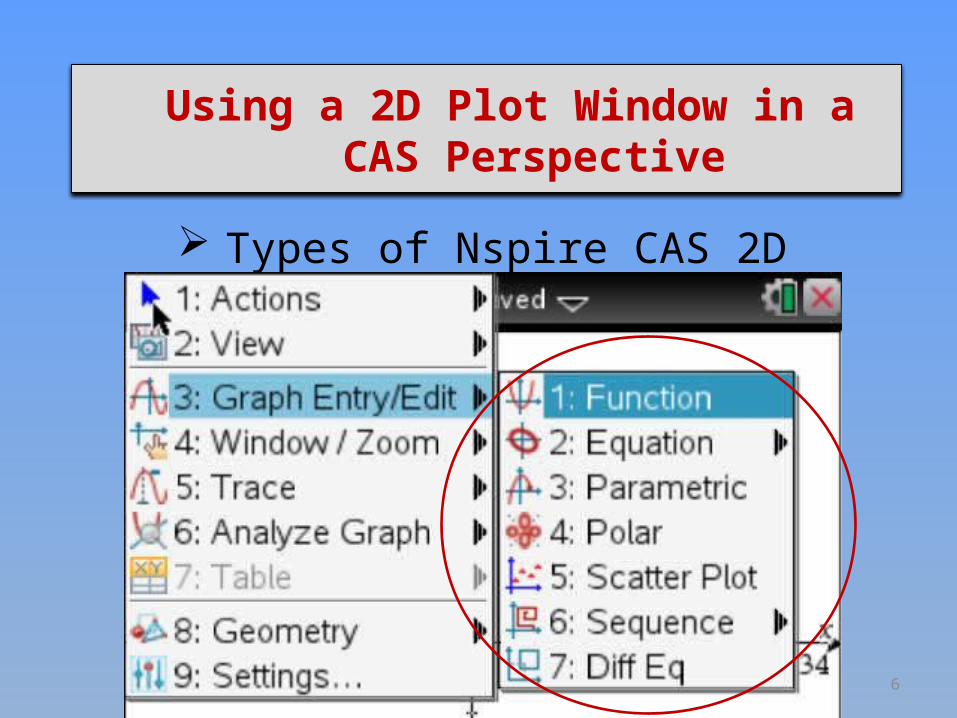
Types of Nspire CAS 2D graphs:
7
Using a 2D Plot Window in a CAS Perspective
Today sequence and differential equations graphing modes won’t be used in this talk. So we will make use of function, equation, parametric, polar and scatter plot graphing modes.
Despite the fact that implicit 2D plotting is not yet available, one can plot curves defined by x = g(y) and, in some cases, plot implicit curves.
8
Using a 2D Plot Window in a CAS Perspective
This talk adopts the following way of procedure.
An example is shown on slides with few details: then we switch to Nspire CAS and perform it live, giving all necessary details.
In order to do this, the CAS should be easy to use with a simple syntax.
9
Using a 2D Plot Window in a CAS Perspective
For those among the audience who are not using Nspire CAS, this talk can serve as an introduction.
For those among the audience who are using Nspire CAS, this talk can give additional ideas for teaching mathematics at undergraduate level.
10
Plotting a circle and implicit differentiation
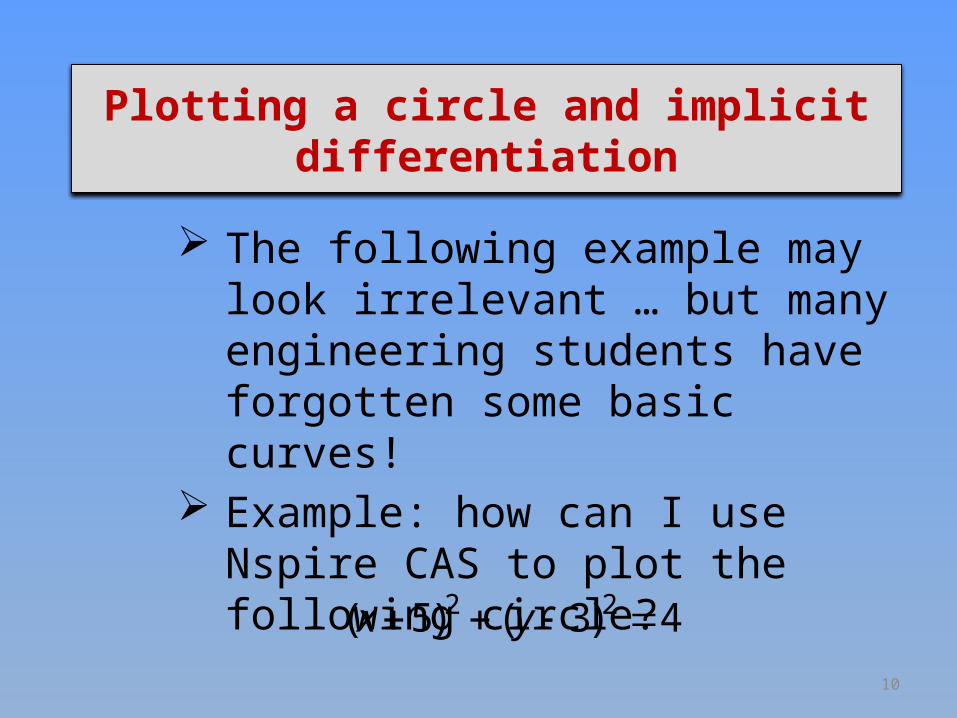
The following example may look irrelevant … but many engineering students have forgotten some basic curves!
Example: how can I use Nspire CAS to plot the following circle?
2 2( 5) ( 3) 4x y
11
Plotting a circle and implicit differentiation
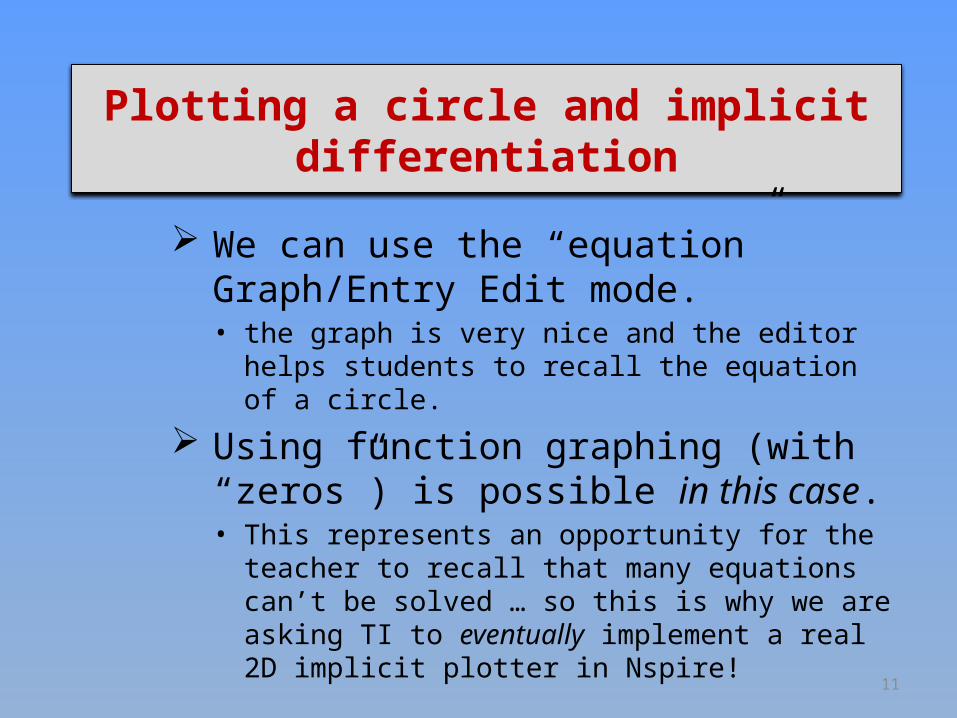
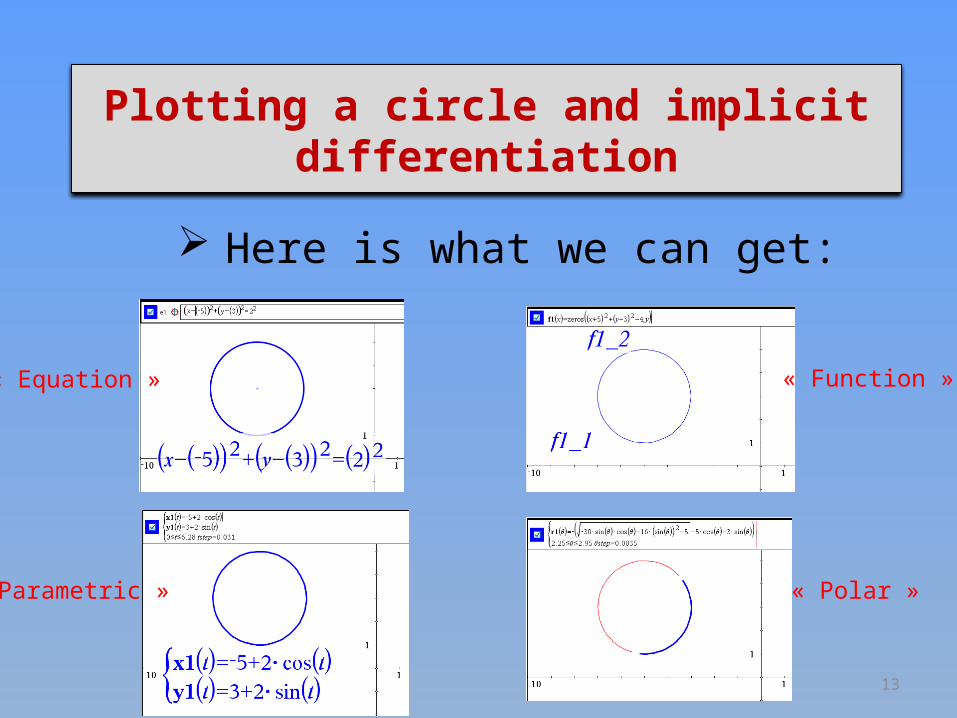
We can use the “equation” Graph/Entry Edit mode.• the graph is very nice and the editor helps
students to recall the equation of a circle.
Using function graphing (with “zeros”) is possible in this case.• This represents an opportunity for the teacher to
recall that many equations can’t be solved … so this is why we are asking TI to eventually implement a real 2D implicit plotter in Nspire!
12
Plotting a circle and implicit differentiation
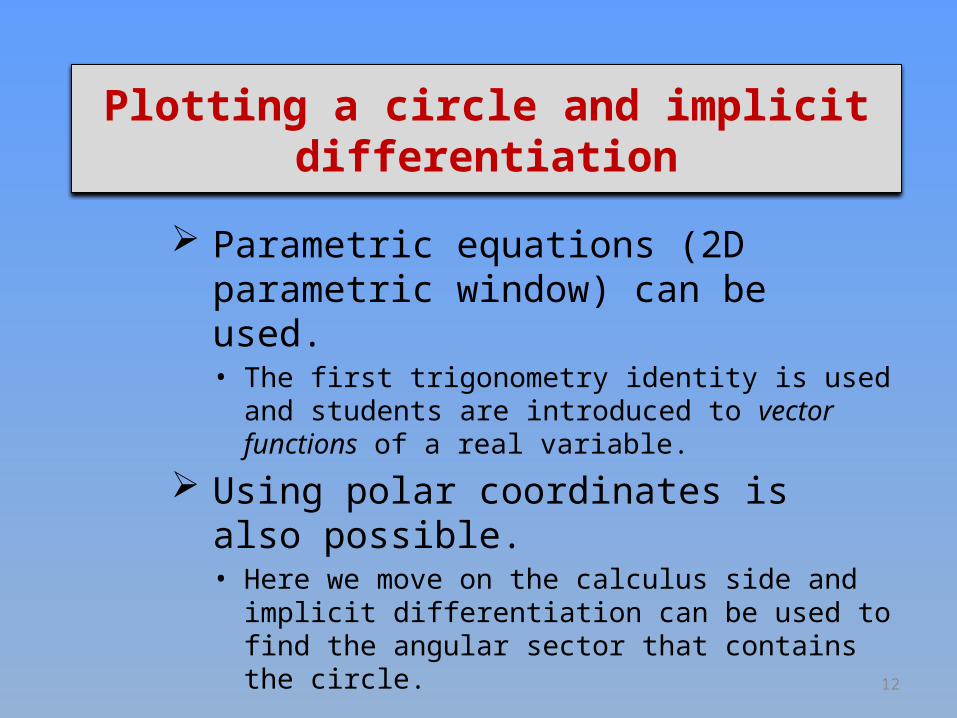
Parametric equations (2D parametric window) can be used.• The first trigonometry identity is used and
students are introduced to vector functions of a real variable.
Using polar coordinates is also possible.• Here we move on the calculus side and implicit
differentiation can be used to find the angular sector that contains the circle.
13
Plotting a circle and implicit differentiation
Here is what we can get:
« Equation » « Function »
« Parametric » « Polar »
14
Plotting a circle and implicit differentiation
Let’s perform this example on Nspire CAS.
15
Helping students with inverse functions
Many students starting their engineering program at ETS don’t have any idea (or have forgotten) what arcsin(x) means. In fact, functions as exp(x), ln(x), arctan(x) look strange for them…
An original approach to recall these functions can be done in Nspire CAS.
16
Helping students with inverse functions
This approach consists of using a 2D graph window in function mode:• We plot a given function f1(x) = f(x) where f is an
expression in the variable x. Then the label style is changed for y = f(x).
• In the same window, we insert the text x = f(y), drag this onto an axis and the graph appears!
• This is the inverse relation.
In some cases, students understand why the domain of f needs to be restricted in order to have the existence of an inverse function.
17
Helping students with inverse functions
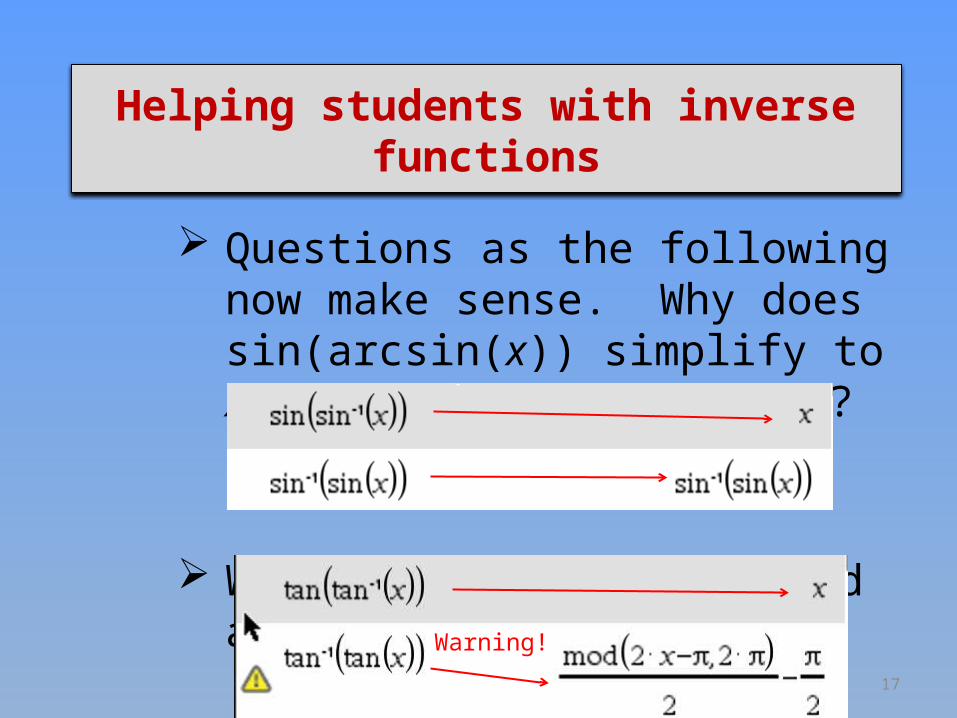
Questions as the following now make sense. Why does sin(arcsin(x)) simplify to x but not arcsin(sin(x))?
What happens with tan and arctan?
Warning!
18
Helping students with inverse functions
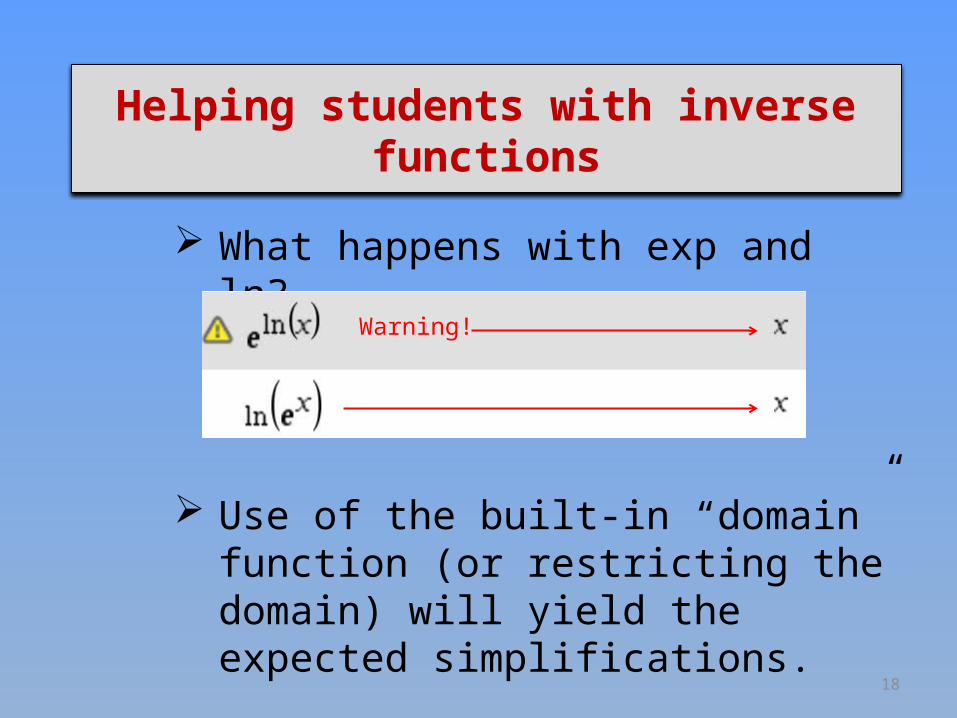
What happens with exp and ln?
Use of the built-in “domain” function (or restricting the domain) will yield the expected simplifications.
Warning!
19
Helping students with inverse functions
Let’s take a look at inverse functions with Nspire CAS.
20
A more complicated example
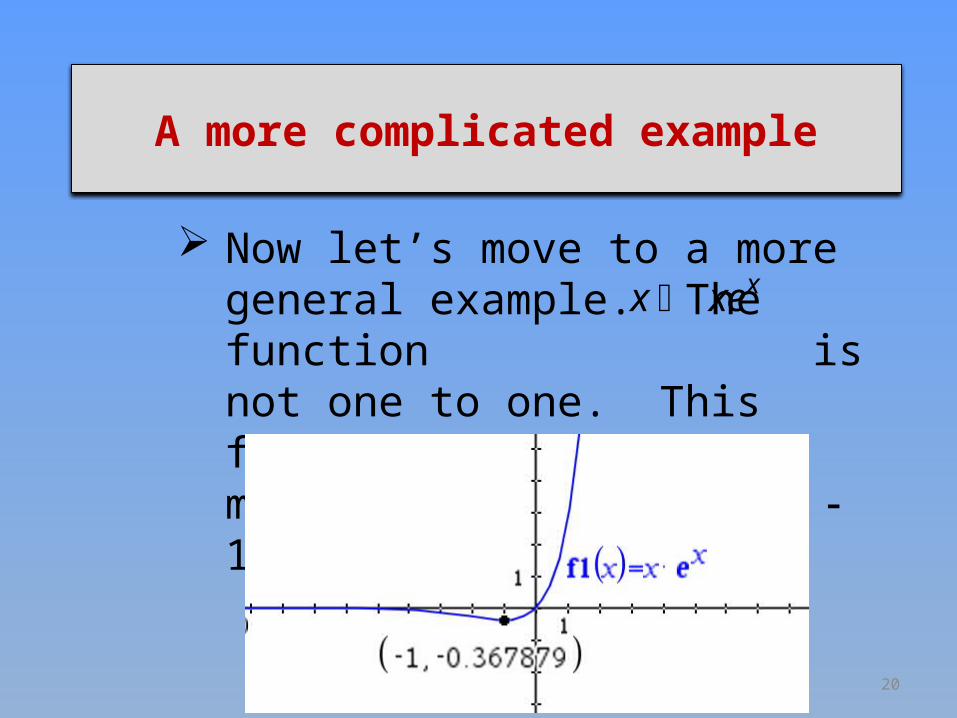
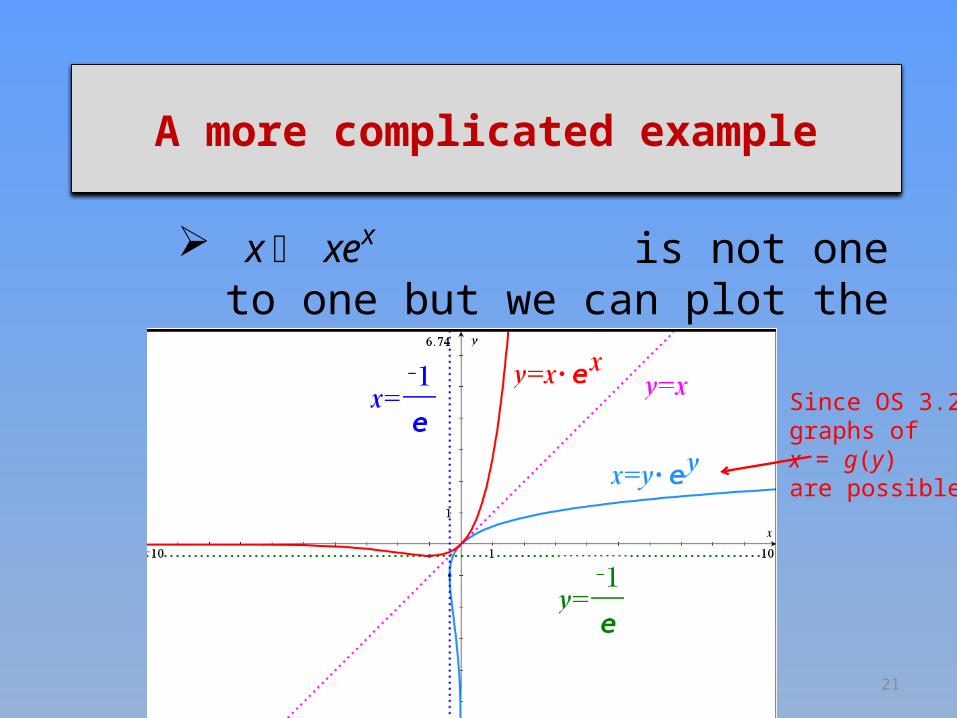
Now let’s move to a more general example. The function is not one to one. This function has a global minimum located at (-1, -1/e):
xx xe
21
A more complicated example
is not one to one but we can plot the inverse relation:
xx xe
Since OS 3.2, graphs of x = g(y) are possible.
22
A more complicated example
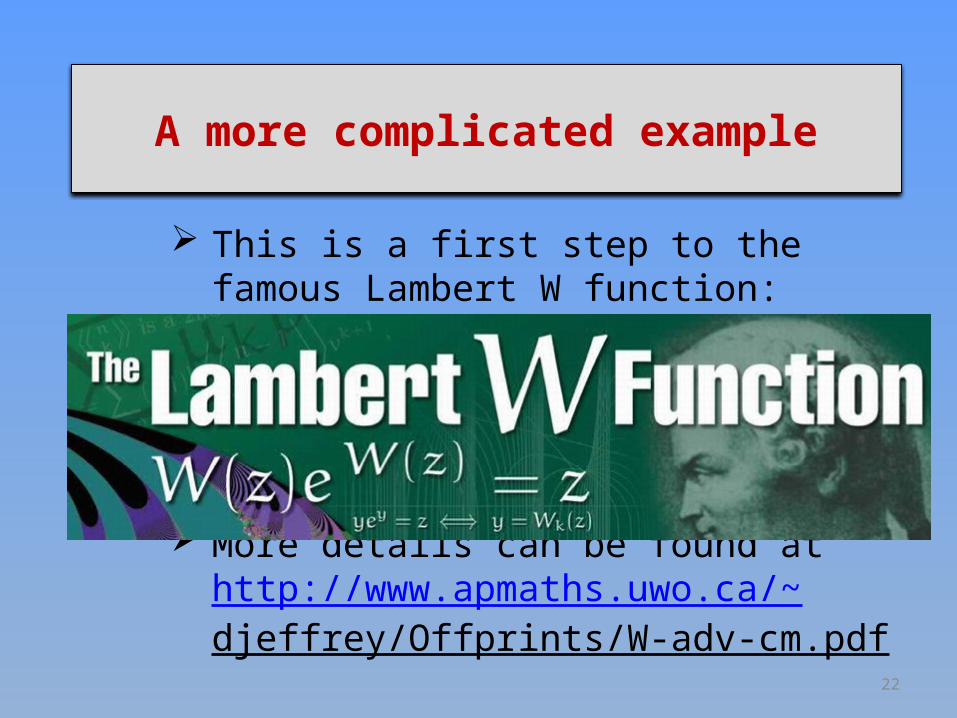
This is a first step to the famous Lambert W function:
More details can be found at http://www.apmaths.uwo.ca/~djeffrey/Offprints/W-adv-cm.pdf
23
A more complicated example
This is, in fact, a “multi-valued” function (having 2 real branches). And because the complex exponential function is periodic, there exists an infinite number of complex solutions (but only a finite number of real solutions).
Using some algebra, it is not difficult to show that an equation involving a power and an exponential can be solved by this function.
24
A more complicated example
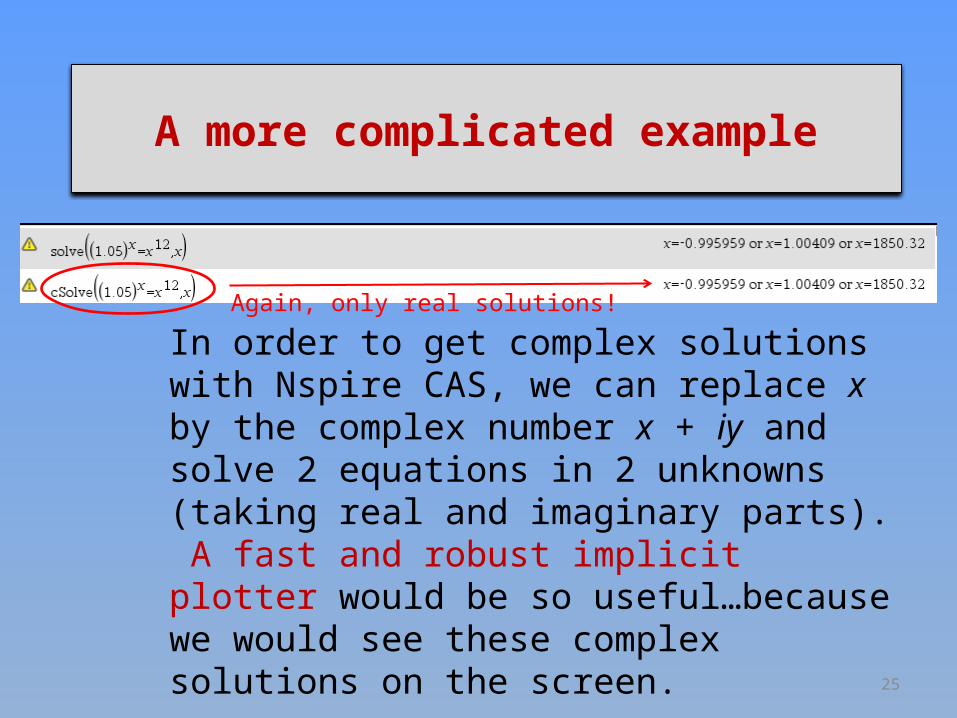
This special function is implemented in Maple and Mathematica. This is why these systems can find every real solution and some complex ones to an equation as .
The fast processor of Nspire CAS rapidly yields the 3 real solutions … but no complex ones.
121.05x x
25
A more complicated example
In order to get complex solutions with Nspire CAS, we can replace x by the complex number x + iy and solve 2 equations in 2 unknowns (taking real and imaginary parts). A fast and robust implicit plotter would be so useful…because we would see these complex solutions on the screen.
Again, only real solutions!
26
A more complicated example
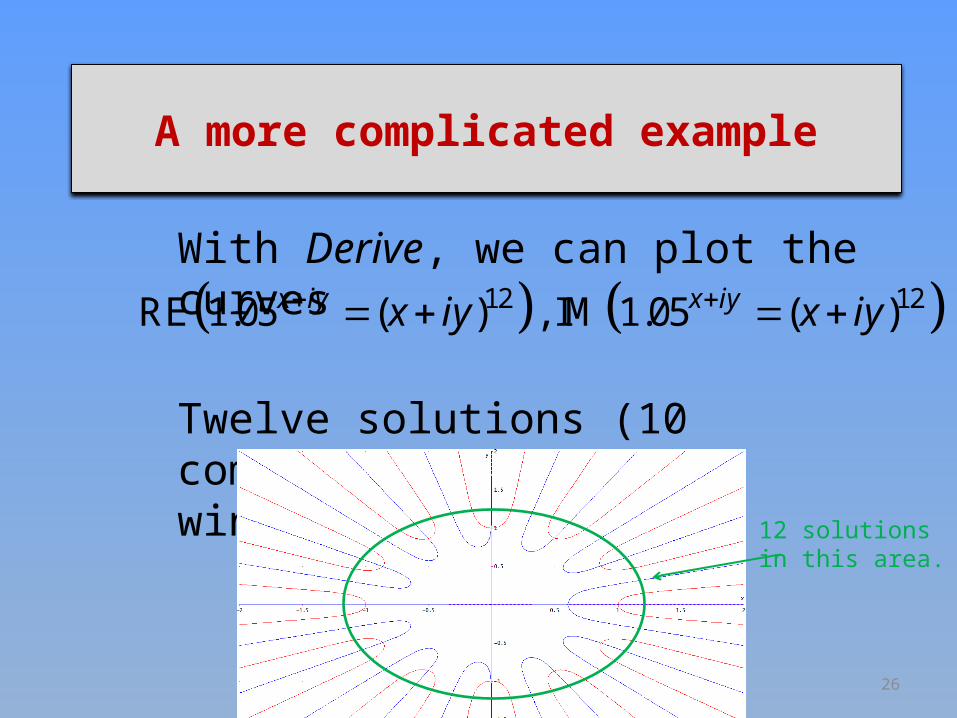
With Derive, we can plot the curves
Twelve solutions (10 complex) appear in the window -2 < x, y < 2:
12 12RE 1.05 ( ) , IM 1.05 ( )x iy x iyx iy x iy
12 solutions in this area.
27
A more complicated example
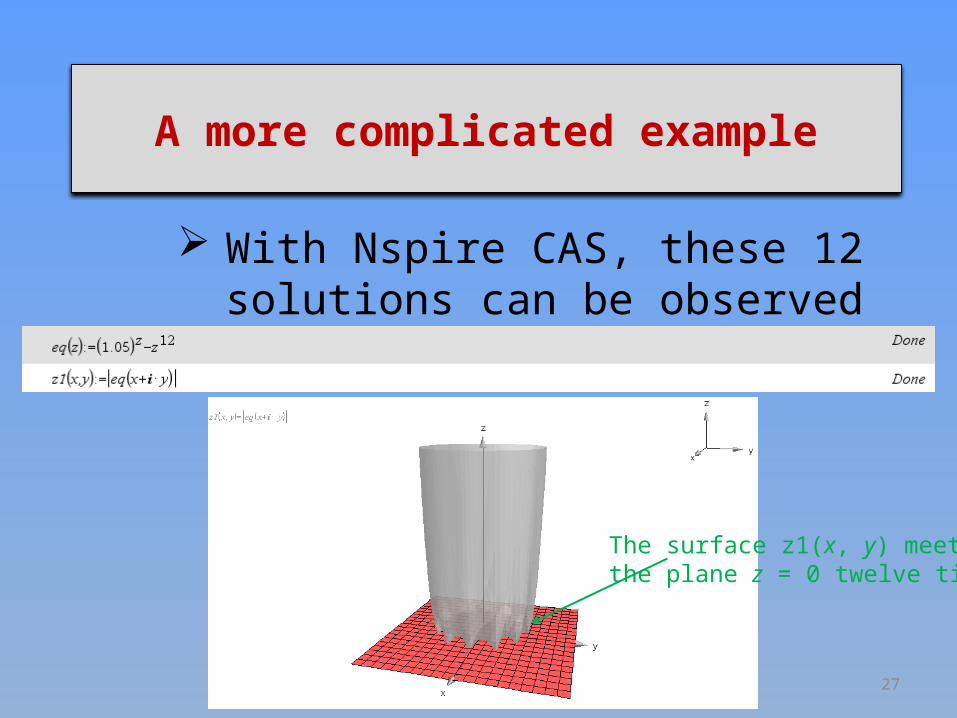
With Nspire CAS, these 12 solutions can be observed if one uses a 3D plot:
The surface z1(x, y) meetsthe plane z = 0 twelve times.
28
Intersection of 2 parametric curves
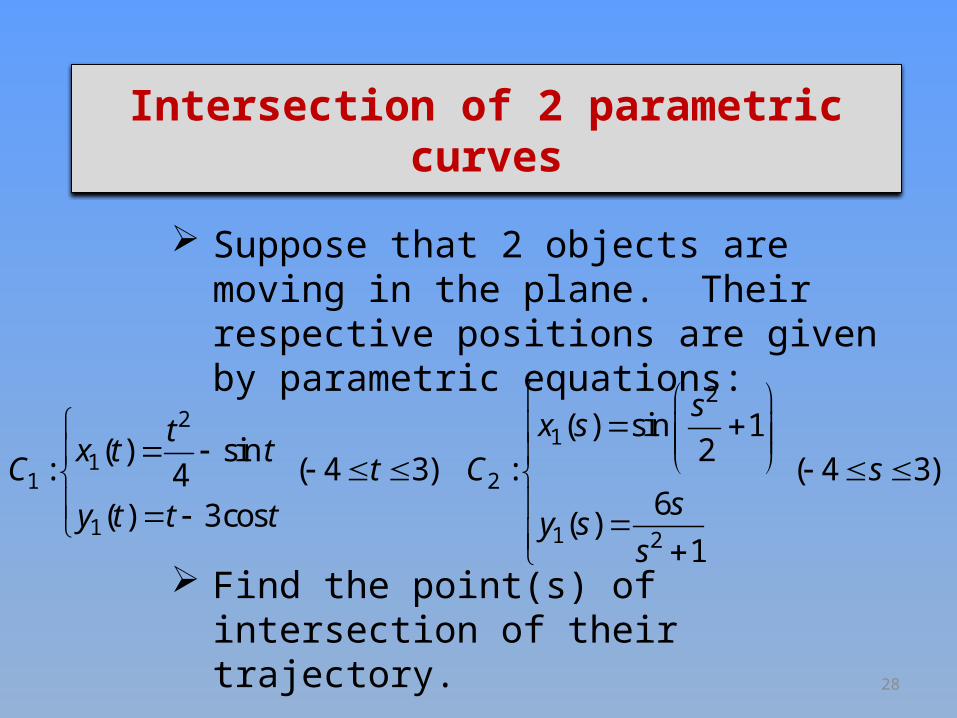
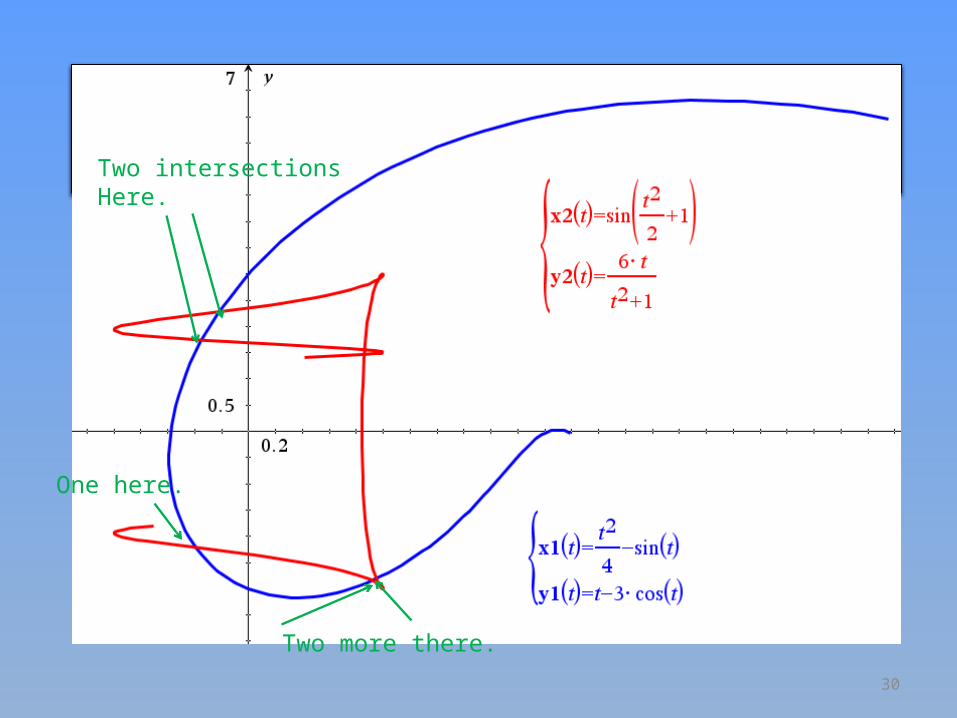
Suppose that 2 objects are moving in the plane. Their respective positions are given by parametric equations:
Find the point(s) of intersection of their trajectory.
22
11
1 2
1 1 2
( ) sin 12( ) sin
: ( 4 3) : ( 4 3)46( ) 3cos ( )
1
sx st
x t tC t C s
sy t t t y ss
29
Intersection of 2 parametric curves
We can plot both curves in the same window … but the “intersection” tool is not available in parametric mode!
We will show that a good use of the “solve” command (with initial guess provided by the “graph trace” tool) will be useful to find the coordinates of the point(s) of intersection.
30
Intersection of 2 parametric curvesTwo intersectionsHere.
Two more there.
One here.
31
Intersection of 2 parametric curves
We need to pay attention when we try to find the point(s) of intersection of 2 parametric curves.
The trajectories can cross at a given point, but not necessarily at the same time.
Moreover, in our example, the system that needs to be solved is not linear, neither polynomial.
32
Intersection of 2 parametric curves
Let’s see how to find these 5 points of intersection in Nspire CAS.
33
From piecewise to indicator functions
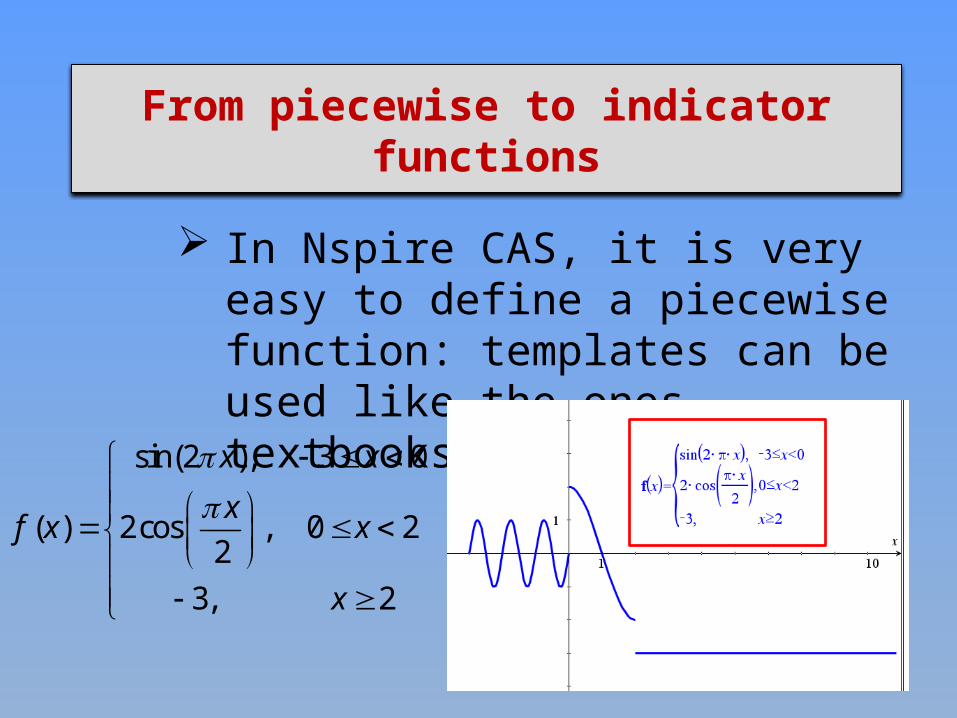
In Nspire CAS, it is very easy to define a piecewise function: templates can be used like the ones textbooks contain!
sin(2 ), 3 0
( ) 2cos , 0 22
3, 2
x x
xf x x
x
34
From piecewise to indicator functions
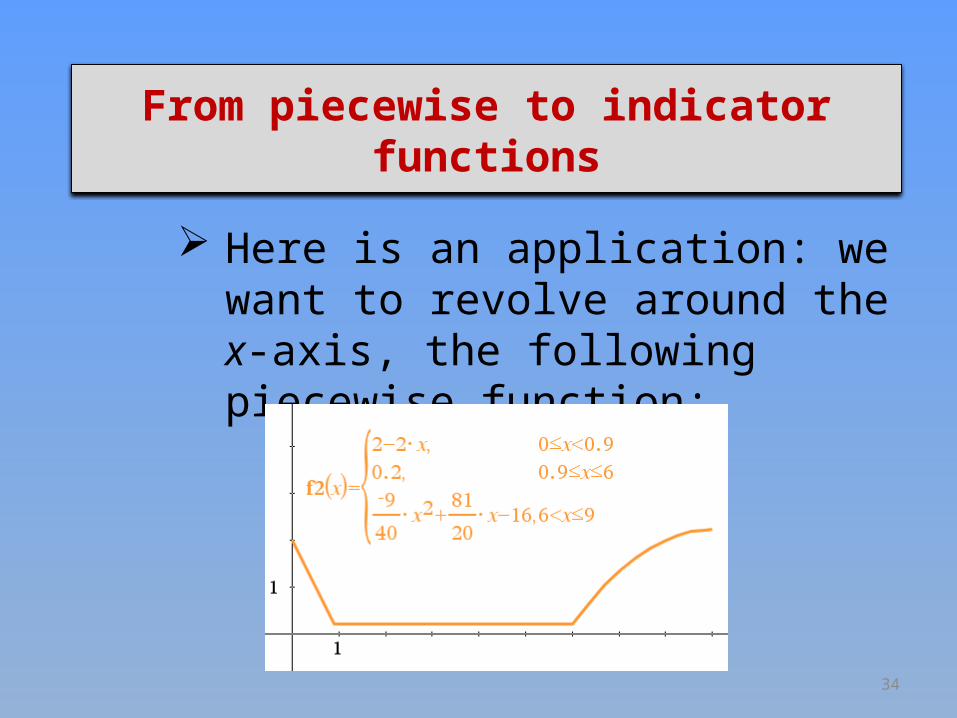
Here is an application: we want to revolve around the x-axis, the following piecewise function:
35
From piecewise to indicator functions
Doing so, a solid of revolution will be generated.
In calculus I (single variable), only 2D graphs are considered but, as an application of the definite integral, we often want to show students the 3D representation of the solid.
36
From piecewise to indicator functions
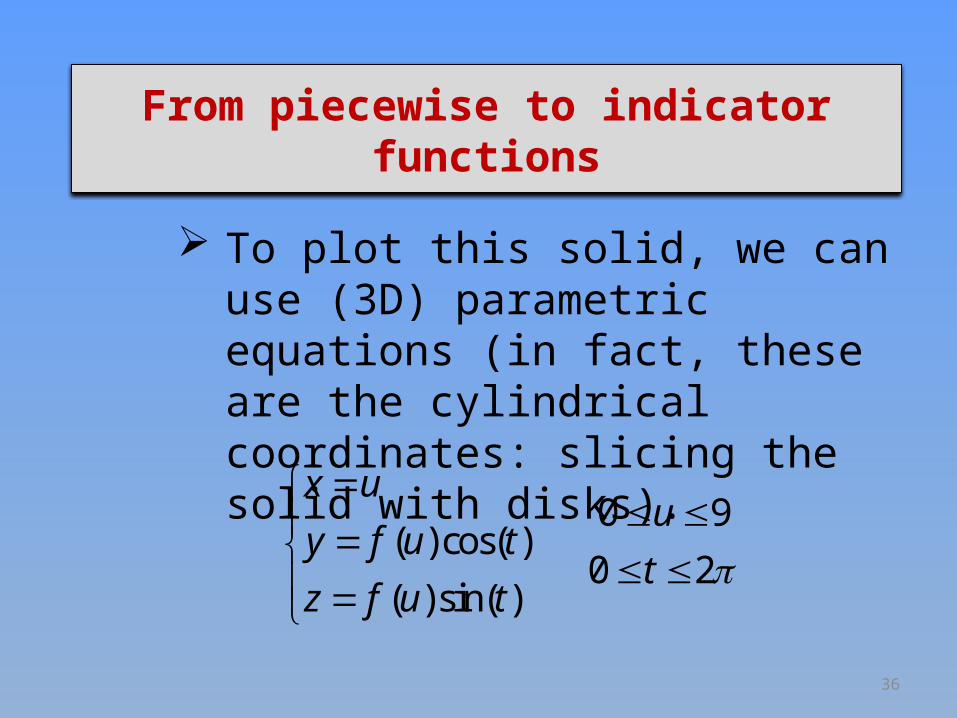
To plot this solid, we can use (3D) parametric equations (in fact, these are the cylindrical coordinates: slicing the solid with disks).
0 9( )cos( )
0 2( )sin( )
x uu
y f u tt
z f u t
37
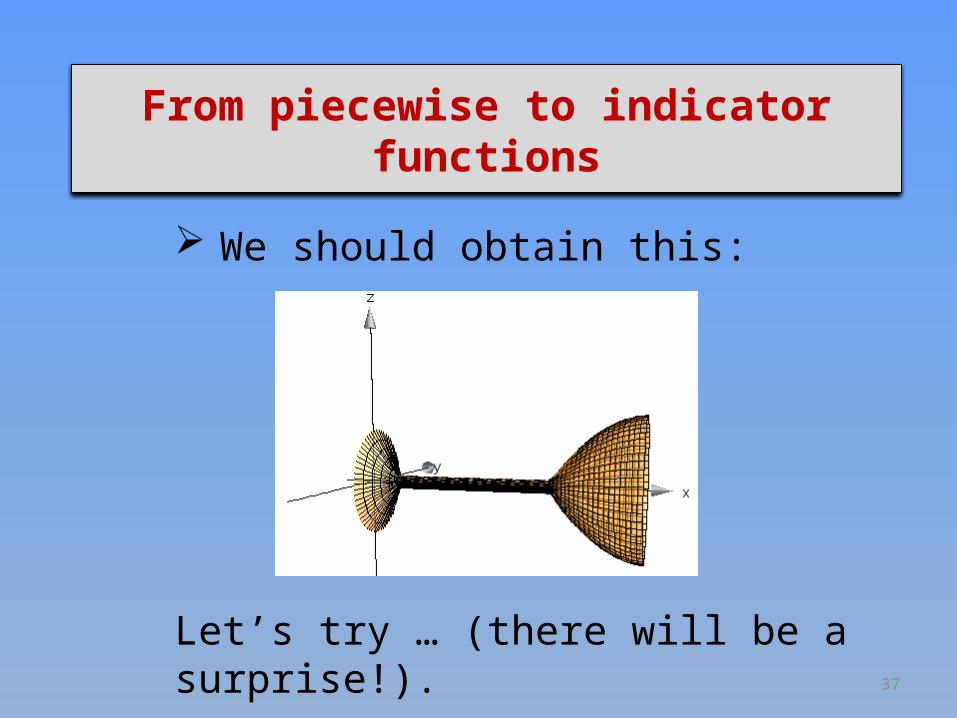
From piecewise to indicator functions
We should obtain this:
Let’s try … (there will be a surprise!).
38
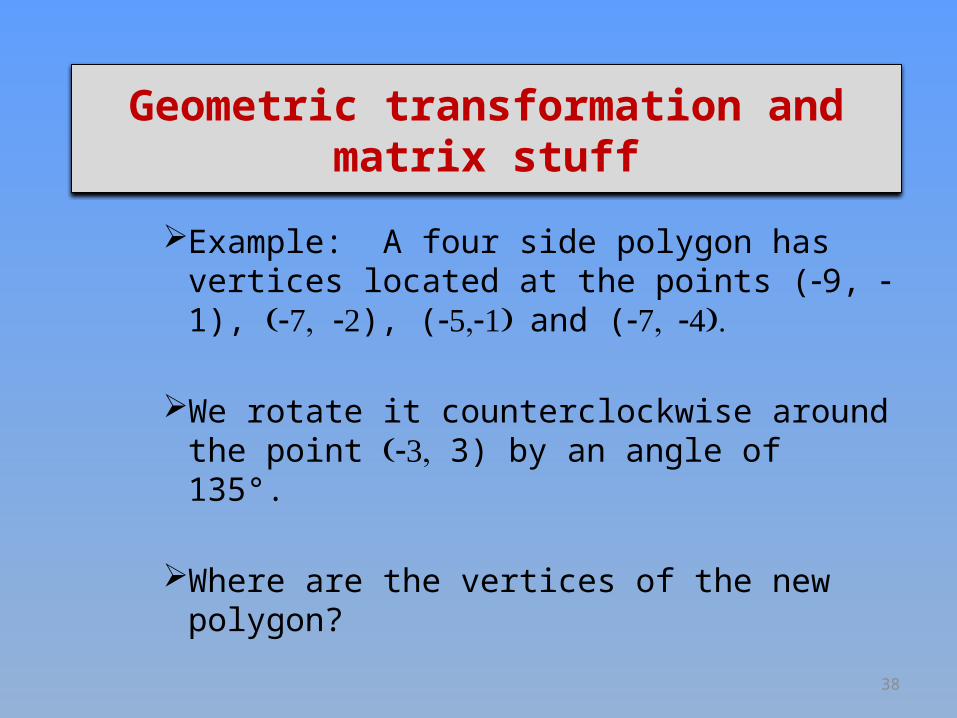
Geometric transformation and matrix stuff
Example: A four side polygon has vertices located at the points (-9, -1), (-7, -2), (-5,-1) and (-7, -4).
We rotate it counterclockwise around the point (-3, 3) by an angle of 135°.
Where are the vertices of the new polygon?
39
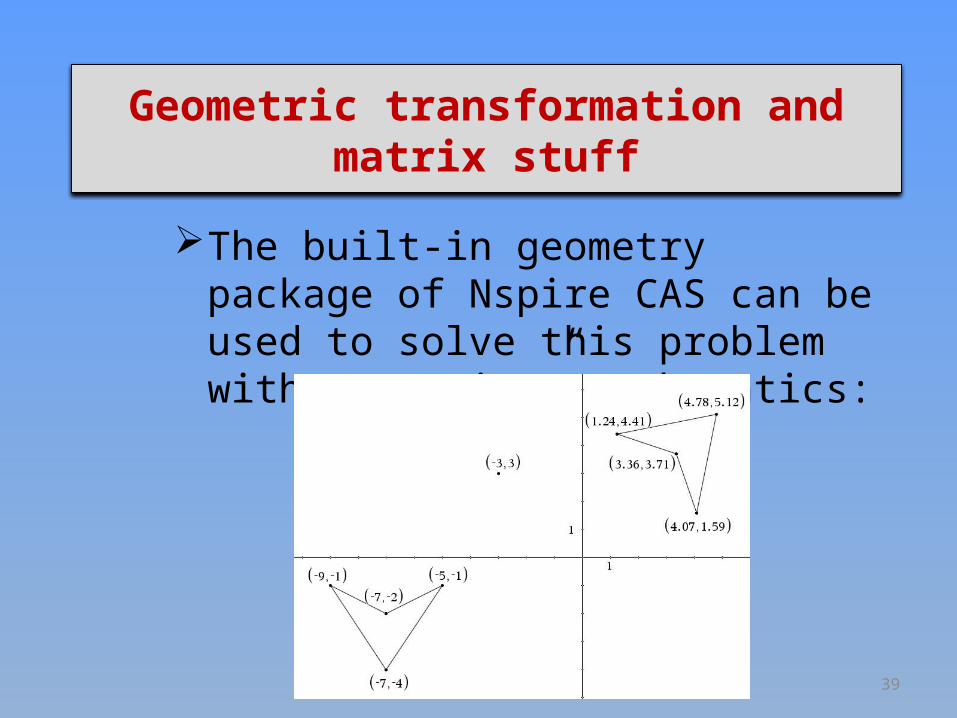
Geometric transformation and matrix stuff
The built-in geometry package of Nspire CAS can be used to solve this problem without “using” mathematics:
40
Geometric transformation and matrix stuff
In fact, TI-Nspire CAS can be used to find the answer in exact mode. Namely by using matrix stuff.
Rotation (in 2D) is usually defined about the origin. So we first need to translate our polygon from the vector [3, -3]; then perform the rotation. Finally, translate by the vector [-3, 3].
So 3 matrices must be defined. But a “translation” is not a linear transformation!
41
Geometric transformation and matrix stuff
Homogeneous coordinates are what we will be
using.Let’s conclude this talk by
performing this example.

42
Thank You!