Embed Size (px)
Citation preview
FFSC 2012 Conference -- 1
Using the Standards with Producers and Lenders toAnalyze OperationsTodd DoehringCentrec Consulting Group, LLC
FFSC 2012 Conference -- 2
Agenda
Background Producers
Census data Decision support activities (budgeting/planning) Financial analysis/Ratios Du Pont Financial Analysis Model
Lenders Types of analysis Earned net worth change Du Pont Financial Analysis Model Acceptance of guidelines Departures from guidelines
FFSC 2012 Conference -- 3
Background
Develop and deliver both self-study and online training materials for ag lenders in the areas of financial and credit analysis, risk, loan structuring.
Develop spreading software for analyzing the financial performance ag producers and supporting our training efforts.
Provide management consulting (decision support services) for our ag production clients.
Use both Managerial and Financial Guidelines.
FFSC 2012 Conference -- 4
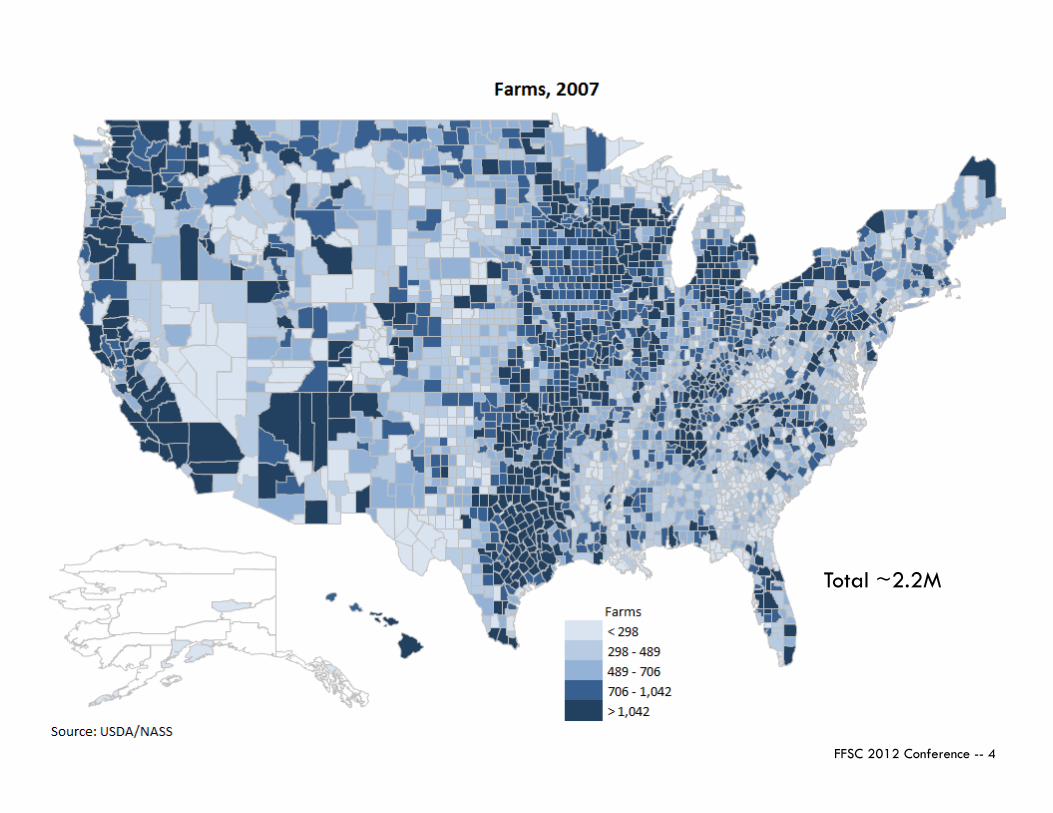
Total ~2.2M
FFSC 2012 Conference -- 5
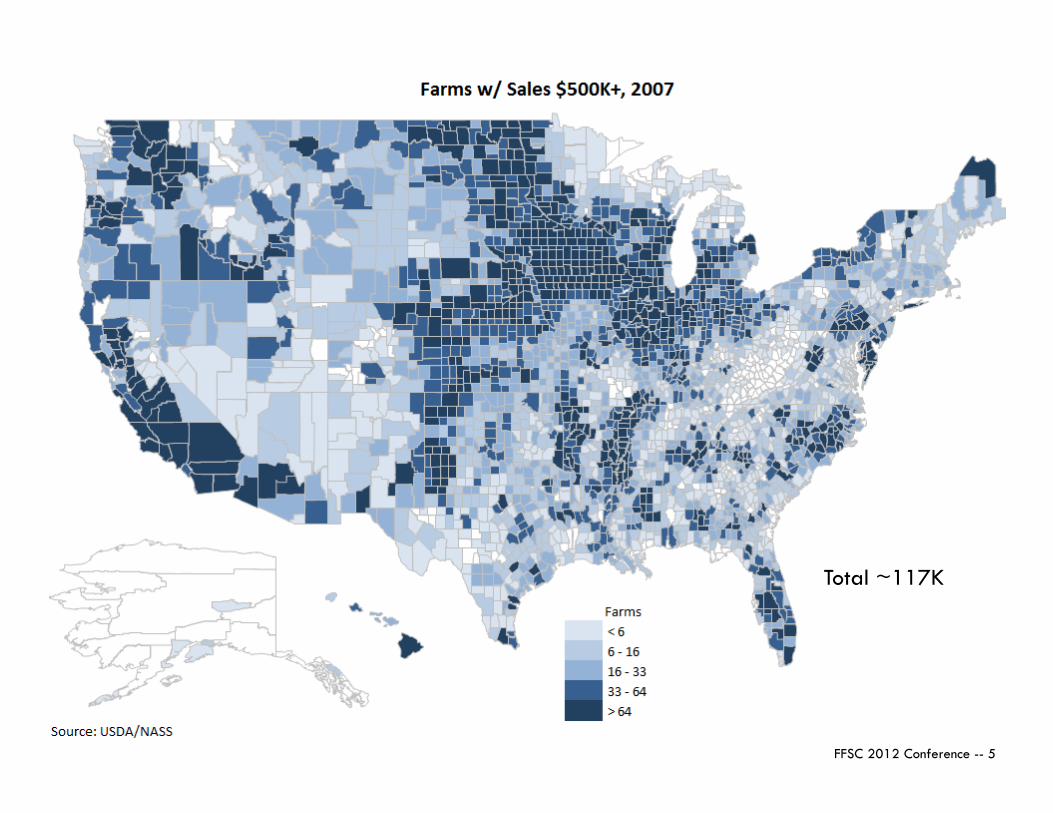
Total ~117K

FFSC 2012 Conference -- 6
Total ~$300B
FFSC 2012 Conference -- 7
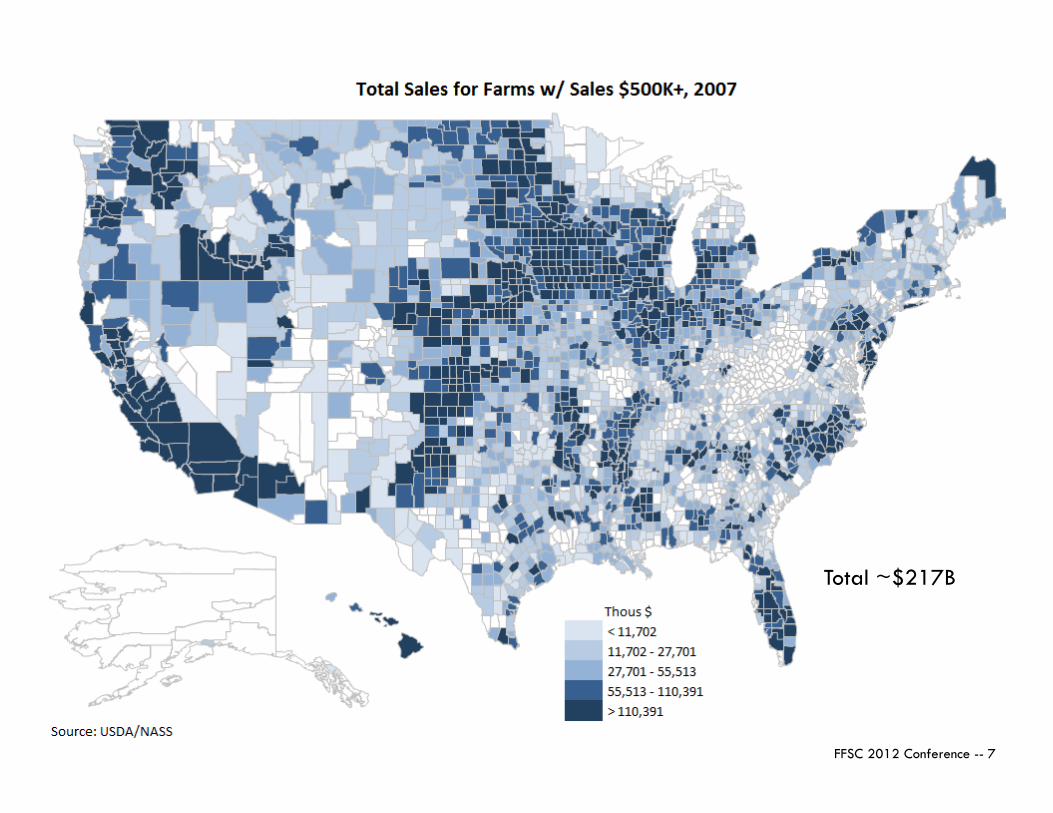
Total ~$217B
FFSC 2012 Conference -- 8
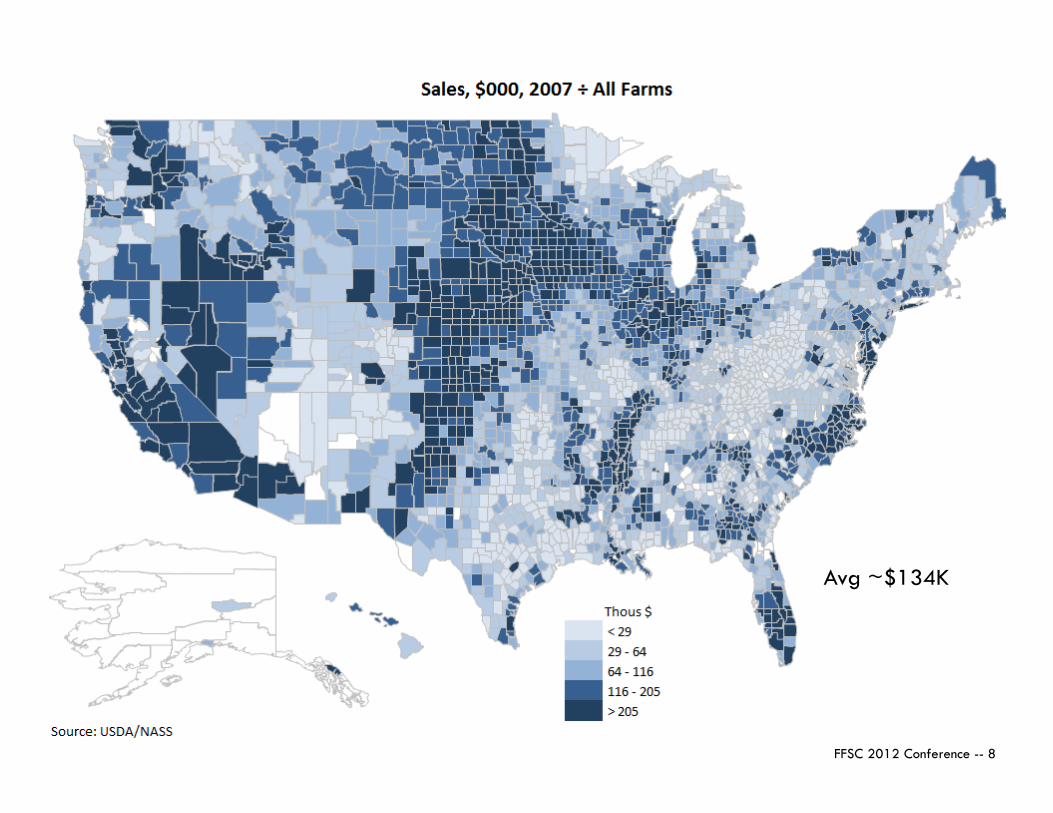
Avg ~$134K
FFSC 2012 Conference -- 9
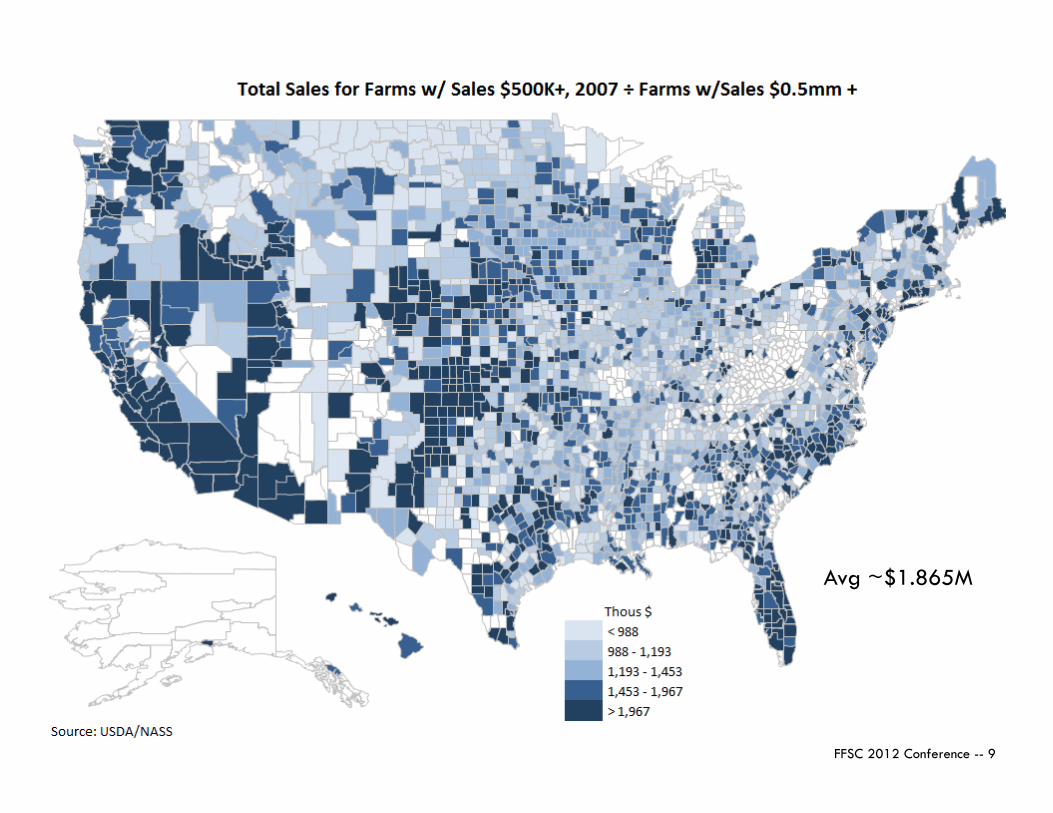
Avg ~$1.865M

FFSC 2012 Conference -- 10
Working with Producers
FFSC Financial/Managerial Guidelines
FFSC 2012 Conference -- 11
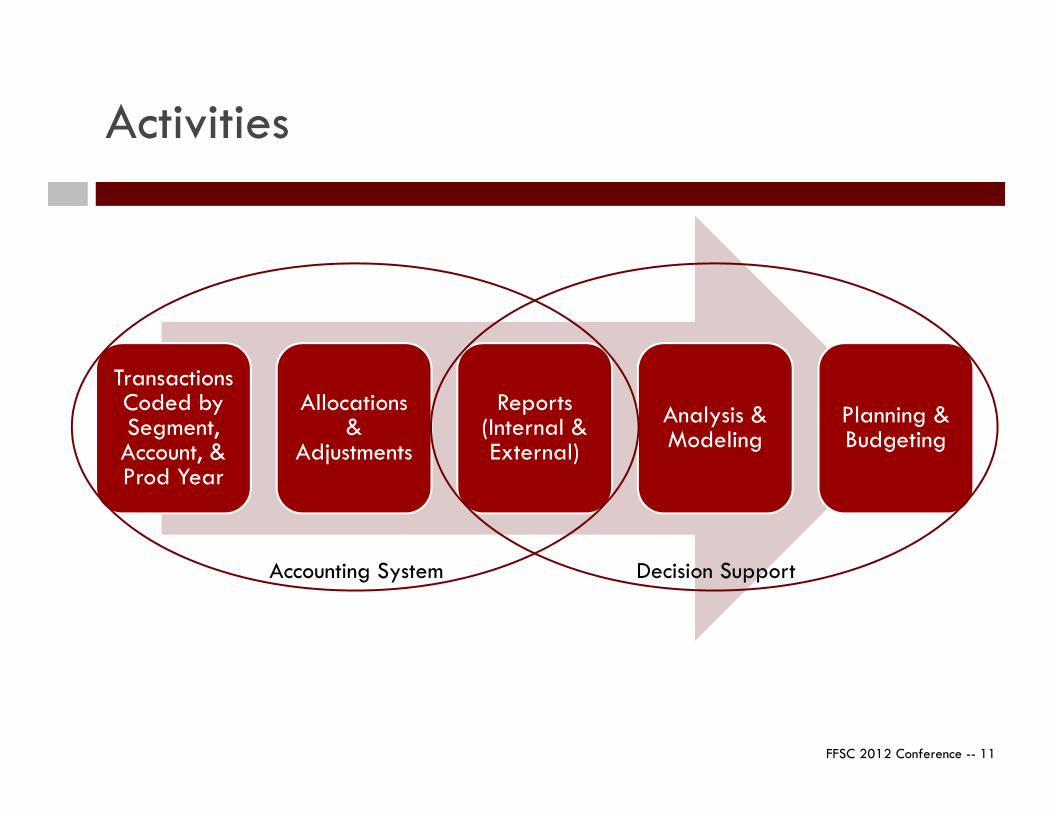
Activities
Transactions Coded by Segment, Account, &Prod Year
Allocations &
Adjustments
Reports (Internal & External)
Analysis & Modeling
Planning & Budgeting
Accounting System Decision Support
FFSC 2012 Conference -- 12
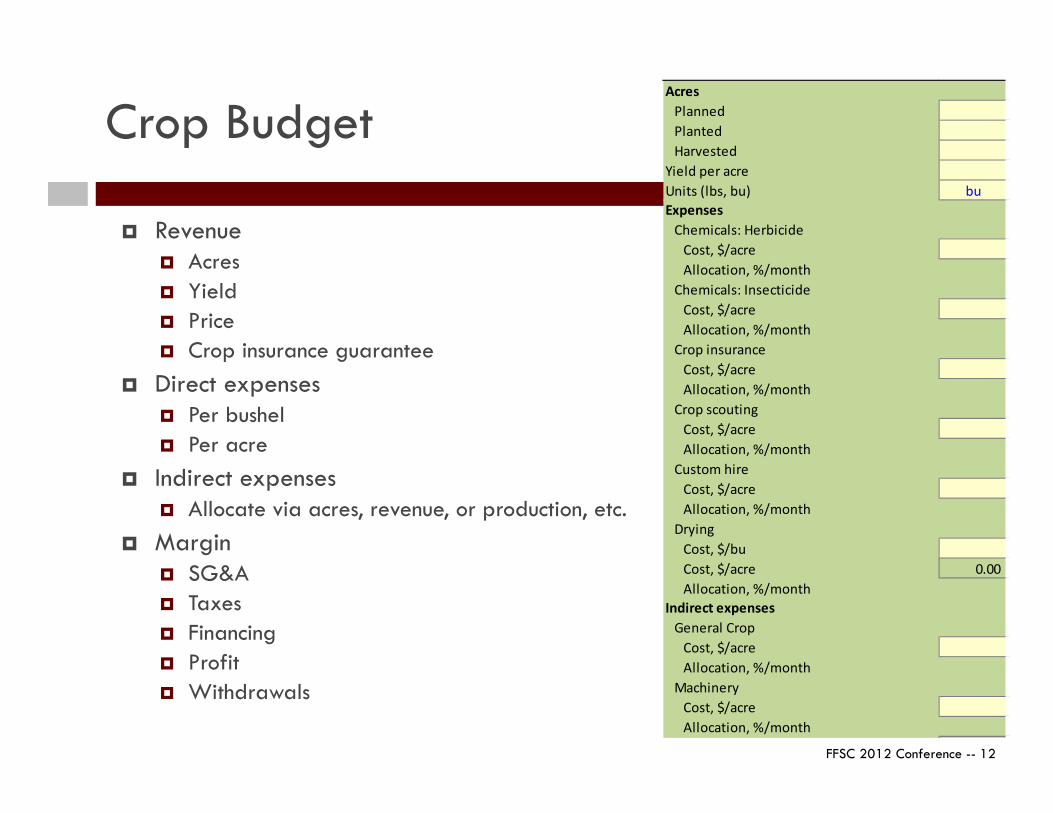
Crop Budget
Revenue Acres Yield Price Crop insurance guarantee
Direct expenses Per bushel Per acre
Indirect expenses Allocate via acres, revenue, or production, etc.
Margin SG&A Taxes Financing Profit Withdrawals
ExpensesChemicals: Herbicide
Cost, $/acreAllocation, %/month
Chemicals: InsecticideCost, $/acreAllocation, %/month
Crop insuranceCost, $/acreAllocation, %/month
Crop scoutingCost, $/acreAllocation, %/month
Custom hireCost, $/acreAllocation, %/month
DryingCost, $/buCost, $/acre 0.00Allocation, %/month
AcresPlannedPlantedHarvested
Yield per acreUnits (lbs, bu) bu
Indirect expensesGeneral Crop
Cost, $/acreAllocation, %/month
MachineryCost, $/acreAllocation, %/month
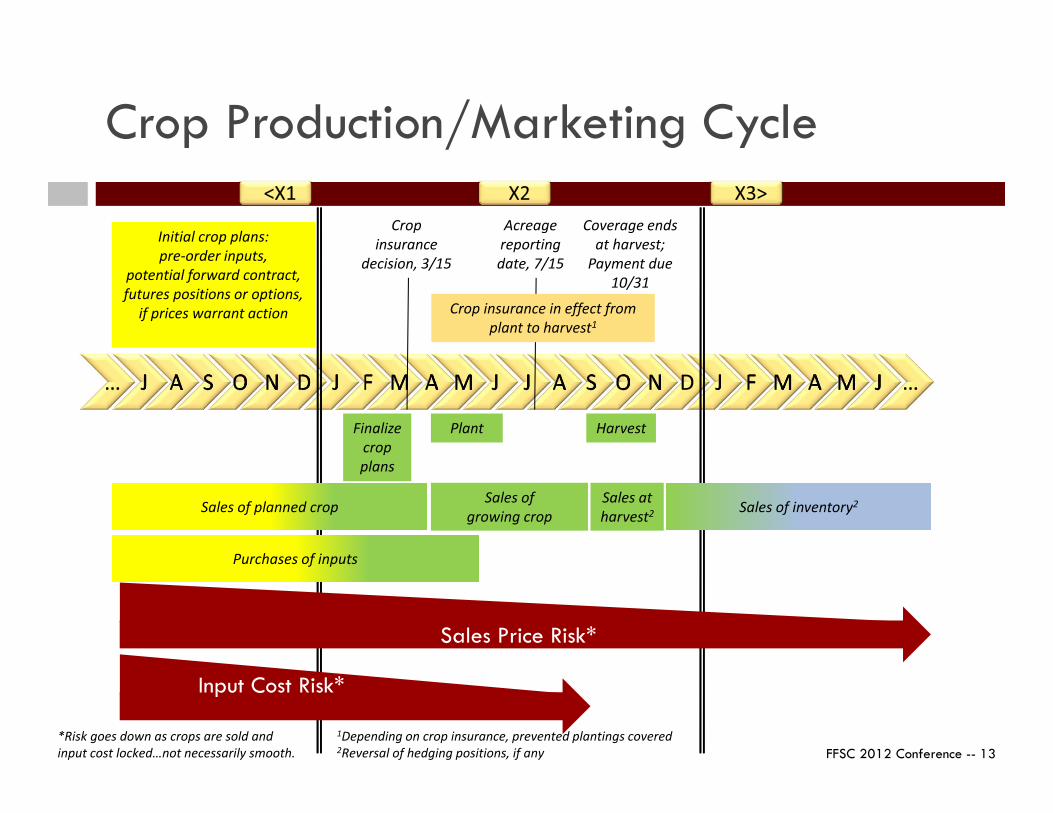
FFSC 2012 Conference -- 13
Cropinsurance
decision, 3/15
Acreagereportingdate, 7/15
PlantFinalizecropplans
Harvest
Coverage ends at harvest;
Payment due 10/31
Initial crop plans:pre-order inputs,
potential forward contract,futures positions or options,
if prices warrant action
Crop Production/Marketing Cycle
Sales of inventory2
Crop insurance in effect from plant to harvest1
1Depending on crop insurance, prevented plantings covered
Sales of planned crop Sales ofgrowing crop
Sales atharvest2
2Reversal of hedging positions, if any
Purchases of inputs
Input Cost Risk*
Sales Price Risk*
*Risk goes down as crops are sold and input cost locked…not necessarily smooth.
FFSC 2012 Conference -- 14
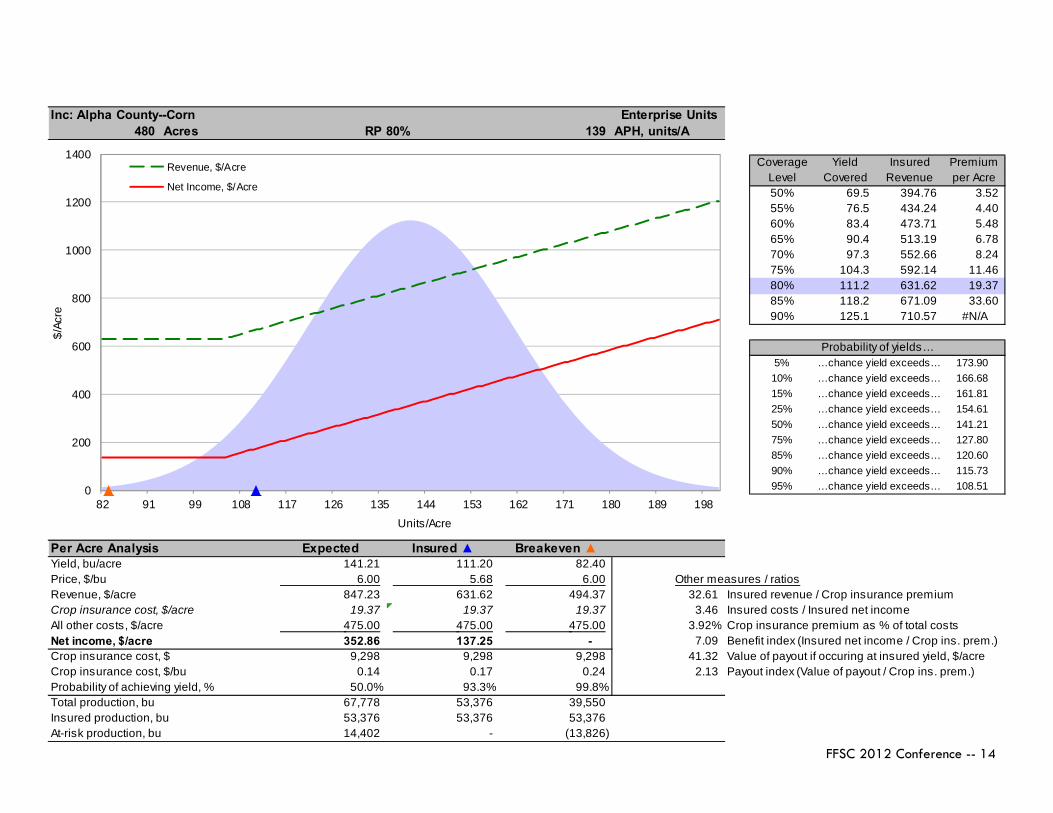
Inc: Alpha County--Corn Enterprise Units480 Acres RP 80% 139 APH, units/A
Coverage Yield Insured PremiumLevel Covered Revenue per Acre50% 69.5 394.76 3.52 55% 76.5 434.24 4.40 60% 83.4 473.71 5.48 65% 90.4 513.19 6.78 70% 97.3 552.66 8.24 75% 104.3 592.14 11.46 80% 111.2 631.62 19.37 85% 118.2 671.09 33.60 90% 125.1 710.57 #N/A
Probability of yields…5% …chance yield exceeds… 173.9010% …chance yield exceeds… 166.6815% …chance yield exceeds… 161.8125% …chance yield exceeds… 154.6150% …chance yield exceeds… 141.2175% …chance yield exceeds… 127.8085% …chance yield exceeds… 120.6090% …chance yield exceeds… 115.7395% …chance yield exceeds… 108.51
Per Acre Analysis Expected Insured ▲ Breakeven ▲Yield, bu/acre 141.21 111.20 82.40 Price, $/bu 6.00 5.68 6.00 Other measures / ratiosRevenue, $/acre 847.23 631.62 494.37 32.61 Insured revenue / Crop insurance premiumCrop insurance cost, $/acre 19.37 19.37 19.37 3.46 Insured costs / Insured net incomeAll other costs, $/acre 475.00 475.00 475.00 3.92% Crop insurance premium as % of total costsNet income, $/acre 352.86 137.25 - 7.09 Benefit index (Insured net income / Crop ins. prem.)Crop insurance cost, $ 9,298 9,298 9,298 41.32 Value of payout if occuring at insured yield, $/acreCrop insurance cost, $/bu 0.14 0.17 0.24 2.13 Payout index (Value of payout / Crop ins. prem.)Probability of achieving yield, % 50.0% 93.3% 99.8%Total production, bu 67,778 53,376 39,550 Insured production, bu 53,376 53,376 53,376 At-risk production, bu 14,402 - (13,826)
0
200
400
600
800
1000
1200
1400
82 91 99 108 117 126 135 144 153 162 171 180 189 198
$/Ac
re
Units/Acre
Revenue, $/Acre
Net Income, $/Acre
FFSC 2012 Conference -- 15
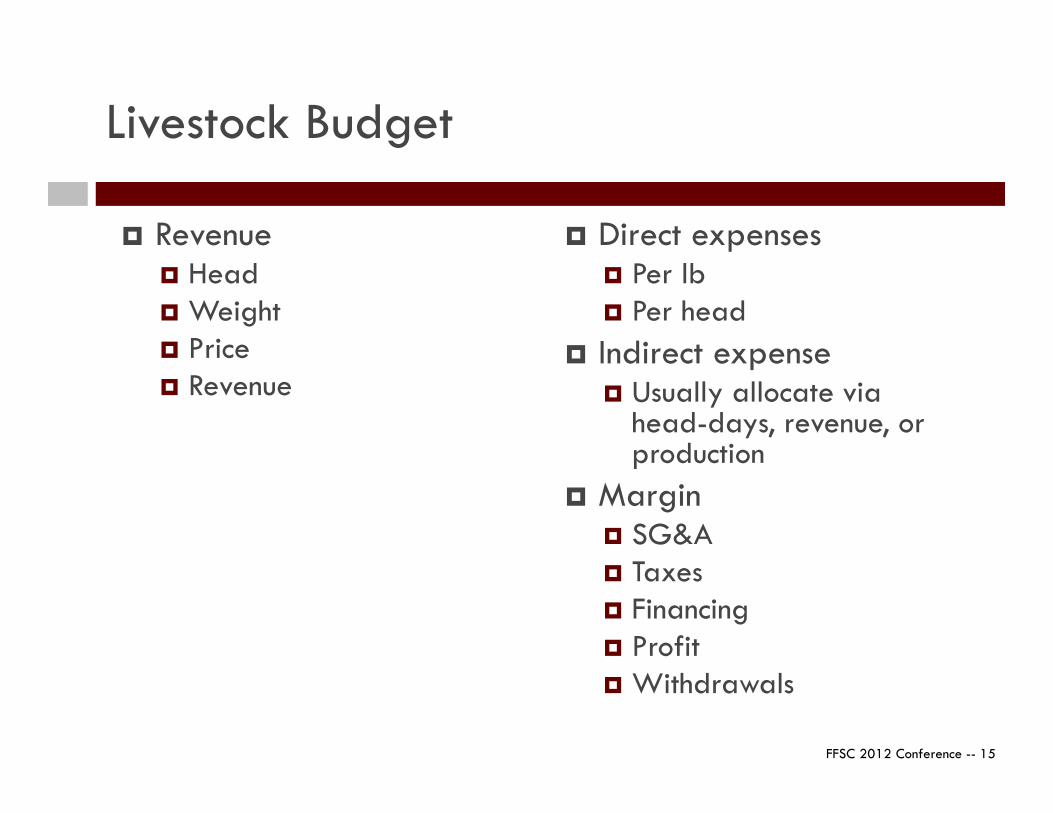
Livestock Budget
Revenue Head Weight Price Revenue
Direct expenses Per lb Per head
Indirect expense Usually allocate via
head-days, revenue, or production
Margin SG&A Taxes Financing Profit Withdrawals

FFSC 2012 Conference -- 16
Livestock Production/Marketing Cycle
Livestock Pricing Opportunities
Livestock Expenses
Livestock Sales
Feed Pricing Options
Feed Cost Risk
Sales Price Risk
Other Input Cost Risk
FFSC 2012 Conference -- 17
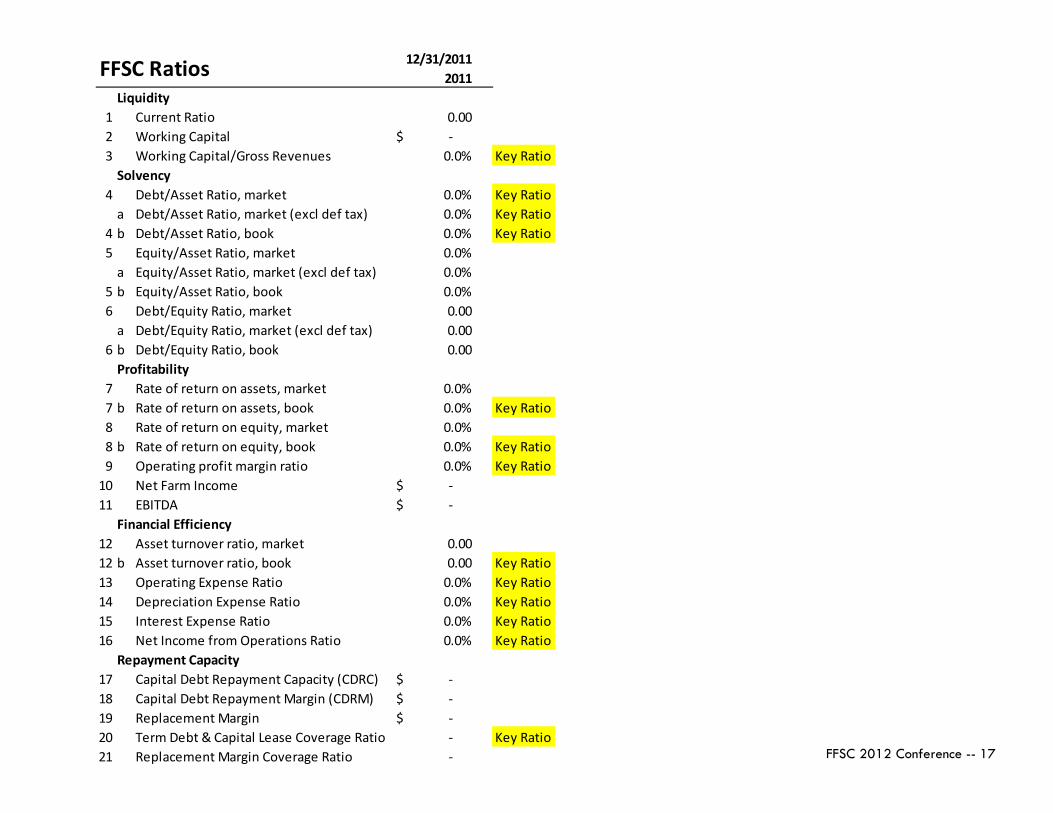
12/31/20112011
Liquidity1 Current Ratio 0.002 Working Capital -$ 3 Working Capital/Gross Revenues 0.0% Key Ratio
Solvency4 Debt/Asset Ratio, market 0.0% Key Ratio
a Debt/Asset Ratio, market (excl def tax) 0.0% Key Ratio4 b Debt/Asset Ratio, book 0.0% Key Ratio5 Equity/Asset Ratio, market 0.0%
a Equity/Asset Ratio, market (excl def tax) 0.0%5 b Equity/Asset Ratio, book 0.0%6 Debt/Equity Ratio, market 0.00
a Debt/Equity Ratio, market (excl def tax) 0.006 b Debt/Equity Ratio, book 0.00
Profitability7 Rate of return on assets, market 0.0%7 b Rate of return on assets, book 0.0% Key Ratio8 Rate of return on equity, market 0.0%8 b Rate of return on equity, book 0.0% Key Ratio9 Operating profit margin ratio 0.0% Key Ratio
10 Net Farm Income -$ 11 EBITDA -$
Financial Efficiency12 Asset turnover ratio, market 0.0012 b Asset turnover ratio, book 0.00 Key Ratio13 Operating Expense Ratio 0.0% Key Ratio14 Depreciation Expense Ratio 0.0% Key Ratio15 Interest Expense Ratio 0.0% Key Ratio16 Net Income from Operations Ratio 0.0% Key Ratio
Repayment Capacity17 Capital Debt Repayment Capacity (CDRC) -$ 18 Capital Debt Repayment Margin (CDRM) -$ 19 Replacement Margin -$ 20 Term Debt & Capital Lease Coverage Ratio - Key Ratio21 Replacement Margin Coverage Ratio -
FFSC Ratios
FFSC 2012 Conference -- 18
Du Pont Financial Analysis
FFSC Profitability/Efficiency Ratios
FFSC 2012 Conference -- 19
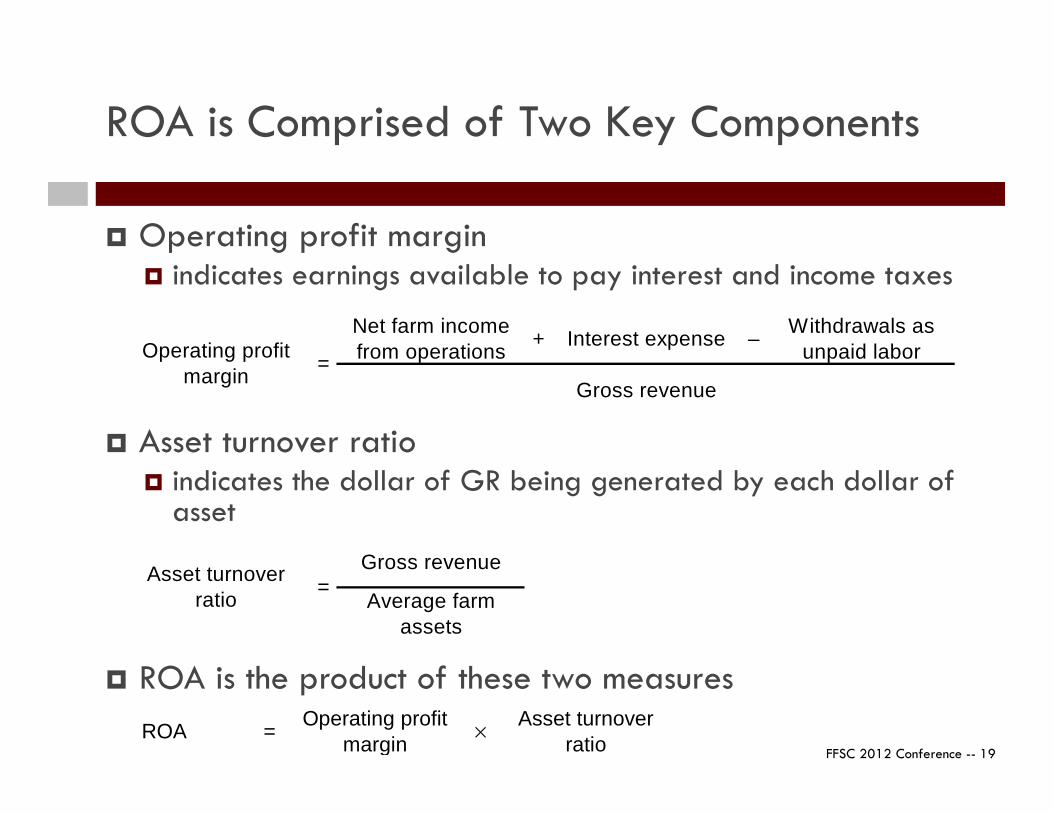
ROA is Comprised of Two Key Components
Operating profit margin indicates earnings available to pay interest and income taxes
Asset turnover ratio indicates the dollar of GR being generated by each dollar of
asset
ROA is the product of these two measures
Net farm income from operations + Interest expense – Withdrawals as
unpaid labor
Gross revenue=Operating profit
margin
Gross revenue
Average farm assets
=Asset turnoverratio
ROA = Operating profit margin × Asset turnover
ratio
FFSC 2012 Conference -- 20
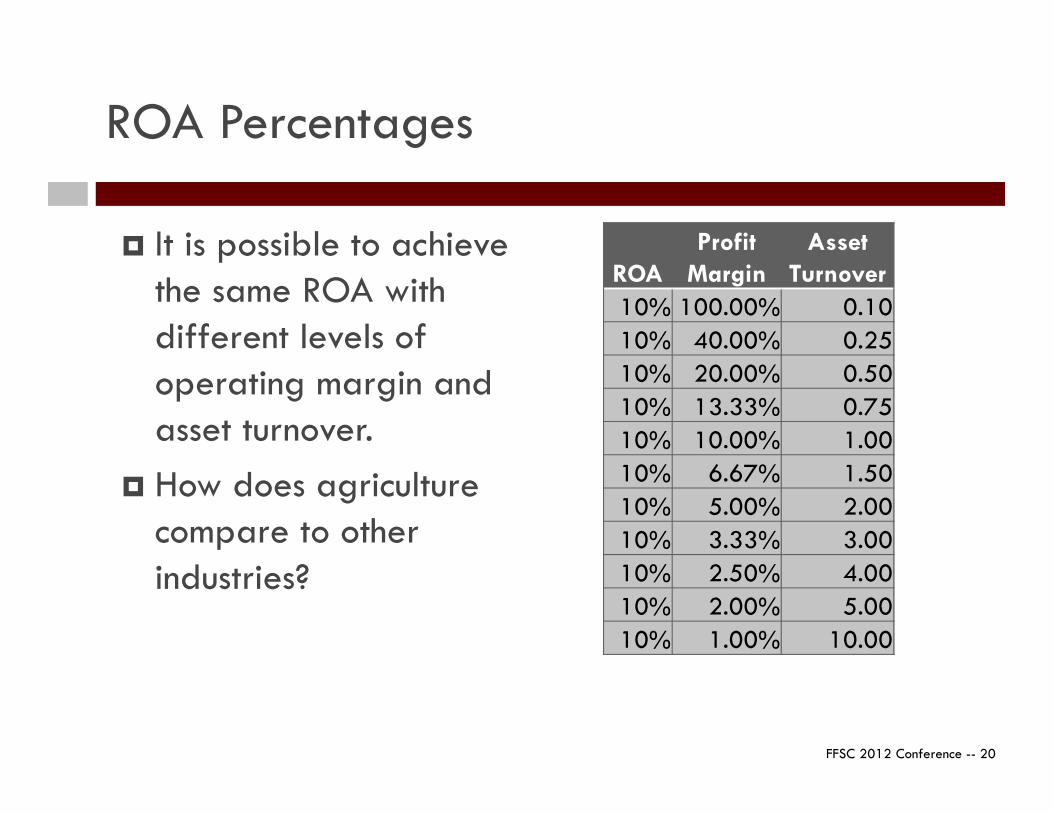
ROA Percentages
It is possible to achieve the same ROA with different levels of operating margin and asset turnover.
How does agriculture compare to other industries?
ROA Profit
Margin Asset
Turnover 10% 100.00% 0.1010% 40.00% 0.2510% 20.00% 0.5010% 13.33% 0.7510% 10.00% 1.0010% 6.67% 1.5010% 5.00% 2.0010% 3.33% 3.0010% 2.50% 4.0010% 2.00% 5.0010% 1.00% 10.00
FFSC 2012 Conference -- 21
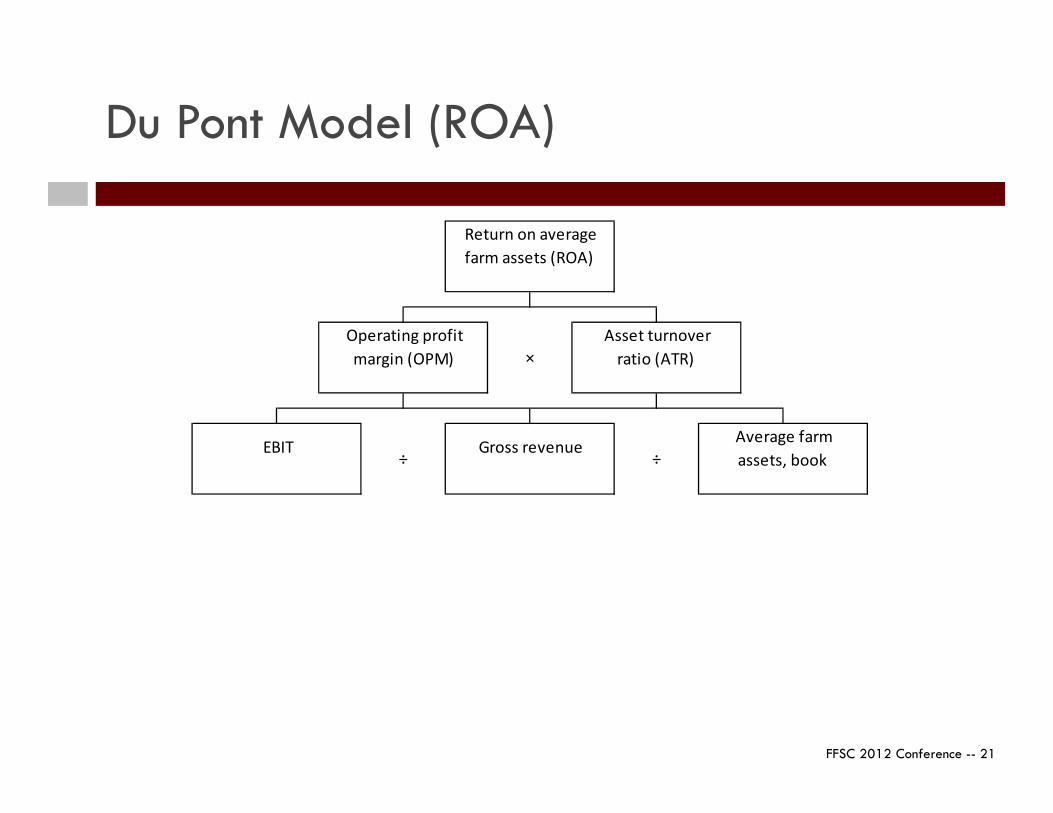
Du Pont Model (ROA)
EBIT ÷
Gross revenue ÷
Average farmassets, book
Operating profit margin (OPM) ×
Asset turnoverratio (ATR)
Return on average farm assets (ROA)
FFSC 2012 Conference -- 22
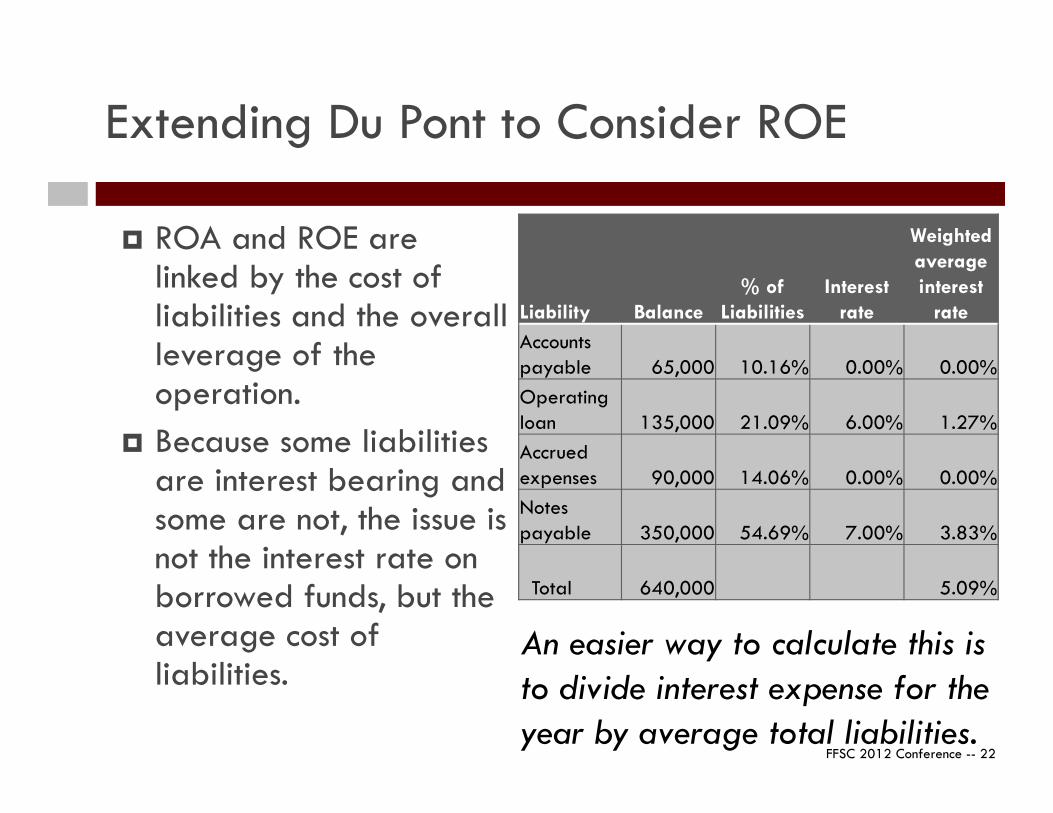
Extending Du Pont to Consider ROE
ROA and ROE are linked by the cost of liabilities and the overall leverage of the operation.
Because some liabilities are interest bearing and some are not, the issue is not the interest rate on borrowed funds, but the average cost of liabilities.
Liability Balance% of
LiabilitiesInterest
rate
Weighted average interest
rateAccountspayable 65,000 10.16% 0.00% 0.00%Operatingloan 135,000 21.09% 6.00% 1.27%Accruedexpenses 90,000 14.06% 0.00% 0.00%Notespayable 350,000 54.69% 7.00% 3.83%
Total 640,000 5.09%
An easier way to calculate this is to divide interest expense for the year by average total liabilities.
FFSC 2012 Conference -- 23
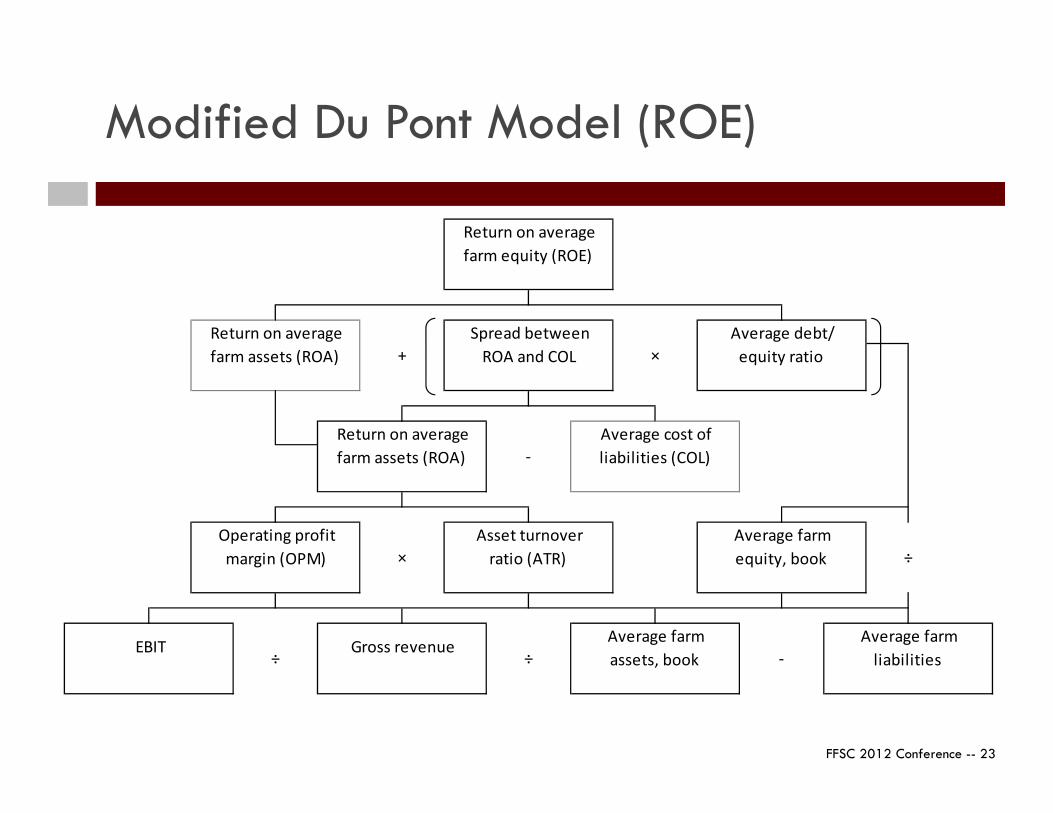
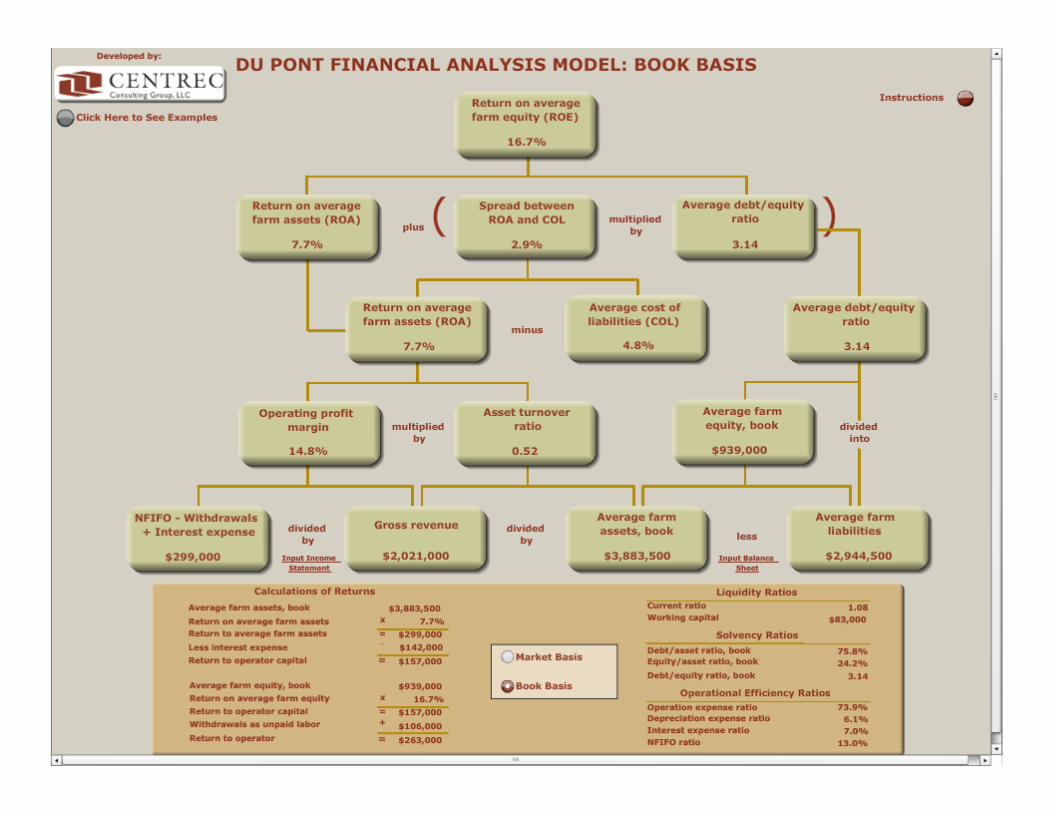
Modified Du Pont Model (ROE)
Average farm liabilities
EBIT ÷
Gross revenue ÷
Average farmassets, book -
Operating profit margin (OPM) ×
Asset turnoverratio (ATR)
Average farmequity, book ÷
Average debt/equity ratio
Return on average farm assets (ROA) -
Average cost of liabilities (COL)
Return on average farm equity (ROE)
Return on average farm assets (ROA) +
Spread betweenROA and COL ×
FFSC 2012 Conference -- 24
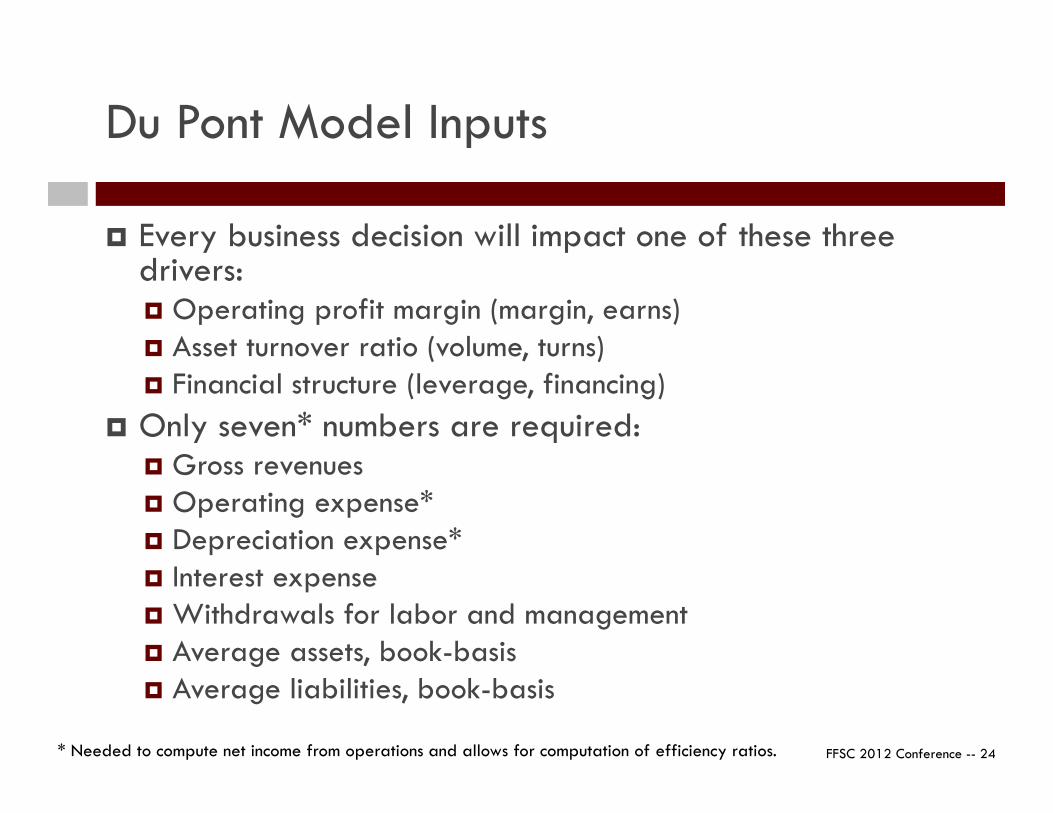
Du Pont Model Inputs
Every business decision will impact one of these three drivers: Operating profit margin (margin, earns) Asset turnover ratio (volume, turns) Financial structure (leverage, financing)
Only seven* numbers are required: Gross revenues Operating expense* Depreciation expense* Interest expense Withdrawals for labor and management Average assets, book-basis Average liabilities, book-basis
* Needed to compute net income from operations and allows for computation of efficiency ratios.
FFSC 2012 Conference -- 25
FFSC 2012 Conference -- 26
Du Pont Model Comments
The greater the positive spread between ROA and average cost of liabilities, the more leverage that can be handled by an operation.
Fluctuations in ROA are “multiplied” by leverage in terms of their effect on ROE; the direction of the multiplier is determined by a positive or negative spread between ROA and the average cost of liabilities.
If ROA is greater than ROE, deleveraging will increase ROE and reduce income and repayment sensitivities to a given change in revenue or expense.
Book-basis analysis is most meaningful.
FFSC 2012 Conference -- 27
Du Pont Model Caveats
Assets, liabilities, and equity are averaged from the beginning and ending balance sheet. Thus, significant changes in the operations (either expansion or contraction) can lead to erratic results in these numbers.
Withdrawals are used in both equations as a proxy for unpaid family labor (amounts different than the value of unpaid labor will distort the ratios).
ROE measures are meaningless for highly leveraged operations with little or negative equity.
Both measures are pre-tax. Use caution when using the Du Pont model with market-
basis values.
FFSC 2012 Conference -- 28
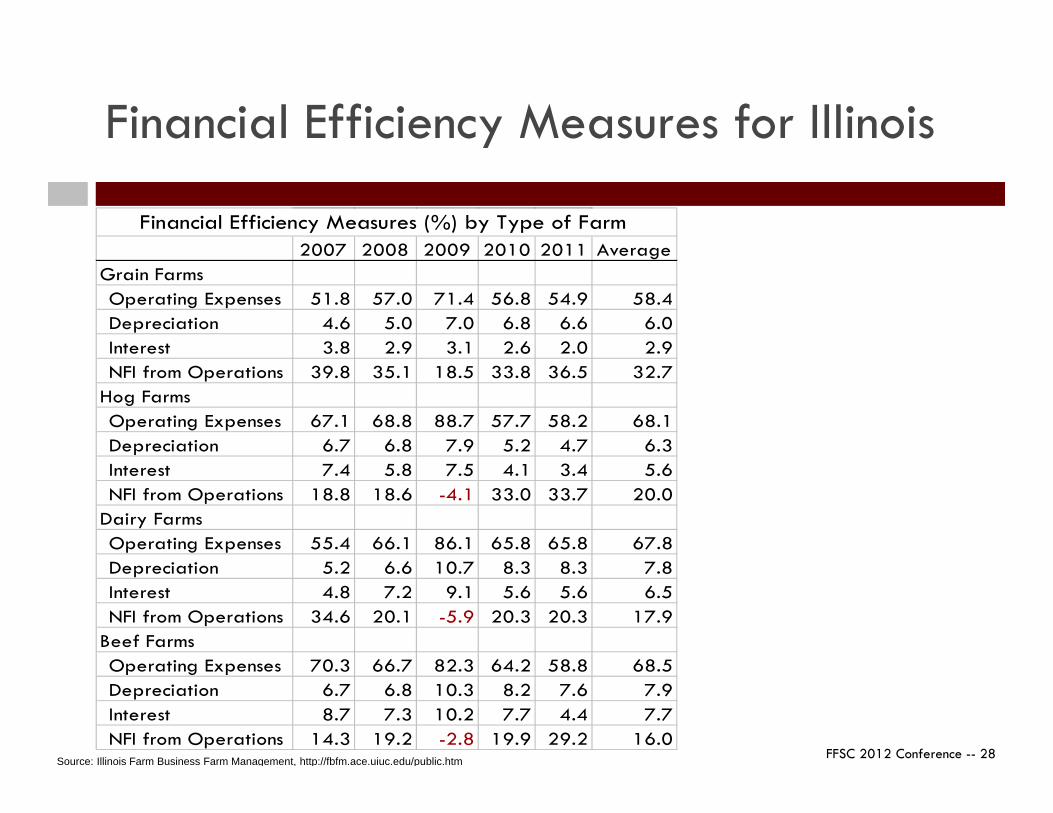
Financial Efficiency Measures for Illinois
Source: Illinois Farm Business Farm Management, http://fbfm.ace.uiuc.edu/public.htm
2007 2008 2009 2010 2011 Average Grain Farms Operating Expenses 51.8 57.0 71.4 56.8 54.9 58.4Depreciation 4.6 5.0 7.0 6.8 6.6 6.0Interest 3.8 2.9 3.1 2.6 2.0 2.9NFI from Operations 39.8 35.1 18.5 33.8 36.5 32.7
Hog Farms Operating Expenses 67.1 68.8 88.7 57.7 58.2 68.1Depreciation 6.7 6.8 7.9 5.2 4.7 6.3Interest 7.4 5.8 7.5 4.1 3.4 5.6NFI from Operations 18.8 18.6 -4.1 33.0 33.7 20.0
Dairy Farms Operating Expenses 55.4 66.1 86.1 65.8 65.8 67.8Depreciation 5.2 6.6 10.7 8.3 8.3 7.8Interest 4.8 7.2 9.1 5.6 5.6 6.5NFI from Operations 34.6 20.1 -5.9 20.3 20.3 17.9
Beef Farms Operating Expenses 70.3 66.7 82.3 64.2 58.8 68.5Depreciation 6.7 6.8 10.3 8.2 7.6 7.9Interest 8.7 7.3 10.2 7.7 4.4 7.7NFI from Operations 14.3 19.2 -2.8 19.9 29.2 16.0
Financial Efficiency Measures (%) by Type of Farm
FFSC 2012 Conference -- 29
Working with Lenders
FFSC Financial Guidelines
FFSC 2012 Conference -- 30
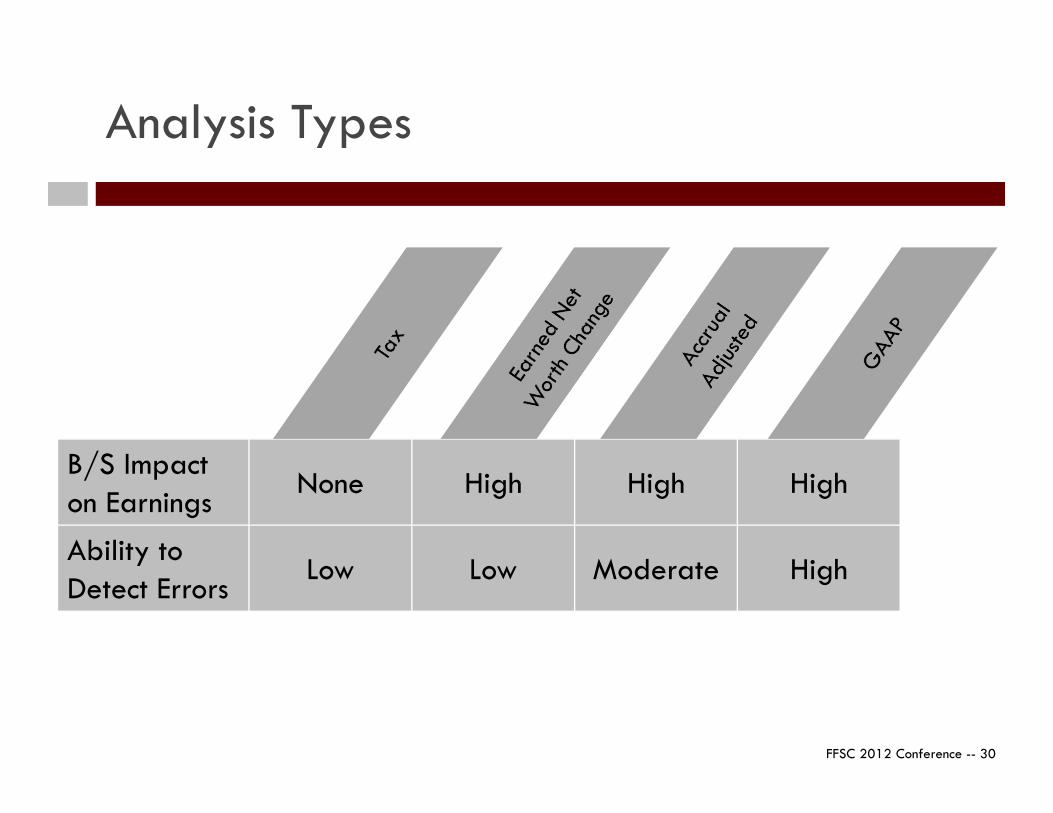
Analysis Types
B/S Impacton Earnings
None High High High
Ability toDetect Errors
Low Low Moderate High
FFSC Focus
FFSC 2012 Conference -- 31
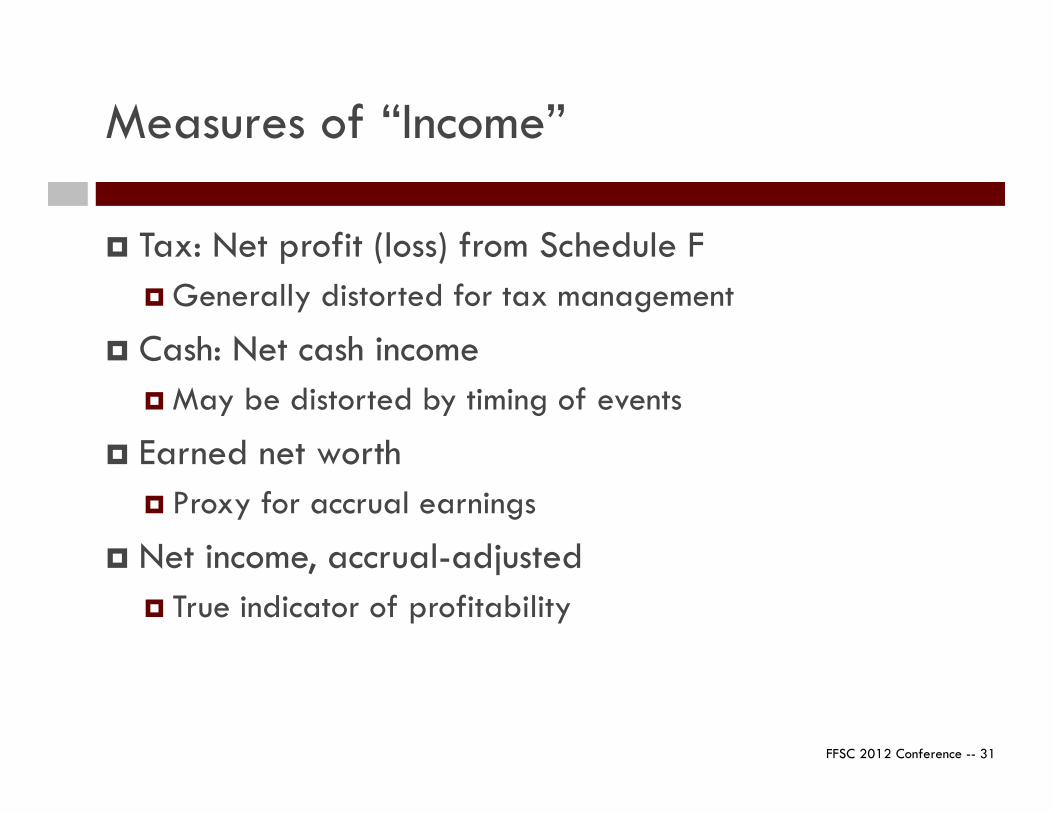
Tax: Net profit (loss) from Schedule F Generally distorted for tax management
Cash: Net cash income May be distorted by timing of events
Earned net worth Proxy for accrual earnings
Net income, accrual-adjusted True indicator of profitability
Measures of “Income”
FFSC 2012 Conference -- 32
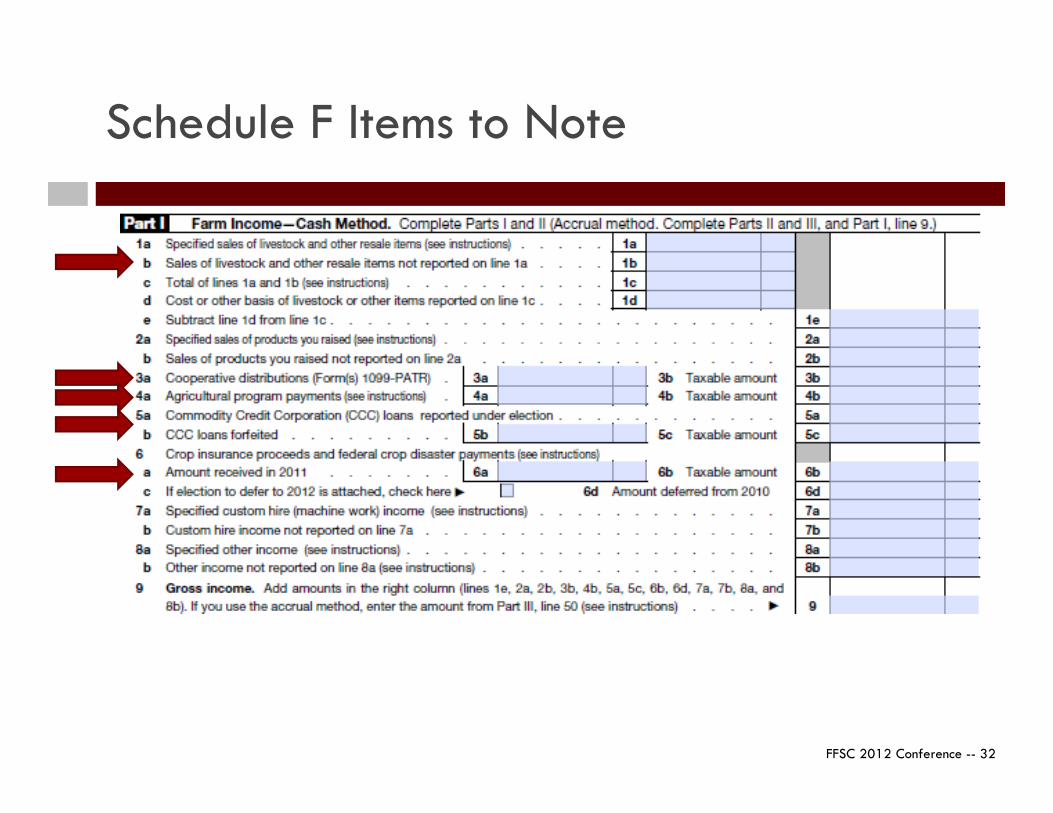
Schedule F Items to Note
FFSC 2012 Conference -- 33
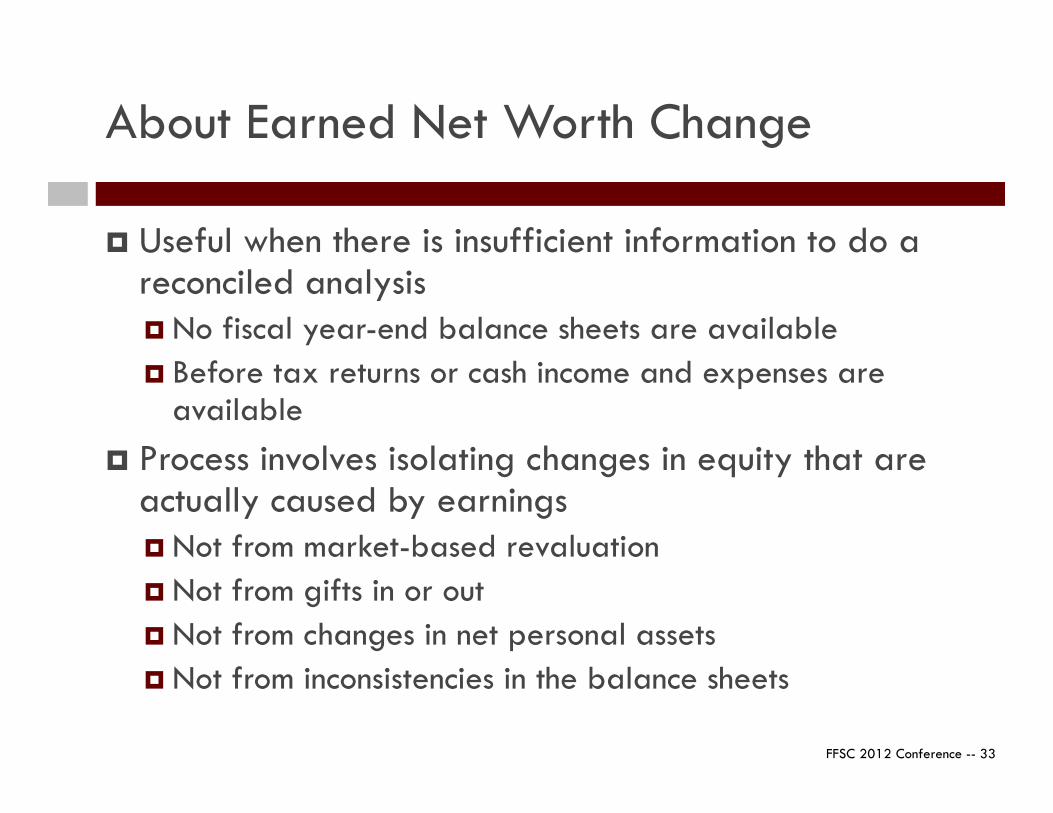
Useful when there is insufficient information to do a reconciled analysis No fiscal year-end balance sheets are available Before tax returns or cash income and expenses are
available Process involves isolating changes in equity that are
actually caused by earnings Not from market-based revaluation Not from gifts in or out Not from changes in net personal assets Not from inconsistencies in the balance sheets
About Earned Net Worth Change
FFSC 2012 Conference -- 34
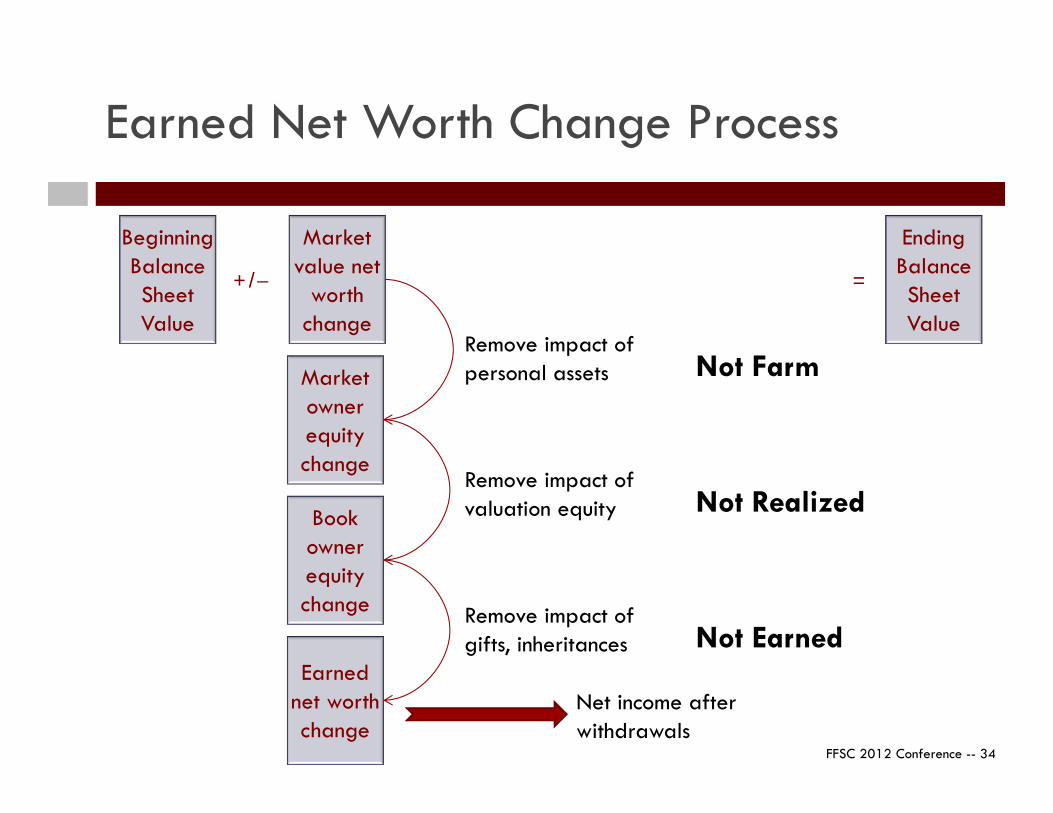
Earned Net Worth Change Process
+/− =
Market value net
worth change
EndingBalanceSheetValue
BeginningBalanceSheetValue
Market owner equity change
Book owner equity change
Earned net worth change
Remove impact of personal assets
Remove impact of valuation equity
Remove impact of gifts, inheritances
Not Farm
Not Realized
Not Earned
Net income after withdrawals
FFSC 2012 Conference -- 35
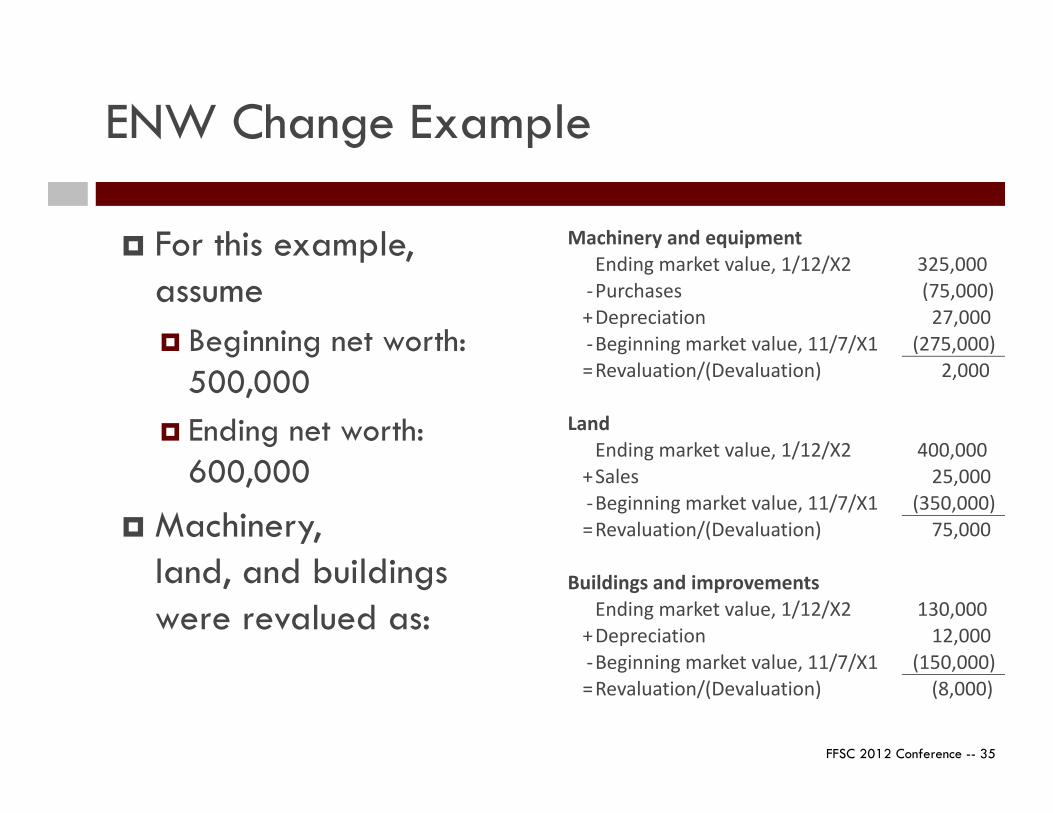
ENW Change Example
For this example, assume Beginning net worth:
500,000 Ending net worth:
600,000
Machinery,land, and buildingswere revalued as:
Machinery and equipmentEnding market value, 1/12/X2 325,000
-Purchases (75,000)+Depreciation 27,000 -Beginning market value, 11/7/X1 (275,000)=Revaluation/(Devaluation) 2,000
LandEnding market value, 1/12/X2 400,000
+Sales 25,000 -Beginning market value, 11/7/X1 (350,000)=Revaluation/(Devaluation) 75,000
Buildings and improvementsEnding market value, 1/12/X2 130,000
+Depreciation 12,000 -Beginning market value, 11/7/X1 (150,000)=Revaluation/(Devaluation) (8,000)
FFSC 2012 Conference -- 36
ENW Change Example, continued
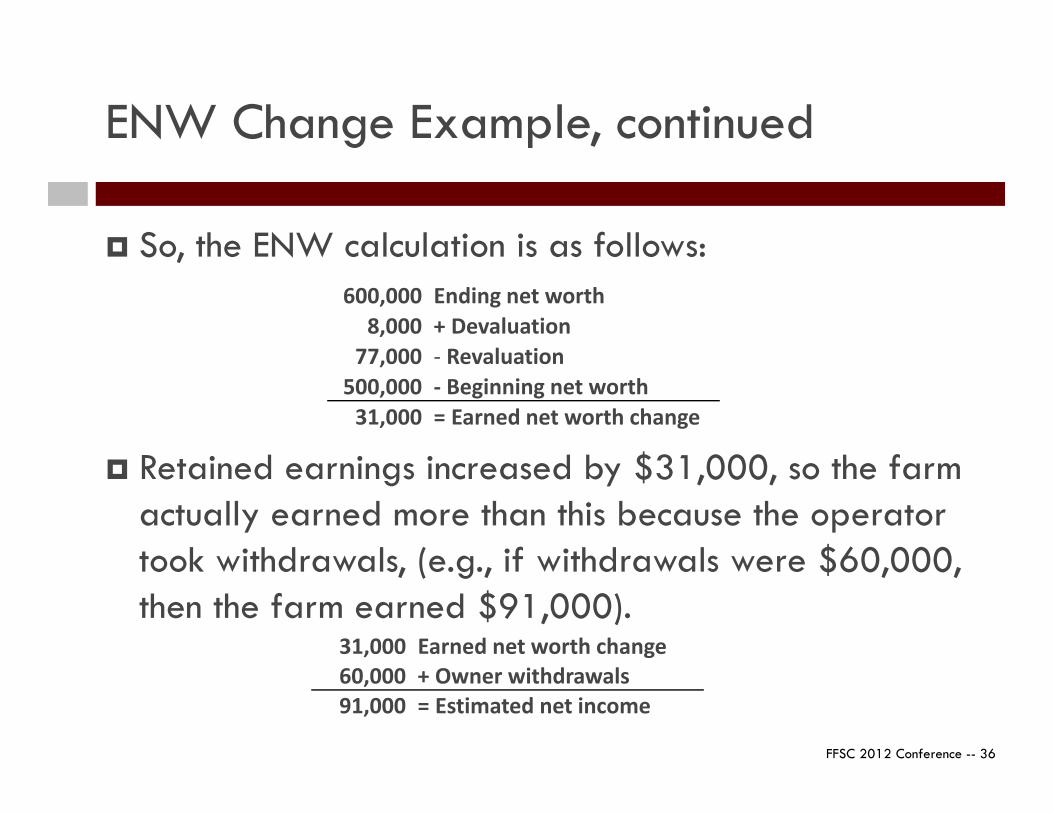
So, the ENW calculation is as follows:
Retained earnings increased by $31,000, so the farm actually earned more than this because the operator took withdrawals, (e.g., if withdrawals were $60,000, then the farm earned $91,000).
600,000 Ending net worth8,000 + Devaluation
77,000 - Revaluation500,000 - Beginning net worth
31,000 = Earned net worth change
31,000 Earned net worth change60,000 + Owner withdrawals91,000 = Estimated net income
FFSC 2012 Conference -- 37
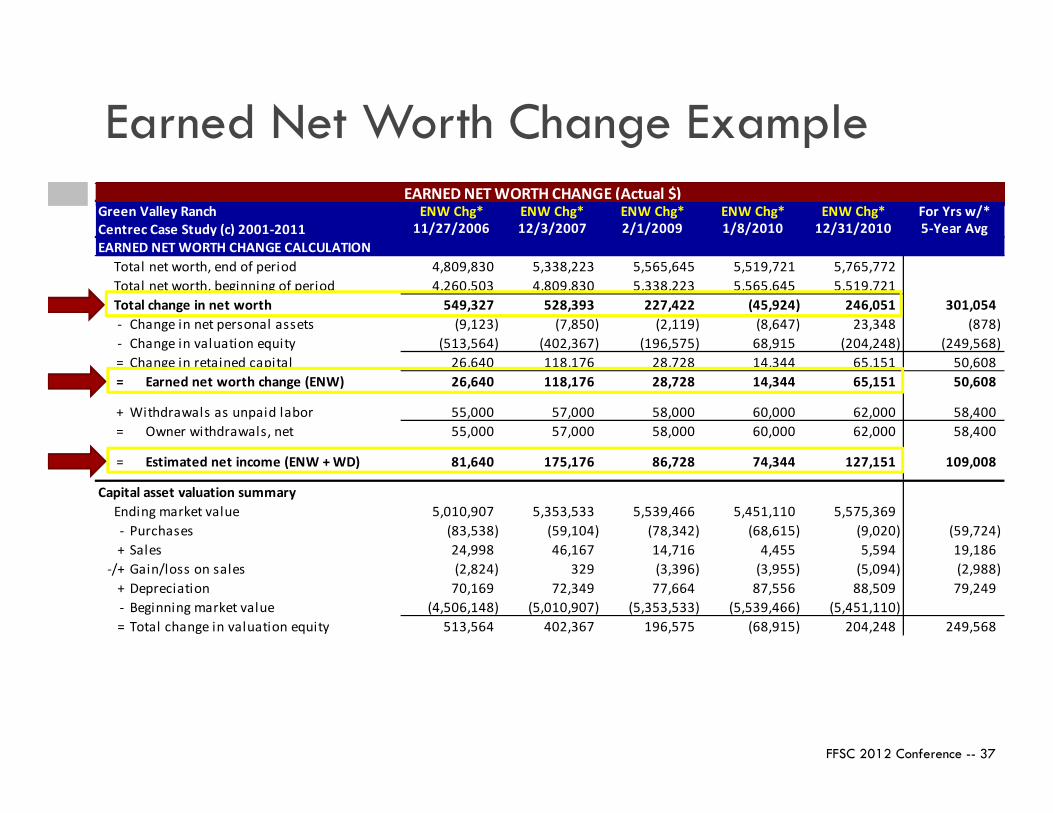
Earned Net Worth Change ExampleEARNED NET WORTH CHANGE (Actual $)
Green Valley Ranch ENW Chg* ENW Chg* ENW Chg* ENW Chg* ENW Chg* For Yrs w/*Centrec Case Study (c) 2001-2011 11/27/2006 12/3/2007 2/1/2009 1/8/2010 12/31/2010 5-Year AvgEARNED NET WORTH CHANGE CALCULATION
Total net worth, end of period 4,809,830 5,338,223 5,565,645 5,519,721 5,765,772 Total net worth, beginning of period 4,260,503 4,809,830 5,338,223 5,565,645 5,519,721 Total change in net worth 549,327 528,393 227,422 (45,924) 246,051 301,054 - Change in net personal assets (9,123) (7,850) (2,119) (8,647) 23,348 (878) - Change in valuation equity (513,564) (402,367) (196,575) 68,915 (204,248) (249,568) = Change in retained capital 26,640 118,176 28,728 14,344 65,151 50,608 = Earned net worth change (ENW) 26,640 118,176 28,728 14,344 65,151 50,608
+ Withdrawals as unpaid labor 55,000 57,000 58,000 60,000 62,000 58,400 = Owner withdrawals, net 55,000 57,000 58,000 60,000 62,000 58,400
= Estimated net income (ENW + WD) 81,640 175,176 86,728 74,344 127,151 109,008
Capital asset valuation summaryEnding market value 5,010,907 5,353,533 5,539,466 5,451,110 5,575,369 - Purchases (83,538) (59,104) (78,342) (68,615) (9,020) (59,724) + Sales 24,998 46,167 14,716 4,455 5,594 19,186
-/+ Gain/loss on sales (2,824) 329 (3,396) (3,955) (5,094) (2,988) + Depreciation 70,169 72,349 77,664 87,556 88,509 79,249 - Beginning market value (4,506,148) (5,010,907) (5,353,533) (5,539,466) (5,451,110) = Total change in valuation equity 513,564 402,367 196,575 (68,915) 204,248 249,568
FFSC 2012 Conference -- 38
Departures from Common Lender Practice
FFSC Financial Guidelines
FFSC 2012 Conference -- 39
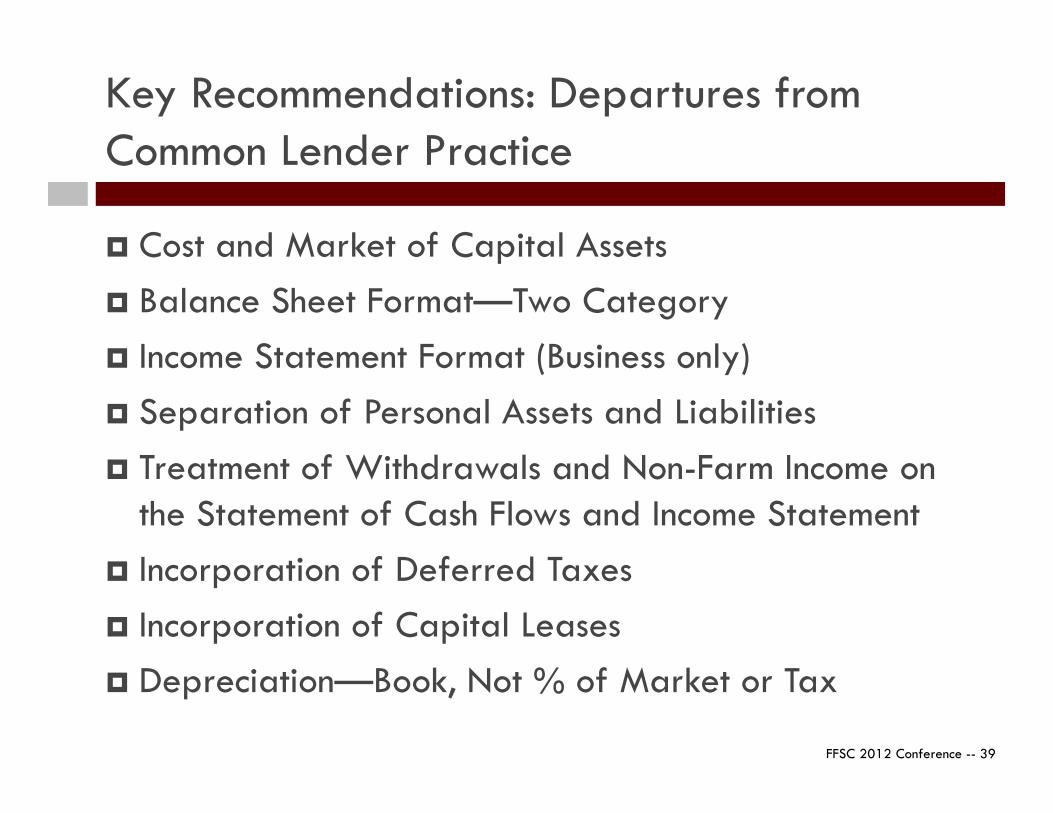
Key Recommendations: Departures from Common Lender Practice
Cost and Market of Capital Assets Balance Sheet Format—Two Category Income Statement Format (Business only) Separation of Personal Assets and Liabilities Treatment of Withdrawals and Non-Farm Income on
the Statement of Cash Flows and Income Statement Incorporation of Deferred Taxes Incorporation of Capital Leases Depreciation—Book, Not % of Market or Tax
FFSC 2012 Conference -- 40
Some Common Misconceptions
Credit Analysis Myth: The FFSC Recommendations are meant as credit
analysis recommendations. Fact: Development of an effective credit process requires
evaluation of numerous factors beyond the scope of the FFSC Recommendations.
FFSC 2012 Conference -- 41
Some Common Misconceptions
GAAP Compliance Myth: FFSC Recommendations are meant as a substitute
for or replacement of GAAP. Fact: FFSC Recommendations are based on the
Conceptual Framework documents, and are largely consistent w/GAAP. Accountant opinions based on FFSC Recommendations are and will continue to be qualified.
FFSC 2012 Conference -- 42
Some Common Misconceptions
Partial Adoption Myth: Partial adoption is not worthwhile. Fact: Many organizations have not adopted all of the
FFSC Recommendations. Trend to total adoption continues to grow, partial adoption can provide significant benefits.
FFSC 2012 Conference -- 43
Some Common Misconceptions
Financial Statement Format Myth: Only the financial statement formats included in the
Recommendations are acceptable. Fact: Financial statement formats included in the
Recommendations are for illustrative purposes only—the key is consistency with the methods themselves.
FFSC 2012 Conference -- 44
FFSC Guidelines: Implications for Ag Lenders
More Availability of CPA Statements More Consistency in Education and Software Faster Development of Integrated Production/
Financial Databases Greater Value of Internal Databases
FFSC 2012 Conference -- 45
Acceptance of Guidelines
In our training, we often take an informal poll about familiarity with FFSC and use of guidelines.
Most lenders deploy a portion of the standards. Many credit departments understand and integrate
many of the guidelines…the exception being deferred tax (the only guideline recommendation that has zero compliance).
It’s not that lenders don’t agree with or ignore the standards…they have made sound business decisions and only move to full accrual-adjusted analysis when risk warrants (sufficient volume and size of operation).
FFSC 2012 Conference -- 46
Acceptance of Guidelines, cont.
FFSC was/is an educational effort, and overall level of discussion across producers and lenders has definitely increased.
FBFM has been a full adopter (except deferred taxes) of the guidelines and their statements are high quality. They have a very significant presence in Illinois, provide good statements for producers, lenders, and numbers for research.

FFSC 2012 Conference -- 47
Conclusions
FFSC 2012 Conference -- 48
Conclusions
Managerial accounting allows our clients to get to true cost of production numbers which allows for detailed analysis of the operation (or various segments).
We have found that the Du Pont model is a good focal point for analysis. It bring together earnings (profit margin) and turnover (asset utilization) along with debt structure. It’s then easy to scan operating efficiency.
Guidelines can be (and are used for) but are not necessarily for credit analysis (financial analysis is one of many aspects).
Lenders have made sound business decisions and only “further” analyze when risk warrants (sufficient volume and size of operation).

FFSC 2012 Conference -- 49
Todd Doehring ([email protected])3 College Park CourtSavoy, IL 61874Phone: (217) 352-1190www.centrec.com
Thank You!