Embed Size (px)
Citation preview

Using the Pentaho BI Suite Online Demonstration
This document is copyright © 2011 Pentaho Corporation. No part may be reprinted without written permission fromPentaho Corporation. All trademarks are the property of their respective owners.
Help and Support ResourcesIf you have questions that are not covered in this guide, or if you would like to report errors in the documentation,please contact your Pentaho technical support representative.
Support-related questions should be submitted through the Pentaho Customer Support Portal athttp://support.pentaho.com.
For information about how to purchase support or enable an additional named support contact, please contact yoursales representative, or send an email to [email protected].
For information about instructor-led training on the topics covered in this guide, visithttp://www.pentaho.com/training.
Limits of Liability and Disclaimer of WarrantyThe author(s) of this document have used their best efforts in preparing the content and the programs containedin it. These efforts include the development, research, and testing of the theories and programs to determine theireffectiveness. The author and publisher make no warranty of any kind, express or implied, with regard to theseprograms or the documentation contained in this book.
The author(s) and Pentaho shall not be liable in the event of incidental or consequential damages in connectionwith, or arising out of, the furnishing, performance, or use of the programs, associated instructions, and/or claims.
TrademarksPentaho (TM) and the Pentaho logo are registered trademarks of Pentaho Corporation. All other trademarks are theproperty of their respective owners. Trademarked names may appear throughout this document. Rather than listthe names and entities that own the trademarks or insert a trademark symbol with each mention of the trademarkedname, Pentaho states that it is using the names for editorial purposes only and to the benefit of the trademarkowner, with no intention of infringing upon that trademark.
Company InformationPentaho CorporationCitadel International, Suite 3405950 Hazeltine National DriveOrlando, FL 32822Phone: +1 407 812-OPEN (6736)Fax: +1 407 517-4575http://www.pentaho.com
E-mail: [email protected]
Sales Inquiries: [email protected]
Documentation Suggestions: [email protected]
Sign-up for our newsletter: http://community.pentaho.com/newsletter/
| TOC | 3
Contents
Evaluating the Pentaho BI Platform...........................................................................................4Software Requirements................................................................................................................................ 4Evaluation Overview..................................................................................................................................... 4Online Demo Registration.............................................................................................................................4Logging Into the Online Demo...................................................................................................................... 4Exploring the Samples..................................................................................................................................6
Is This Guide For You?..............................................................................................................7Create, Publish, and Share Information.....................................................................................8
Ad Hoc Report Tutorial................................................................................................................................. 8Creating a New Analyzer Report................................................................................................................ 10
Enhancing the Pentaho Analyzer Report.........................................................................................11Adding Filters to an Analyzer Report............................................................................................... 11
Dashboards................................................................................................................................................ 12Dashboard Designer Tutorial........................................................................................................... 12
Further Evaluation...................................................................................................................................... 14
4 | Pentaho BI Suite Official Documentation | Evaluating the Pentaho BI Platform
Evaluating the Pentaho BI Platform
Your organization needs a business intelligence reporting solution, but where do you begin your evaluation? This guidewill walk you through using some of Pentaho's end-user reporting and analysis tools via the online demo provided onthe pentaho.com Web site. The online demo is as close to using the BI Suite's Web-based graphical user interface asyou can get without installing it on a local machine. This enables you to see the BI Suite's ad hoc reporting and PentahoAnalyzer report capabilities without going to the trouble of installing any software. If you would like to go beyond this firststage, you can still download the full Pentaho BI Suite Enterprise Edition (which includes client tools that go far beyondthe online demo's Web interface), install it in your test environment, and evaluate it firsthand for 30 days. If you needpersonal assistance in developing a BI solution, there are Pentaho consultants, salespeople, and pre-sales supportspecialists available to help you.
Software RequirementsThere are no operating system requirements for the online demo. You must use either Internet Explorer 6 or higher orFirefox 3.0 or higher, however, and cookies must be enabled in the browser configuration.
Note: There may be problems with some versions of Firefox 2.x. Other browsers such as Safari and Opera maywork, but are neither tested nor supported by Pentaho for this online demo.
Evaluation OverviewThe online demo encompasses the BI Suite's Web interface, known as the Pentaho User Console. Through this Webapplication you will achieve the following goals within 30 minutes (though it may take longer depending on the quality ofyour network connection and your proclivity for experimentation):
1. Register for the online demo: 5 minutes.2. Log into the Pentaho User Console as a guest: less than a minute.3. Follow a step-by-step walkthrough for creating a basic, data-driven ad hoc report with the included sample data: 10
minutes.4. Follow a step-by-step walkthrough that drills down into a data source using Pentaho Analyzer: 10 minutes.5. View some sample dashboards, which present report data in unique, interactive ways: 5 minutes.
Online Demo RegistrationBefore you can begin using the BI Suite online demo, you must provide some contact information. If you'd like, you canalso sign up to receive whitepapers, product demonstrations, and newsletters from Pentaho.
Simply visit http://demo.pentaho.com/ and fill in the Web form to complete the registration process.
Logging Into the Online DemoYou should have already signed up for access to the online demo.
Follow the below instructions to log into the online demo.
1. Navigate to the following URL to access the demo: http://demo.pentaho.com/pentaho/Login
Pentaho BI Suite Official Documentation | Evaluating the Pentaho BI Platform | 5
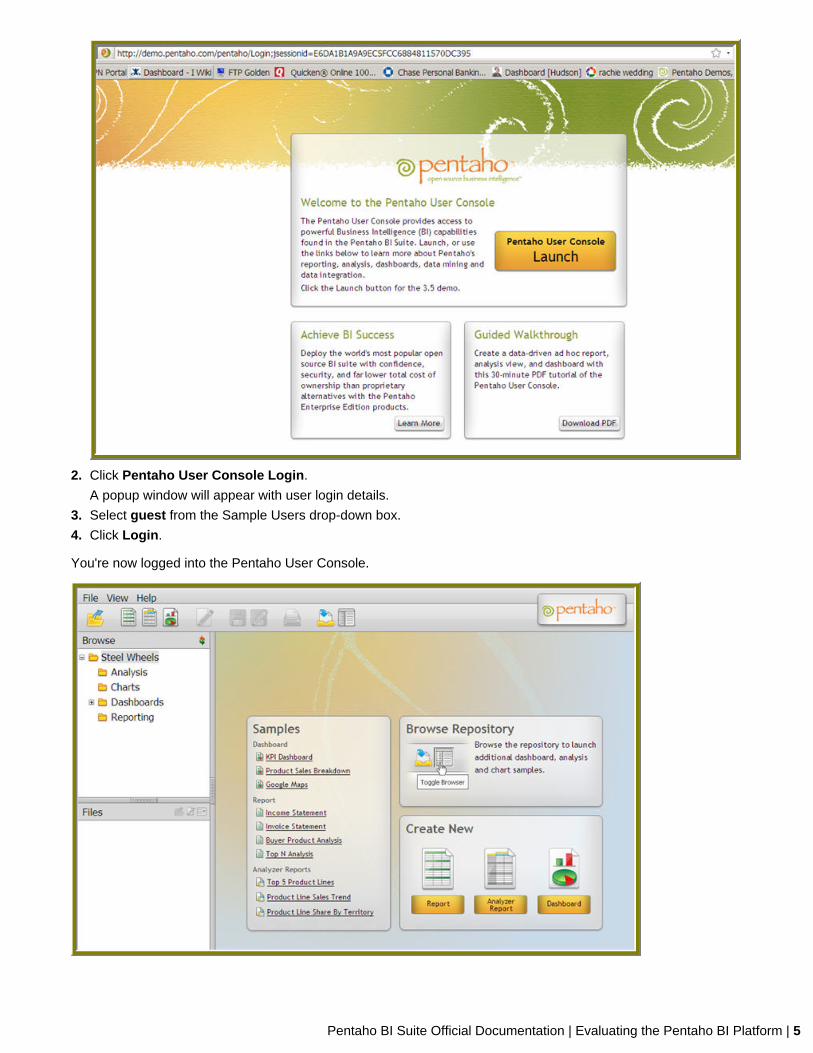
2. Click Pentaho User Console Login.
A popup window will appear with user login details.
3. Select guest from the Sample Users drop-down box.
4. Click Login.
You're now logged into the Pentaho User Console.
6 | Pentaho BI Suite Official Documentation | Evaluating the Pentaho BI Platform
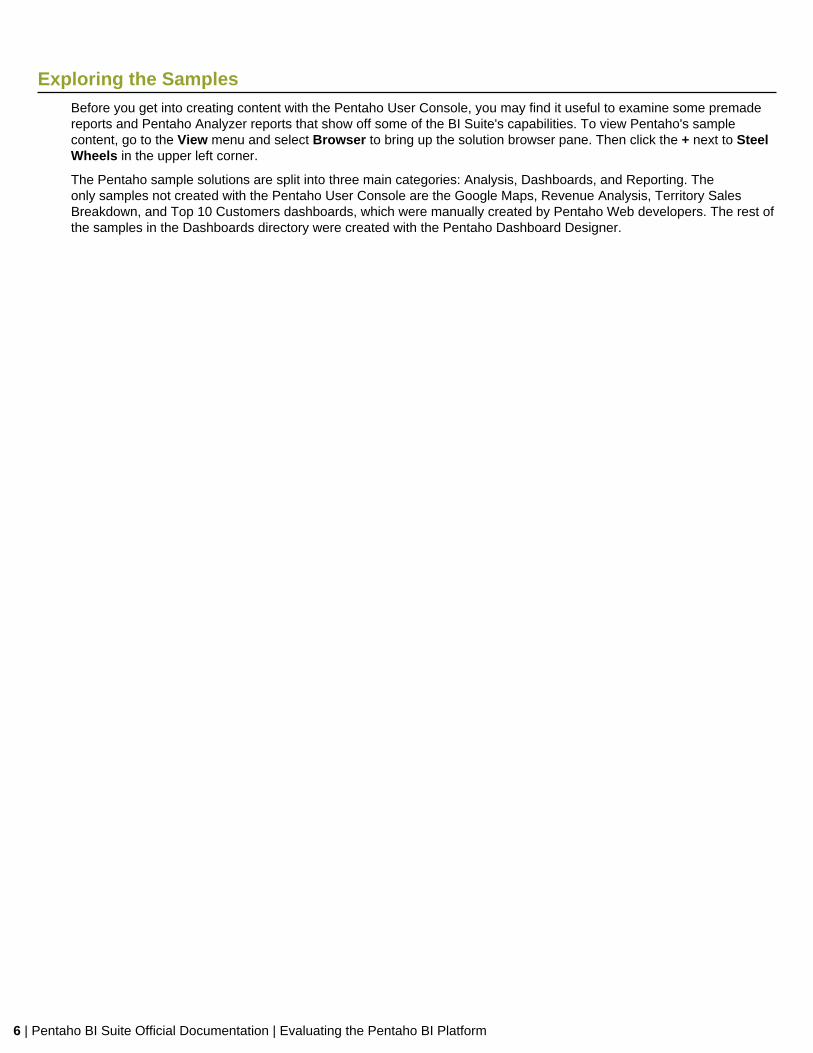
Exploring the SamplesBefore you get into creating content with the Pentaho User Console, you may find it useful to examine some premadereports and Pentaho Analyzer reports that show off some of the BI Suite's capabilities. To view Pentaho's samplecontent, go to the View menu and select Browser to bring up the solution browser pane. Then click the + next to SteelWheels in the upper left corner.
The Pentaho sample solutions are split into three main categories: Analysis, Dashboards, and Reporting. Theonly samples not created with the Pentaho User Console are the Google Maps, Revenue Analysis, Territory SalesBreakdown, and Top 10 Customers dashboards, which were manually created by Pentaho Web developers. The rest ofthe samples in the Dashboards directory were created with the Pentaho Dashboard Designer.

Pentaho BI Suite Official Documentation | Is This Guide For You? | 7
Is This Guide For You?
This guide's intended audience is relatively broad, but decidedly technically inclined. You might be anyone from a chiefinformation officer, IT manager, BI administrator, or database administrator, to someone who reports to one of thosepositions. One thing is certain, however: You should be comfortable with technical details and complex tutorials. Ifyou are not an IT professional, or if you otherwise require a simpler business intelligence evaluation experience thatexplains many of the related concepts along the way, you may be better suited to the Getting Started With Pentahoguide.
8 | Pentaho BI Suite Official Documentation | Create, Publish, and Share Information
Create, Publish, and Share Information
The ad hoc reporting capabilities built into the Pentaho BI Platform use the same Reporting engine as the moresophisticated Pentaho Report Designer client tool. Ad hoc reporting concentrates on simplicity and ease of use,enabling you or your business users to create a basic data-driven report very quickly. For more detailed reports, or forfine-grained control over every aspect of a report, Report Designer is a more appropriate tool.
Pentaho Analyzer reports are an interactive method of using filters and sorting to drill down into a data source todiscover hidden details. Pentaho Analyzer reports are more of a personal exploration tool, whereas ad hoc reports areintended to be distributed to others through HTML, PDF, or paper.
Ad Hoc Report TutorialAd Hoc Reporting allows you and your users to create a basic data-driven report quickly and efficiently. With Ad HocReporting, users do not need to know the structure of the database, nor do they need to know any SQL. A metadatamodel created with the Pentaho Metadata Editor, (a graphical user interface for creating user friendly metadatamodels), acts as a buffer between users and the complexities of relational data sources. The Pentaho BI Suite comeswith three pre-built business models (datasets).
Note: What is metadata? Quite simply, metadata is "data about data." For example, a library catalog isconsidered "metadata" because it contains information about books and other publications. A metadata model,is a collection of related categories of data.
New in version 3.5.1, is the ability to quickly access data in your own relational database or CSV flat file for evaluationor testing purposes.
Ad Hoc Reporting Interface provides...
• Easy-to-create connections to your relational or CSV (flat file) data sources for evaluation and testing purposes• Interactive ”drag and drop” Web interface for business user self-service report creation• Wizard-driven authoring supporting report templates, metadata-based query creation, sorting, and filtering• Interoperability with Pentaho Report Designer allowing ad hoc reports to be “promoted” for fine-tuning by IT
professionals• Single reporting engine for ad hoc and pixel-perfect reports for lowest possible total cost of ownership
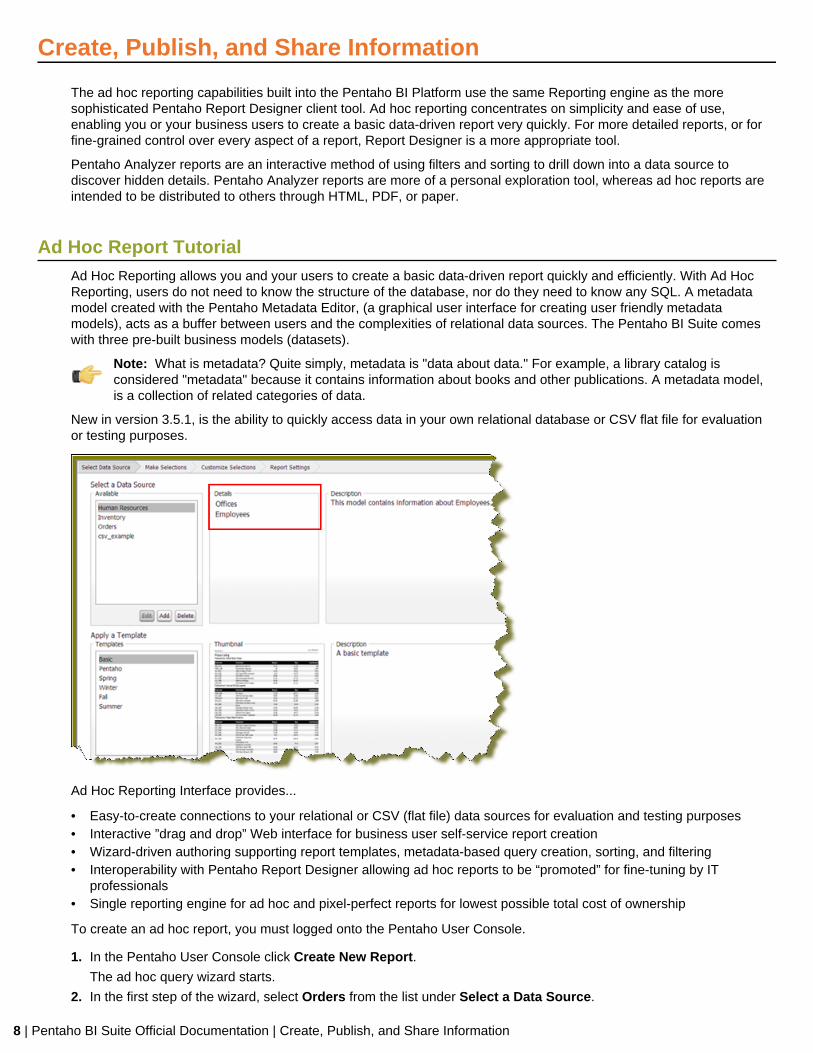
To create an ad hoc report, you must logged onto the Pentaho User Console.
1. In the Pentaho User Console click Create New Report.
The ad hoc query wizard starts.
2. In the first step of the wizard, select Orders from the list under Select a Data Source.
Pentaho BI Suite Official Documentation | Create, Publish, and Share Information | 9
As you become more familiar with Ad Hoc Reports features, you can add your own relational or flat file (CSV) datasources to ad hoc reports.
The tables associated with the Orders data source are listed in the Details pane.
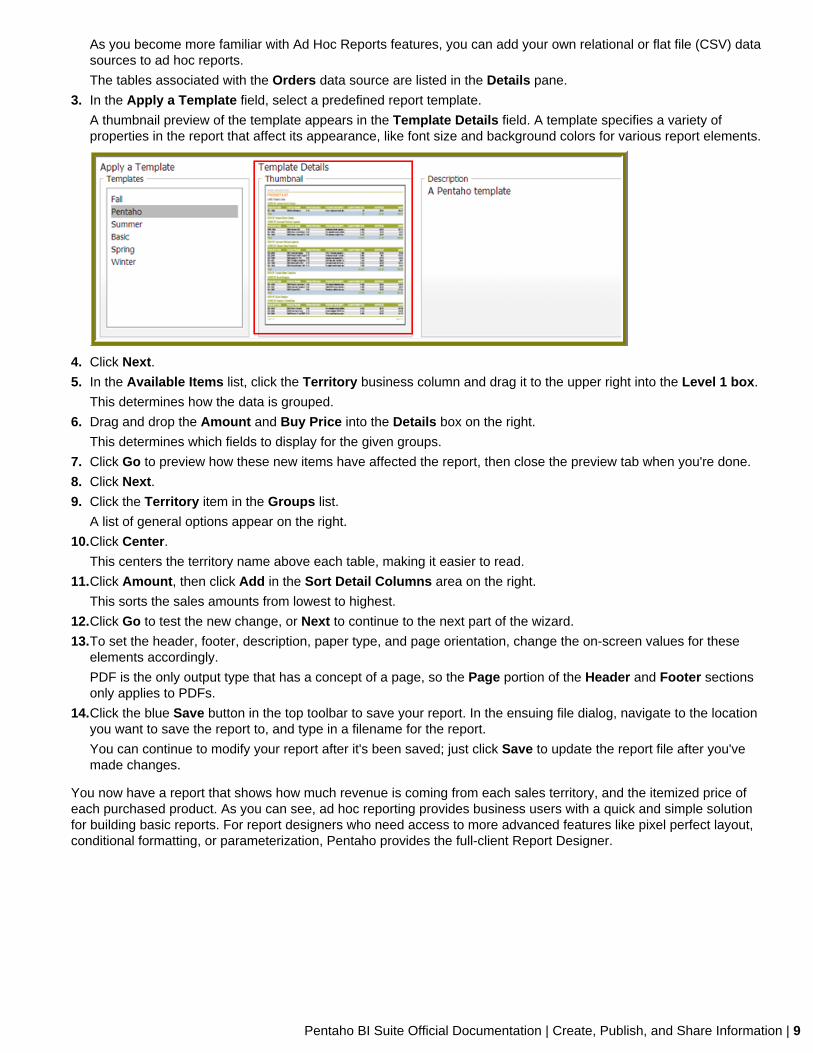
3. In the Apply a Template field, select a predefined report template.
A thumbnail preview of the template appears in the Template Details field. A template specifies a variety ofproperties in the report that affect its appearance, like font size and background colors for various report elements.
4. Click Next.
5. In the Available Items list, click the Territory business column and drag it to the upper right into the Level 1 box.
This determines how the data is grouped.
6. Drag and drop the Amount and Buy Price into the Details box on the right.
This determines which fields to display for the given groups.
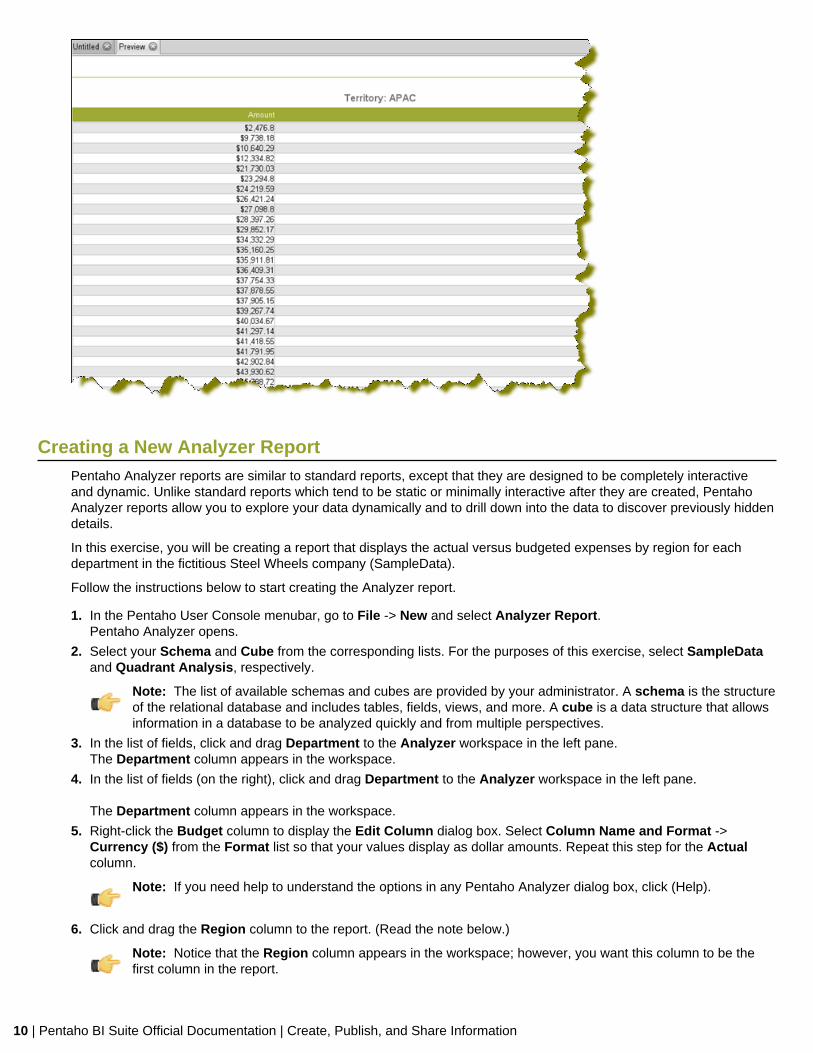
7. Click Go to preview how these new items have affected the report, then close the preview tab when you're done.
8. Click Next.
9. Click the Territory item in the Groups list.
A list of general options appear on the right.
10.Click Center.
This centers the territory name above each table, making it easier to read.
11.Click Amount, then click Add in the Sort Detail Columns area on the right.
This sorts the sales amounts from lowest to highest.
12.Click Go to test the new change, or Next to continue to the next part of the wizard.
13.To set the header, footer, description, paper type, and page orientation, change the on-screen values for theseelements accordingly.
PDF is the only output type that has a concept of a page, so the Page portion of the Header and Footer sectionsonly applies to PDFs.
14.Click the blue Save button in the top toolbar to save your report. In the ensuing file dialog, navigate to the locationyou want to save the report to, and type in a filename for the report.
You can continue to modify your report after it's been saved; just click Save to update the report file after you'vemade changes.
You now have a report that shows how much revenue is coming from each sales territory, and the itemized price ofeach purchased product. As you can see, ad hoc reporting provides business users with a quick and simple solutionfor building basic reports. For report designers who need access to more advanced features like pixel perfect layout,conditional formatting, or parameterization, Pentaho provides the full-client Report Designer.
10 | Pentaho BI Suite Official Documentation | Create, Publish, and Share Information
Creating a New Analyzer ReportPentaho Analyzer reports are similar to standard reports, except that they are designed to be completely interactiveand dynamic. Unlike standard reports which tend to be static or minimally interactive after they are created, PentahoAnalyzer reports allow you to explore your data dynamically and to drill down into the data to discover previously hiddendetails.
In this exercise, you will be creating a report that displays the actual versus budgeted expenses by region for eachdepartment in the fictitious Steel Wheels company (SampleData).
Follow the instructions below to start creating the Analyzer report.
1. In the Pentaho User Console menubar, go to File -> New and select Analyzer Report.Pentaho Analyzer opens.
2. Select your Schema and Cube from the corresponding lists. For the purposes of this exercise, select SampleDataand Quadrant Analysis, respectively.
Note: The list of available schemas and cubes are provided by your administrator. A schema is the structureof the relational database and includes tables, fields, views, and more. A cube is a data structure that allowsinformation in a database to be analyzed quickly and from multiple perspectives.
3. In the list of fields, click and drag Department to the Analyzer workspace in the left pane.The Department column appears in the workspace.
4. In the list of fields (on the right), click and drag Department to the Analyzer workspace in the left pane.
The Department column appears in the workspace.
5. Right-click the Budget column to display the Edit Column dialog box. Select Column Name and Format ->Currency ($) from the Format list so that your values display as dollar amounts. Repeat this step for the Actualcolumn.
Note: If you need help to understand the options in any Pentaho Analyzer dialog box, click (Help).
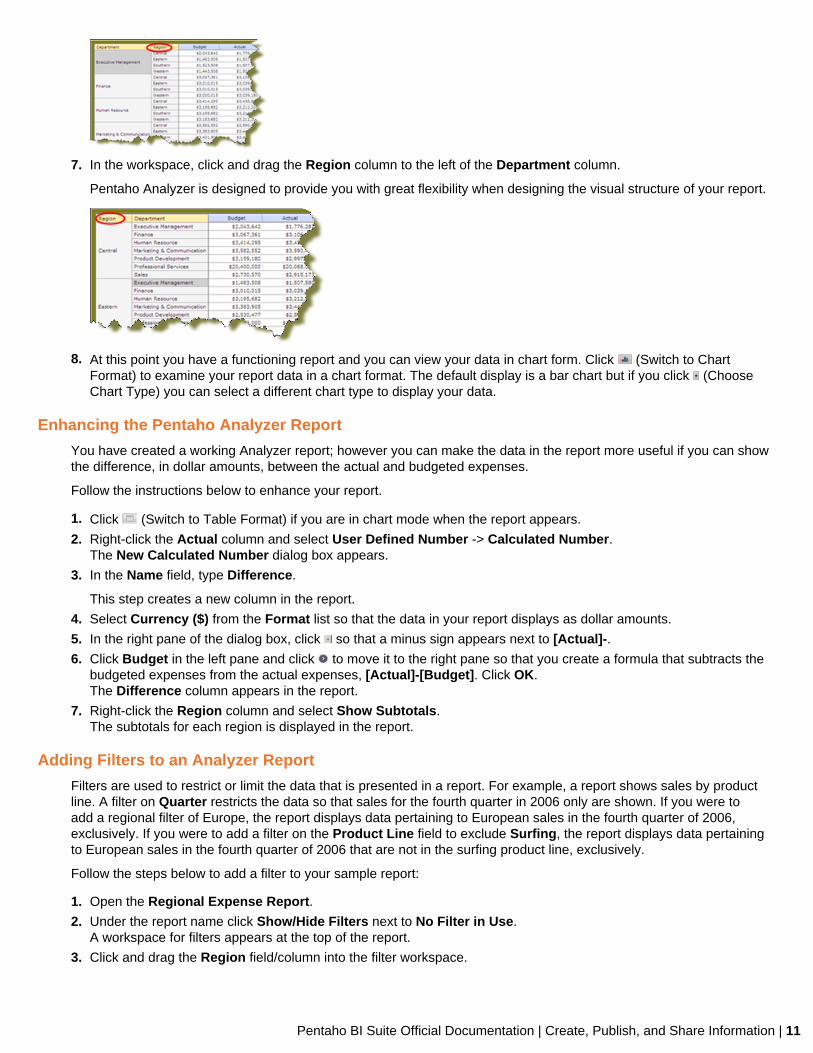
6. Click and drag the Region column to the report. (Read the note below.)
Note: Notice that the Region column appears in the workspace; however, you want this column to be thefirst column in the report.
Pentaho BI Suite Official Documentation | Create, Publish, and Share Information | 11
7. In the workspace, click and drag the Region column to the left of the Department column.
Pentaho Analyzer is designed to provide you with great flexibility when designing the visual structure of your report.
8. At this point you have a functioning report and you can view your data in chart form. Click (Switch to ChartFormat) to examine your report data in a chart format. The default display is a bar chart but if you click (ChooseChart Type) you can select a different chart type to display your data.
Enhancing the Pentaho Analyzer Report
You have created a working Analyzer report; however you can make the data in the report more useful if you can showthe difference, in dollar amounts, between the actual and budgeted expenses.
Follow the instructions below to enhance your report.
1. Click (Switch to Table Format) if you are in chart mode when the report appears.
2. Right-click the Actual column and select User Defined Number -> Calculated Number.The New Calculated Number dialog box appears.
3. In the Name field, type Difference.
This step creates a new column in the report.
4. Select Currency ($) from the Format list so that the data in your report displays as dollar amounts.
5. In the right pane of the dialog box, click so that a minus sign appears next to [Actual]-.
6. Click Budget in the left pane and click to move it to the right pane so that you create a formula that subtracts thebudgeted expenses from the actual expenses, [Actual]-[Budget]. Click OK.The Difference column appears in the report.
7. Right-click the Region column and select Show Subtotals.The subtotals for each region is displayed in the report.
Adding Filters to an Analyzer Report
Filters are used to restrict or limit the data that is presented in a report. For example, a report shows sales by productline. A filter on Quarter restricts the data so that sales for the fourth quarter in 2006 only are shown. If you were toadd a regional filter of Europe, the report displays data pertaining to European sales in the fourth quarter of 2006,exclusively. If you were to add a filter on the Product Line field to exclude Surfing, the report displays data pertainingto European sales in the fourth quarter of 2006 that are not in the surfing product line, exclusively.
Follow the steps below to add a filter to your sample report:
1. Open the Regional Expense Report.
2. Under the report name click Show/Hide Filters next to No Filter in Use.A workspace for filters appears at the top of the report.
3. Click and drag the Region field/column into the filter workspace.
12 | Pentaho BI Suite Official Documentation | Create, Publish, and Share Information
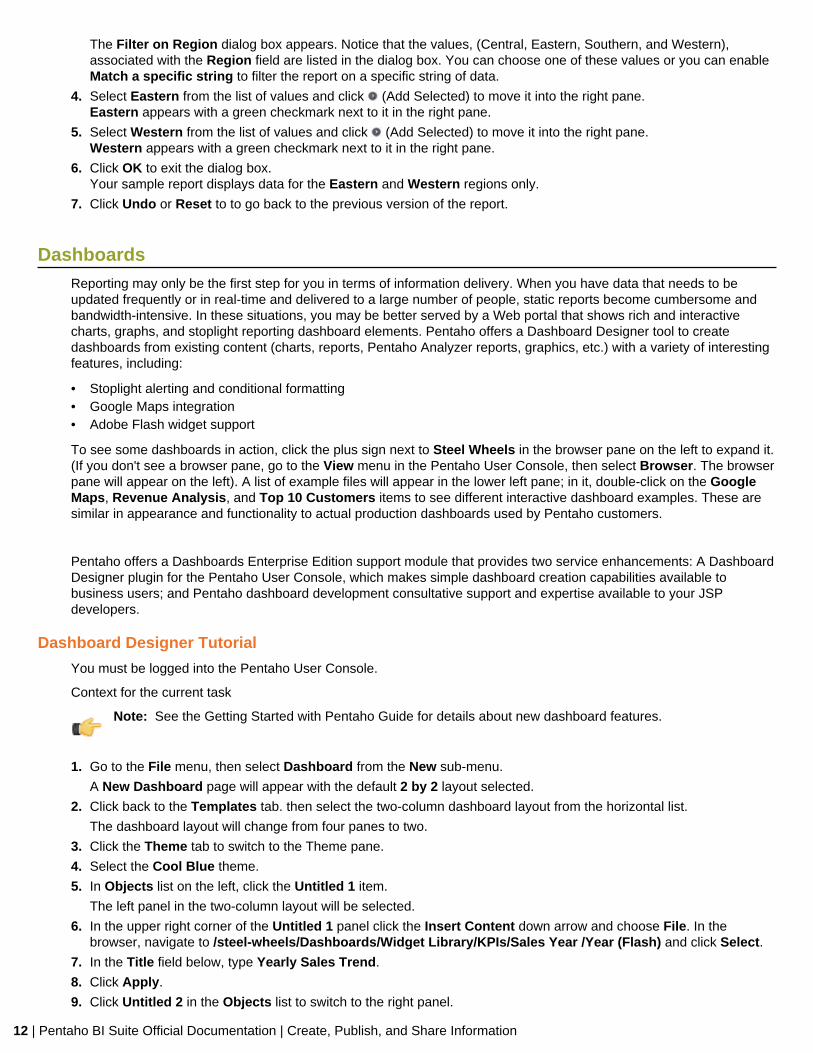
The Filter on Region dialog box appears. Notice that the values, (Central, Eastern, Southern, and Western),associated with the Region field are listed in the dialog box. You can choose one of these values or you can enableMatch a specific string to filter the report on a specific string of data.
4. Select Eastern from the list of values and click (Add Selected) to move it into the right pane.Eastern appears with a green checkmark next to it in the right pane.
5. Select Western from the list of values and click (Add Selected) to move it into the right pane.Western appears with a green checkmark next to it in the right pane.
6. Click OK to exit the dialog box.Your sample report displays data for the Eastern and Western regions only.
7. Click Undo or Reset to to go back to the previous version of the report.
DashboardsReporting may only be the first step for you in terms of information delivery. When you have data that needs to beupdated frequently or in real-time and delivered to a large number of people, static reports become cumbersome andbandwidth-intensive. In these situations, you may be better served by a Web portal that shows rich and interactivecharts, graphs, and stoplight reporting dashboard elements. Pentaho offers a Dashboard Designer tool to createdashboards from existing content (charts, reports, Pentaho Analyzer reports, graphics, etc.) with a variety of interestingfeatures, including:
• Stoplight alerting and conditional formatting• Google Maps integration• Adobe Flash widget support
To see some dashboards in action, click the plus sign next to Steel Wheels in the browser pane on the left to expand it.(If you don't see a browser pane, go to the View menu in the Pentaho User Console, then select Browser. The browserpane will appear on the left). A list of example files will appear in the lower left pane; in it, double-click on the GoogleMaps, Revenue Analysis, and Top 10 Customers items to see different interactive dashboard examples. These aresimilar in appearance and functionality to actual production dashboards used by Pentaho customers.
Pentaho offers a Dashboards Enterprise Edition support module that provides two service enhancements: A DashboardDesigner plugin for the Pentaho User Console, which makes simple dashboard creation capabilities available tobusiness users; and Pentaho dashboard development consultative support and expertise available to your JSPdevelopers.
Dashboard Designer Tutorial
You must be logged into the Pentaho User Console.
Context for the current task
Note: See the Getting Started with Pentaho Guide for details about new dashboard features.
1. Go to the File menu, then select Dashboard from the New sub-menu.
A New Dashboard page will appear with the default 2 by 2 layout selected.
2. Click back to the Templates tab. then select the two-column dashboard layout from the horizontal list.
The dashboard layout will change from four panes to two.
3. Click the Theme tab to switch to the Theme pane.
4. Select the Cool Blue theme.
5. In Objects list on the left, click the Untitled 1 item.
The left panel in the two-column layout will be selected.
6. In the upper right corner of the Untitled 1 panel click the Insert Content down arrow and choose File. In thebrowser, navigate to /steel-wheels/Dashboards/Widget Library/KPIs/Sales Year /Year (Flash) and click Select.
7. In the Title field below, type Yearly Sales Trend.
8. Click Apply.
9. Click Untitled 2 in the Objects list to switch to the right panel.
Pentaho BI Suite Official Documentation | Create, Publish, and Share Information | 13
10.In the upper right corner of the Untitled 2 panel click the Insert Content down arrow and choose File. In thebrowser, navigate to /steel-wheels/dashboards/Widget Library/KPIs/Productline Mix - Total Sales (flash) andclick Select.
11.In the Title field in the lower portion of the screen, type Product Share.
12.Click Apply.
13.Click Filters in the Objects list.
The Filter Editor will appear on the right.
14.Click the Show Filter Toolbar checkbox.
This toolbar enables user-interactive controls at the top of the dashboard.
15.Click the + in the upper right corner of the Filter Editor.
The Filter Properties dialog box appears.
16.In the Name field, type Territory.
This is display name for the filter control label.
17.Enable Display Name as Control Label if you want users to see the display name in the filter toolbar.
18.In the Filter Properties dialog, click +The List Value dialog appears.
19.Type North America into the Label field, and NA in the Value field, then click Add.
20.Add two more list values for Europe/EMEA and Asia Pacific/APAC, then click Close.
21.Click Ok in the Filter Properties dialog to finish creating the filter list.
A drop-down box will appear in the filter toolbar at the top.
22.In the Objects list, click Yearly Sales Trend.
23.In the Region line, click the down-arrow and select Territory.
24.Repeat the previous step for Product Share.
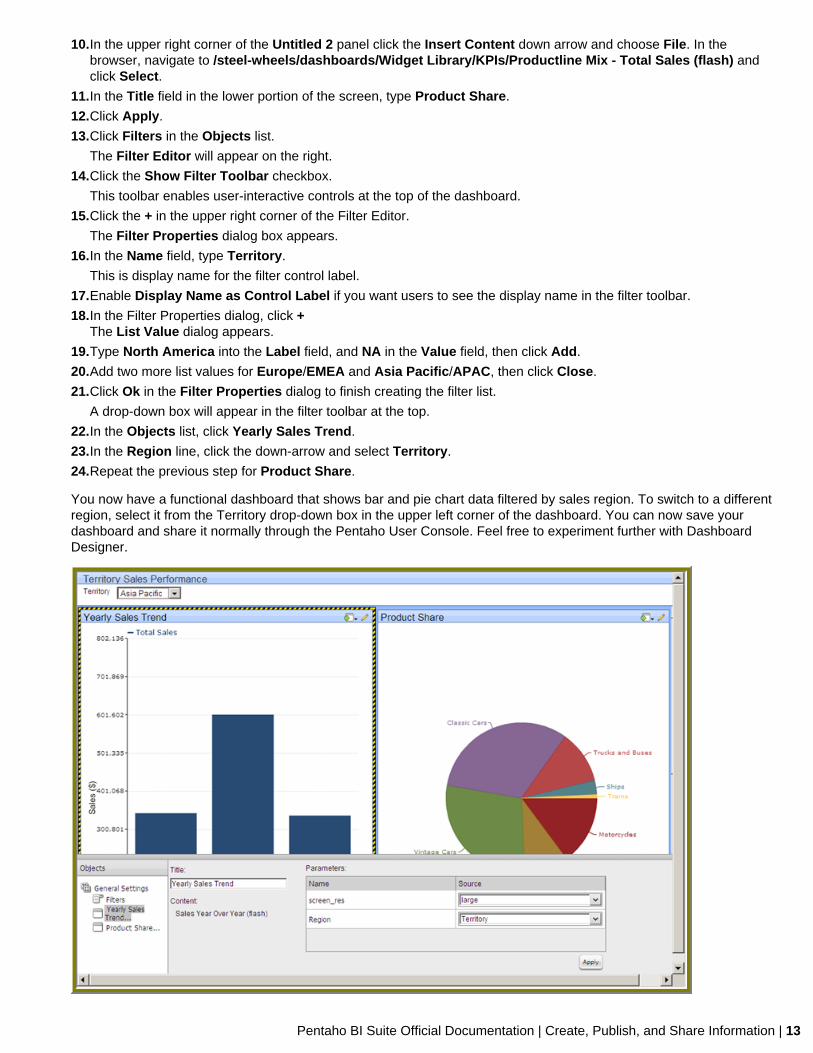
You now have a functional dashboard that shows bar and pie chart data filtered by sales region. To switch to a differentregion, select it from the Territory drop-down box in the upper left corner of the dashboard. You can now save yourdashboard and share it normally through the Pentaho User Console. Feel free to experiment further with DashboardDesigner.
14 | Pentaho BI Suite Official Documentation | Create, Publish, and Share Information
Further EvaluationThis is only a basic, business user-oriented, preliminary evaluation and as such, it only covers a small subset ofthe Pentaho BI Suite's reporting and analysis capabilities. In addition to the Pentaho User Console, the full BI Suiteincludes:
• Pentaho Enterprise Console for easy setup and maintenance of your BI solution.• Report Designer for "pixel-perfect" report creation and publishing.• Design Studio for complex fine-tuning of reports.• Metadata Editor for creating an information layer around a data source.• Schema Workbench for creating ROLAP analysis schemas.• Aggregation Designer for improving analysis cube performance.
You can try out the full BI Suite by requesting a 30-day Enterprise Edition evaluation package from your Pentaho salesrepresentative.


![[ Getting Acquainted with Pentaho Components ]reportes.fuxionbiotech.com/pentaho/docs/components.pdf · [ Getting Acquainted with Pentaho Components ]] ... Pentaho BA Suite helps](https://img.pdfslide.us/doc/110x75/5ad7ac027f8b9a991b8c5bad/-getting-acquainted-with-pentaho-components-getting-acquainted-with-pentaho-components.jpg)