Embed Size (px)
Citation preview
Using the Fall 2012 NECAP Results
New England Common Assessment Program
2
Dr. Kevon Tucker-Seeley NECAP Program Manager
Patty Carnevale Mathematics Specialist
Susan Pagliaro Mathematics Specialist
Lindsay Wepman Assessment Specialist
Jennifer Golenia Science and Technology Specialist
Welcome and RIDE Introductions
NECAP Service Center
1-877-632-7774
Elliot Dunn
NECAP Program Manager
603-749-9102, ext. 2126
3
Measured Progress Introductions
Share State results
Review the different types of NECAP reports
Find a Pattern of Need in the Fall 2012 NECAP results data
4
Goals of the Workshop
RRhhooddee IIssllaanndd’’ss NNEECCAAPP MMaatthh,, RReeaaddiinngg,, aanndd WWrriittiinngg RReessuullttss ffoorr GGrraaddeess 33--88 && 1111
October 2012 Test Administration
Supplemental Data: Class of 2012 High School Graduation Rates
Deborah A. Gist, Commissioner 255 Westminster Street Providence, RI 02903 (401) 222-4600
[v.02.01.13]
Report available online at: www.ride.ri.gov/NECAP
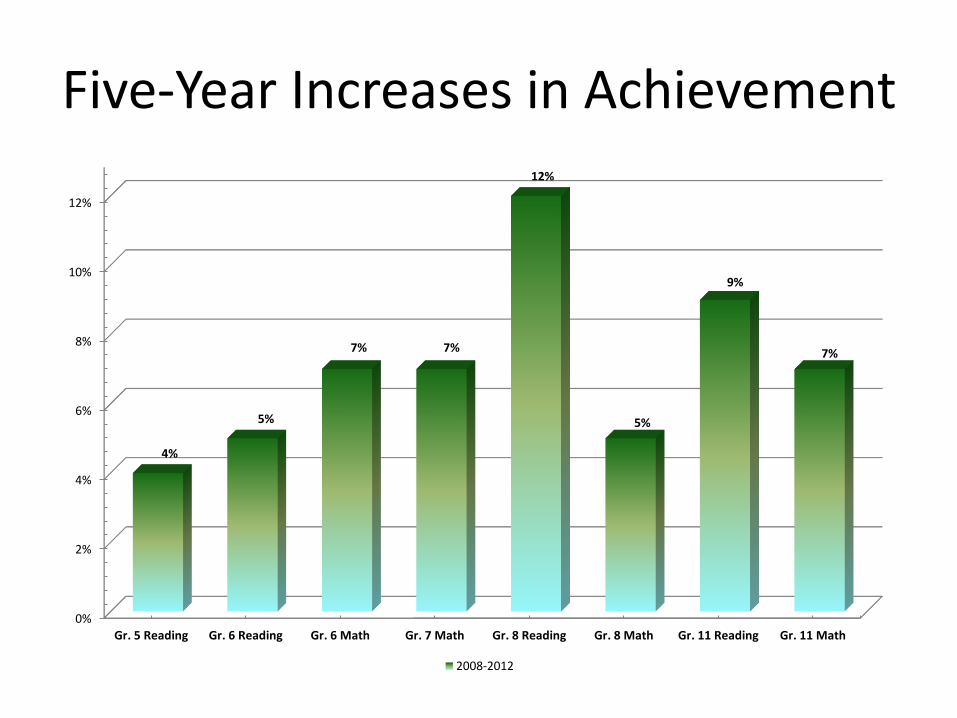
Five-Year Increases in Achievement
0%
2%
4%
6%
8%
10%
12%
Gr. 5 Reading Gr. 6 Reading Gr. 6 Math Gr. 7 Math Gr. 8 Reading Gr. 8 Math Gr. 11 Reading Gr. 11 Math
4%
5%
7% 7%
12%
5%
9%
7%
2008-2012
All student subgroups except for students with IEPs improved in Reading and Math since 2008.
Largest gains by LEP Monitored students in Reading and Math with 18 and 17 point gains respectively.
Achievement gaps in Reading and Math continue to narrow for LEP and low-income students in grades 3 and 4.
7
Student Group Performance on NECAP
Achievement gaps between student with IEPs and students without IEPs continue to widen at all grade levels in Reading and Math.
Gaps between LEP and Non-LEP students and between Low-Income and Non-Low-Income students continue to narrow since 2005 in Reading and Math for students in grades 3 and 4.
Widest gaps are found in Reading at Grade 11
8
Achievement Gaps
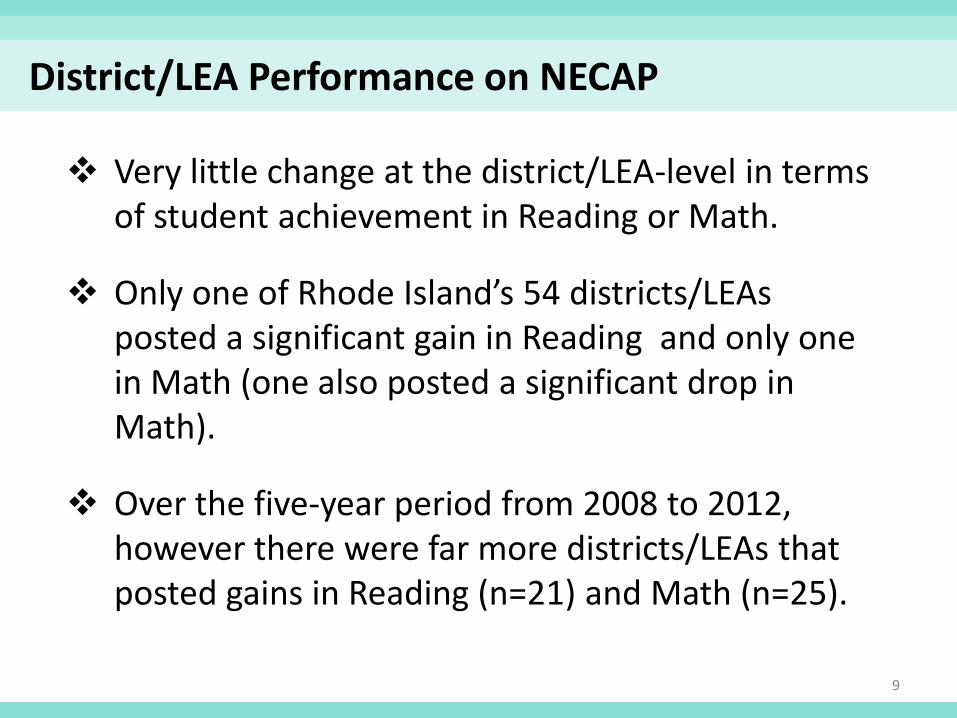
Very little change at the district/LEA-level in terms of student achievement in Reading or Math.
Only one of Rhode Island’s 54 districts/LEAs posted a significant gain in Reading and only one in Math (one also posted a significant drop in Math).
Over the five-year period from 2008 to 2012, however there were far more districts/LEAs that posted gains in Reading (n=21) and Math (n=25).
9
District/LEA Performance on NECAP
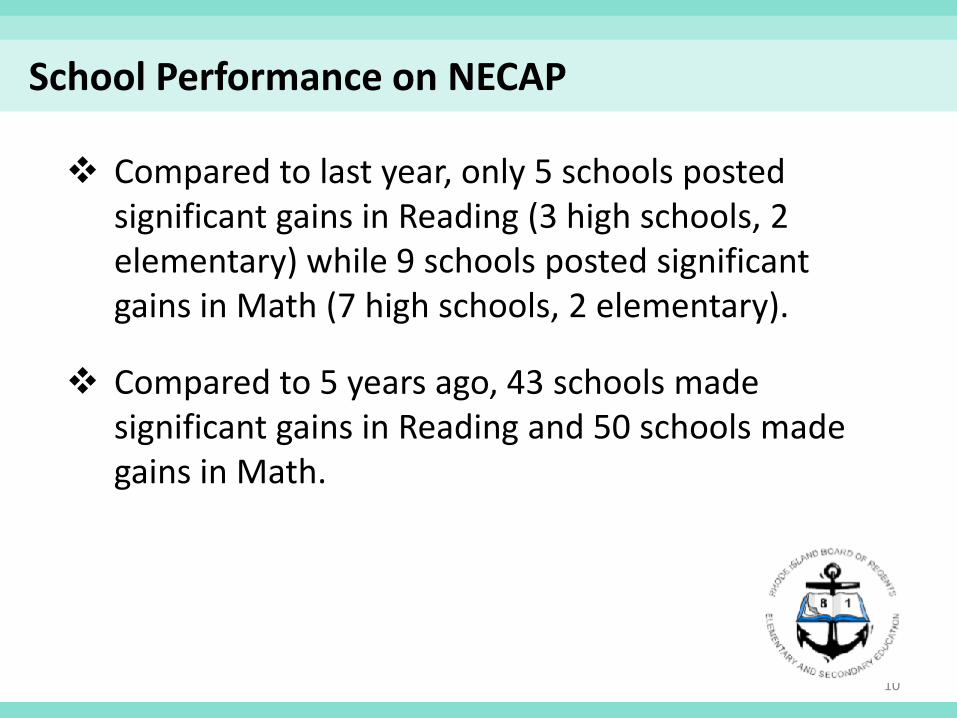
Compared to last year, only 5 schools posted significant gains in Reading (3 high schools, 2 elementary) while 9 schools posted significant gains in Math (7 high schools, 2 elementary).
Compared to 5 years ago, 43 schools made significant gains in Reading and 50 schools made gains in Math.
10
School Performance on NECAP
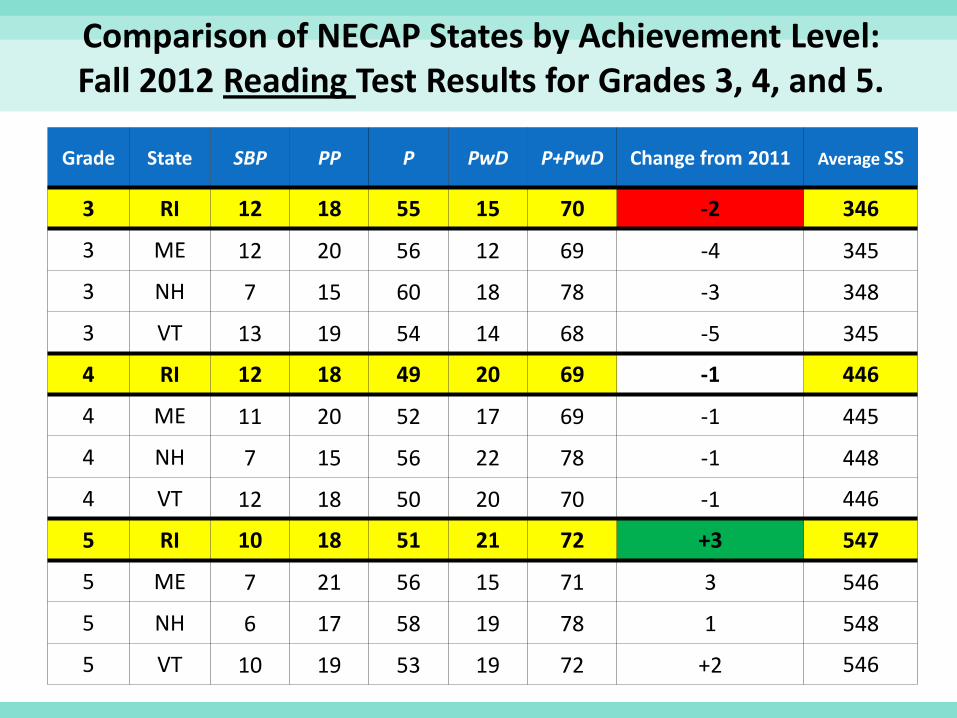
Comparison of NECAP States by Achievement Level: Fall 2012 Reading Test Results for Grades 3, 4, and 5.
Grade State SBP PP P PwD P+PwD Change from 2011 Average SS
3 RI 12 18 55 15 70 -2 346
3 ME 12 20 56 12 69 -4 345
3 NH 7 15 60 18 78 -3 348
3 VT 13 19 54 14 68 -5 345
4 RI 12 18 49 20 69 -1 446
4 ME 11 20 52 17 69 -1 445
4 NH 7 15 56 22 78 -1 448
4 VT 12 18 50 20 70 -1 446
5 RI 10 18 51 21 72 +3 547
5 ME 7 21 56 15 71 3 546
5 NH 6 17 58 19 78 1 548
5 VT 10 19 53 19 72 +2 546
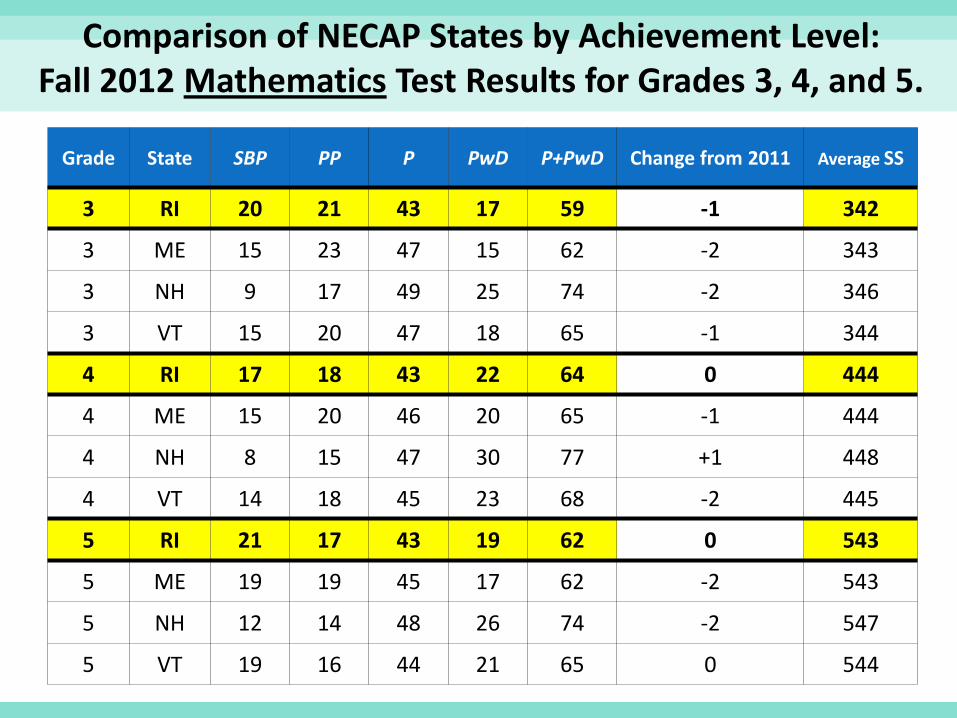
Comparison of NECAP States by Achievement Level: Fall 2012 Mathematics Test Results for Grades 3, 4, and 5.
Grade State SBP PP P PwD P+PwD Change from 2011 Average SS
3 RI 20 21 43 17 59 -1 342
3 ME 15 23 47 15 62 -2 343
3 NH 9 17 49 25 74 -2 346
3 VT 15 20 47 18 65 -1 344
4 RI 17 18 43 22 64 0 444
4 ME 15 20 46 20 65 -1 444
4 NH 8 15 47 30 77 +1 448
4 VT 14 18 45 23 68 -2 445
5 RI 21 17 43 19 62 0 543
5 ME 19 19 45 17 62 -2 543
5 NH 12 14 48 26 74 -2 547
5 VT 19 16 44 21 65 0 544
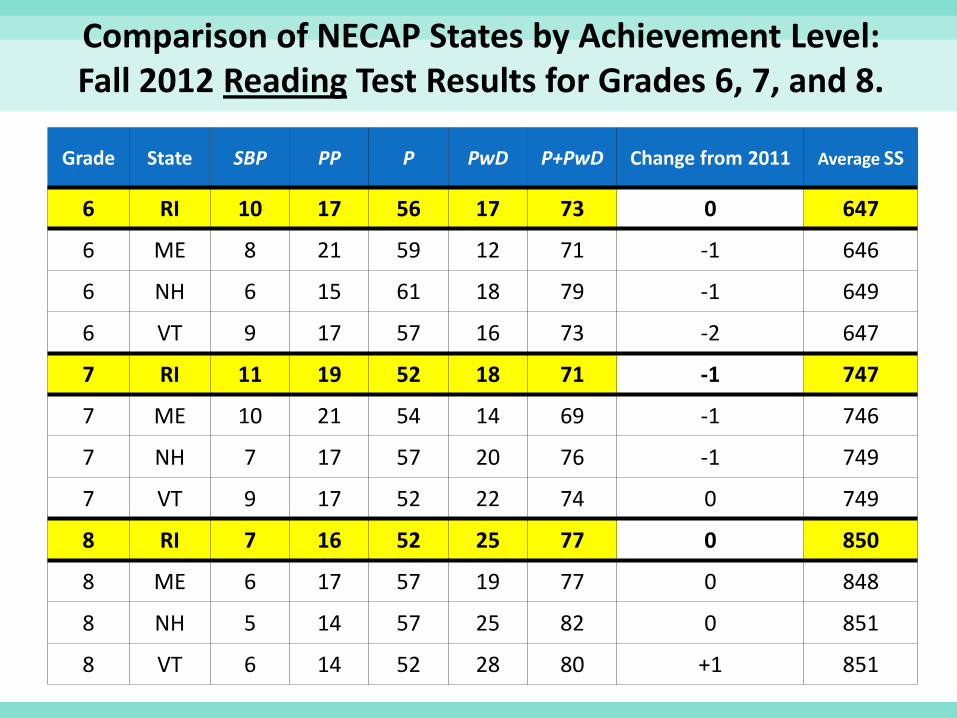
Comparison of NECAP States by Achievement Level: Fall 2012 Reading Test Results for Grades 6, 7, and 8.
Grade State SBP PP P PwD P+PwD Change from 2011 Average SS
6 RI 10 17 56 17 73 0 647
6 ME 8 21 59 12 71 -1 646
6 NH 6 15 61 18 79 -1 649
6 VT 9 17 57 16 73 -2 647
7 RI 11 19 52 18 71 -1 747
7 ME 10 21 54 14 69 -1 746
7 NH 7 17 57 20 76 -1 749
7 VT 9 17 52 22 74 0 749
8 RI 7 16 52 25 77 0 850
8 ME 6 17 57 19 77 0 848
8 NH 5 14 57 25 82 0 851
8 VT 6 14 52 28 80 +1 851
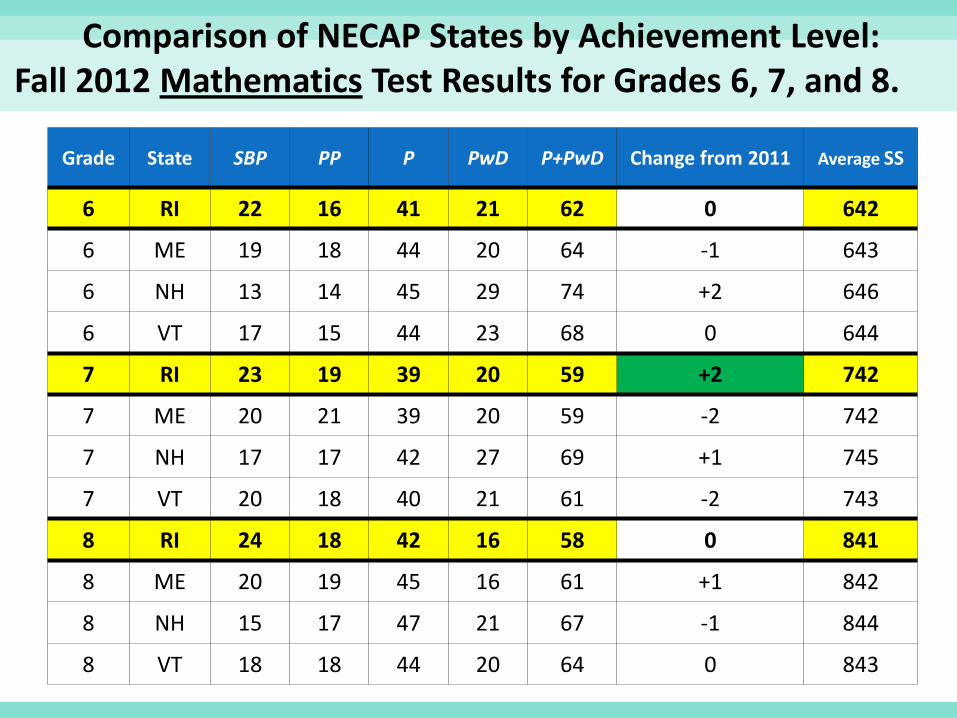
Comparison of NECAP States by Achievement Level: Fall 2012 Mathematics Test Results for Grades 6, 7, and 8.
Grade State SBP PP P PwD P+PwD Change from 2011 Average SS
6 RI 22 16 41 21 62 0 642
6 ME 19 18 44 20 64 -1 643
6 NH 13 14 45 29 74 +2 646
6 VT 17 15 44 23 68 0 644
7 RI 23 19 39 20 59 +2 742
7 ME 20 21 39 20 59 -2 742
7 NH 17 17 42 27 69 +1 745
7 VT 20 18 40 21 61 -2 743
8 RI 24 18 42 16 58 0 841
8 ME 20 19 45 16 61 +1 842
8 NH 15 17 47 21 67 -1 844
8 VT 18 18 44 20 64 0 843
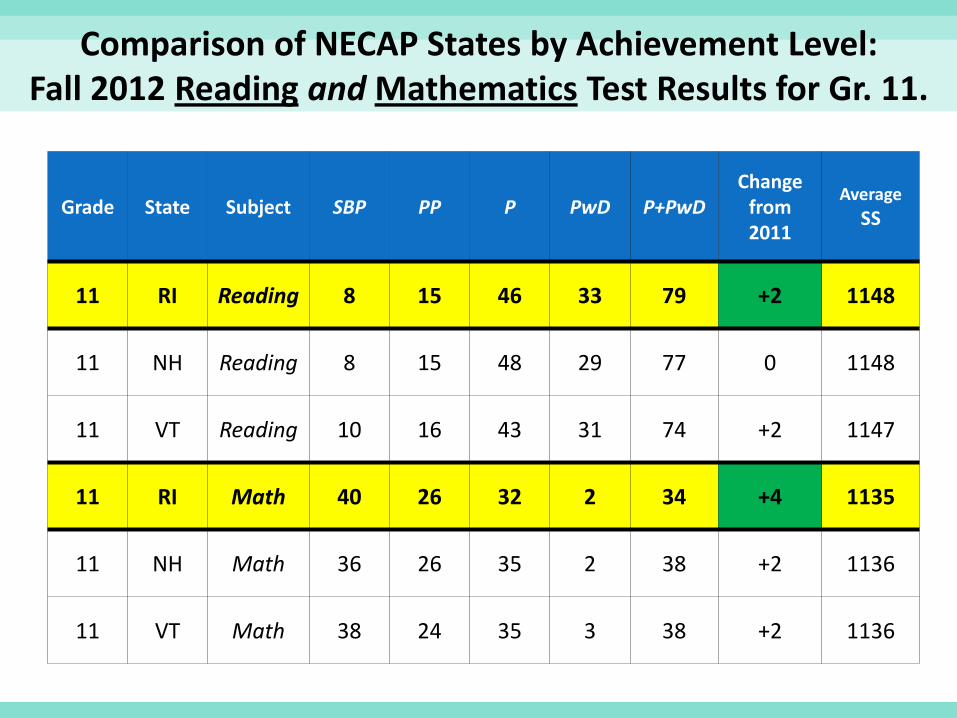
Comparison of NECAP States by Achievement Level: Fall 2012 Reading and Mathematics Test Results for Gr. 11.
Grade State Subject SBP PP P PwD P+PwD Change
from 2011
Average
SS
11 RI Reading 8 15 46 33 79 +2 1148
11 NH Reading 8 15 48 29 77 0 1148
11 VT Reading 10 16 43 31 74 +2 1147
11 RI Math 40 26 32 2 34 +4 1135
11 NH Math 36 26 35 2 38 +2 1136
11 VT Math 38 24 35 3 38 +2 1136
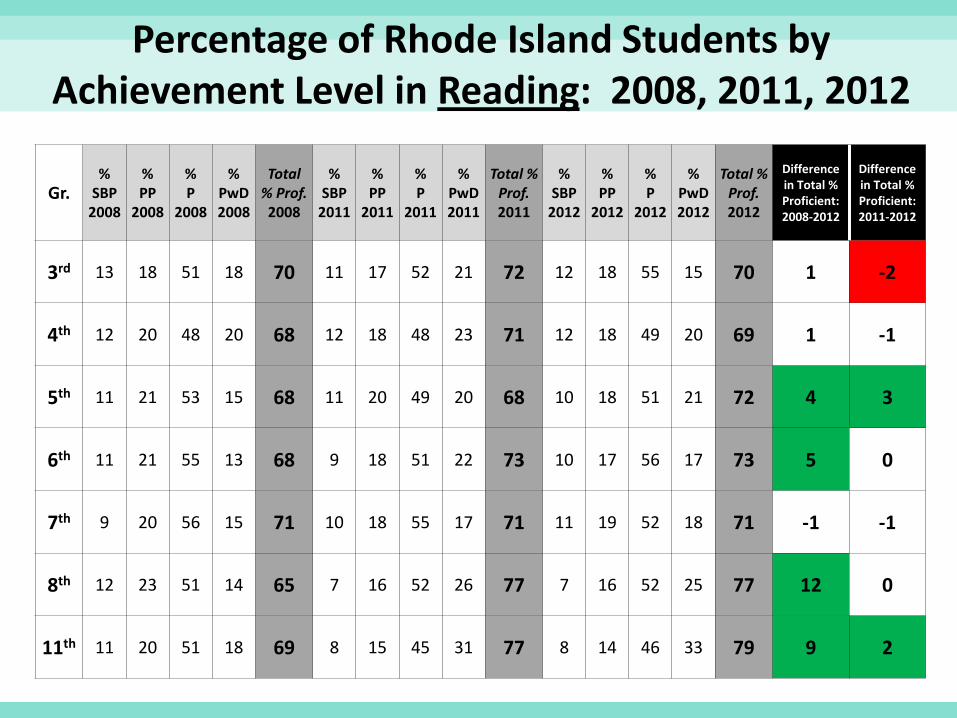
Percentage of Rhode Island Students by Achievement Level in Reading: 2008, 2011, 2012
Gr. %
SBP 2008
% PP
2008
% P
2008
% PwD 2008
Total % Prof. 2008
% SBP
2011
% PP
2011
% P
2011
% PwD 2011
Total % Prof. 2011
% SBP
2012
% PP
2012
% P
2012
% PwD 2012
Total % Prof. 2012
Difference in Total % Proficient: 2008-2012
Difference in Total % Proficient: 2011-2012
3rd 13 18 51 18 70 11 17 52 21 72 12 18 55 15 70 1 -2
4th 12 20 48 20 68 12 18 48 23 71 12 18 49 20 69 1 -1
5th 11 21 53 15 68 11 20 49 20 68 10 18 51 21 72 4 3
6th 11 21 55 13 68 9 18 51 22 73 10 17 56 17 73 5 0
7th 9 20 56 15 71 10 18 55 17 71 11 19 52 18 71 -1 -1
8th 12 23 51 14 65 7 16 52 26 77 7 16 52 25 77 12 0
11th 11 20 51 18 69 8 15 45 31 77 8 14 46 33 79 9 2
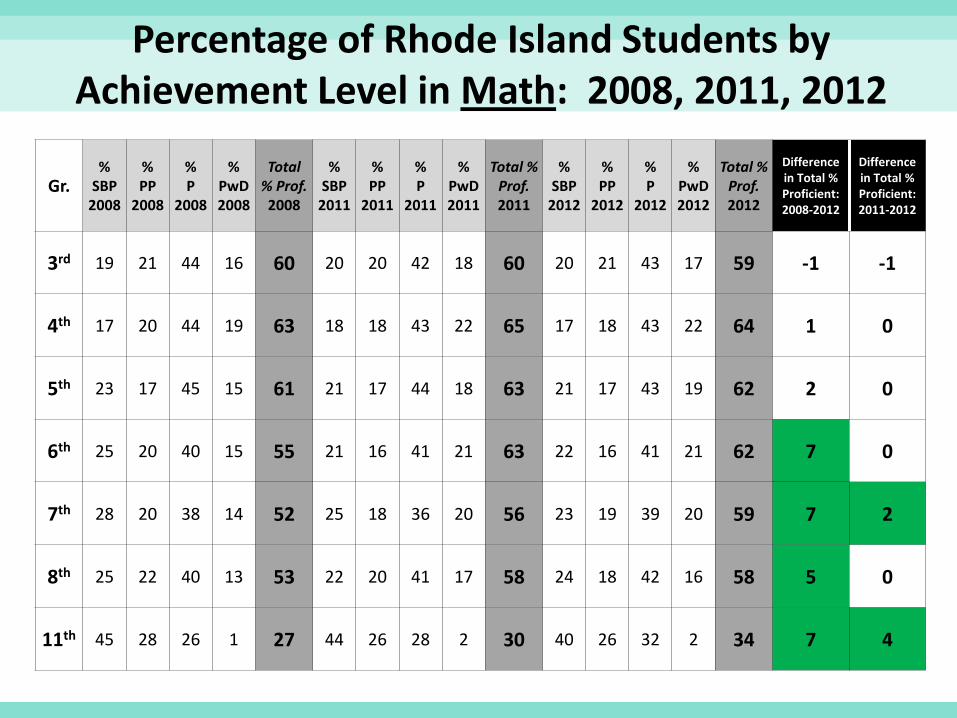
Percentage of Rhode Island Students by Achievement Level in Math: 2008, 2011, 2012
Gr. %
SBP 2008
% PP
2008
% P
2008
% PwD 2008
Total % Prof. 2008
% SBP
2011
% PP
2011
% P
2011
% PwD 2011
Total % Prof. 2011
% SBP
2012
% PP
2012
% P
2012
% PwD 2012
Total % Prof. 2012
Difference in Total % Proficient: 2008-2012
Difference in Total % Proficient: 2011-2012
3rd 19 21 44 16 60 20 20 42 18 60 20 21 43 17 59 -1 -1
4th 17 20 44 19 63 18 18 43 22 65 17 18 43 22 64 1 0
5th 23 17 45 15 61 21 17 44 18 63 21 17 43 19 62 2 0
6th 25 20 40 15 55 21 16 41 21 63 22 16 41 21 62 7 0
7th 28 20 38 14 52 25 18 36 20 56 23 19 39 20 59 7 2
8th 25 22 40 13 53 22 20 41 17 58 24 18 42 16 58 5 0
11th 45 28 26 1 27 44 26 28 2 30 40 26 32 2 34 7 4
3rd and 4th grade students’ performance in both Reading and Math has remained flat since 2008.
7th graders’ performance in Reading and 5th graders’ performance in Math has not changed significantly either.
Students with IEPs were the only student group to post a significant decrease in Math since 2008.
18
Areas of Concern
Achievement gaps continue to widen between students with IEPs and their peers.
Low income and LEP student achievement gaps have widened to 71 percentage points in Reading for 11th graders.
Since 2005, gaps have generally widened in all grades except 3 and 4 for LEP and low-income students on the Reading and Math tests.
19
Areas of Concern (continued)
20
Workshop Reference Materials
21
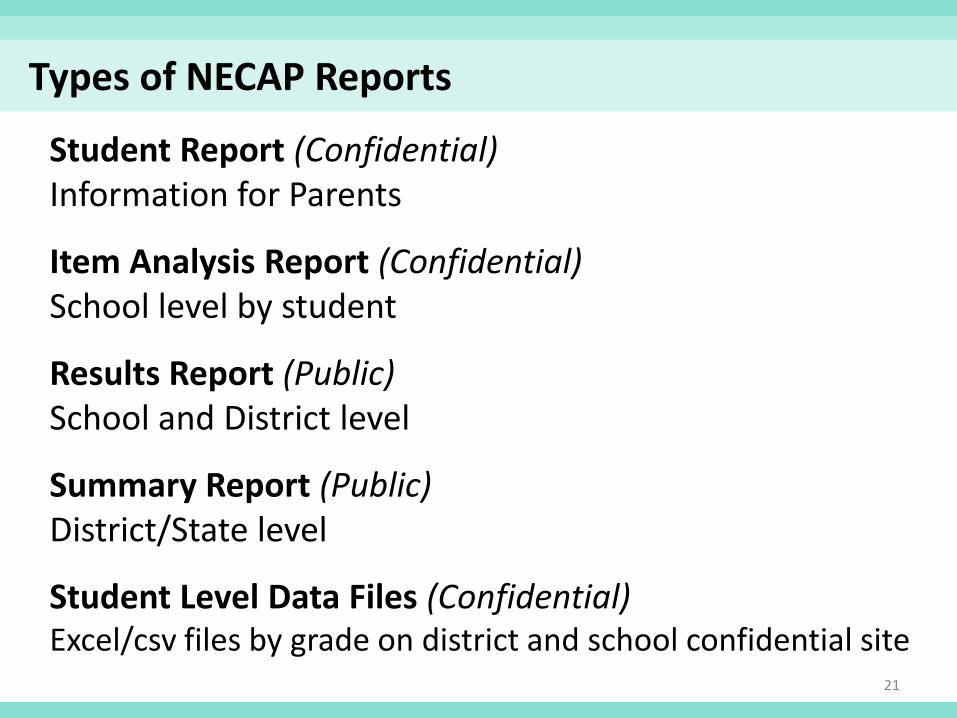
Types of NECAP Reports
Student Report (Confidential) Information for Parents
Item Analysis Report (Confidential) School level by student
Results Report (Public) School and District level
Summary Report (Public) District/State level
Student Level Data Files (Confidential) Excel/csv files by grade on district and school confidential site
22
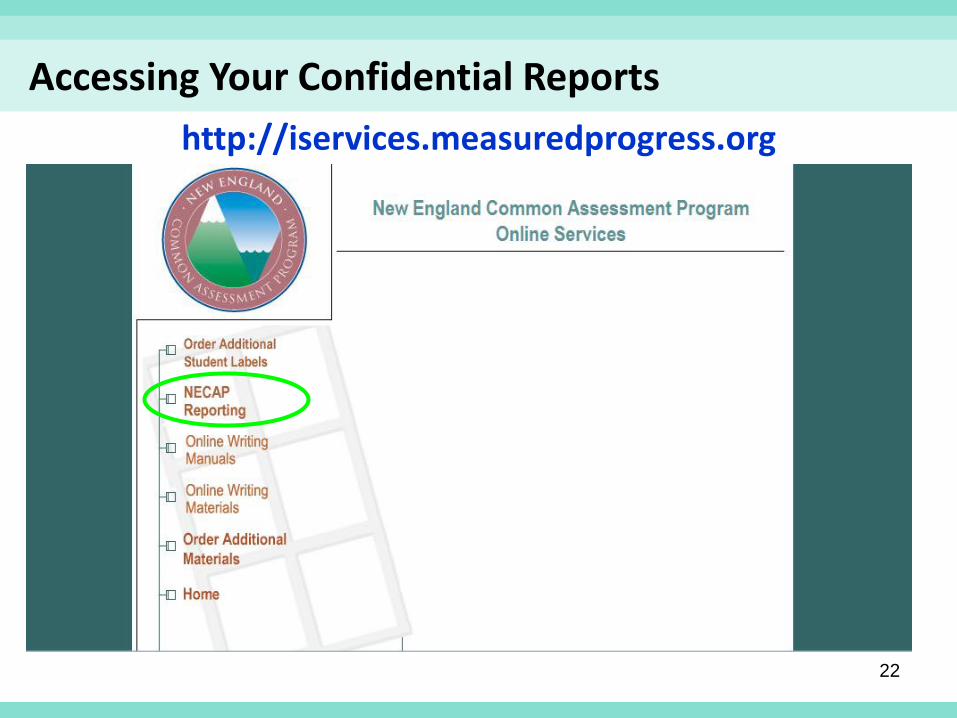
Accessing Your Confidential Reports
http://iservices.measuredprogress.org
Select
“Interactive”
to view
Interactive
Reports
23
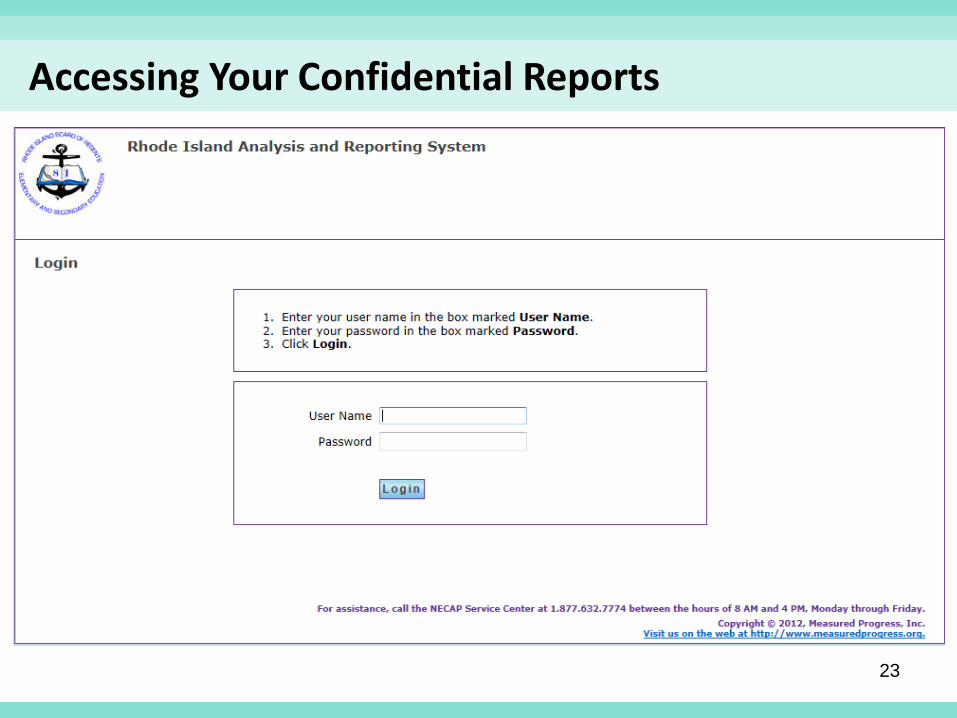
Accessing Your Confidential Reports
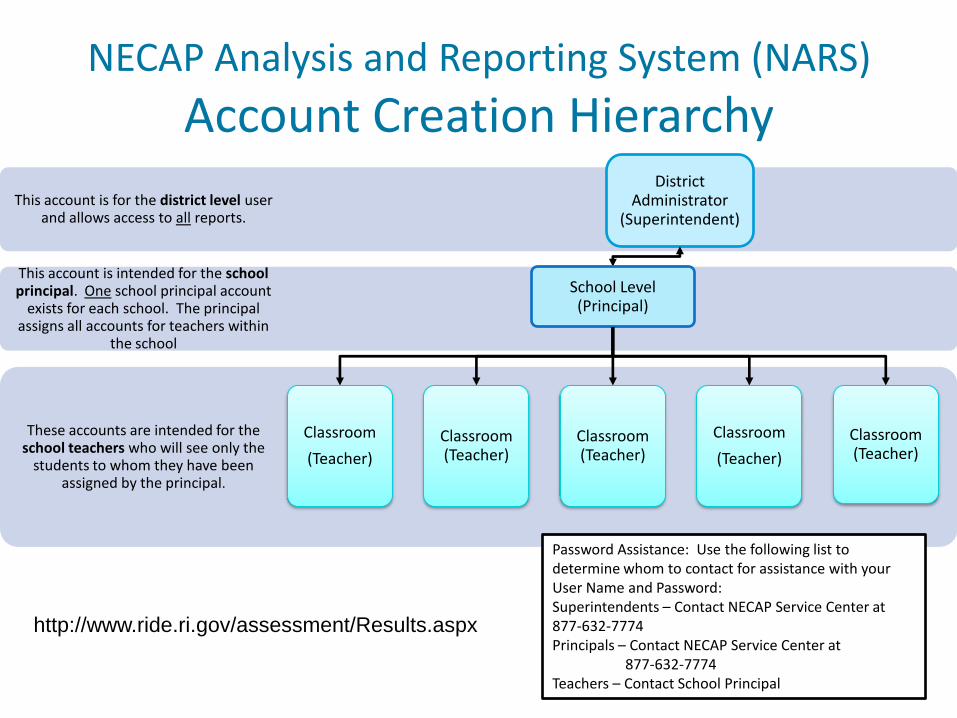
These accounts are intended for the school teachers who will see only the
students to whom they have been assigned by the principal.
This account is intended for the school principal. One school principal account
exists for each school. The principal assigns all accounts for teachers within
the school
This account is for the district level user and allows access to all reports.
District Administrator
(Superintendent)
School Level (Principal)
Classroom
(Teacher)
Classroom (Teacher)
Classroom (Teacher)
Classroom
(Teacher)
Classroom (Teacher)
NECAP Analysis and Reporting System (NARS)
Account Creation Hierarchy
Password Assistance: Use the following list to determine whom to contact for assistance with your User Name and Password: Superintendents – Contact NECAP Service Center at 877-632-7774 Principals – Contact NECAP Service Center at 877-632-7774 Teachers – Contact School Principal
http://www.ride.ri.gov/assessment/Results.aspx
Introductions
• Lindsay Wepman, RTTT Assessment Specialist
• Project Lead on the Data Use Professional Development Series
– 10-day training series on the use of data to inform instruction
– Off-site workshops within small cohorts and on-site coaching visits for tailored follow-up
– Tiered training to best meet the needs of RI educators
– RIDE partnered with Wireless Generation to develop and deliver the professional development
Using NECAP Data
Today’s Goals:
• Engage in a Data Conversation on Fall 2012 NECAP results
• Utilize the Cycle of Inquiry to find a Pattern of Need
• Learn tools to engage educators in low-stakes data conversations
Aligned to Data Use Professional Development Series
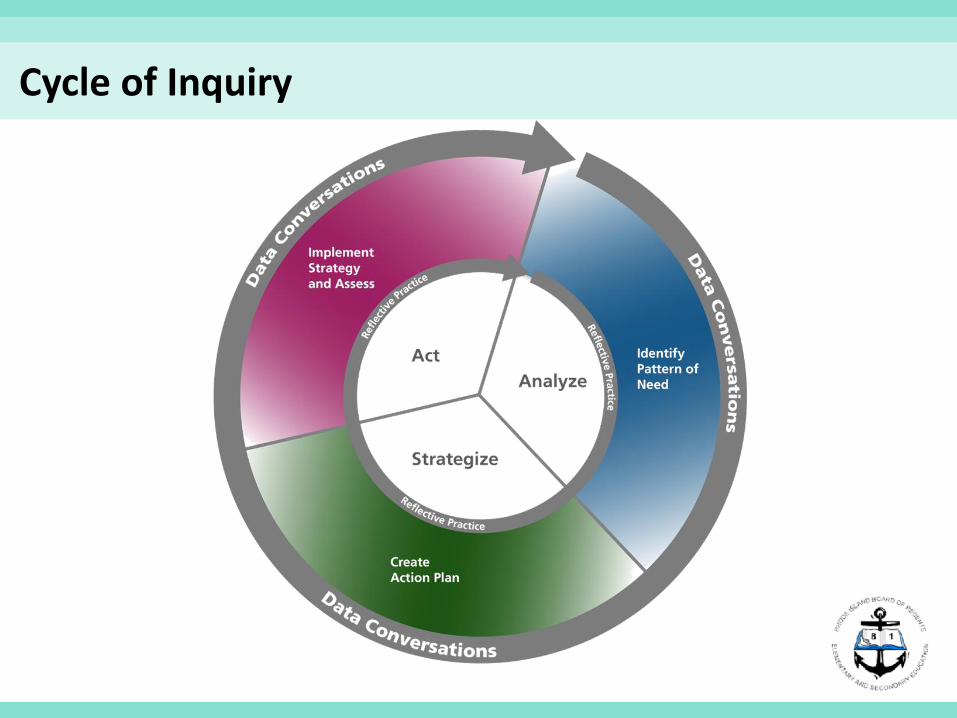
Cycle of Inquiry
Why Low Stakes?
• Looking for a Pattern of Need allows us to look at groups of students, not individual students
• Talking about data can feel personal to an educator, but the focus is on student achievement
Finding a “Pattern of Need”
Materials:
• Pen/pencil
• NECAP Item Analysis Report
– Math
– Demo Data
• Legend for the Item Analysis Reports
Finding a “Pattern of Need”
Step 1 – Lower the Stakes
• Start with small, manageable chunks
• Fold back the left side of the report – Student Names
• Fold back the right side of the report – Total Test Results
• Fold back the bottom of the report - Comparisons
Finding a “Pattern of Need”
Step 2 – Become Familiar with the Data
NOTE: Use the legend to orient yourself to the data set.
Key Observations:
• Item Type
• Total Possible Points
• Rows vs. Columns
Finding a “Pattern of Need”
Step 3 – Visualize the Data
Using your pen/pencil, focus on finding a Pattern of Need within an area of interest.
Remember, Patterns of Need do not have to be challenge areas; you may find a pattern of strength, signifying a need for enrichment!
EXAMPLE 1: Circle all the zero responses.
EXAMPLE 2: Circle all the highest scores possible.
Finding a “Pattern of Need”
Step 4 – Examine Patterns in the Data
• High Level View – what do you first notice?
• Identify characteristics of the Pattern of Need
EXAMPLE 1: The Pattern of Need that I discovered is that most Short Answer responses received a score of 1.
EXAMPLE 2: The Pattern of Need that I found is that a majority of Constructed Response answers did not receive full credit.
Finding a “Pattern of Need”
Next Steps
• Look at the items for more information.
• Create a working hypothesis for the cause of the Pattern of Need based on evidence.
• Validate (or refute) the findings using other relevant data sources.
– District benchmark assessments
– Common tasks
– Teacher observations
– Results from formative assessment practices
“Turnkey” with Educators
• Access and print the Item Analysis Report and corresponding Released Items via NARS
• Consider your audience
– With whom will you share this exercise?
– Remember FERPA!
• Find a Pattern of Need in your school’s own data
• Keep it “low stakes”
28
RIDE Contact Information
NECAP: Dr. Kevon Tucker-Seeley Office of Instruction, Assessment & Accountability
401-222-8494
Data Use: Lindsay Wepman Office of Instruction, Assessment & Accountability
401-222-8254
Mathematics: Patty Carnevale Office of Instruction, Assessment & Accountability
401-222-8458
Mathematics: Susan Pagliaro Office of Instruction, Assessment & Accountability
401-222-2644