Embed Size (px)
Citation preview
Strojarstvo 50 (5) 269-276 (2008) H. WOLF et. al., Using the Energy Balance Method in Estimation... 269
CODEN STJSAO ISSN 0562-1887 ZX470/1351 UDK 62(05)=862=20=30
Original scientific paperThis paper considers using the Energy Balance Method for estimation of overhead transmission line Aeolian vibrations. Since the damper’s efficiency strongly depends on its position, the procedure of determining the optimum position of the damper is described. It is observed that the optimal damper position depends on the span length also and that the best results can be achieved by determining the damper position for each span inside the line section. In order to examine the accuracy of the developed computational program, as well as correctness of the estimation of the data used (wind power, data on the damper’s mechanical impedance, and mechanical characteristics of the conductor), numerical results generated using the developed computer program and data from field measurements (before and after the application of Stockbridge dampers) are compared. A very high correlation between these data has been observed.
Primjena metode ravnoteže energija u procjeni eolskih vibracija dalekovoda
Izvornoznanstveni članakU ovome radu razmatrana je primjena metode ravnoteže energija za procjenu eolskih vibracija dalekovoda. Kako efikasnost prigušivača vibracija u velikoj mjeri ovisi o njegovu položaju, u radu je opisan postupak za određivanje optimalnog položaja prigušivača. Uočeno je da njegov optimalni položaj također ovisi o dužini raspona, te da se najbolji rezultati postižu određivanjem položaja prigušivača za svaki raspon unutar razmatranog rasponskog polja. Radi provjere preciznosti razvijenog računalnog programa i ispravnosti procjene korištenih podataka (podaci o snazi vjetra, mehaničkoj impedanciji prigušivača i mehaničkim svojstvima vodiča) uspoređeni su numerički podaci koji su dobiveni razvijenim računalnim programom s podacima koji su prikupljeni tijekom terenskih mjerenja (prije i poslije montaže prigušivača tipa Stockbridge na vodič dalekovoda). Uočeno je vrlo dobro poklapanje numeričkih i izmjerenih podataka.
Hinko WOlF1), Boris AduM2),
damir SeMenSKi1) and dragan PuSTAić1)
1) Fakultet strojarstva i brodogradnje, Sveučilište u Zagrebu (Faculty of Mechanical Engineering and Naval Architecture, University of Zagreb), Ivana Lučića 5, HR - 10000 Zagreb Republic of Croatia
2) Dalekovod d.d., Marijana Čavića 4, HR - 10000 Zagreb Republic of Croatia
KeywordsEnergy balance method Measuring of Aeolian vibrations Overhead transmission line Aeolian vibrations
Ključne riječiEolske vibracije dalekovoda Metoda ravnoteže energija Mjerenje eolskih vibracija
Received (primljeno): 2008-01-30 Accepted (prihvaćeno): 2008-07-15
Using the Energy Balance Method in Estimation of Overhead Transmission Line Aeolian Vibrations
1. Introduction
Aeolian vibrations of overhead transmission line conductors (wind-induced vibrations due to the shedding of Von Karman vortices) are usually noticed at frequencies 5-50 Hz. These vibrations can cause damage and break the conductor due to material fatigue, and can significantly shorten its lifetime. Even though Stockbridge vibration dampers have been used for damping of Aeolian vibrations relatively successfully since 1930, a vibration model that would adequately describe this phenomenon is still under development. The mechanism of forming and shedding of Von Karman vortices is a very complicated aero-elastic phenomenon, and the empirical data on the
influence of the wind force on the conductor, as well as on the power thus entering the system differ significantly from source to source [1, 2]. In practice, this is even more complicated, since the data on the characteristics of the air flows on any given location (the velocity and direction of the air flow, turbulence in the fluid flow) are, as a rule, unknown [2]. Moreover, the mechanical characteristics of the conductor (bending stiffness, the characteristic bending diameter and conductor self-damping) depend on a number of parameters (the construction of the conductor, conductor tension, vibration frequency and amplitudes, temperature), and are difficult to estimate [3, 4]. Overhead transmission line Aeolian vibrations are most often estimated in practice by using the Energy
270 H. WOLF et. al., Using the Energy Balance Method in Estimation... Strojarstvo 50 (5) 269-276 (2008)
Balance Method [4-9] which is based on a non-linear algebraic equation of power balance among the power of aerodynamic forces brought into the system (for a given wind velocity), the power dissipated by the vibration damper and the power dissipated by the conductor due to conductor’s self-damping. The damper efficiency strongly depends on the interaction between the damper (characterized by damper impedance and damper location on the conductor) and the oscillating conductor (characterized by its tensile load and mass per unit length). This paper considers using the Energy Balance Method for estimation of overhead transmission line Aeolian vibrations, as well as determining the optimum Stockbridge-type damper position.
2. Vibration model
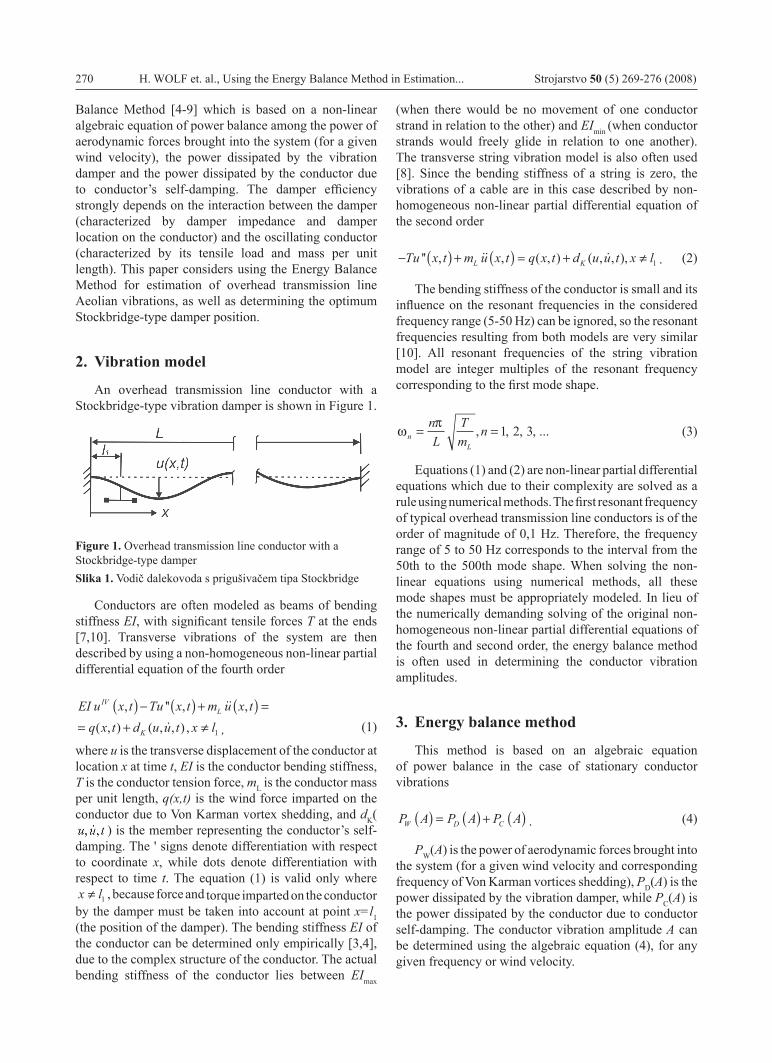
An overhead transmission line conductor with a Stockbridge-type vibration damper is shown in Figure 1.
Figure 1. Overhead transmission line conductor with a Stockbridge-type damperSlika 1. Vodič dalekovoda s prigušivačem tipa Stockbridge
Conductors are often modeled as beams of bending stiffness EI, with significant tensile forces T at the ends [7,10]. Transverse vibrations of the system are then described by using a non-homogeneous non-linear partial differential equation of the fourth order
EI u x t Tu x t m u x tq x t d u u t x l
IVL
K
, '' , ,( , ) ( , , ) ,
( ) − ( ) + ( ) == + ≠
1 (1)
where u is the transverse displacement of the conductor at location x at time t, EI is the conductor bending stiffness, T is the conductor tension force, mL is the conductor mass per unit length, q(x,t) is the wind force imparted on the conductor due to Von Karman vortex shedding, and dK(
) is the member representing the conductor’s self-damping. The ' signs denote differentiation with respect to coordinate x, while dots denote differentiation with respect to time t. The equation (1) is valid only where x l≠ 1 , because force and torque imparted on the conductor by the damper must be taken into account at point x=l1 (the position of the damper). The bending stiffness EI of the conductor can be determined only empirically [3,4], due to the complex structure of the conductor. The actual bending stiffness of the conductor lies between EImax
(when there would be no movement of one conductor strand in relation to the other) and EImin (when conductor strands would freely glide in relation to one another). The transverse string vibration model is also often used [8]. Since the bending stiffness of a string is zero, the vibrations of a cable are in this case described by non-homogeneous non-linear partial differential equation of the second order
− ( ) + ( ) = + ≠Tu x t m u x t q x t d u u t x lL K'' , , ( , ) ( , , ), 1 . (2)
The bending stiffness of the conductor is small and its influence on the resonant frequencies in the considered frequency range (5-50 Hz) can be ignored, so the resonant frequencies resulting from both models are very similar [10]. All resonant frequencies of the string vibration model are integer multiples of the resonant frequency corresponding to the first mode shape.
ωπ
nL
nL
Tm
n= =, , , , ...1 2 3 (3)
Equations (1) and (2) are non-linear partial differential equations which due to their complexity are solved as a rule using numerical methods. The first resonant frequency of typical overhead transmission line conductors is of the order of magnitude of 0,1 Hz. Therefore, the frequency range of 5 to 50 Hz corresponds to the interval from the 50th to the 500th mode shape. When solving the non-linear equations using numerical methods, all these mode shapes must be appropriately modeled. In lieu of the numerically demanding solving of the original non-homogeneous non-linear partial differential equations of the fourth and second order, the energy balance method is often used in determining the conductor vibration amplitudes.
3. Energy balance method
This method is based on an algebraic equation of power balance in the case of stationary conductor vibrations
P A P A P AW D C( ) = ( ) + ( ) . (4)
PW(A) is the power of aerodynamic forces brought into the system (for a given wind velocity and corresponding frequency of Von Karman vortices shedding), PD(A) is the power dissipated by the vibration damper, while PC(A) is the power dissipated by the conductor due to conductor self-damping. The conductor vibration amplitude A can be determined using the algebraic equation (4), for any given frequency or wind velocity.
,
Strojarstvo 50 (5) 269-276 (2008) H. WOLF et. al., Using the Energy Balance Method in Estimation... 271
3.1. Power brought into the system by aerodynamical forces
There is little relevant information about the magnitude of aerodynamic forces, even for the simplest case, i.e. the stationary laminar air flow perpendicular to the conductor. The issue becomes even more complex if the conductor vibration amplitudes are large (up to one conductor diameter), if the fluid flow isn’t perpendicular to the conductor, or the fluid flow is turbulent. The frequency of the dynamic force of the wind on the conductor is equal to the frequency of the shedding of Von Karman vortices
fc vDS= , (5)
where cS is the Strouhal number (cS≈0,18–0,22), D is the conductor diameter, and v is the air flow velocity in the direction perpendicular to the conductor’s longitudinal axis. The maximum power brought into the system by aerodynamical forces with stationary laminar air flow perpendicular to the conductor, is determined using empirically derived equations. Most of those equations are written in the following form:
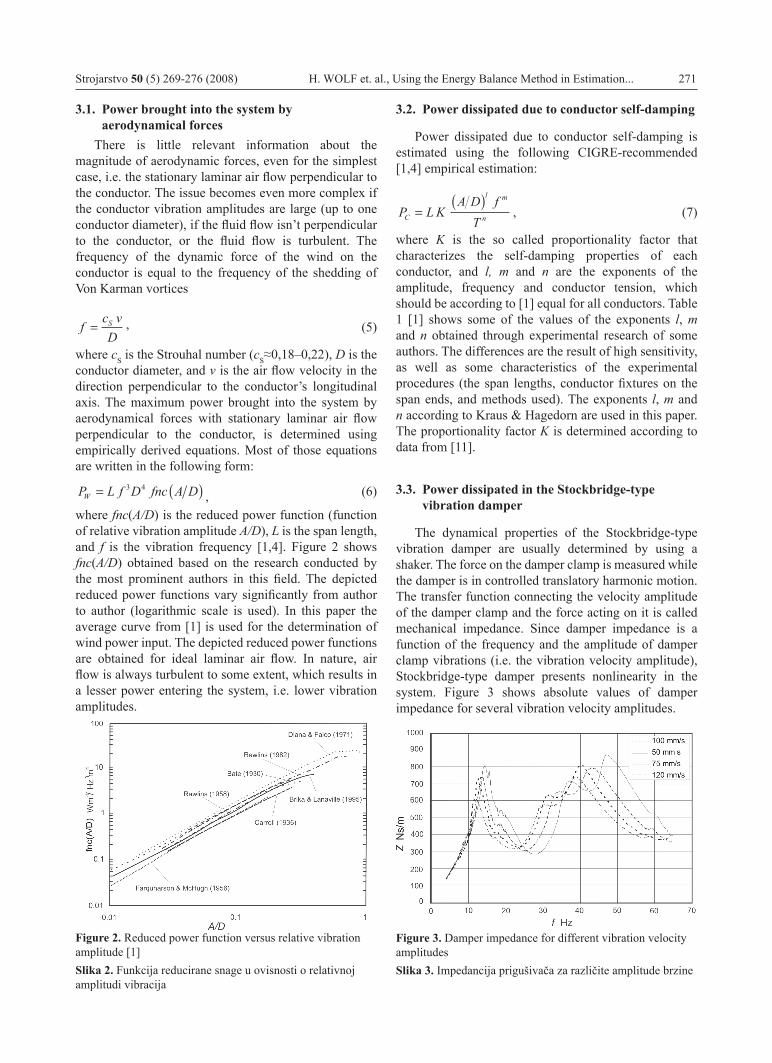
P L f D fnc A DW = ( )3 4, (6)
where fnc(A/D) is the reduced power function (function of relative vibration amplitude A/D), L is the span length, and f is the vibration frequency [1,4]. Figure 2 shows fnc(A/D) obtained based on the research conducted by the most prominent authors in this field. The depicted reduced power functions vary significantly from author to author (logarithmic scale is used). In this paper the average curve from [1] is used for the determination of wind power input. The depicted reduced power functions are obtained for ideal laminar air flow. In nature, air flow is always turbulent to some extent, which results in a lesser power entering the system, i.e. lower vibration amplitudes.
3.2. Power dissipated due to conductor self-damping
Power dissipated due to conductor self-damping is estimated using the following CIGRE-recommended [1,4] empirical estimation:
P L KA D f
TC
l m
n=( )
, (7)
where K is the so called proportionality factor that characterizes the self-damping properties of each conductor, and l, m and n are the exponents of the amplitude, frequency and conductor tension, which should be according to [1] equal for all conductors. Table 1 [1] shows some of the values of the exponents l, m and n obtained through experimental research of some authors. The differences are the result of high sensitivity, as well as some characteristics of the experimental procedures (the span lengths, conductor fixtures on the span ends, and methods used). The exponents l, m and n according to Kraus & Hagedorn are used in this paper. The proportionality factor K is determined according to data from [11].
3.3. Power dissipated in the Stockbridge-type vibration damper
The dynamical properties of the Stockbridge-type vibration damper are usually determined by using a shaker. The force on the damper clamp is measured while the damper is in controlled translatory harmonic motion. The transfer function connecting the velocity amplitude of the damper clamp and the force acting on it is called mechanical impedance. Since damper impedance is a function of the frequency and the amplitude of damper clamp vibrations (i.e. the vibration velocity amplitude), Stockbridge-type damper presents nonlinearity in the system. Figure 3 shows absolute values of damper impedance for several vibration velocity amplitudes.
Figure 3. Damper impedance for different vibration velocity amplitudesSlika 3. Impedancija prigušivača za različite amplitude brzine
Figure 2. Reduced power function versus relative vibration amplitude [1]Slika 2. Funkcija reducirane snage u ovisnosti o relativnoj amplitudi vibracija
272 H. WOLF et. al., Using the Energy Balance Method in Estimation... Strojarstvo 50 (5) 269-276 (2008)
Power dissipated in the damper is calculated using equations given in [6,12,13]
P Tc kh gh g
D ADD w=
− +( )+ +
14
1
12
2 2
2 22
2
, (8)
where
hkl kl
kl kl kl= −
+( )+ + +( )
sin sin sinsin sin sin
21 1
21
21 1
2 22
γ αγ γ α
,
gkl kl klkl kl kl
=+ +
+ + +sin cos sin sinsin sin sin
21 1
21
21
21 1
2 22
γ γ αγ γ αα( ) ,
k f m TL= 2π / is the wave number, cW is the wave
velocity, ( c T mw L2 = ), , Z is the absolute
value of damper impedance, α is the phase angle of the lag between the force and velocity, and l1 is the distance between the damper and the suspension clamp.
3.4. Conductor bending strain
Although the bending stiffness of the conductor is small and does not significantly impact on the resonant frequencies, it is necessary to know its value to determine the bending strain ε. The conductor strain cannot be directly determined from the results of equation (2). Expressions for conductor strain at characteristic points along the span (middle of the span, at the suspension clamp and at the damper clamp) are derived using perturbation
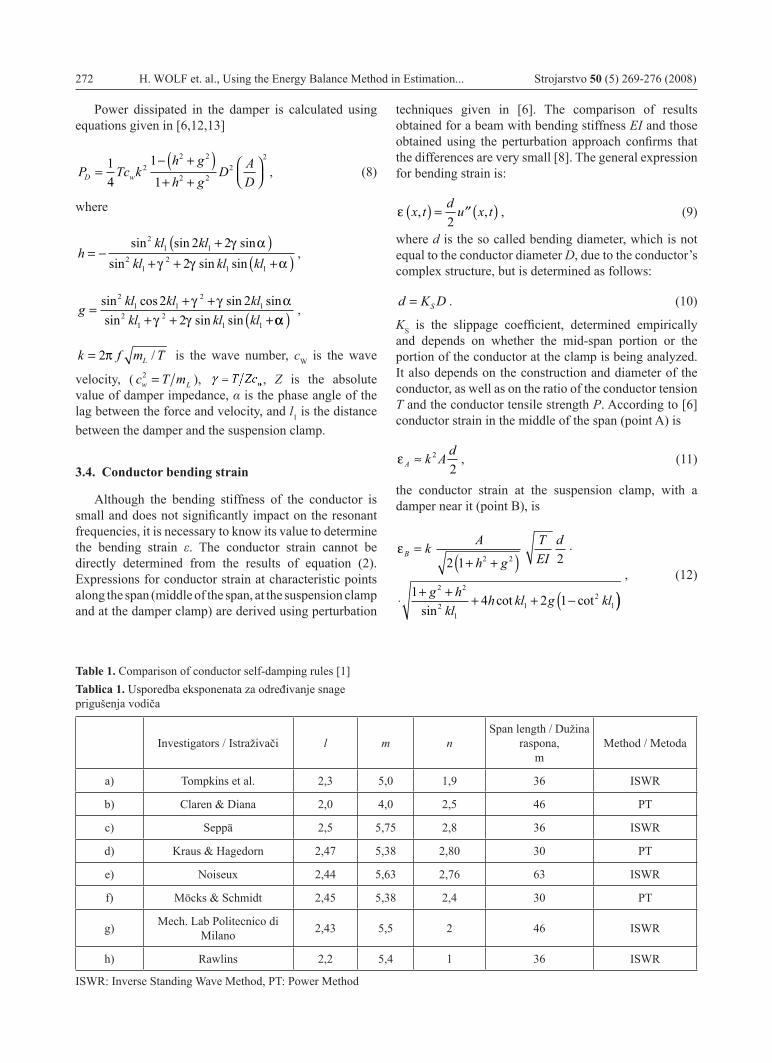
Table 1. Comparison of conductor self-damping rules [1]Tablica 1. Usporedba eksponenata za određivanje snage prigušenja vodiča
Investigators / Istraživači l m nSpan length / Dužina
raspona, m
Method / Metoda
a) Tompkins et al. 2,3 5,0 1,9 36 ISWr
b) Claren & Diana 2,0 4,0 2,5 46 PT
c) Seppä 2,5 5,75 2,8 36 ISWr
d) Kraus & Hagedorn 2,47 5,38 2,80 30 PT
e) Noiseux 2,44 5,63 2,76 63 ISWr
f) Möcks & Schmidt 2,45 5,38 2,4 30 PT
g) Mech. Lab Politecnico di Milano 2,43 5,5 2 46 ISWr
h) Rawlins 2,2 5,4 1 36 ISWr
ISWR: Inverse Standing Wave Method, PT: Power Method
techniques given in [6]. The comparison of results obtained for a beam with bending stiffness EI and those obtained using the perturbation approach confirms that the differences are very small [8]. The general expression for bending strain is:
ε x t d u x t, ,( ) = ′′ ( )2
, (9)
where d is the so called bending diameter, which is not equal to the conductor diameter D, due to the conductor’s complex structure, but is determined as follows:
d K DS= . (10)
KS is the slippage coefficient, determined empirically and depends on whether the mid-span portion or the portion of the conductor at the clamp is being analyzed. It also depends on the construction and diameter of the conductor, as well as on the ratio of the conductor tension T and the conductor tensile strength P. According to [6] conductor strain in the middle of the span (point A) is
ε A k A d≈ 2
2, (11)
the conductor strain at the suspension clamp, with a damper near it (point B), is
εB k A
h g
TEI
d
g hkl
h kl g kl
=+ +( )
⋅
⋅+ +
+ + −(
2 1 2
1 4 2 1
2 2
2 2
21
12
1sincot cot ))
, (12)
Strojarstvo 50 (5) 269-276 (2008) H. WOLF et. al., Using the Energy Balance Method in Estimation... 273
and the conductor strain at the damper clamp (point C) is:
εCd kU b c b c T
EI= −( ) + −( )
2 1 12
2 22
, (13)
whereb kl g kl h kl1 1 1 1= − − −sin cos sin ,
b kl g kl h kl2 1 1 1= + −cos sin cos ,
c gkl
klh kl1
21
111= −( ) +
cossin
cos ,
c g kl hkl
kl2 1
21
1
1= +( ) +coscossin
.
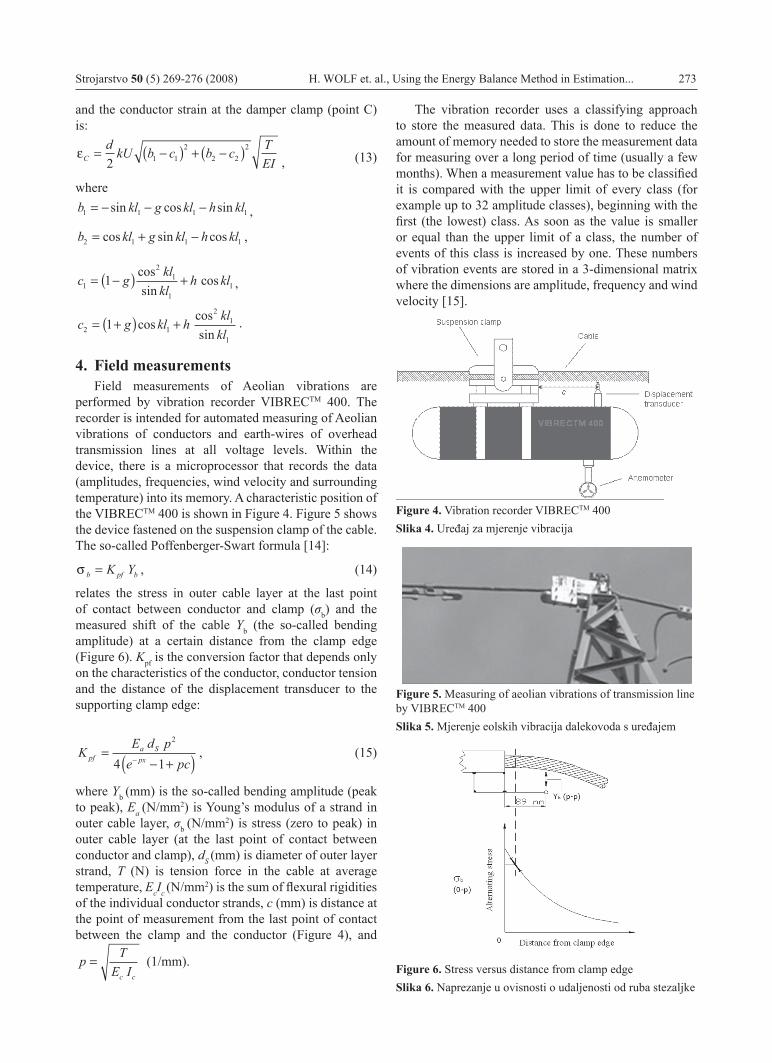
4. Field measurementsField measurements of Aeolian vibrations are
performed by vibration recorder VIBRECTM 400. The recorder is intended for automated measuring of Aeolian vibrations of conductors and earth-wires of overhead transmission lines at all voltage levels. Within the device, there is a microprocessor that records the data (amplitudes, frequencies, wind velocity and surrounding temperature) into its memory. A characteristic position of the VIBrECTM 400 is shown in Figure 4. Figure 5 shows the device fastened on the suspension clamp of the cable.The so-called Poffenberger-Swart formula [14]:
σ b pf bK Y= , (14)
relates the stress in outer cable layer at the last point of contact between conductor and clamp (σb) and the measured shift of the cable Yb (the so-called bending amplitude) at a certain distance from the clamp edge (Figure 6). Kpf is the conversion factor that depends only on the characteristics of the conductor, conductor tension and the distance of the displacement transducer to the supporting clamp edge:
KE d p
e pcpfa Spx
=− +( )−
2
4 1, (15)
where Yb (mm) is the so-called bending amplitude (peak to peak), Ea (N/mm2) is Young’s modulus of a strand in outer cable layer, σb (N/mm2) is stress (zero to peak) in outer cable layer (at the last point of contact between conductor and clamp), dS (mm) is diameter of outer layer strand, T (N) is tension force in the cable at average temperature, EcIc (N/mm2) is the sum of flexural rigidities of the individual conductor strands, c (mm) is distance at the point of measurement from the last point of contact between the clamp and the conductor (Figure 4), and
p TE Ic c
= (1/mm).
The vibration recorder uses a classifying approach to store the measured data. This is done to reduce the amount of memory needed to store the measurement data for measuring over a long period of time (usually a few months). When a measurement value has to be classified it is compared with the upper limit of every class (for example up to 32 amplitude classes), beginning with the first (the lowest) class. As soon as the value is smaller or equal than the upper limit of a class, the number of events of this class is increased by one. These numbers of vibration events are stored in a 3-dimensional matrix where the dimensions are amplitude, frequency and wind velocity [15].
Figure 4. Vibration recorder VIBRECTM 400Slika 4. Uređaj za mjerenje vibracija
Figure 5. Measuring of aeolian vibrations of transmission line by VIBRECTM 400Slika 5. Mjerenje eolskih vibracija dalekovoda s uređajem
Figure 6. Stress versus distance from clamp edgeSlika 6. Naprezanje u ovisnosti o udaljenosti od ruba stezaljke
274 H. WOLF et. al., Using the Energy Balance Method in Estimation... Strojarstvo 50 (5) 269-276 (2008)
5. Results
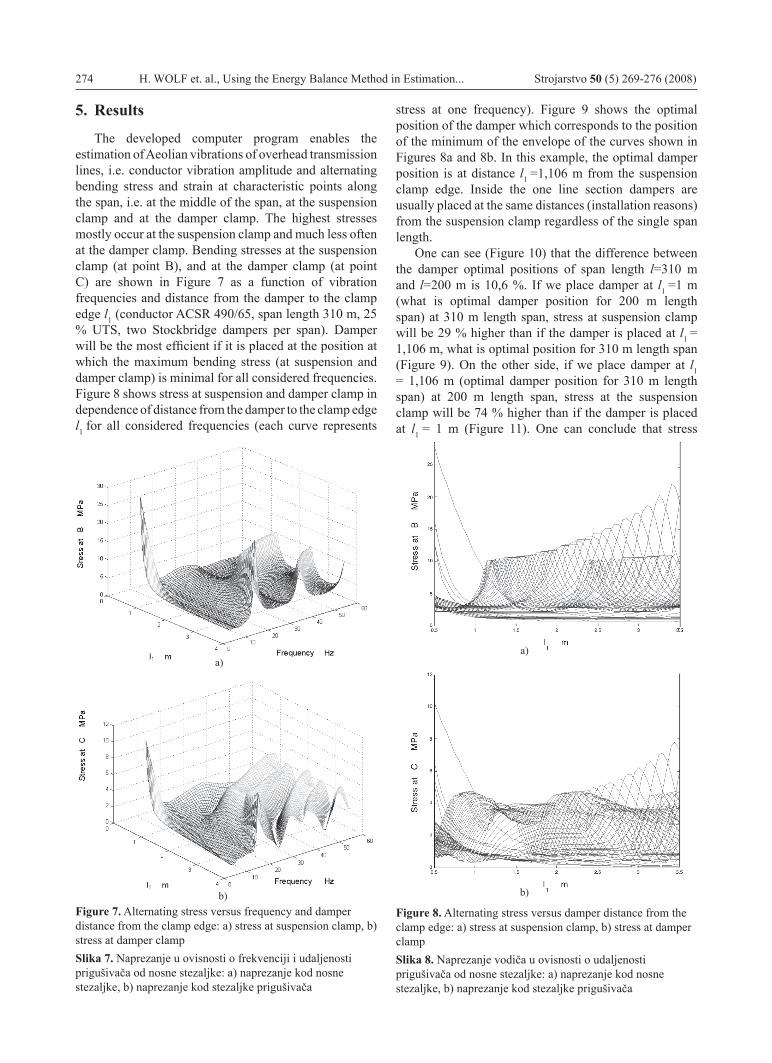
The developed computer program enables the estimation of Aeolian vibrations of overhead transmission lines, i.e. conductor vibration amplitude and alternating bending stress and strain at characteristic points along the span, i.e. at the middle of the span, at the suspension clamp and at the damper clamp. The highest stresses mostly occur at the suspension clamp and much less often at the damper clamp. Bending stresses at the suspension clamp (at point B), and at the damper clamp (at point C) are shown in Figure 7 as a function of vibration frequencies and distance from the damper to the clamp edge l1 (conductor ACSR 490/65, span length 310 m, 25 % UTS, two Stockbridge dampers per span). Damper will be the most efficient if it is placed at the position at which the maximum bending stress (at suspension and damper clamp) is minimal for all considered frequencies. Figure 8 shows stress at suspension and damper clamp in dependence of distance from the damper to the clamp edge l1 for all considered frequencies (each curve represents
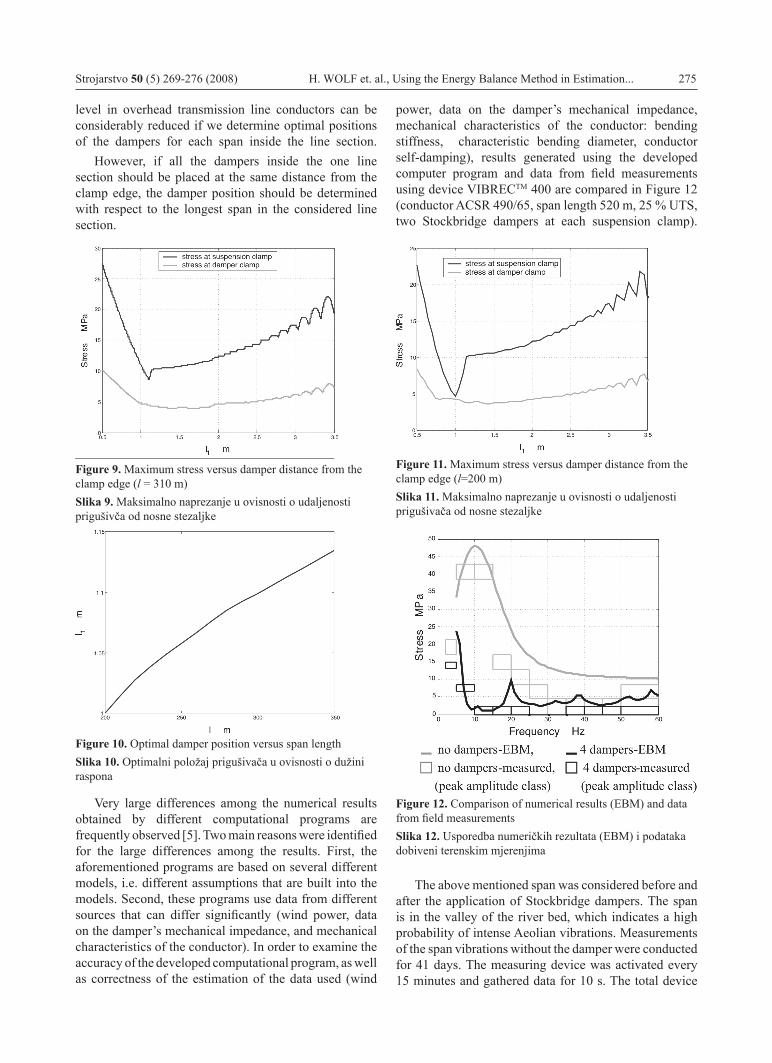
stress at one frequency). Figure 9 shows the optimal position of the damper which corresponds to the position of the minimum of the envelope of the curves shown in Figures 8a and 8b. In this example, the optimal damper position is at distance l1 =1,106 m from the suspension clamp edge. Inside the one line section dampers are usually placed at the same distances (installation reasons) from the suspension clamp regardless of the single span length.
One can see (Figure 10) that the difference between the damper optimal positions of span length l=310 m and l=200 m is 10,6 %. If we place damper at l1 =1 m (what is optimal damper position for 200 m length span) at 310 m length span, stress at suspension clamp will be 29 % higher than if the damper is placed at l1 = 1,106 m, what is optimal position for 310 m length span (Figure 9). On the other side, if we place damper at l1 = 1,106 m (optimal damper position for 310 m length span) at 200 m length span, stress at the suspension clamp will be 74 % higher than if the damper is placed at l1 = 1 m (Figure 11). One can conclude that stress
Figure 7. Alternating stress versus frequency and damper distance from the clamp edge: a) stress at suspension clamp, b) stress at damper clampSlika 7. Naprezanje u ovisnosti o frekvenciji i udaljenosti prigušivača od nosne stezaljke: a) naprezanje kod nosne stezaljke, b) naprezanje kod stezaljke prigušivača
a)
b)Figure 8. Alternating stress versus damper distance from the clamp edge: a) stress at suspension clamp, b) stress at damper clampSlika 8. Naprezanje vodiča u ovisnosti o udaljenosti prigušivača od nosne stezaljke: a) naprezanje kod nosne stezaljke, b) naprezanje kod stezaljke prigušivača
a)
b)
Strojarstvo 50 (5) 269-276 (2008) H. WOLF et. al., Using the Energy Balance Method in Estimation... 275
level in overhead transmission line conductors can be considerably reduced if we determine optimal positions of the dampers for each span inside the line section.
However, if all the dampers inside the one line section should be placed at the same distance from the clamp edge, the damper position should be determined with respect to the longest span in the considered line section.
Figure 9. Maximum stress versus damper distance from the clamp edge (l = 310 m)Slika 9. Maksimalno naprezanje u ovisnosti o udaljenosti prigušivča od nosne stezaljke
Figure 10. Optimal damper position versus span length Slika 10. Optimalni položaj prigušivača u ovisnosti o dužini raspona
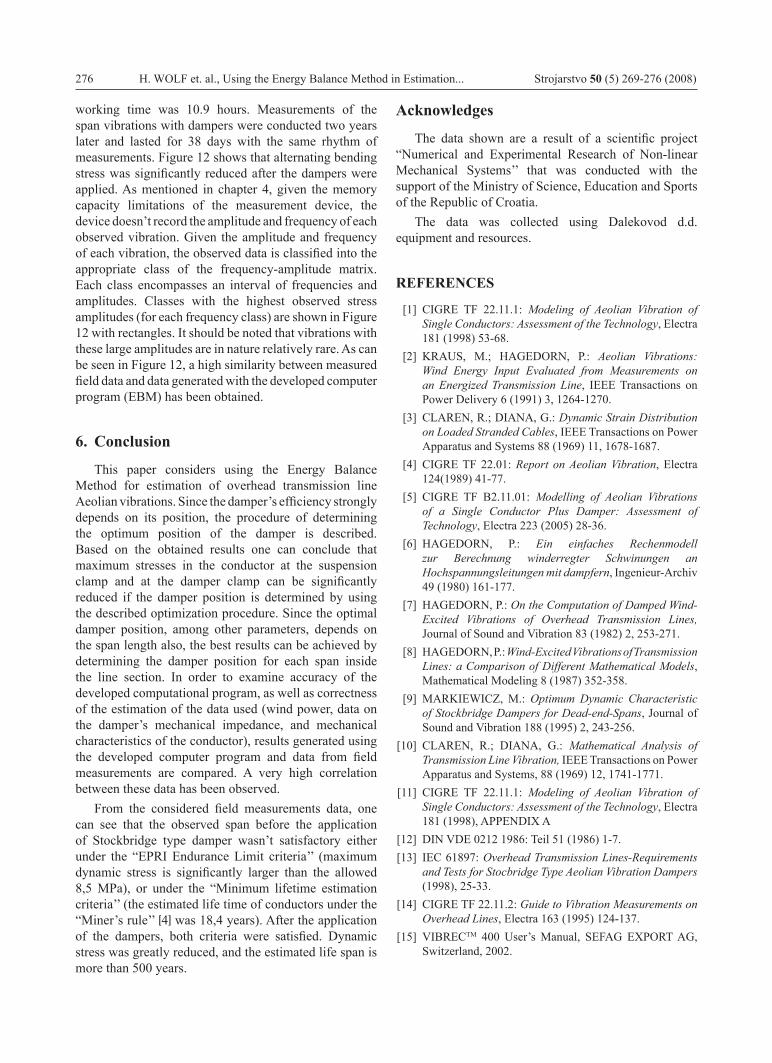
Very large differences among the numerical results obtained by different computational programs are frequently observed [5]. Two main reasons were identified for the large differences among the results. First, the aforementioned programs are based on several different models, i.e. different assumptions that are built into the models. Second, these programs use data from different sources that can differ significantly (wind power, data on the damper’s mechanical impedance, and mechanical characteristics of the conductor). In order to examine the accuracy of the developed computational program, as well as correctness of the estimation of the data used (wind
power, data on the damper’s mechanical impedance, mechanical characteristics of the conductor: bending stiffness, characteristic bending diameter, conductor self-damping), results generated using the developed computer program and data from field measurements using device VIBRECTM 400 are compared in Figure 12 (conductor ACSR 490/65, span length 520 m, 25 % UTS, two Stockbridge dampers at each suspension clamp).
Figure 11. Maximum stress versus damper distance from the clamp edge (l=200 m)Slika 11. Maksimalno naprezanje u ovisnosti o udaljenosti prigušivača od nosne stezaljke
Figure 12. Comparison of numerical results (EBM) and data from field measurementsSlika 12. Usporedba numeričkih rezultata (EBM) i podataka dobiveni terenskim mjerenjima
The above mentioned span was considered before and after the application of Stockbridge dampers. The span is in the valley of the river bed, which indicates a high probability of intense Aeolian vibrations. Measurements of the span vibrations without the damper were conducted for 41 days. The measuring device was activated every 15 minutes and gathered data for 10 s. The total device
276 H. WOLF et. al., Using the Energy Balance Method in Estimation... Strojarstvo 50 (5) 269-276 (2008)
working time was 10.9 hours. Measurements of the span vibrations with dampers were conducted two years later and lasted for 38 days with the same rhythm of measurements. Figure 12 shows that alternating bending stress was significantly reduced after the dampers were applied. As mentioned in chapter 4, given the memory capacity limitations of the measurement device, the device doesn’t record the amplitude and frequency of each observed vibration. Given the amplitude and frequency of each vibration, the observed data is classified into the appropriate class of the frequency-amplitude matrix. Each class encompasses an interval of frequencies and amplitudes. Classes with the highest observed stress amplitudes (for each frequency class) are shown in Figure 12 with rectangles. It should be noted that vibrations with these large amplitudes are in nature relatively rare. As can be seen in Figure 12, a high similarity between measured field data and data generated with the developed computer program (EBM) has been obtained.
6. Conclusion
This paper considers using the Energy Balance Method for estimation of overhead transmission line Aeolian vibrations. Since the damper’s efficiency strongly depends on its position, the procedure of determining the optimum position of the damper is described. Based on the obtained results one can conclude that maximum stresses in the conductor at the suspension clamp and at the damper clamp can be significantly reduced if the damper position is determined by using the described optimization procedure. Since the optimal damper position, among other parameters, depends on the span length also, the best results can be achieved by determining the damper position for each span inside the line section. In order to examine accuracy of the developed computational program, as well as correctness of the estimation of the data used (wind power, data on the damper’s mechanical impedance, and mechanical characteristics of the conductor), results generated using the developed computer program and data from field measurements are compared. A very high correlation between these data has been observed.
From the considered field measurements data, one can see that the observed span before the application of Stockbridge type damper wasn’t satisfactory either under the “EPRI Endurance Limit criteria’’ (maximum dynamic stress is significantly larger than the allowed 8,5 MPa), or under the “Minimum lifetime estimation criteria’’ (the estimated life time of conductors under the “Miner’s rule’’ [4] was 18,4 years). After the application of the dampers, both criteria were satisfied. Dynamic stress was greatly reduced, and the estimated life span is more than 500 years.
Acknowledges
The data shown are a result of a scientific project “Numerical and Experimental Research of Non-linear Mechanical Systems’’ that was conducted with the support of the Ministry of Science, Education and Sports of the Republic of Croatia.
The data was collected using Dalekovod d.d. equipment and resources.
REFERENCES
[1] CIGRE TF 22.11.1: Modeling of Aeolian Vibration of Single Conductors: Assessment of the Technology, Electra 181 (1998) 53-68.
[2] KrAUS, M.; HAGEDORN, P.: Aeolian Vibrations: Wind Energy Input Evaluated from Measurements on an Energized Transmission Line, IEEE Transactions on Power Delivery 6 (1991) 3, 1264-1270.
[3] CLAREN, R.; DIANA, G.: Dynamic Strain Distribution on Loaded Stranded Cables, IEEE Transactions on Power Apparatus and Systems 88 (1969) 11, 1678-1687.
[4] CIGRE TF 22.01: Report on Aeolian Vibration, Electra 124(1989) 41-77.
[5] CIGRE TF B2.11.01: Modelling of Aeolian Vibrations of a Single Conductor Plus Damper: Assessment of Technology, Electra 223 (2005) 28-36.
[6] HAGEDORN, P.: Ein einfaches Rechenmodell zur Berechnung winderregter Schwinungen an Hochspannungsleitungen mit dampfern, Ingenieur-Archiv 49 (1980) 161-177.
[7] HAGEDORN, P.: On the Computation of Damped Wind-Excited Vibrations of Overhead Transmission Lines, Journal of Sound and Vibration 83 (1982) 2, 253-271.
[8] HAGEDORN, P.: Wind-Excited Vibrations of Transmission Lines: a Comparison of Different Mathematical Models, Mathematical Modeling 8 (1987) 352-358.
[9] MARKIEWICZ, M.: Optimum Dynamic Characteristic of Stockbridge Dampers for Dead-end-Spans, Journal of Sound and Vibration 188 (1995) 2, 243-256.
[10] CLAREN, R.; DIANA, G.: Mathematical Analysis of Transmission Line Vibration, IEEE Transactions on Power Apparatus and Systems, 88 (1969) 12, 1741-1771.
[11] CIGRE TF 22.11.1: Modeling of Aeolian Vibration of Single Conductors: Assessment of the Technology, Electra 181 (1998), APPENDIX A
[12] DIN VDE 0212 1986: Teil 51 (1986) 1-7. [13] IEC 61897: Overhead Transmission Lines-Requirements
and Tests for Stocbridge Type Aeolian Vibration Dampers (1998), 25-33.
[14] CIGRE TF 22.11.2: Guide to Vibration Measurements on Overhead Lines, Electra 163 (1995) 124-137.
[15] VIBrECTM 400 User’s Manual, SEFAG EXPORT AG, Switzerland, 2002.