Embed Size (px)
Citation preview
Towards Determining anOptimal Contact Attempt Threshold
for a Large-Scale Personal Visit Survey
Adam Safir & Lucilla TanDivision of Consumer Expenditure Survey
Bureau of Labor Statistics
70th Annual AAPOR ConferenceMay 16, 2015
2
Overview Topics Motivation Methodology Findings Limitations Recommendations
Acknowledgements Jeffrey M. Gonzalez (OSMR), Brett McBride (Division of Consumer
Expenditure Survey), Bates et al 2008.
Disclaimer The opinions expressed in this paper are those of the authors and
do not reflect official policy of the Bureau of Labor Statistics.

3
Motivation Conventional wisdom: Maximize response rates to improve data quality But, this interest is most connected to sampling theory, i.e.,
allowing for the computation of CIs and sampling error
From a data quality standpoint, maximizing RRs leads to: Benefits, reducing nonresponse error and measurement error Costs, cases on the right hand side of the contact attempt
distribution are relatively expensive Max (ROI) Max (benefit, data quality), Min (cost, effort)
Safir and Tan (2009) recommended a threshold of 7 contactattempts in the trade-off between data quality and cost The current study is a retrospective analysis w/more recent data,
re-examining the 2009 recommendation prior to field testing
4
Contact Attempt DistributionA
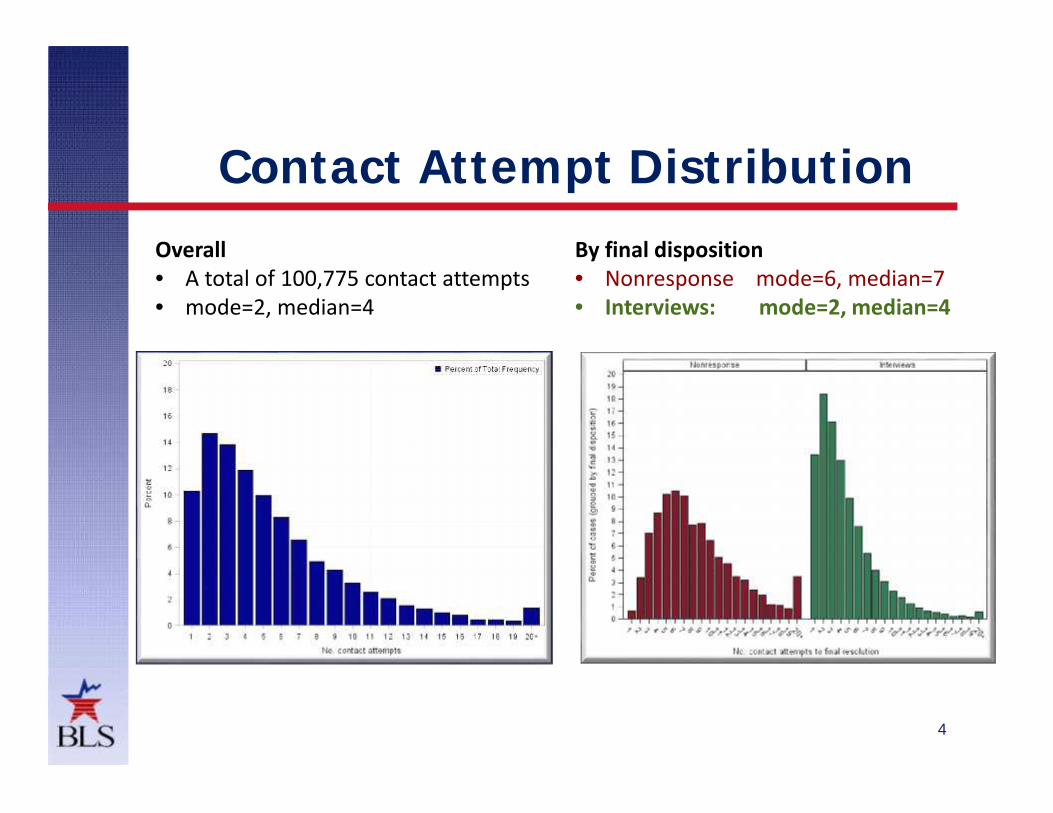
Overall• A total of 100,775 contact attempts• mode=2, median=4
By final disposition• Nonresponse mode=6, median=7• Interviews: mode=2, median=4

5
What are the data quality gains & atwhat cost?
Where is the substantive point ofdiminishing returns relative tosurvey goals?
Cumulative Resolution by ContactAttempt
6
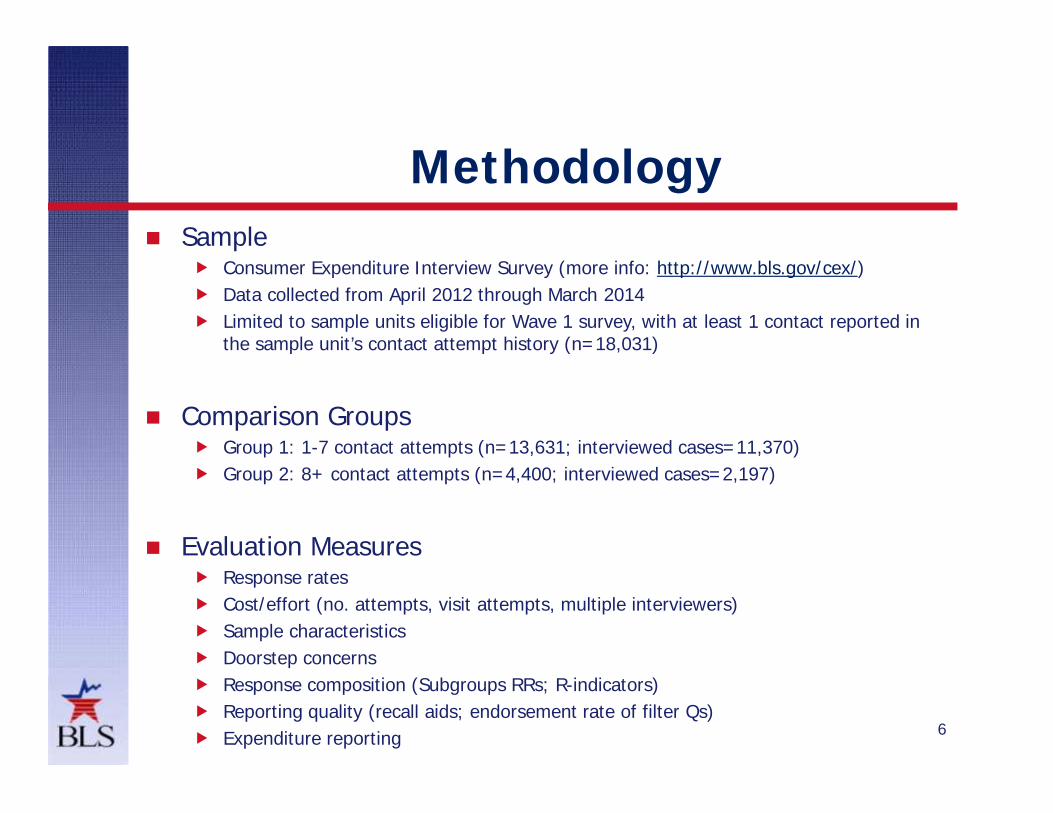
Methodology Sample
Consumer Expenditure Interview Survey (more info: http://www.bls.gov/cex/) Data collected from April 2012 through March 2014 Limited to sample units eligible for Wave 1 survey, with at least 1 contact reported in
the sample unit’s contact attempt history (n=18,031)
Comparison Groups Group 1: 1-7 contact attempts (n=13,631; interviewed cases=11,370) Group 2: 8+ contact attempts (n=4,400; interviewed cases=2,197)
Evaluation Measures Response rates Cost/effort (no. attempts, visit attempts, multiple interviewers) Sample characteristics Doorstep concerns Response composition (Subgroups RRs; R-indicators) Reporting quality (recall aids; endorsement rate of filter Qs) Expenditure reporting

Door
ID # of CHI doorstep concernitems grouped to form theme
Doorstep concern theme(used in analysis)
1, 11, 12 1. Not interested / hostility2, 3, 4, 5 2. Time6, 7, 8, 9, 10 3. Survey content / privacy13, 14, 15 4. Gatekeeping16, 17, 18, 19, 20, 21, 23 5. Other / prior wave
Contact History Instrument (CHI)
7

8
Assessing the Impact of IncreasedContact Attempts
IncreaseContactAttempts
Costs ResponseRates
SampleChar.
DoorstepConcerns
ResponseComposition
ReportingQuality
Acc AggrExp Est
Costs Acc AggrExp Est
{a} ACTION
{b} IMPACT
{c} FILTER
{d} IMPACT
{e} BOTTOM LINE(TBD)
?
?

9
• By the 7th contact attempt:
• 78 percent of the sample resolved
• 84 percent of the interviews completed
• Response rate of:
• 83.4 percent for the 1-7 contact attempt group
• 49.9 percent for the 8+ group
• Cumulative rate of in-scope cases resolved as interviews:
• 63.1 percent after the 7th contact attempt
• 75.2 percent after 20+ contact attempts
Finding 1: Response Rates
11
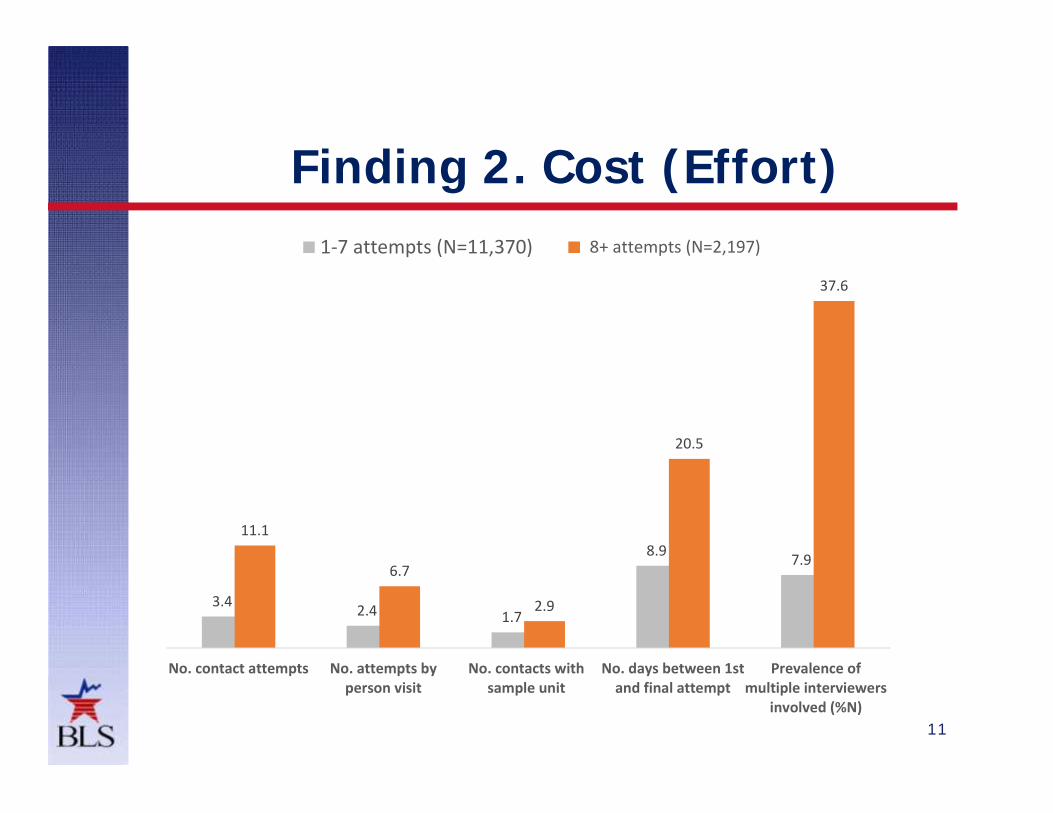
Finding 2. Cost (Effort)
3.4 2.4 1.7
8.9 7.9
11.1
6.7
2.9
20.5
37.6
No. contact attempts No. attempts byperson visit
No. contacts withsample unit
No. days between 1stand final attempt
Prevalence ofmultiple interviewers
involved (%N)
1-7 attempts (N=11,370) 8+ attempts (N=2,197)
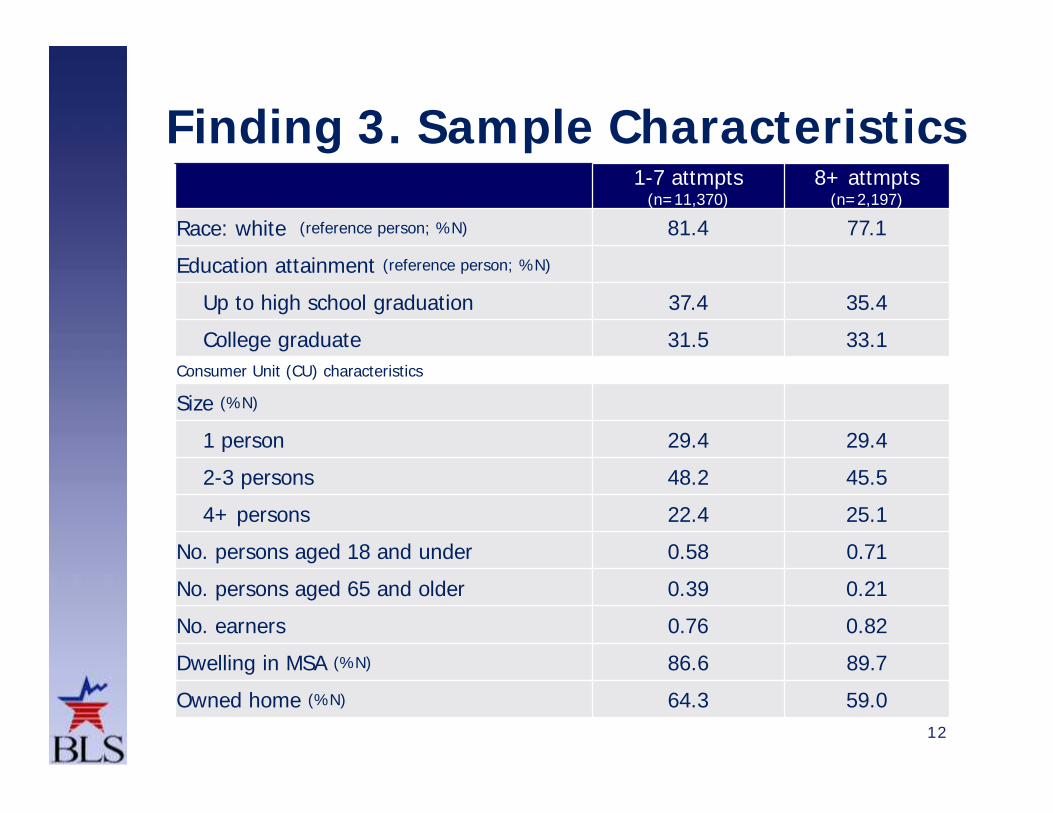
1-7 attmpts(n=11,370)
8+ attmpts(n=2,197)
Race: white (reference person; %N) 81.4 77.1
Education attainment (reference person; %N)
Up to high school graduation 37.4 35.4
College graduate 31.5 33.1Consumer Unit (CU) characteristics
Size (%N)
1 person 29.4 29.4
2-3 persons 48.2 45.5
4+ persons 22.4 25.1
No. persons aged 18 and under 0.58 0.71
No. persons aged 65 and older 0.39 0.21
No. earners 0.76 0.82
Dwelling in MSA (%N) 86.6 89.7
Owned home (%N) 64.3 59.0
Finding 3. Sample Characteristics
12
13
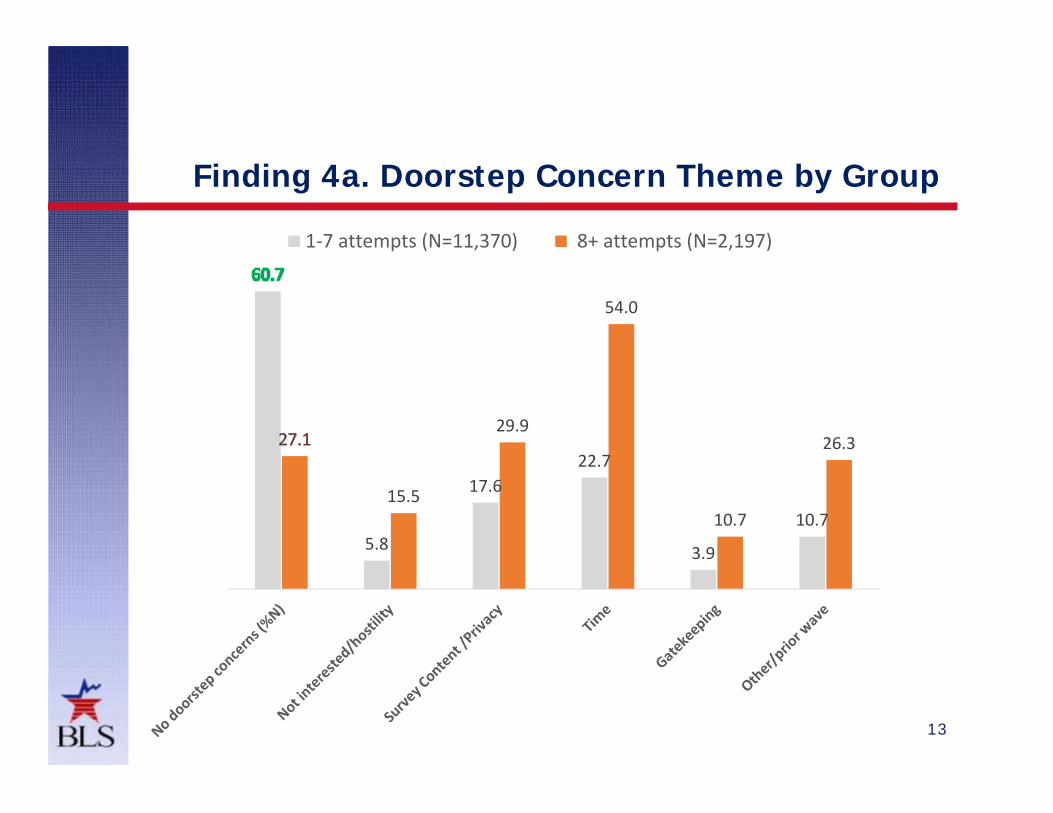
Finding 4a. Doorstep Concern Theme by Group
5.8
17.622.7
3.9
10.715.5
29.9
54.0
10.7
26.3
1-7 attempts (N=11,370) 8+ attempts (N=2,197)
D
No concerns
Time
Not interested /hostility
Survey content/privacy
Gatekeeping
Other
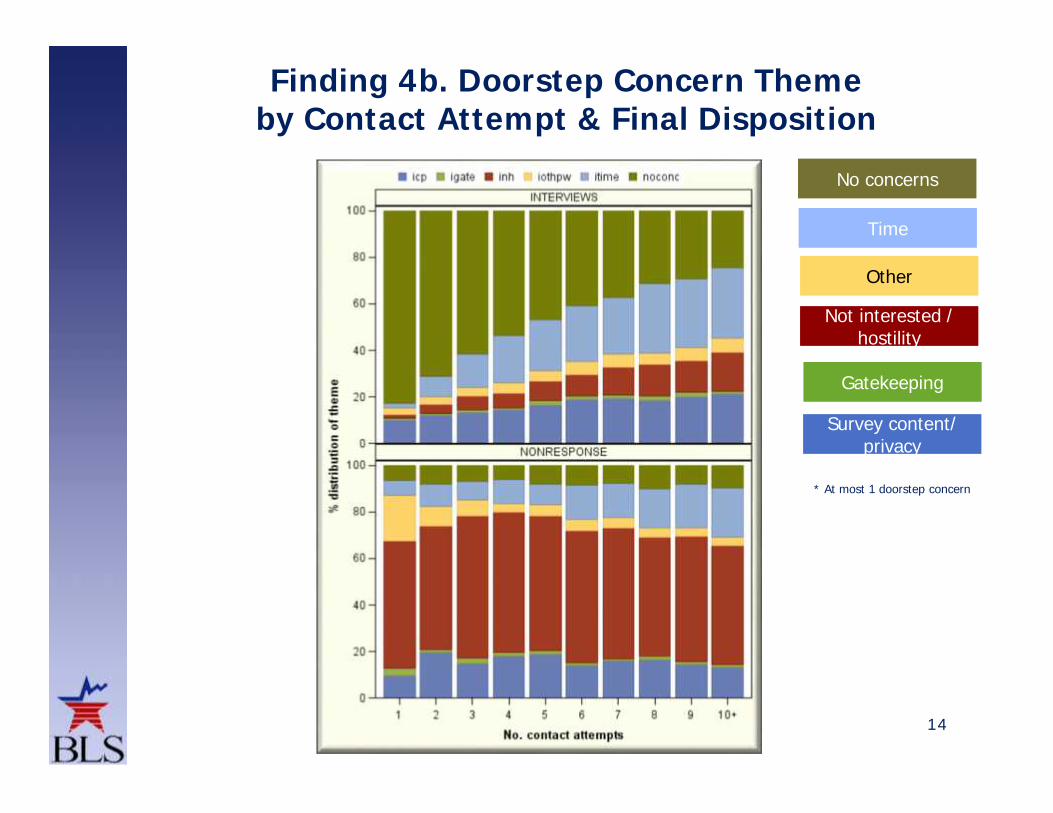
Finding 4b. Doorstep Concern Themeby Contact Attempt & Final Disposition
* At most 1 doorstep concern
14
15
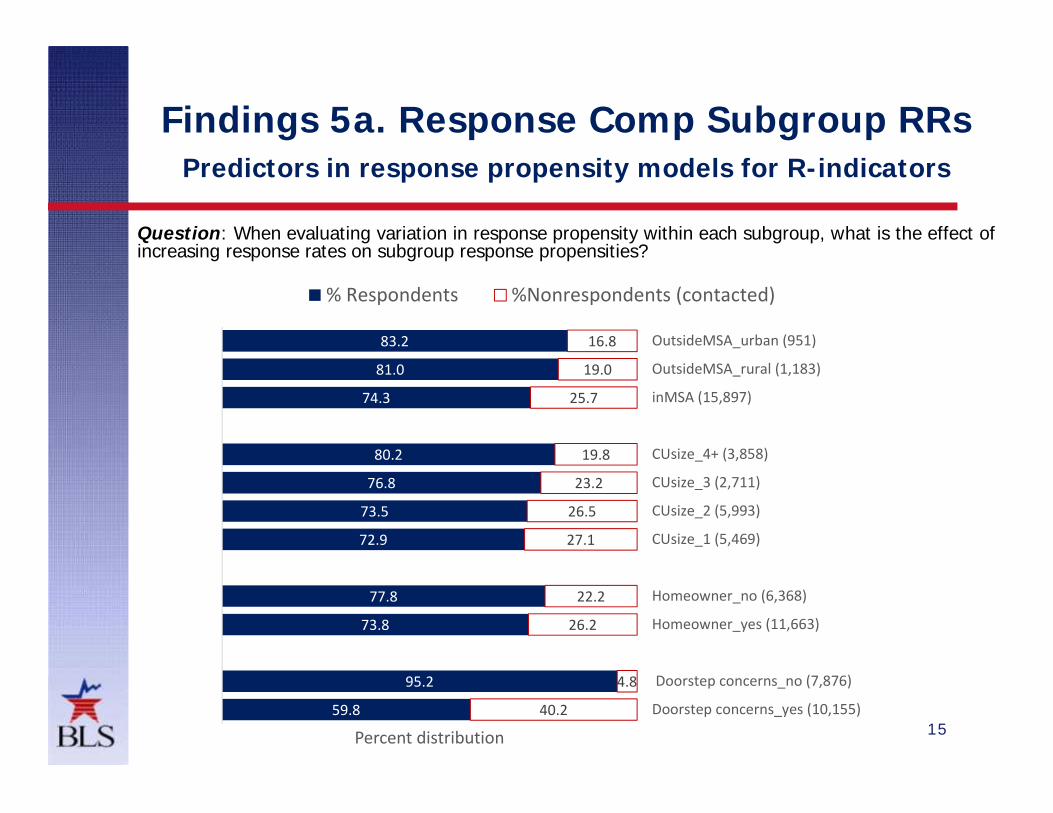
Findings 5a. Response Comp Subgroup RRsPredictors in response propensity models for R-indicators
Question: When evaluating variation in response propensity within each subgroup, what is the effect ofincreasing response rates on subgroup response propensities?
59.8
95.2
73.8
77.8
72.9
73.5
76.8
80.2
74.3
81.0
83.2
40.2
4.8
26.2
22.2
27.1
26.5
23.2
19.8
25.7
19.0
16.8
Doorstep concerns_yes (10,155)
Doorstep concerns_no (7,876)
Homeowner_yes (11,663)
Homeowner_no (6,368)
CUsize_1 (5,469)
CUsize_2 (5,993)
CUsize_3 (2,711)
CUsize_4+ (3,858)
inMSA (15,897)
OutsideMSA_rural (1,183)
OutsideMSA_urban (951)
Percent distribution
% Respondents %Nonrespondents (contacted)

16
Finding 5b. R-Indicators & RRs from 2Response Propensity Models
An R-indicator is a measure of the variation in response propensity among subgroups of interest. A strong indicator ofpotential nonresponse bias is a large variation in response propensity within a subgroup, as well as the extent to whichthat subgroup (e.g., HH tenure) is related to a key variable of interest (e.g., expenditures)
0.00.10.20.30.40.50.60.70.80.91.0
0% 10% 20% 30% 40% 50% 60% 70% 80% 90% 100%
R-in
dica
tor
Response rate
Response model predictors: Single, MSA, homeowner
Response model predictors: Single, MSA, Homeowner, Doorstep concerns
Attempt 1 3 7 10 12 60
17
Finding 6a. Reporting QualityLower Reporting Quality Indicators in the 8+ Attempt Group
Higher proportion of “don’t know/refused” expenditure reports Lower prevalence in the use of recall aids Similar or lower endorsement rates of filter questions to
selected expenditure categories Lower prevalence in the conduct of the interview entirely by
personal visit Similar or higher rate of “combined items” reporting among the
high attempt respondents
18
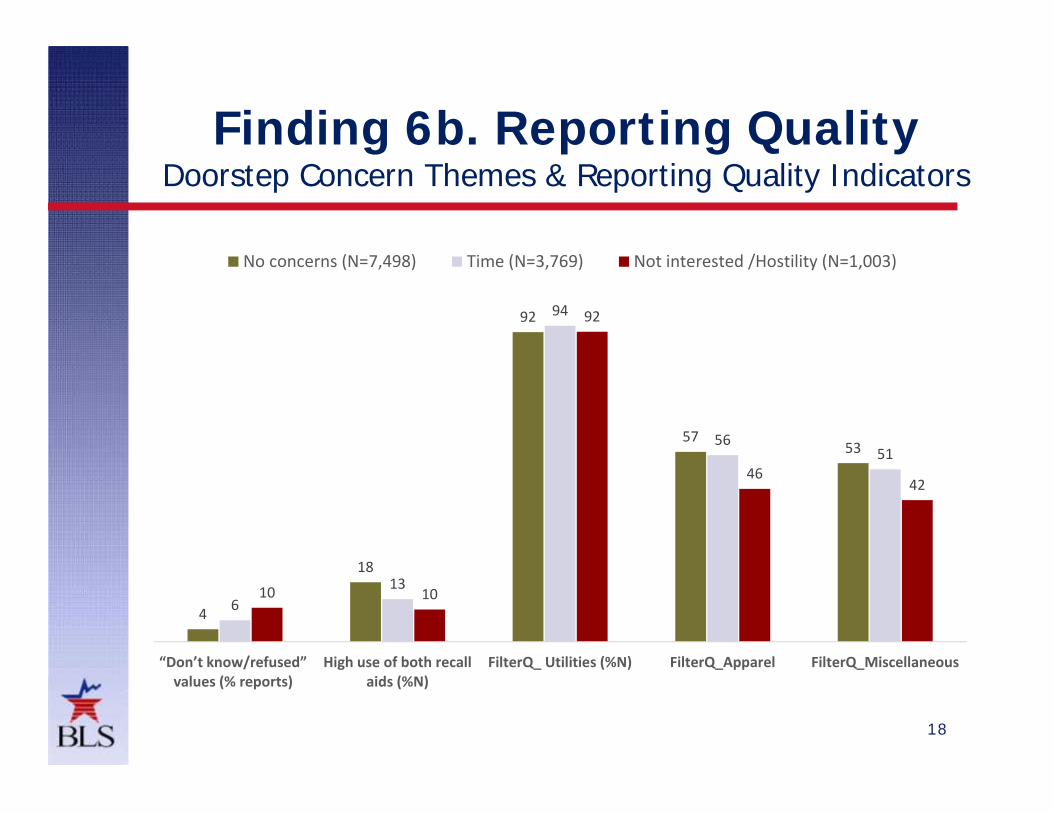
Finding 6b. Reporting QualityDoorstep Concern Themes & Reporting Quality Indicators
4
18
92
5753
613
94
5651
10 10
92
4642
“Don’t know/refused”values (% reports)
High use of both recallaids (%N)
FilterQ_ Utilities (%N) FilterQ_Apparel FilterQ_Miscellaneous
No concerns (N=7,498) Time (N=3,769) Not interested /Hostility (N=1,003)

Logistic regressionDependent variable: indicator for total expenditures> median valuePredictors (indicator variables): >7 attempts, >3 visit attempts,doorstep concerns (inh, icp, itime, igate, iothpw), and controls (homeowner, single member hh,recall aids used >50%, survey duration> median)
Finding 7. Impact of Higher Attempts on Expenditure Reporting
8+ attempts is not associatedwith higher reportedtotal expenditures
19
20
In SummaryEvaluated the impact of increased contact attempts on: Response rates Cost Sample characteristics Doorstep concerns Response composition Reporting quality Expenditure reporting
21
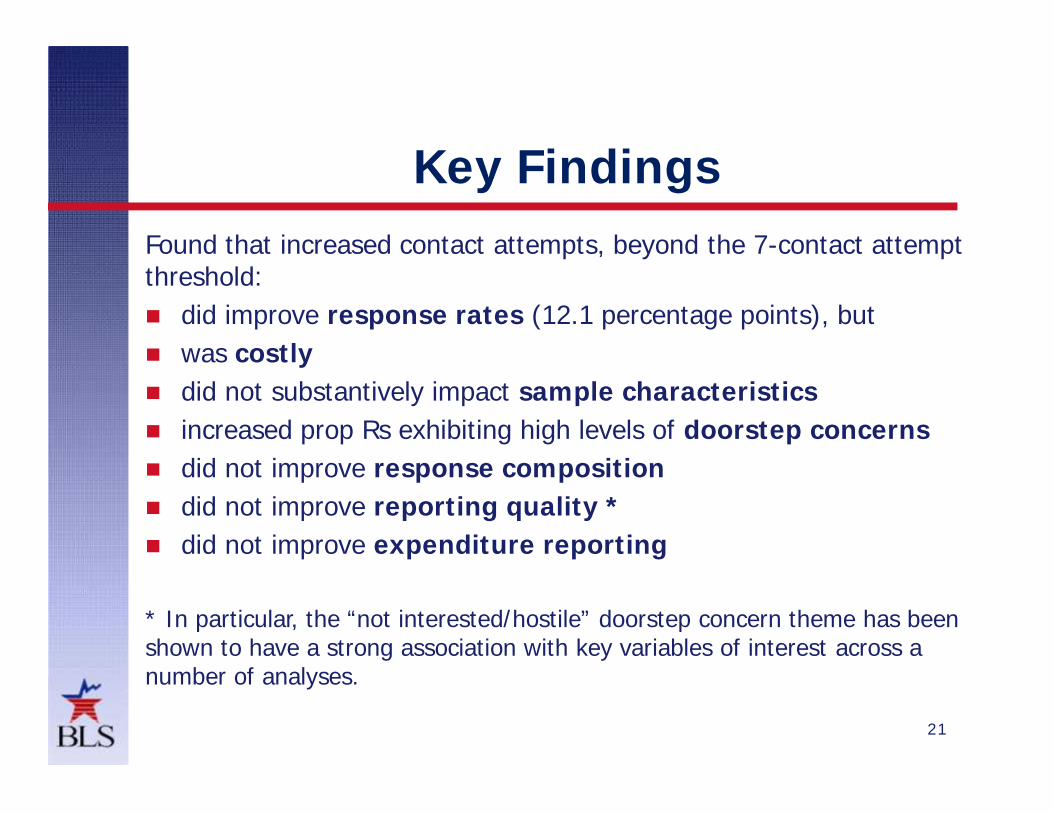
Key FindingsFound that increased contact attempts, beyond the 7-contact attemptthreshold: did improve response rates (12.1 percentage points), but was costly did not substantively impact sample characteristics increased prop Rs exhibiting high levels of doorstep concerns did not improve response composition did not improve reporting quality * did not improve expenditure reporting
* In particular, the “not interested/hostile” doorstep concern theme has beenshown to have a strong association with key variables of interest across anumber of analyses.

24
• Due to the criterion that only sample units with whom interviewers recorded at least onecontact in the CHI was included in the study sample, in theory, the nonrespondents in thisstudy were restricted to nonresponse due to refusals.
• We lacked direct measures of reporting quality. Ideally, the use of recall aids, especiallyrecords, would be a very useful indicator. However, the extent of the usage of records andinformation booklet questions are asked of the interviewers at the end of the survey andbased solely on the interviewer’s assessment and recall.
• With the paucity of socio-demographic information on the sample frame, we relied on theCHI for information that would be available for both respondents and nonrespondentsrelated to their contact attempt characteristics and perceived sample units’ pre-surveydoorstep concerns. However, the CHI relies solely on the interviewer recording everycontact attempt entry and his / her subjective assessment of the contacted sample unit’sreaction to the survey request and when that information is recorded.
• In addition, the meaning of the doorstep concern themes used in this analyses have notbeen formally tested cognitively or otherwise for their practical meaning. A betterunderstanding of the correct interpretation of these themes is necessary to inform the designof interventions that would be based on them.
Limitations
25
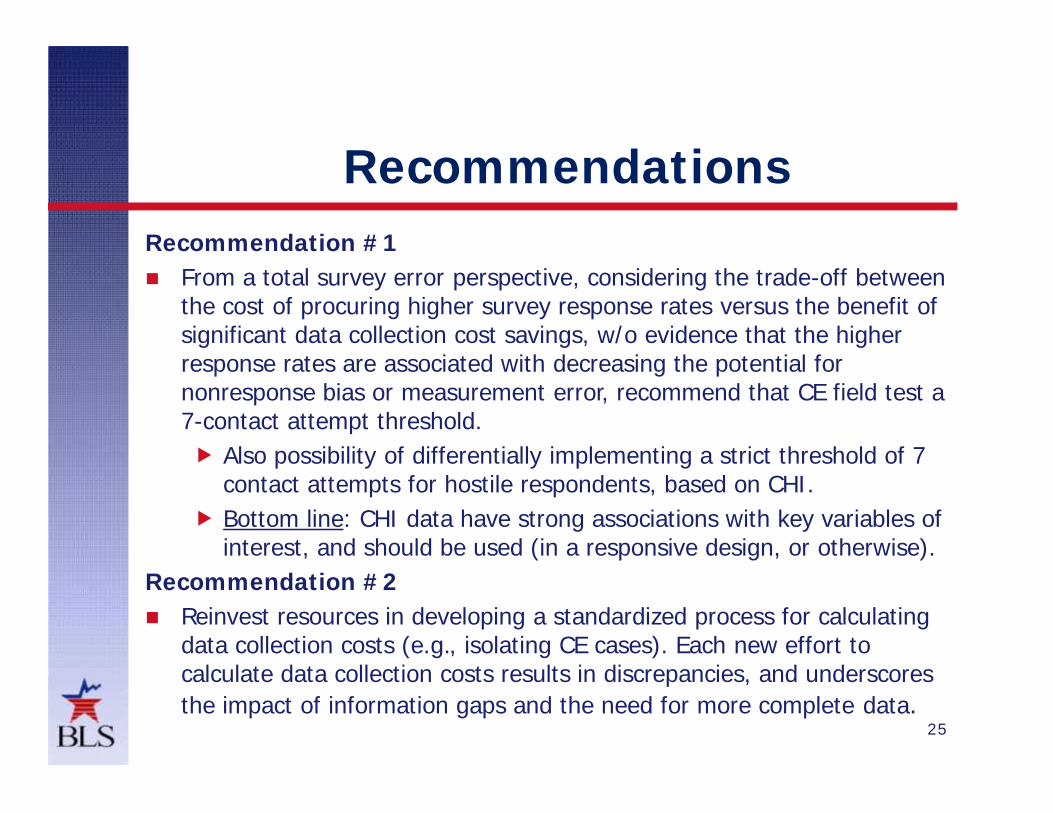
RecommendationsRecommendation #1 From a total survey error perspective, considering the trade-off between
the cost of procuring higher survey response rates versus the benefit ofsignificant data collection cost savings, w/o evidence that the higherresponse rates are associated with decreasing the potential fornonresponse bias or measurement error, recommend that CE field test a7-contact attempt threshold. Also possibility of differentially implementing a strict threshold of 7
contact attempts for hostile respondents, based on CHI. Bottom line: CHI data have strong associations with key variables of
interest, and should be used (in a responsive design, or otherwise).Recommendation #2 Reinvest resources in developing a standardized process for calculating
data collection costs (e.g., isolating CE cases). Each new effort tocalculate data collection costs results in discrepancies, and underscoresthe impact of information gaps and the need for more complete data.

Contact Information
Adam Safir
Bureau of Labor StatisticsDivision of Consumer Expenditure Survey
Branch of Research and Program Development


![BLS Magnet Innovative magnetic materials & solutions · BLS Magnet [8] Attractive technology BLS Magnet [9] Attractive technology BLS Magnet’s magnetic accessories are used in many](https://img.pdfslide.us/doc/110x75/5fe1e8025c38ec6ec573533b/bls-magnet-innovative-magnetic-materials-bls-magnet-8-attractive-technology.jpg)