Embed Size (px)
Citation preview
Using the BDTM
Cytometer
Setup and Tracking (CS&T) System for Instrument Characterization and Performance
Tracking
Mark KuKuruga Senior Technical Applications Specialist
BD Biosciences
Using the BDTM
Cytometer
Setup and Tracking (CS&T) System for Instrument Characterization and Performance
Tracking
Mark KuKuruga Senior Technical Applications Specialist
BD Biosciences
23-14462-00
2
Outline
• Definitions– Resolution sensitivity– Factors affecting resolution sensitivity
Qr: Fluorescence detection efficiencyBr: Background “noise”Electronic Noise (SDen)
• Cytometer
Setup &Tracking (CS&T)
• Choosing gain settings (MFI)Optimizing PMTVsLinearityEnsuring equivalent fluorescence intensities (MFI) over time: application settingsStandardizing setup across instruments
3
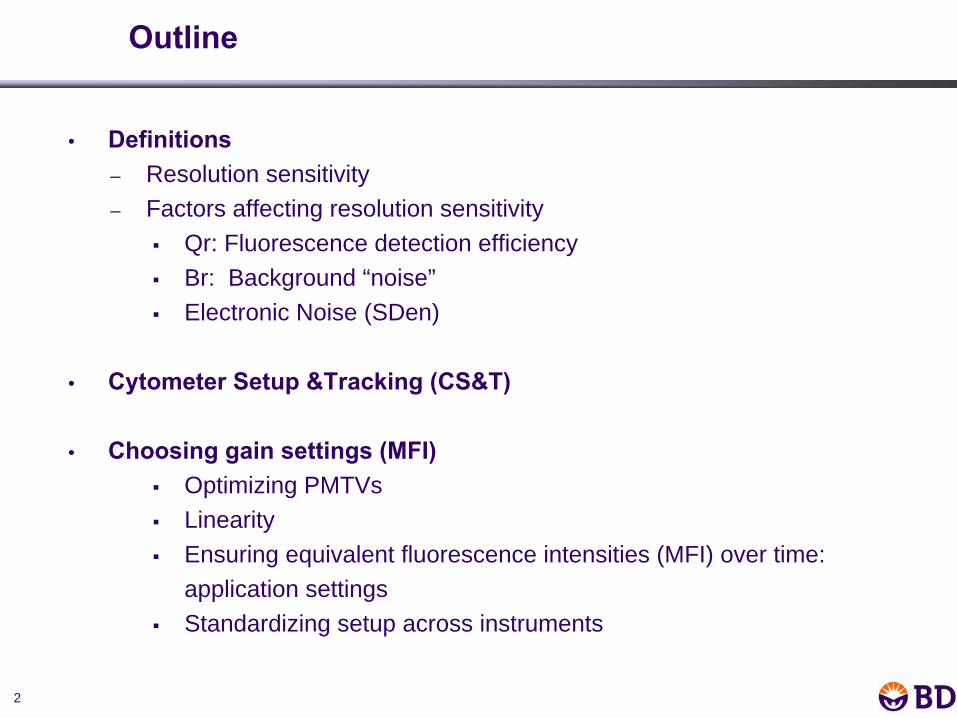
Key Performance Factors in High-Quality Flow Cytometry Data
• Resolution of subpopulations, including dim subpopulations– Sensitivity
• Relative measured values of fluorescence– Linearity and accuracy
• Reproducibility of results and cytometer performance– Tracking
• Comparison of results across time and amongst laboratories– Standardization
4
Instrument Sensitivity: Two Definitions
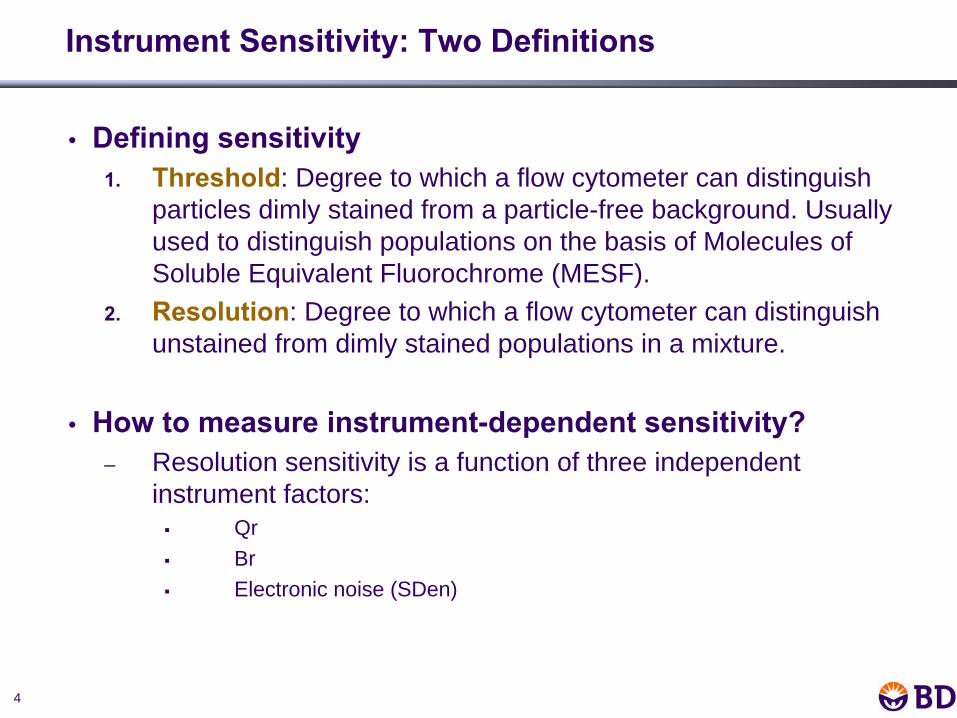
• Defining sensitivity 1.
Threshold: Degree to which a flow cytometer can distinguish particles dimly stained from a particle-free background. Usually used to distinguish populations on the basis of Molecules of Soluble Equivalent Fluorochrome (MESF).
2.
Resolution: Degree to which a flow cytometer can distinguish unstained from dimly stained populations in a mixture.
• How to measure instrument-dependent sensitivity?– Resolution sensitivity is a function of three independent
instrument factors:QrBr Electronic noise (SDen)
5
Defining Instrument Performance and Sensitivity: Qr, Br, and SDen
6
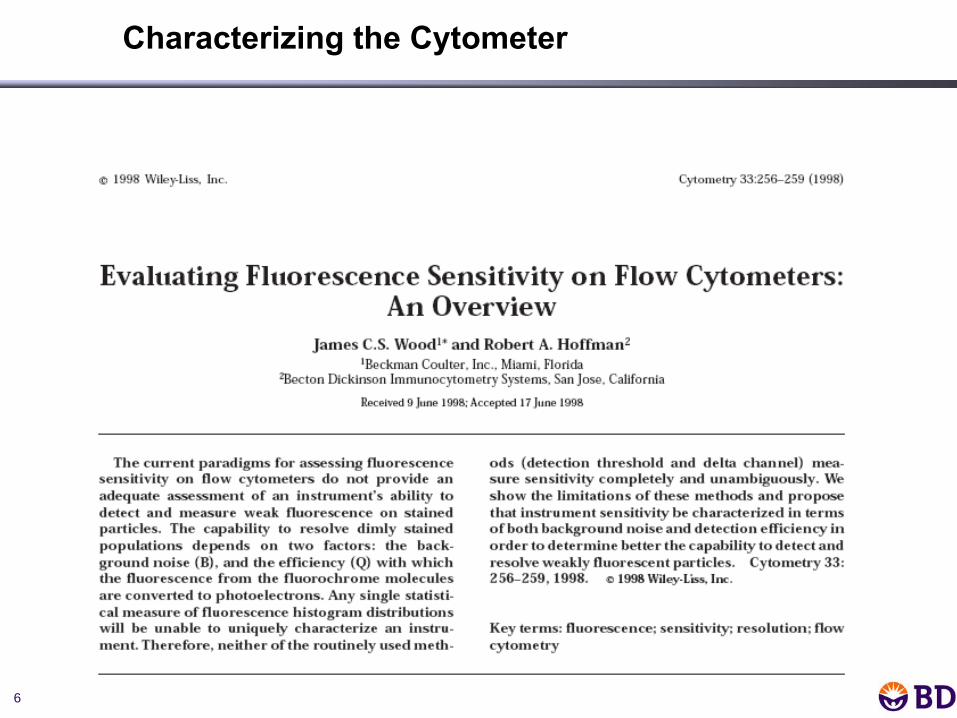
Characterizing the Cytometer
7
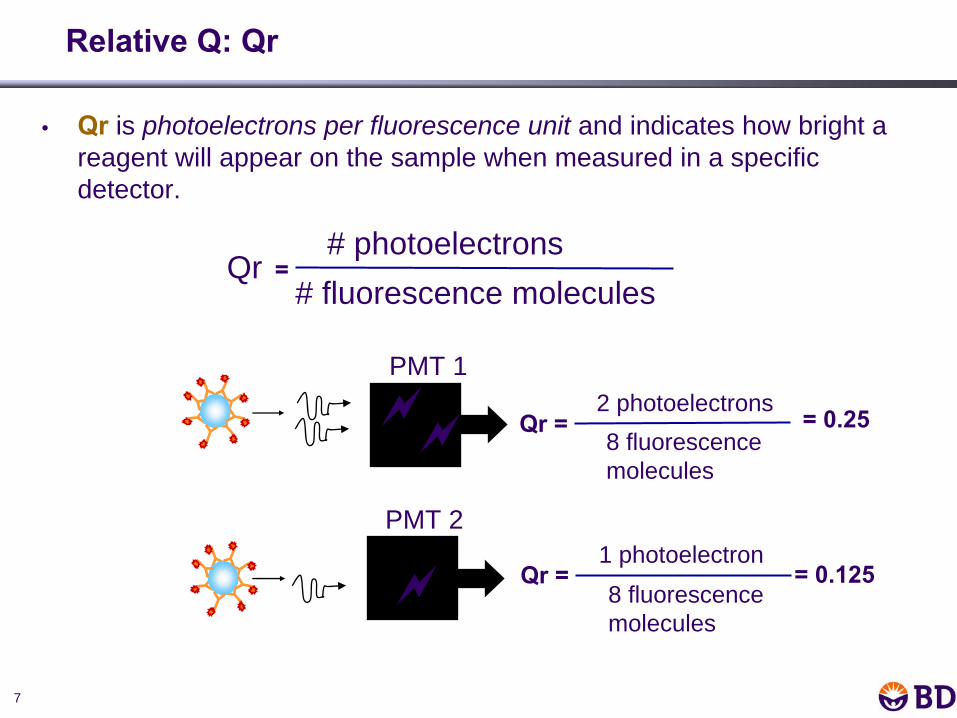
PMT 1
PMT 2
Qr
=
Qr
=
Qr# fluorescence molecules
# photoelectrons=
= 0.252 photoelectrons8 fluorescence molecules
= 0.1251 photoelectron
8 fluorescence molecules
Relative Q: Qr
• Qr
is photoelectrons per fluorescence unit and indicates how bright a reagent will appear on the sample when measured in a specific detector.
8
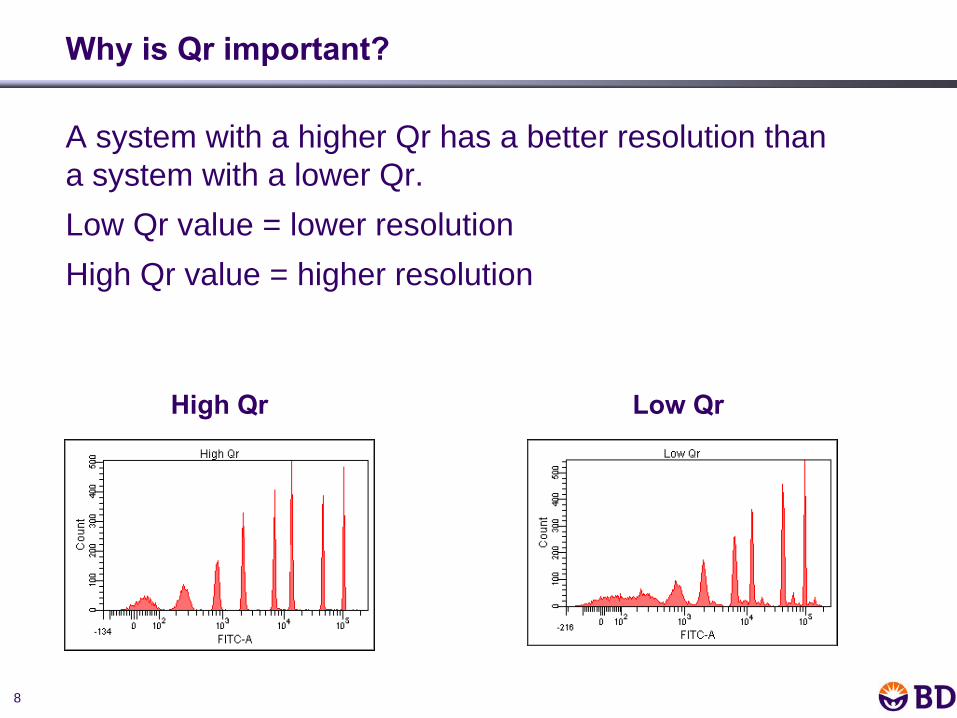
A system with a higher Qr has a better resolution than a system with a lower Qr. Low Qr value = lower resolution High Qr value = higher resolution
High Qr Low Qr
Why is Qr
important?
9
• Laser power
• Optical efficiency
• PMT sensitivity (red spectrum)• Poor PMT performance • Dirty flow cell• Dirty or degraded filter
What Factors Affect Qr?
10
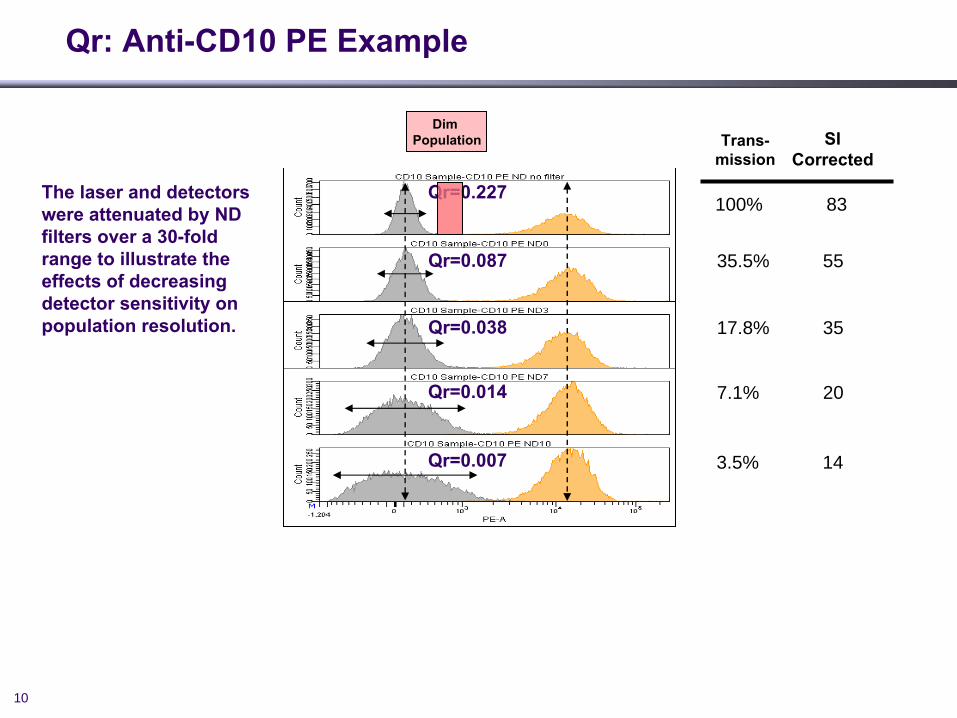
Qr: Anti-CD10 PE
Example
Trans-mission
100% 83
35.5% 55
17.8% 35
7.1% 20
3.5% 14
SICorrected
The laser and detectors were attenuated by ND filters over a 30-fold range to illustrate the effects of decreasing detector sensitivity on population resolution.
Qr=0.087
Qr=0.227
Qr=0.038
Qr=0.014
Qr=0.007
Dim Population
11
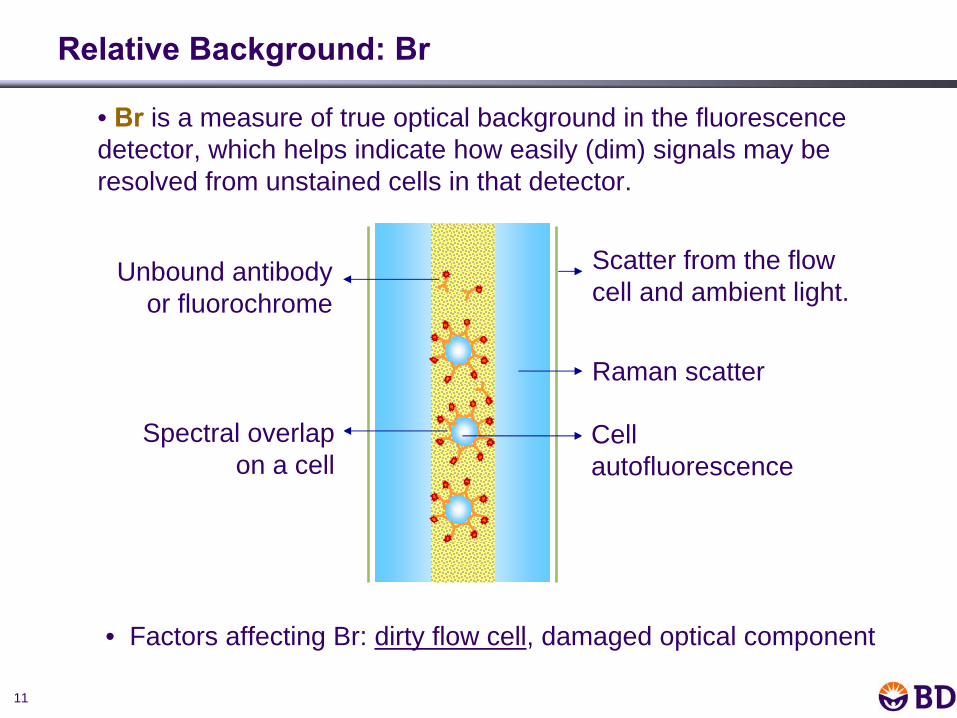
• Br
is a measure of true optical background in the fluorescence detector, which helps indicate how easily (dim) signals may be resolved from unstained cells in that detector.
Unbound antibody or fluorochrome
Spectral overlap on a cell
Cell autofluorescence
Raman scatter
Scatter from the flow cell and ambient light.
Relative Background: Br
• Factors affecting Br: dirty flow cell, damaged optical component
12
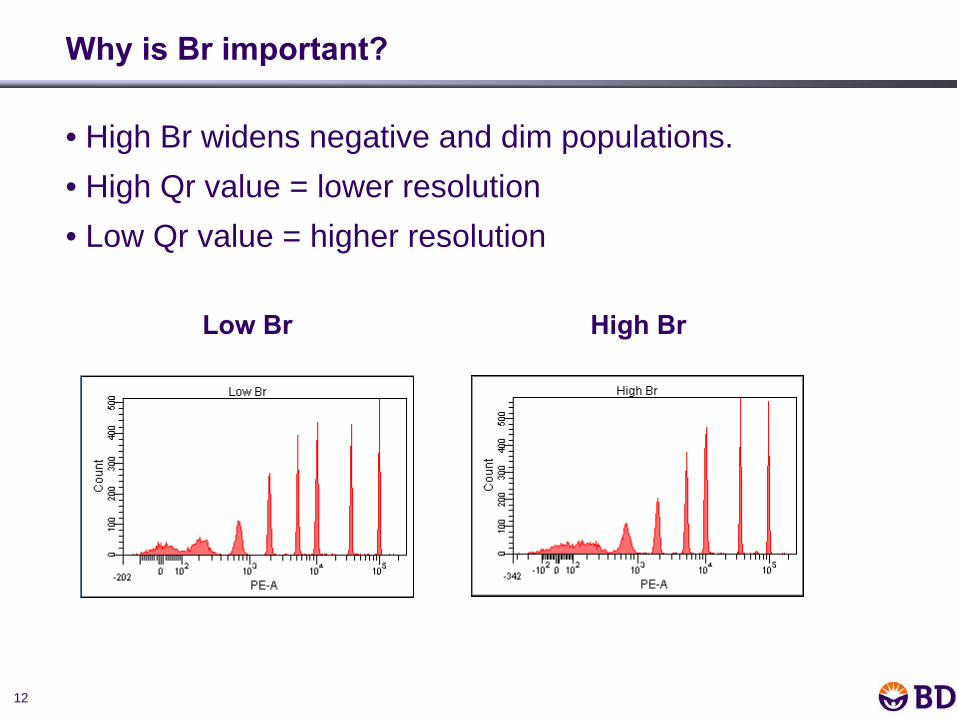
• High Br widens negative and dim populations. • High Qr value = lower resolution • Low Qr value = higher resolution
Why is Br important?
Low Br High Br
13
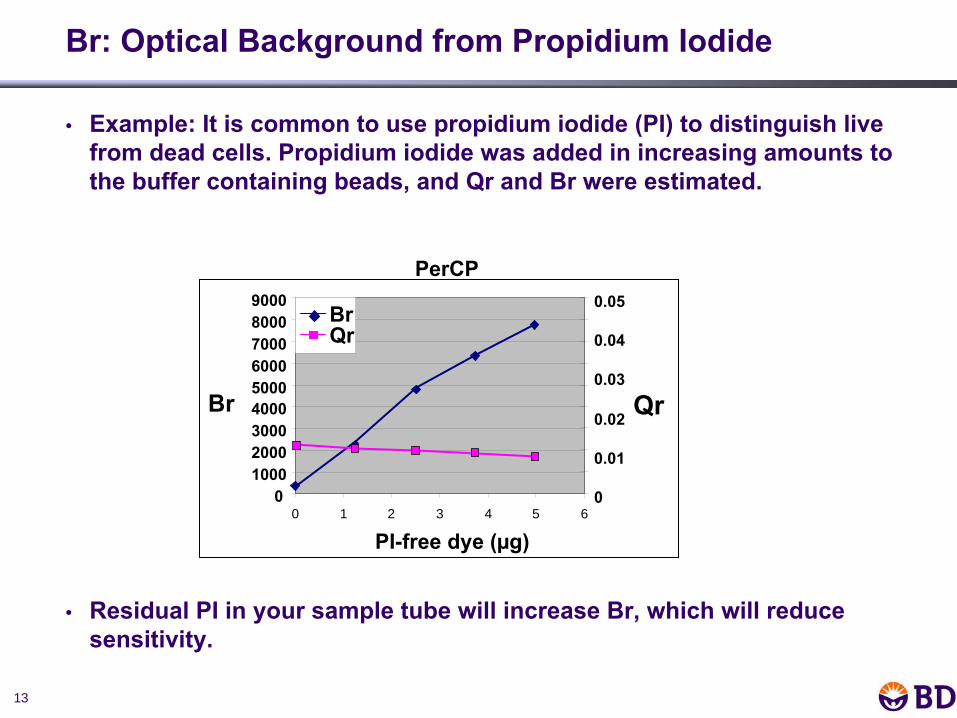
Br: Optical Background from Propidium Iodide
• Example: It is common to use propidium iodide (PI) to distinguish live from dead cells. Propidium iodide was added in increasing amounts to the buffer containing beads, and Qr and Br were estimated.
• Residual PI in your sample tube will increase Br, which will reduce sensitivity.
PerCP
0100020003000400050006000700080009000
0 1 2 3 4 5 6
PI-free dye (µg)
Br
0
0.01
0.02
0.03
0.04
0.05
Qr
BrQr
14
Electronic Noise (SDen)
– SDen
is the background signal due to electronics:Contributed by:
PMT connections / PMT noiseCables too near power sourcesDigital error
– Broadens the distribution of unstained or dim particlesIncreases in electronic noise results in decreased resolution sensitivity
Most important for channels with low cellular autofluorescenceAPC-Cy™7, PE-Cy™7, PerCP-Cy™5.5
Cy™ is a trademark of Amersham Biosciences Corp. Cy™ dyes are subject to proprietary rights of Amersham Biosciences Corp and Carnegie Mellon University and are made and sold under license from Amersham Biosciences Corp only for research and in vitro diagnostic use. Any other use requires a commercial sublicense from Amersham Biosciences Corp, 800 Centennial Avenue, Piscataway, NJ 08855-1327, USA.
15
Summary: Instrument Performance and Sensitivity
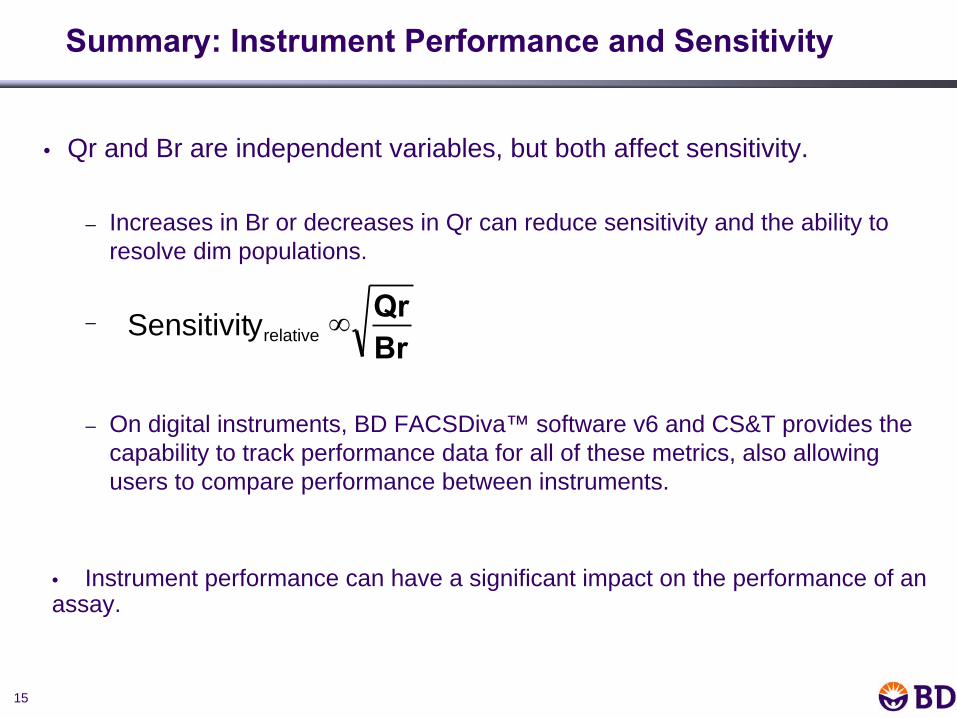
• Qr and Br are independent variables, but both affect sensitivity.
– Increases in Br or decreases in Qr can reduce sensitivity and the ability to resolve dim populations.
–
– On digital instruments, BD FACSDiva™ software v6 and CS&T provides the capability to track performance data for all of these metrics, also allowing users to compare performance between instruments.
BrQr∞ySensitivit relative
• Instrument performance can have a significant impact on the performance of an assay.
16
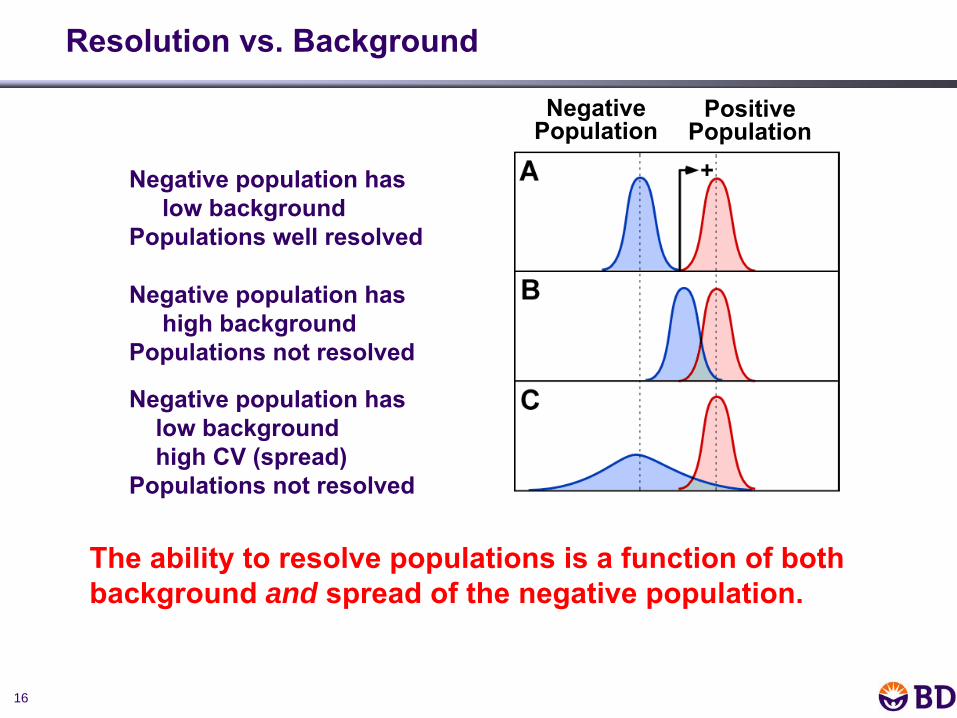
Resolution vs. Background
NegativePopulation
PositivePopulation
Negative population haslow background
Populations well resolved
Negative population hashigh background
Populations not resolved
Negative population haslow backgroundhigh CV (spread)
Populations not resolved
The ability to resolve populations is a function of both background and spread of the negative population.
17
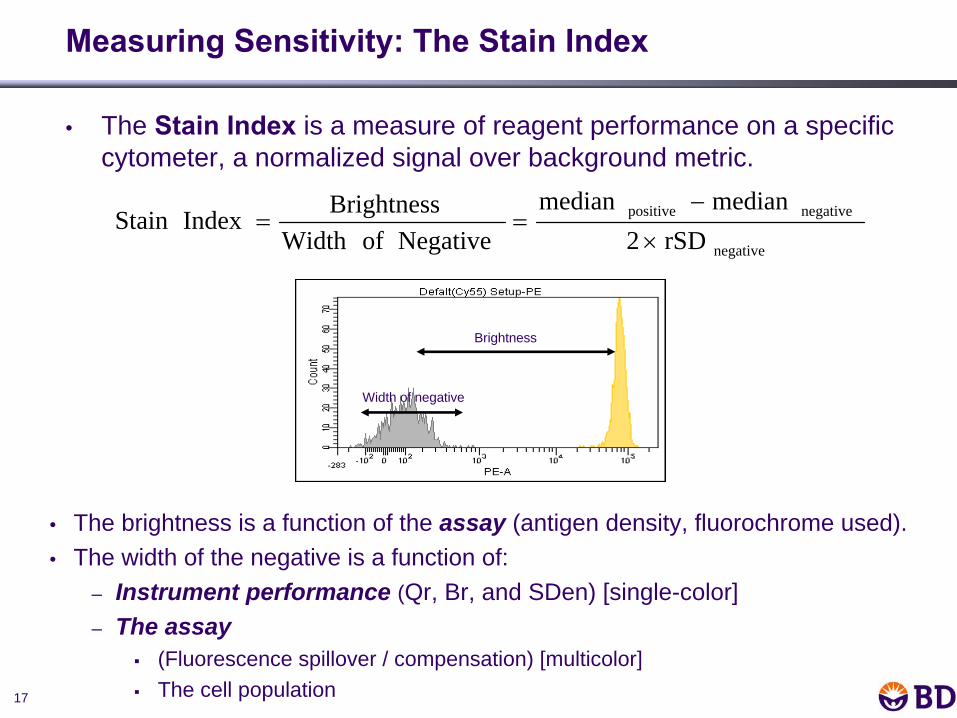
Measuring Sensitivity: The Stain Index
• The Stain Index
is a measure of reagent performance on a specific cytometer, a normalized signal over background metric.
negative
negativepositive
rSD2medianmedian
Negative ofWidth Brightness Index Stain
×
−==
Brightness
Width of negative
• The brightness is a function of the assay (antigen density, fluorochrome used).• The width of the negative is a function of:
– Instrument performance (Qr, Br, and SDen) [single-color]– The assay
(Fluorescence spillover / compensation) [multicolor]The cell population
18
8 peak beads
0 10 2 10 3 10 4 10 5
0 10 2 10 3 10 4 10 5
0 10 2 10 3 10 4 10 5
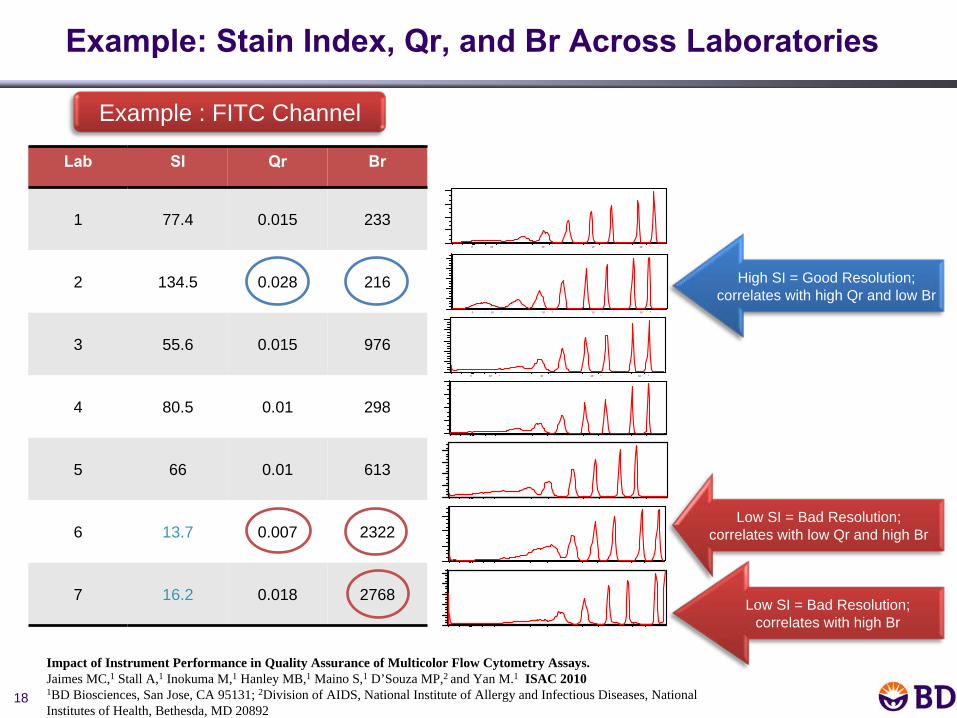
Example: Stain Index, Qr, and Br Across Laboratories
Example : FITC Channel
Lab SI Qr Br
1 77.4 0.015 233
2 134.5 0.028 216
3 55.6 0.015 976
4 80.5 0.01 298
5 66 0.01 613
6 13.7 0.007 2322
7 16.2 0.018 2768
Low SI = Bad Resolution; correlates with low Qr and high Br
High SI = Good Resolution; correlates with high Qr and low Br
Low SI = Bad Resolution; correlates with high Br
Impact of Instrument Performance in Quality Assurance of Multicolor Flow Cytometry Assays.Jaimes MC,1 Stall A,1 Inokuma M,1 Hanley MB,1 Maino S,1 D’Souza MP,2 and Yan M.1 ISAC 20101BD Biosciences, San Jose, CA 95131; 2Division of AIDS, National Institute of Allergy and Infectious Diseases, National Institutes of Health, Bethesda, MD 20892
19
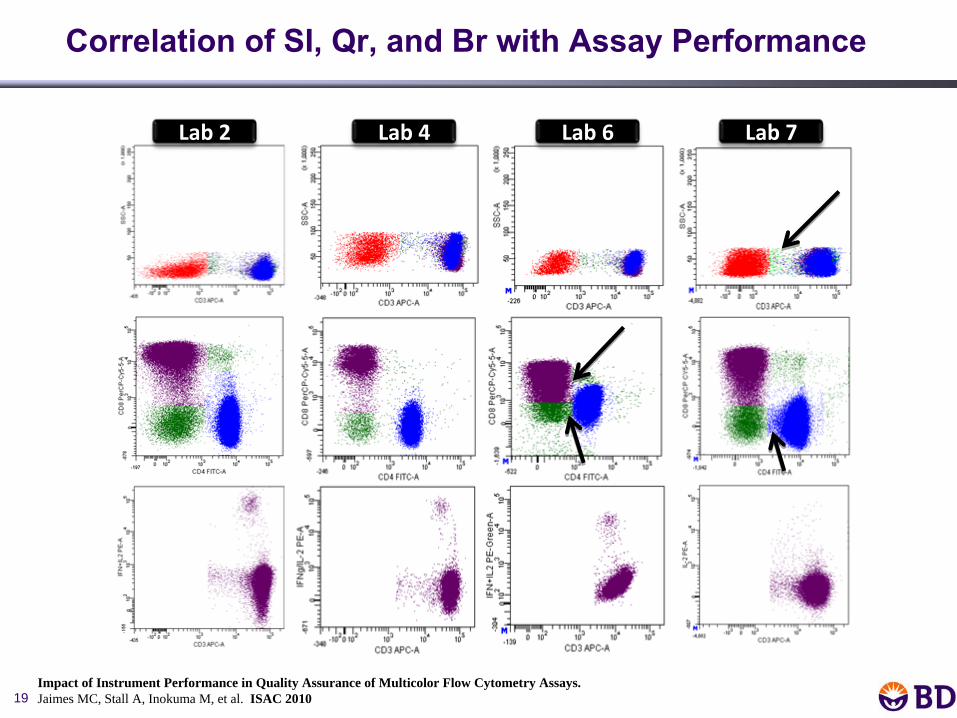
Plots gated on lymphocytes
Plots gated on CD3+
cells
Plots gated on CD3+CD8+
cells
Correlation of SI, Qr, and Br with Assay Performance
Lab 2 Lab 4 Lab 6 Lab 7
Impact of Instrument Performance in Quality Assurance of Multicolor Flow Cytometry Assays.Jaimes MC, Stall A, Inokuma M, et al. ISAC 2010
20
BD Cytometer Setup & Tracking (CS&T) System
21
CS&T Definition
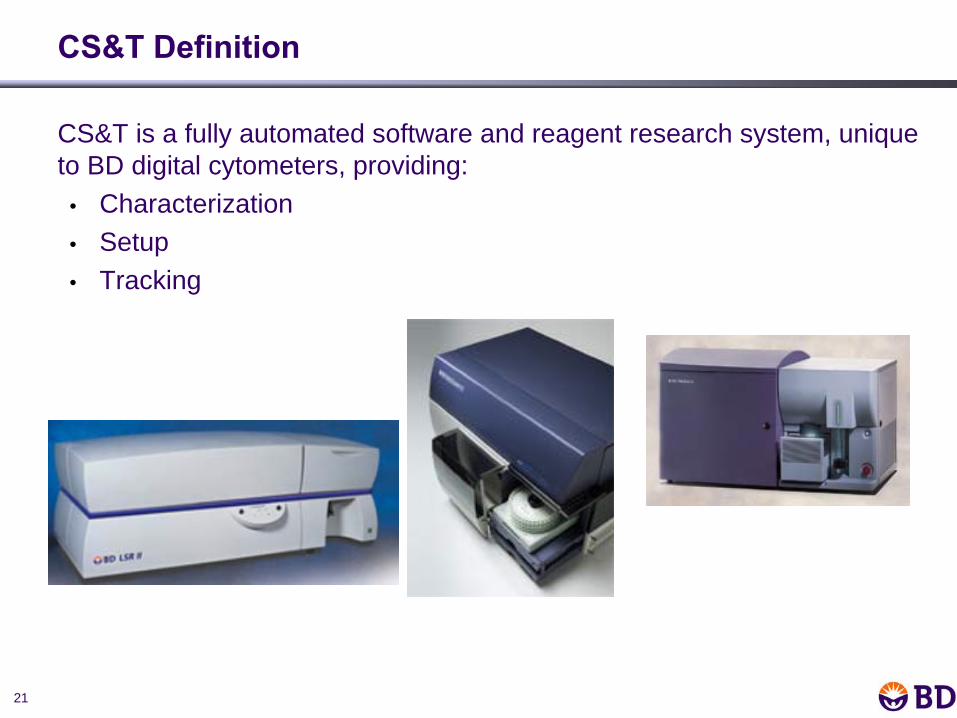
CS&T is a fully automated software and reagent research system, unique to BD digital cytometers, providing:
• Characterization• Setup• Tracking
22
– Functions of the CS&T system:Defines and characterizes baseline performanceOptimizes and standardizes cytometer setupTracks cytometer performance
– Benefits of the CS&T system:Provides consistent, reproducible data every daySimplifies design of multicolor experimentsYields higher quality data from multicolor experimentsOffsets day-to-day instrument variabilityEnables standardization between instruments and sitesAllows early identification of degrading cytometer performance
CS&T: Functions and Benefits
23
Bright
MidDim
System Components: Beads (1)
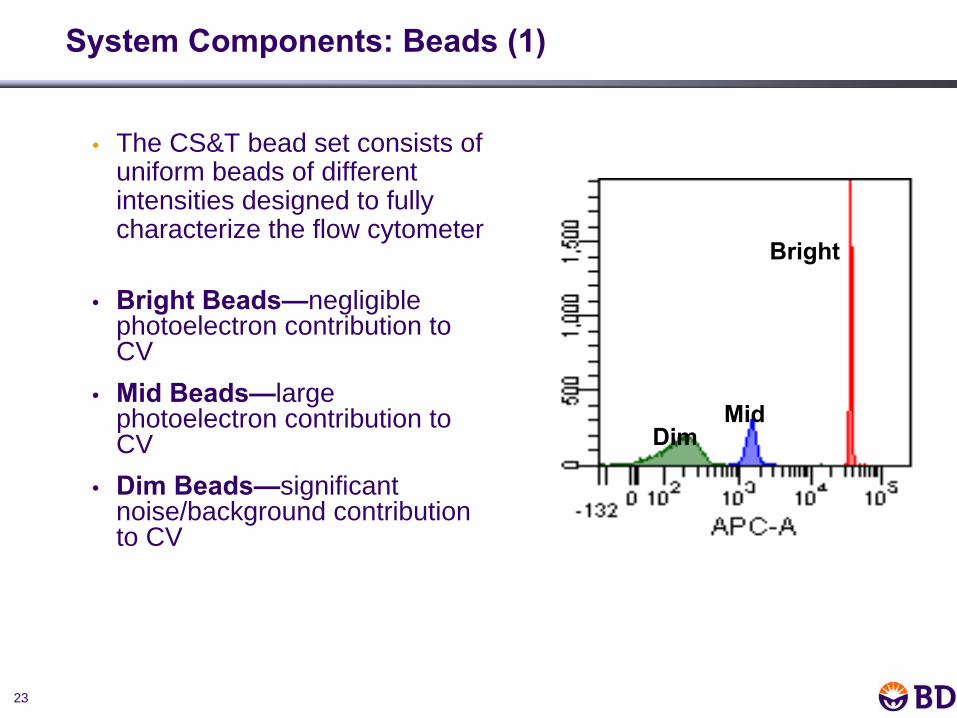
• The CS&T bead set consists of uniform beads of different intensities designed to fully characterize the flow cytometer
• Bright Beads—negligible photoelectron contribution to CV
• Mid Beads—large photoelectron contribution to CV
• Dim Beads—significant noise/background contribution to CV
24
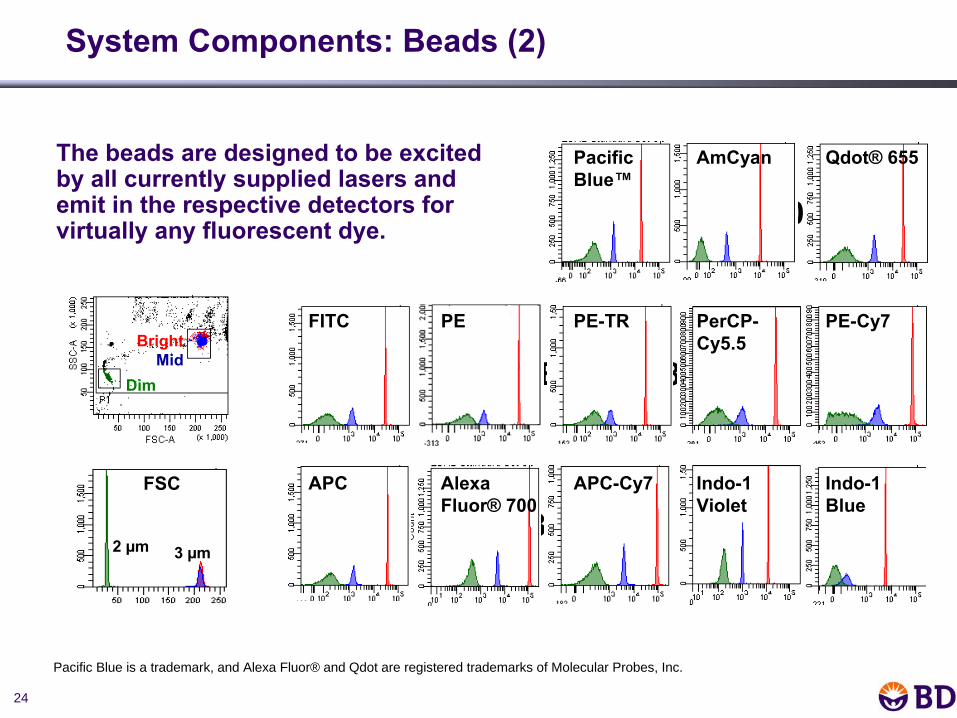
UV (362 nm)Red (633 nm)
Blue (488 nm)
Violet (407 nm)
AmCyanPacificBlue™
Qdot®
655
Indo-1Violet
Indo-1Blue
APC APC-Cy7AlexaFluor®
700
Dim
BrightMid
FSC
3 µm2 µm
The beads are designed to be excited by all currently supplied lasers and emit in the respective detectors for virtually any fluorescent dye.
PerCP-Cy5.5
FITC PE-Cy7PE-TRPE
System Components: Beads (2)
Pacific Blue is a trademark, and Alexa Fluor® and Qdot are registered trademarks of Molecular Probes, Inc.
25
• Very flexible system using user-defined:
– Cytometer configurations to support any number of lasers, parameters, and nozzles
– Fluorochrome parameters, filters, and mirrors including Q-dots and new fluorochromes
– Alarm boundaries for tracking performance
– Application settings
System Components: Software
26
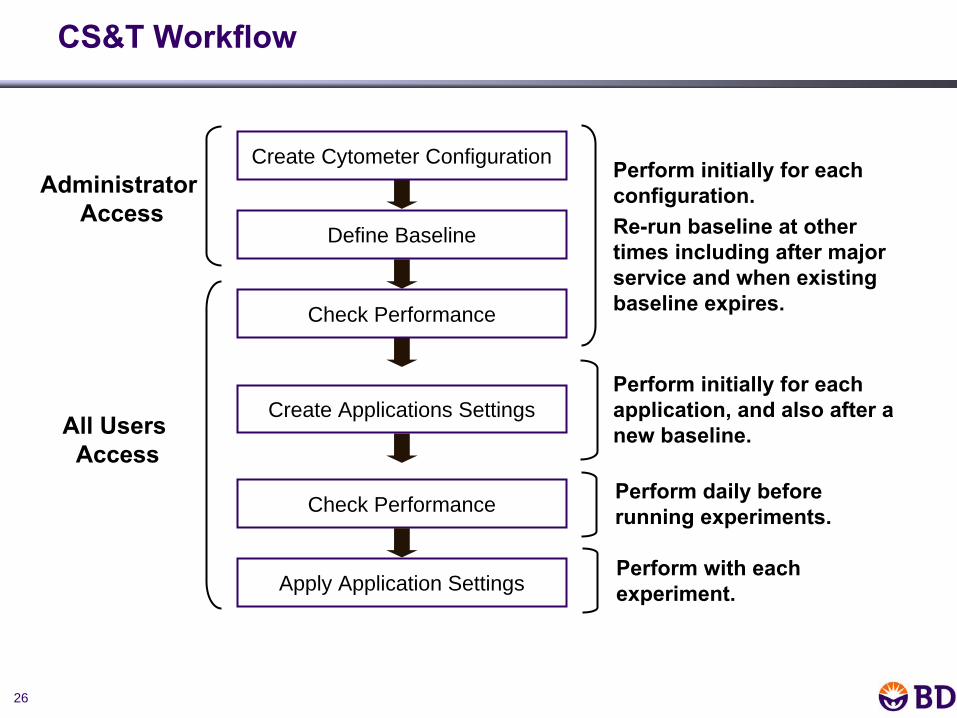
CS&T Workflow
Administrator Access
All Users Access
Perform initially for each configuration.Re-run baseline at other times including after major service and when existing baseline expires.
Create Cytometer Configuration
Check Performance
Create Applications Settings
Define Baseline
Check Performance
Apply Application Settings
Perform initially for each application, and also after a new baseline.
Perform daily before running experiments.
Perform with each experiment.
27
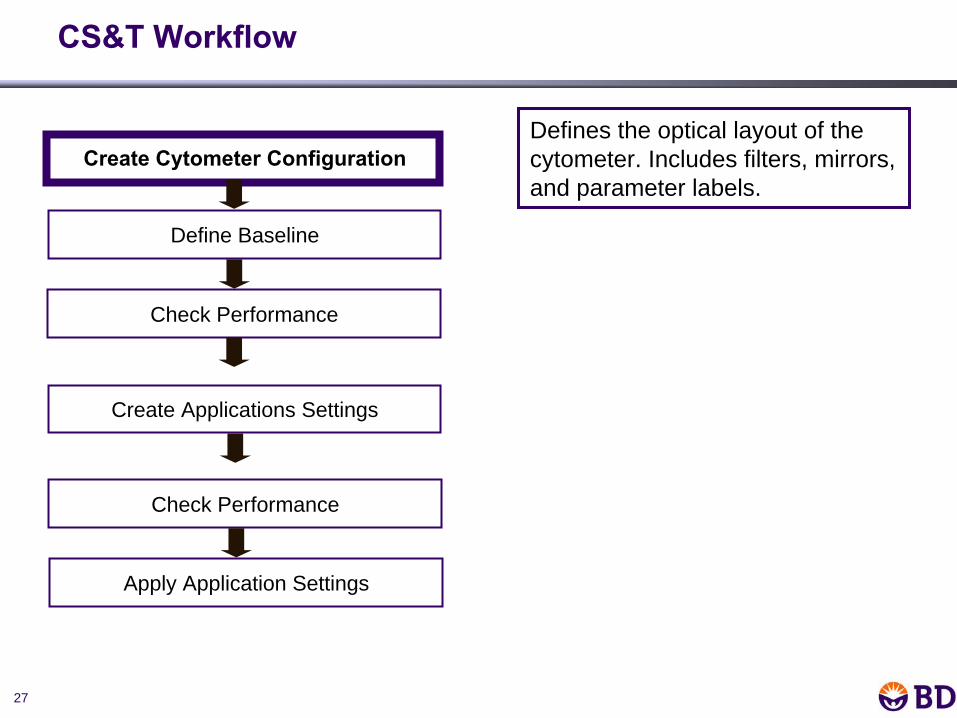
Create Cytometer Configuration
CS&T Workflow
Defines the optical layout of the cytometer. Includes filters, mirrors, and parameter labels.
Check Performance
Create Applications Settings
Define Baseline
Check Performance
Apply Application Settings
28
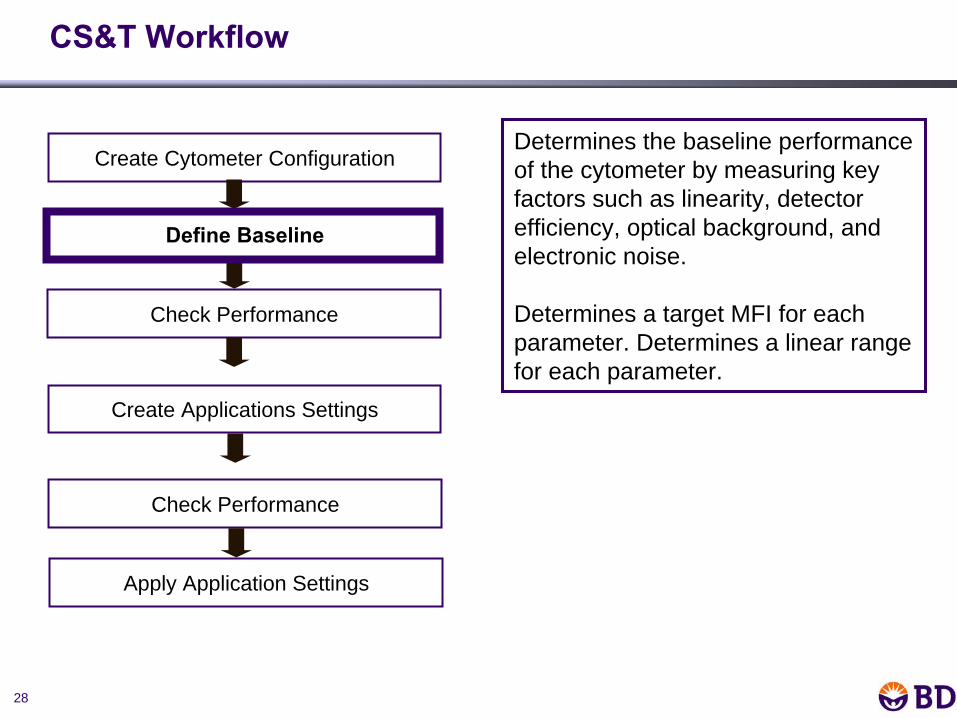
CS&T Workflow
Determines the baseline performance of the cytometer by measuring key factors such as linearity, detector efficiency, optical background, and electronic noise.
Determines a target MFI for each parameter. Determines a linear range for each parameter.
Create Cytometer Configuration
Check Performance
Create Applications Settings
Define Baseline
Check Performance
Apply Application Settings
29
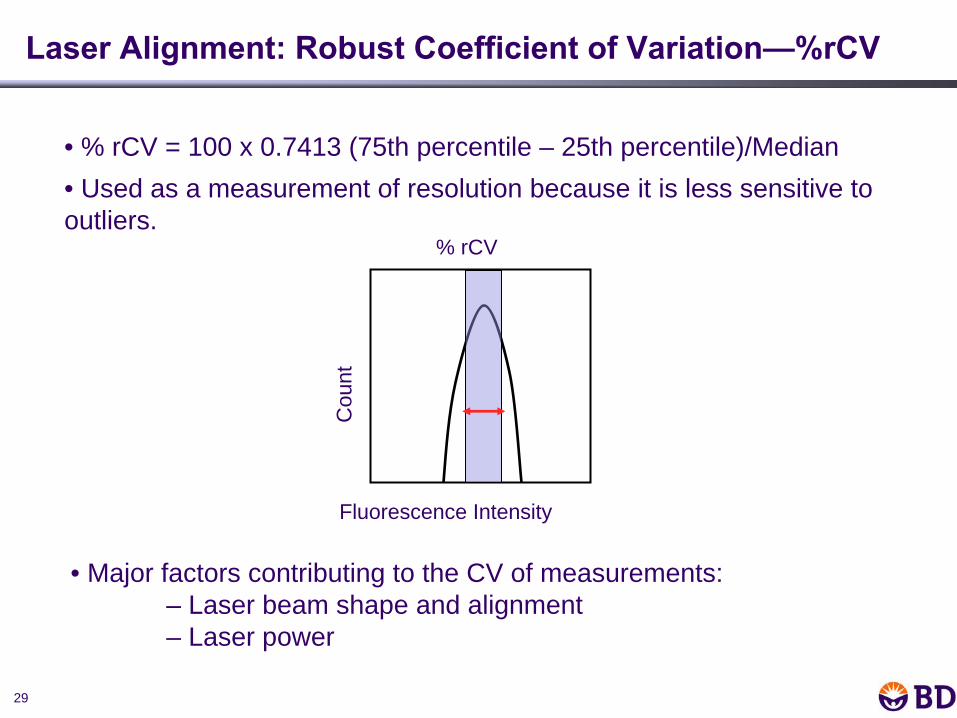
Laser Alignment: Robust Coefficient of Variation—%rCV
• % rCV = 100 x 0.7413 (75th percentile – 25th percentile)/Median• Used as a measurement of resolution because it is less sensitive to outliers.
% rCV
Cou
nt
Fluorescence Intensity
• Major factors contributing to the CV of measurements:– Laser beam shape and alignment– Laser power
3030
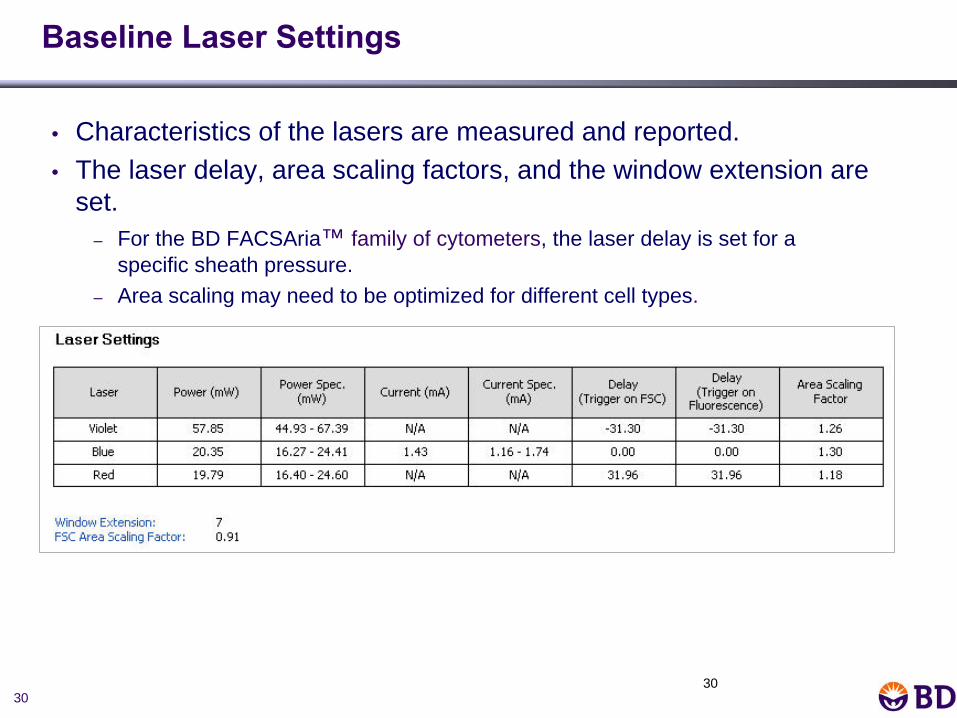
Baseline Laser Settings
• Characteristics of the lasers are measured and reported. • The laser delay, area scaling factors, and the window extension are
set.– For the BD FACSAria™ family of cytometers, the laser delay is set for a
specific sheath pressure.– Area scaling may need to be optimized for different cell types.
31
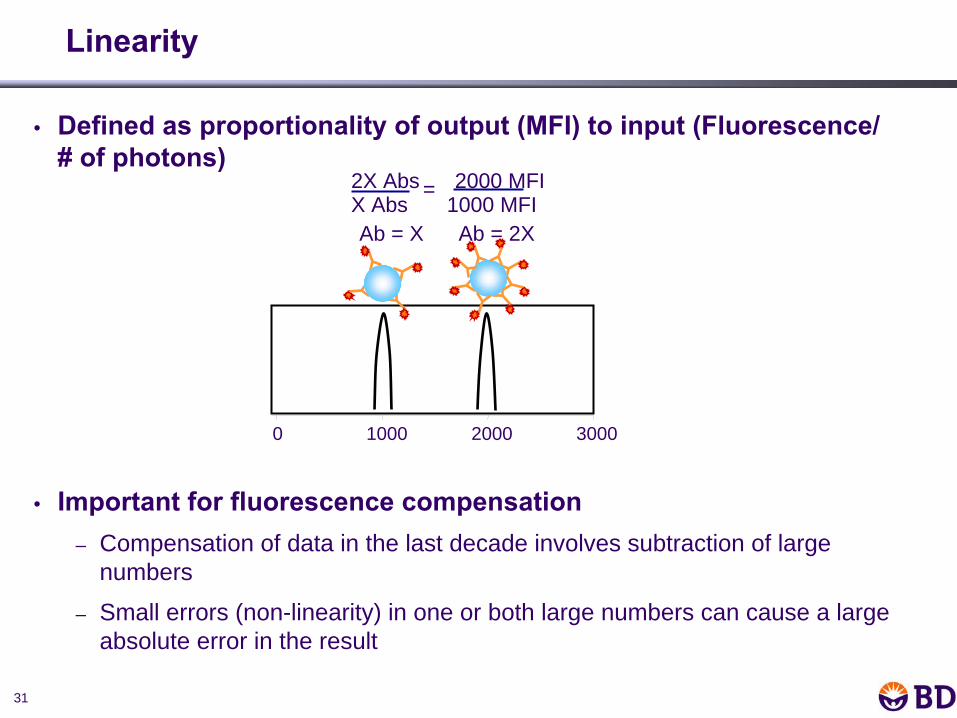
• Defined as proportionality of output (MFI) to input (Fluorescence/ # of photons)
• Important for fluorescence compensation – Compensation of data in the last decade involves subtraction of large
numbers
– Small errors (non-linearity) in one or both large numbers can cause a large absolute error in the result
Linearity
Ab = X Ab = 2X
0 1000 2000 3000
X Abs2X Abs =
1000 MFI2000 MFI
32
73,000365
D
1,79675
B
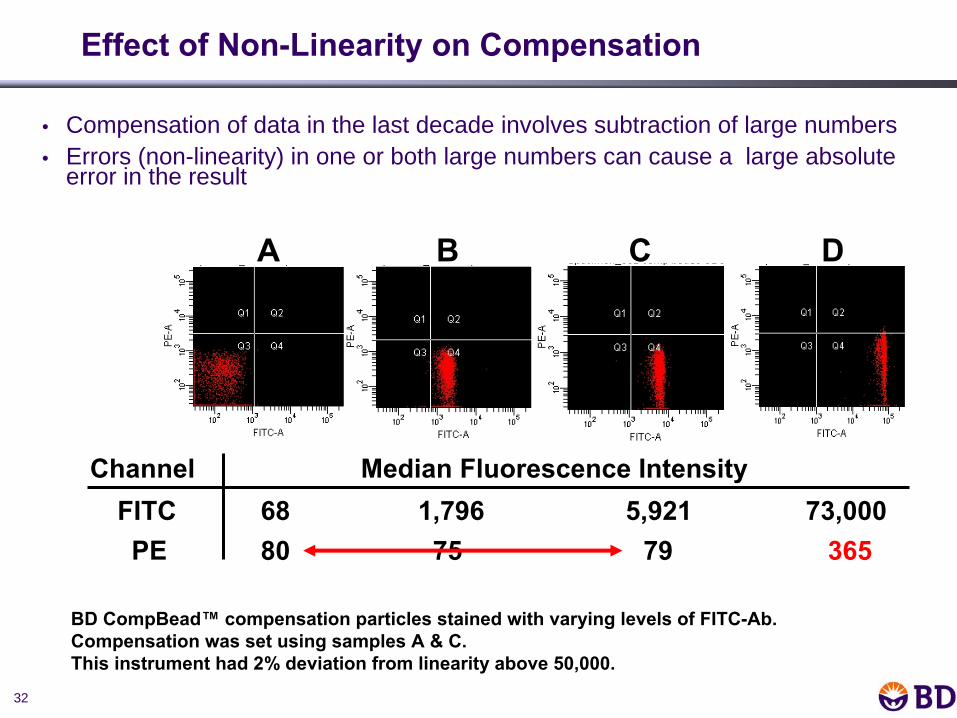
Effect of Non-Linearity on Compensation
BD CompBead™
compensation particles stained with varying levels of FITC-Ab.Compensation was set using samples A & C.This instrument had 2% deviation from linearity above 50,000.
FITCPE
A
6880
Channel Median Fluorescence Intensity5,921
79
C
• Compensation of data in the last decade involves subtraction of large numbers• Errors (non-linearity) in one or both large numbers can cause a large absolute
error in the result
33
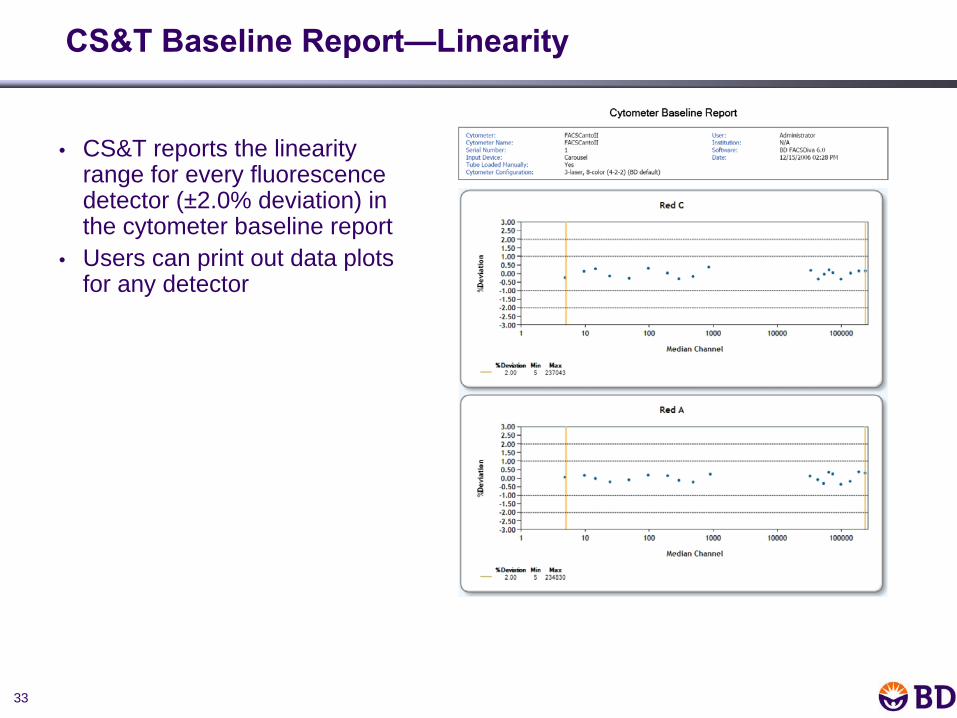
CS&T Baseline Report—Linearity
• CS&T reports the linearity range for every fluorescence detector (±2.0% deviation) in the cytometer baseline report
• Users can print out data plots for any detector
34
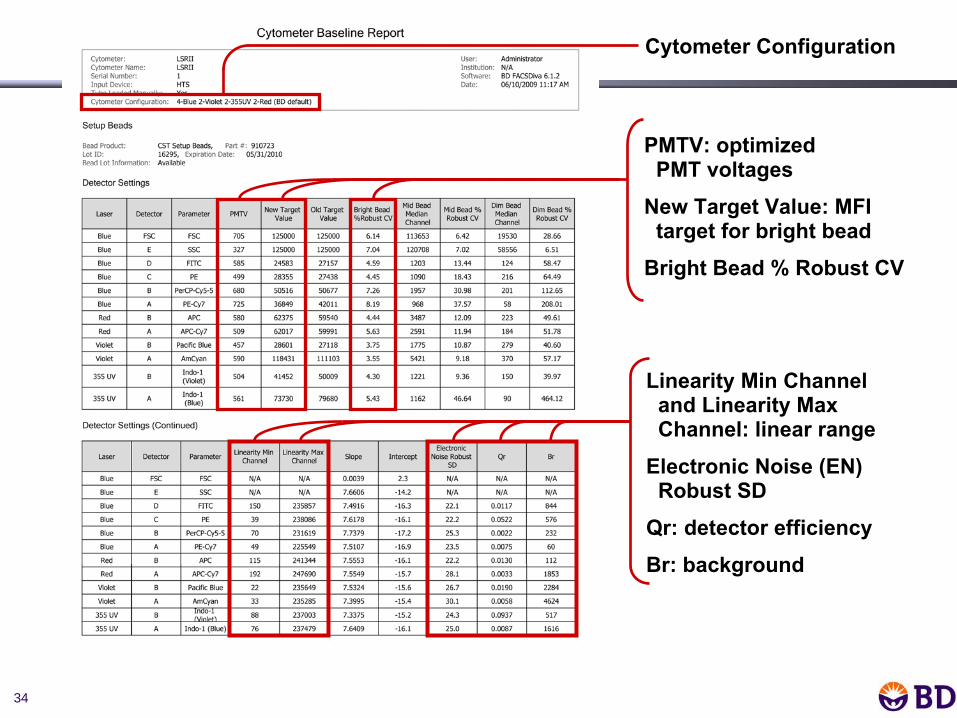
Linearity Min Channel and Linearity Max Channel: linear range
Electronic Noise (EN) Robust SD
Qr: detector efficiency Br: background
PMTV: optimized
PMT voltages
New Target Value: MFI target for bright bead
Bright Bead % Robust CV
Cytometer Configuration

35
Baseline PMTVs
and MFI Target Values
• For each parameter, CS&T determines a baseline PMTV that places the dim bead at an MFI equal to 10 x SDEN.
SDEN = 18.11
MFI = 10 x SDEN = 181.1
PMTV =
451
36
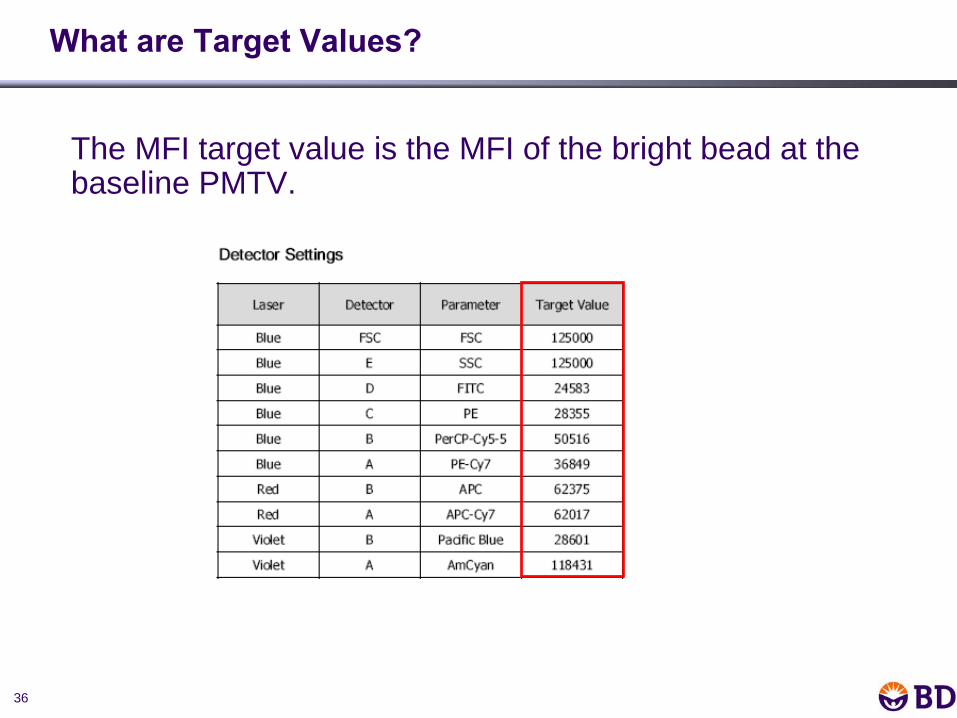
The MFI target value is the MFI of the bright bead at the baseline PMTV.
What are Target Values?
37
Day 1
Day 2
Day 2
550 V
550 V
560 V
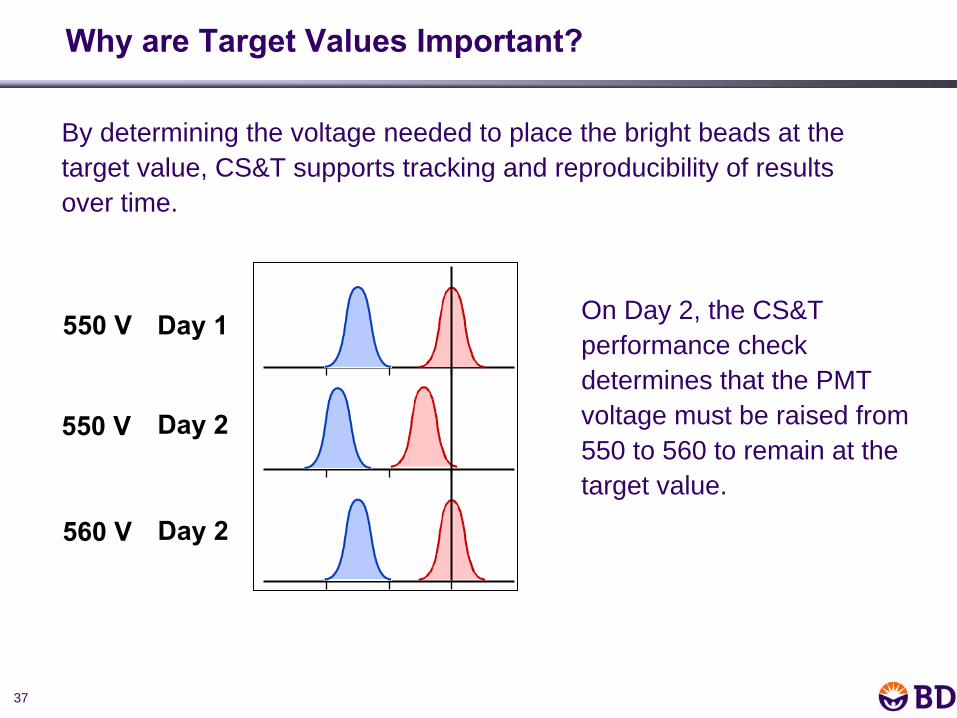
Why are Target Values Important?
By determining the voltage needed to place the bright beads at the target value, CS&T supports tracking and reproducibility of results over time.
On Day 2, the CS&T performance check determines that the PMT voltage must be raised from 550 to 560 to remain at the target value.
38
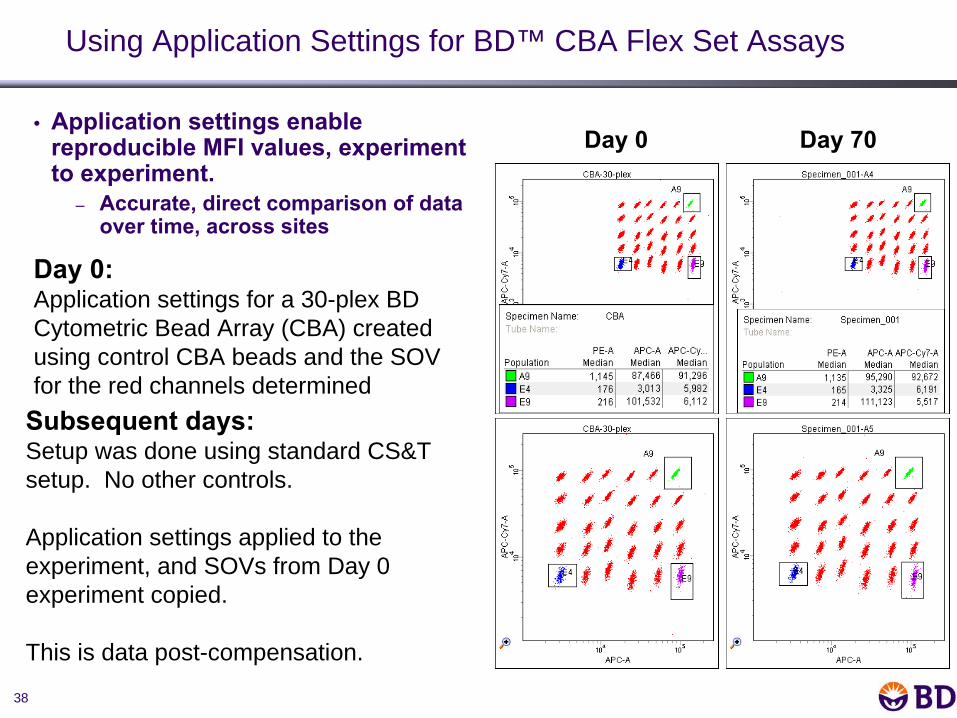
Using Application Settings for BD™ CBA Flex Set Assays
Day 0
Day 0:Application settings for a 30-plex BD Cytometric Bead Array (CBA) created using control CBA beads and the SOV for the red channels determined
• Application settings enable reproducible MFI values, experiment to experiment.
– Accurate, direct comparison of data over time, across sites
Day 70
Subsequent days:Setup was done using standard CS&T setup. No other controls.
Application settings applied to the experiment, and SOVs from Day 0 experiment copied.
This is data post-compensation.
39
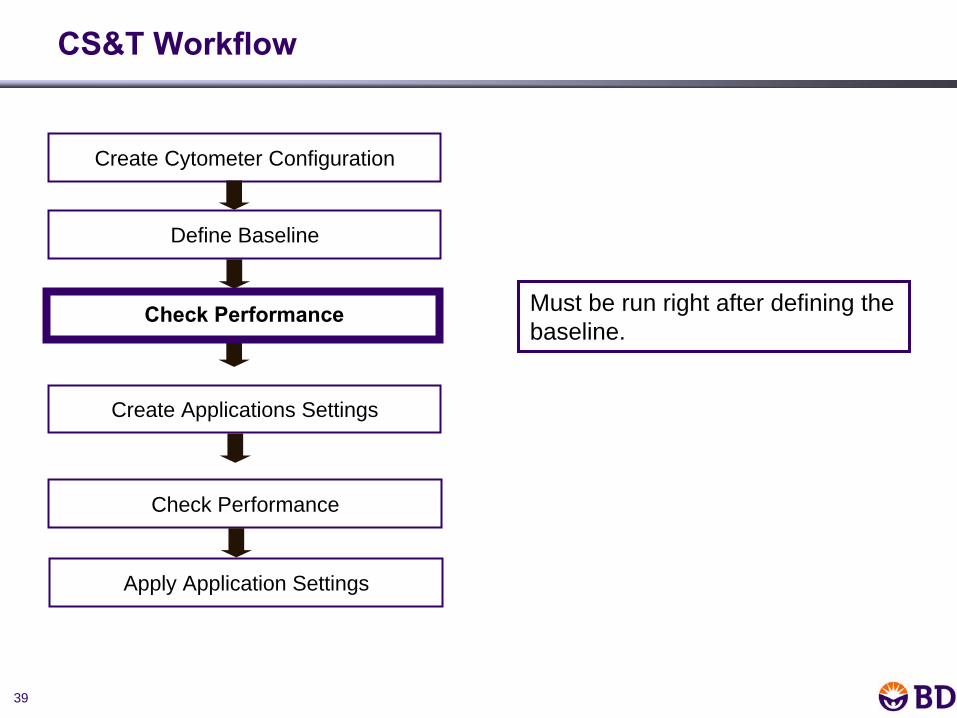
CS&T Workflow
Must be run right after defining the baseline.
Create Cytometer Configuration
Check Performance
Create Applications Settings
Define Baseline
Check Performance
Apply Application Settings
40
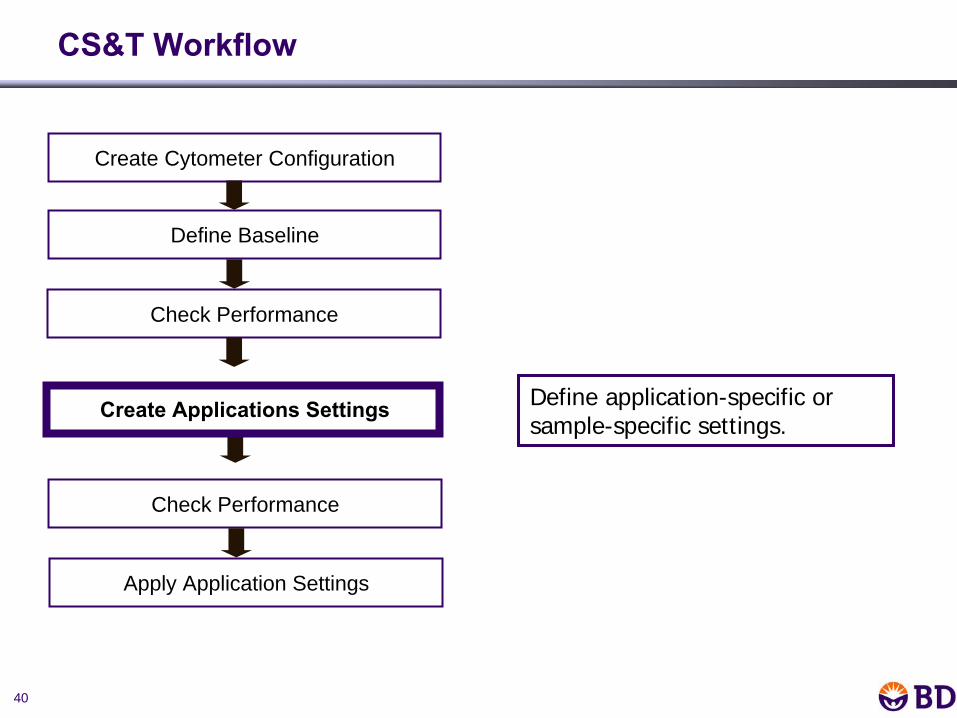
CS&T Workflow
Define application-specific or sample-specific settings.
Create Cytometer Configuration
Check Performance
Create Applications Settings
Define Baseline
Check Performance
Apply Application Settings
41
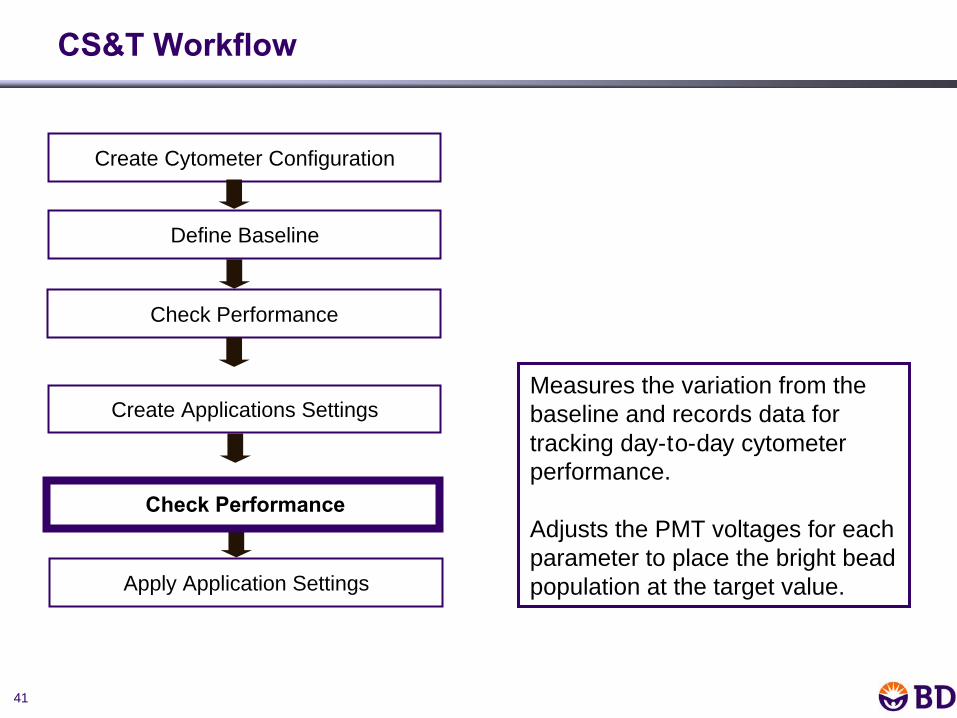
CS&T Workflow
Create Cytometer Configuration
Check Performance
Create Applications Settings
Define Baseline
Check Performance
Apply Application Settings
Measures the variation from the baseline and records data for tracking day-to-day cytometer performance.
Adjusts the PMT voltages for each parameter to place the bright bead population at the target value.
42
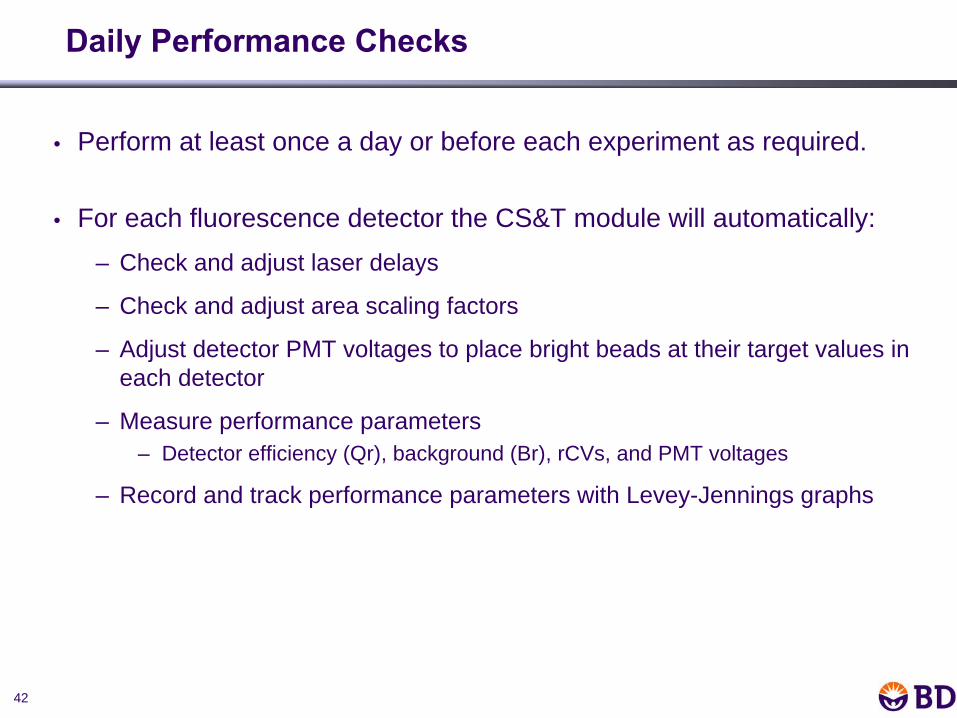
Daily Performance Checks
• Perform at least once a day or before each experiment as required.
• For each fluorescence detector the CS&T module will automatically:– Check and adjust laser delays
– Check and adjust area scaling factors
– Adjust detector PMT voltages to place bright beads at their target values in each detector
– Measure performance parameters– Detector efficiency (Qr), background (Br), rCVs, and PMT voltages
– Record and track performance parameters with Levey-Jennings graphs
43
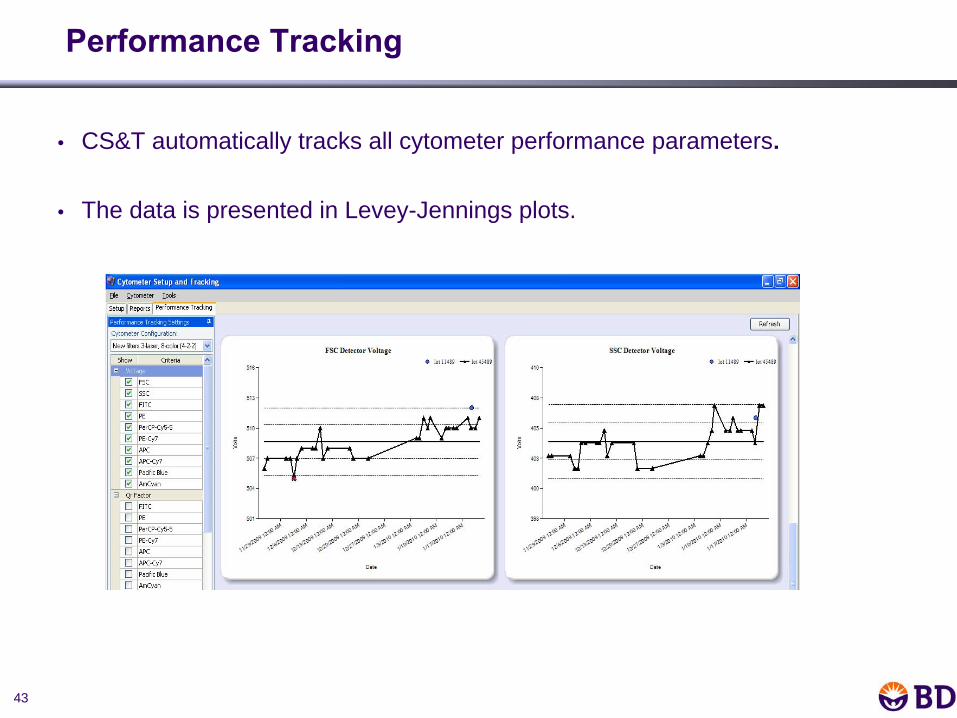
Performance Tracking
• CS&T automatically tracks all cytometer performance parameters.
• The data is presented in Levey-Jennings plots.
44
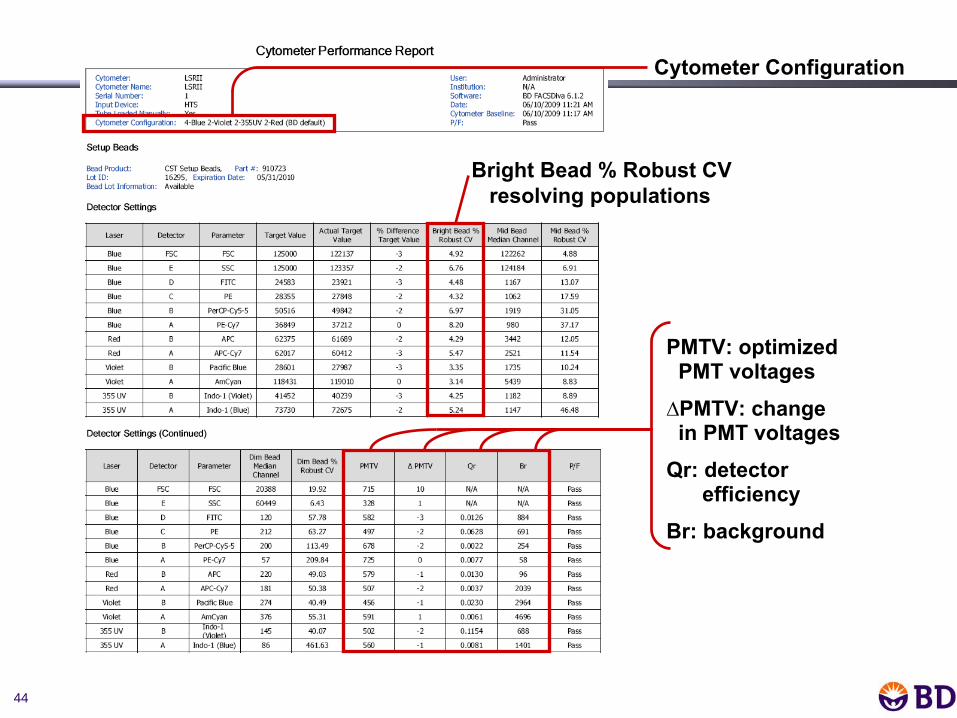
PMTV: optimized
PMT voltages∆PMTV: change
in PMT voltagesQr: detector
efficiency Br: background
Bright Bead % Robust CV
resolving populations
Cytometer Configuration
45
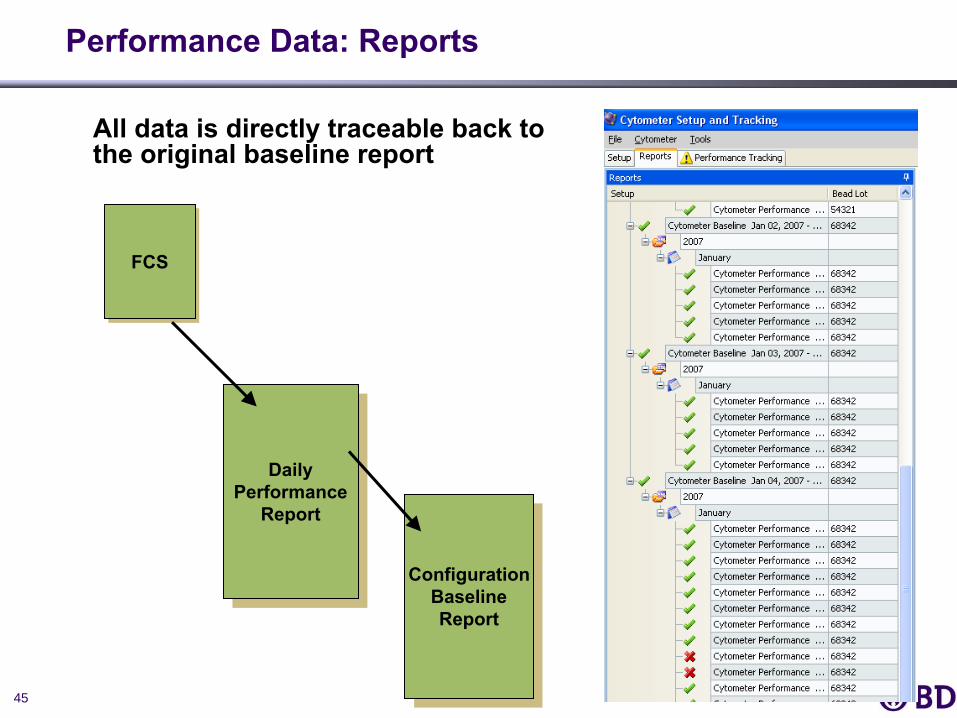
Performance Data: Reports
All data is directly traceable back to the original baseline report
FCSFCS
DailyPerformance
Report
DailyPerformance
Report
ConfigurationBaselineReport
ConfigurationBaselineReport
46
Optimizing Gain Settings (MFI)
47
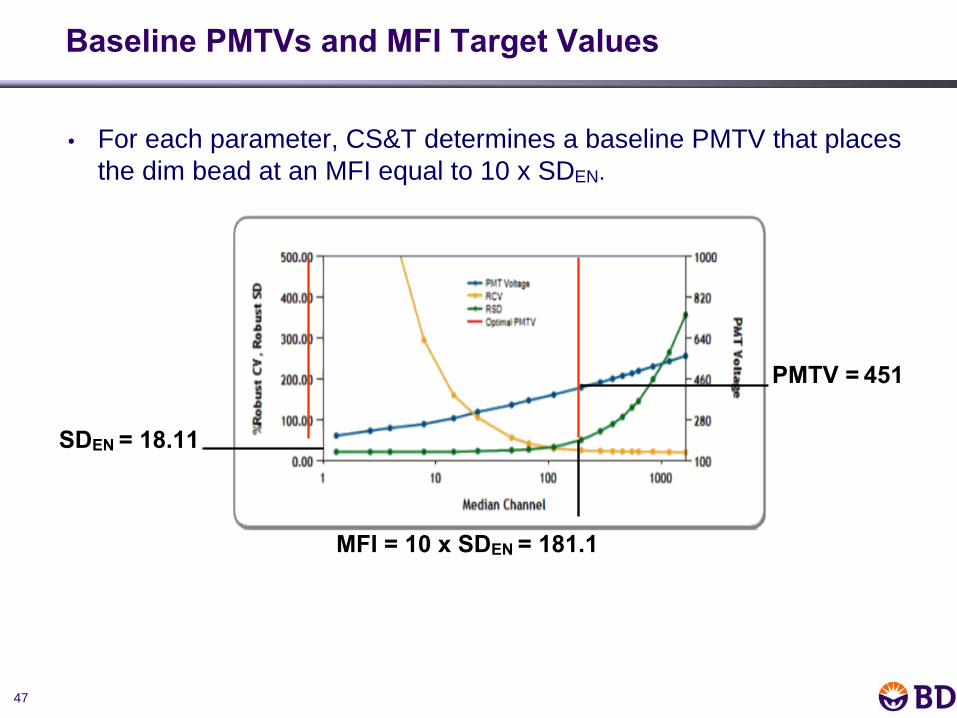
Baseline PMTVs
and MFI Target Values
• For each parameter, CS&T determines a baseline PMTV that places the dim bead at an MFI equal to 10 x SDEN.
SDEN = 18.11
MFI = 10 x SDEN = 181.1
PMTV =
451
48
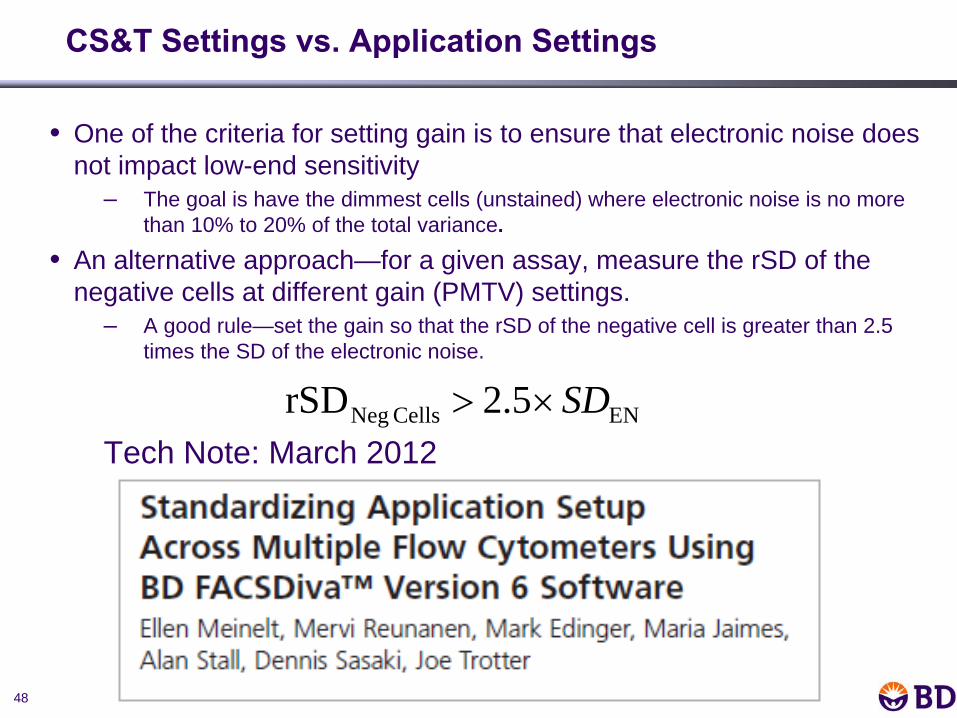
• One of the criteria for setting gain is to ensure that electronic noise does not impact low-end sensitivity
– The goal is have the dimmest cells (unstained) where electronic noise is no more than 10% to 20% of the total variance.
• An alternative approach—for a given assay, measure the rSD of the negative cells at different gain (PMTV) settings.
– A good rule—set the gain so that the rSD of the negative cell is greater than 2.5 times the SD of the electronic noise.
Tech Note: March 2012ENCells Neg 5.2rSD SD×>
CS&T Settings vs. Application Settings
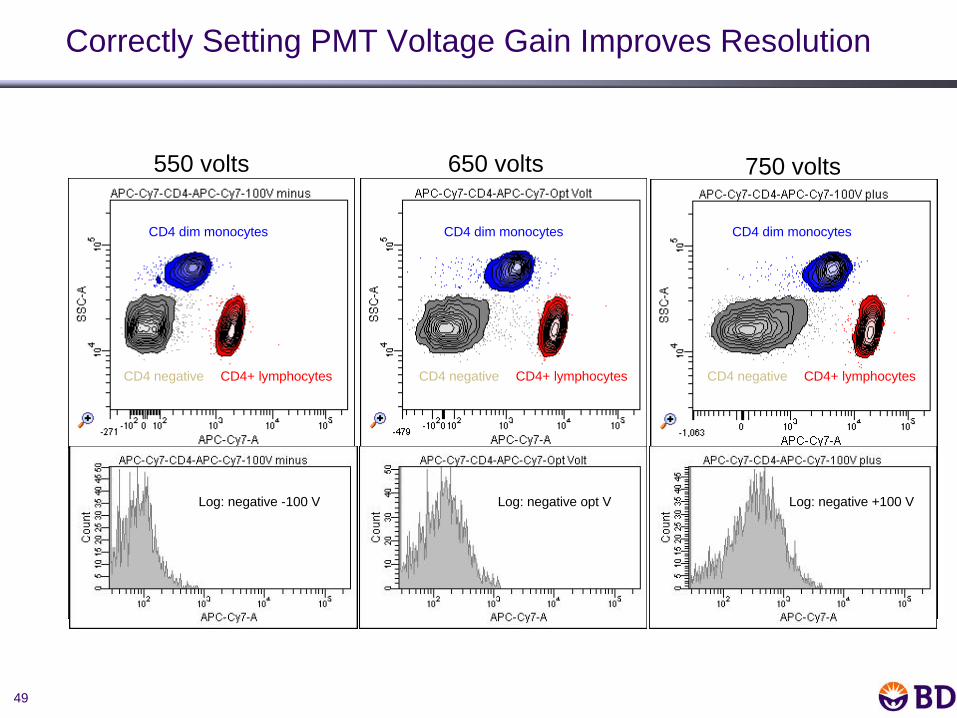
49
550 volts 650 volts 750 volts
CD4 dim monocytes
CD4+ lymphocytesCD4 negative
CD4 dim monocytes
CD4+ lymphocytesCD4 negative
CD4 dim monocytes
CD4+ lymphocytesCD4 negative
Log: negative -100 V Log: negative opt V Log: negative +100 V
Correctly Setting PMT Voltage Gain Improves Resolution
50
• Things to consider in optimizing the cytometer setup for your specific application:
1. Electronic Noise can affect resolution sensitivityA good minimal application PMT voltage would place the dimmest cells (unstained) where electronic noise is no more than 10% to 20% of the total variance.
2.
Dynamic range assessment for each fluorescence parametera)
Are the brightest populations within the linear range of the detector?• Leave room for ~ 2-fold increase in expression levels and ensure the cells are
in the linear range of the detector.b)
Are the compensation controls within the linear range of the detector?• If positive cells are outside of the linear range, compensation may be
inaccurate.c)
Are the negatives (in a stained sample) too high?• This is a matter of taste.
3.
An optimal cytometer gain setting is one for which both conditions are met.
Factors to Consider for an Optimal Gain Setup
51
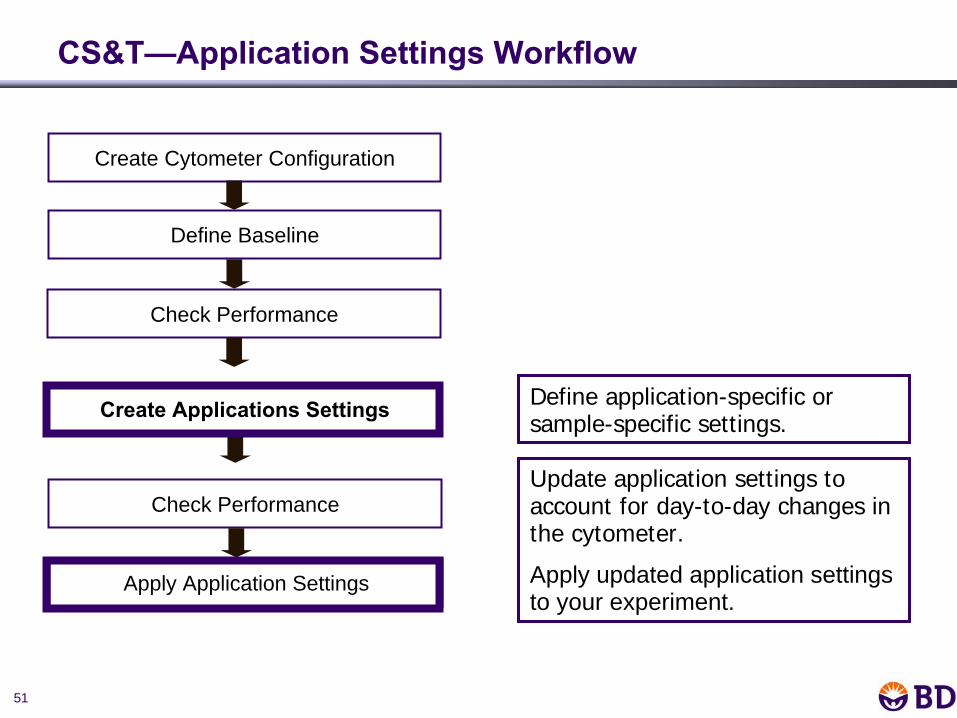
CS&T—Application Settings Workflow
Create Cytometer Configuration
Check Performance
Create Applications Settings
Define Baseline
Check Performance
Apply Application Settings
Define application-specific or sample-specific settings.
Update application settings to account for day-to-day changes in the cytometer.
Apply updated application settings to your experiment.
52
Application Settings Scope
• The GOAL is to optimize settings for the CELLS
of interest.
• These settings reliably adjust:
The negative population(s) to be above the noise on the low end of the measurement.
The positive population(s) to be below the top of the linear range at the high end of the measurement.
53
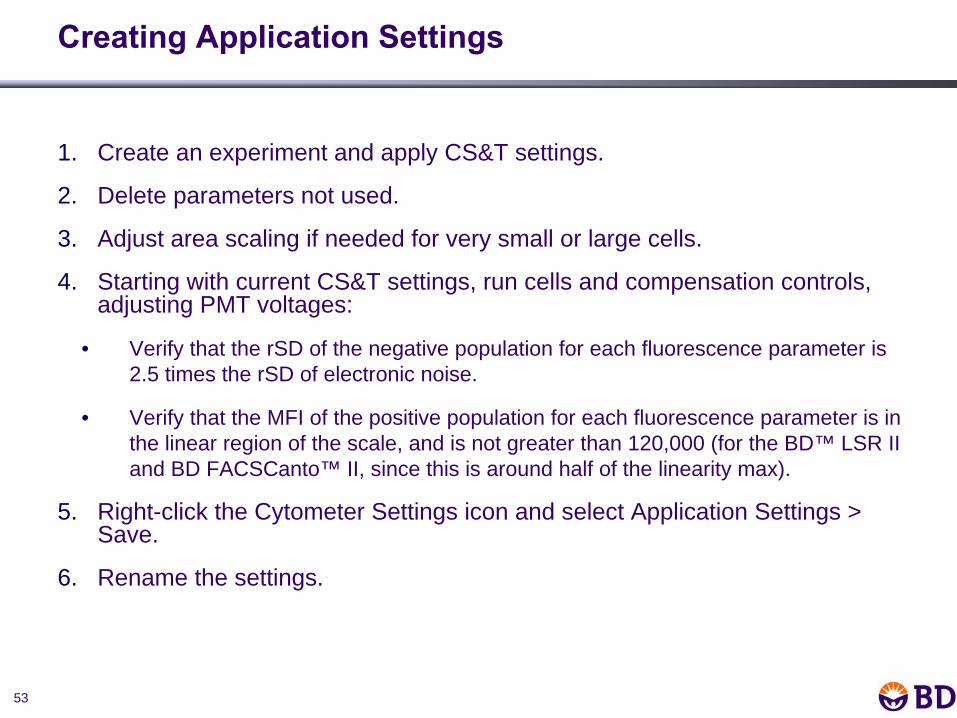
Creating Application Settings
1. Create an experiment and apply CS&T settings.
2. Delete parameters not used.
3. Adjust area scaling if needed for very small or large cells.
4. Starting with current CS&T settings, run cells and compensation controls, adjusting PMT voltages:
• Verify that the rSD of the negative population for each fluorescence parameter is 2.5 times the rSD of electronic noise.
• Verify that the MFI of the positive population for each fluorescence parameter is in the linear region of the scale, and is not greater than 120,000 (for the BD™ LSR II and BD FACSCanto™ II, since this is around half of the linearity max).
5. Right-click the Cytometer Settings icon and select Application Settings > Save.
6. Rename the settings.
54
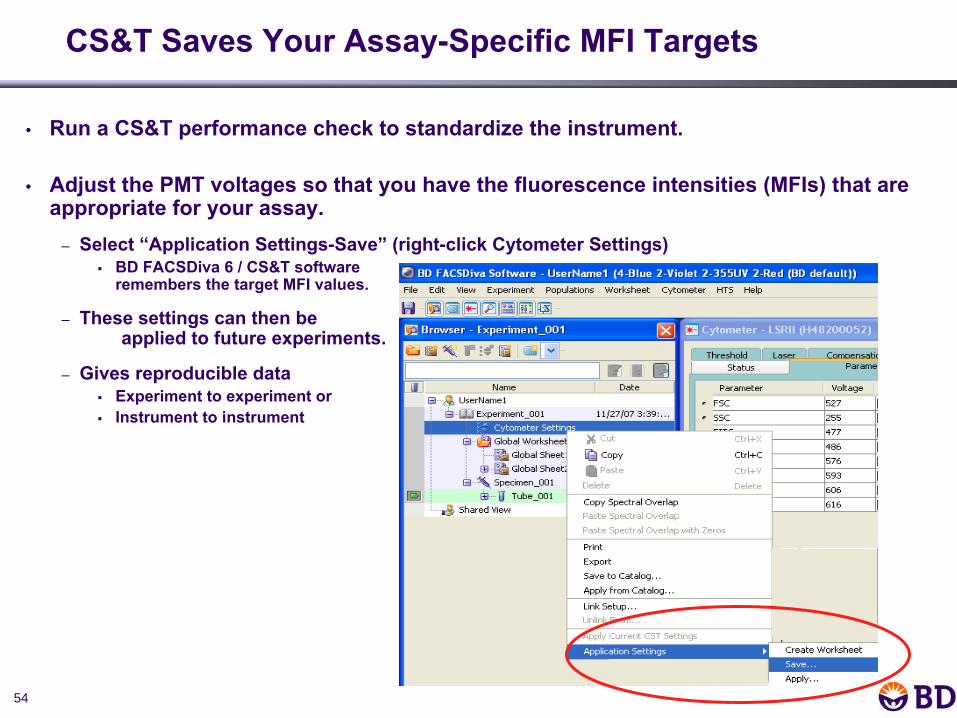
CS&T Saves Your Assay-Specific MFI Targets
• Run a CS&T performance check to standardize the instrument.
• Adjust the PMT voltages so that you have the fluorescence intensities (MFIs) that are appropriate for your assay.
– Select “Application Settings-Save”
(right-click Cytometer
Settings)BD FACSDiva 6 / CS&T software remembers the target MFI values.
– These settings can then be applied to future experiments.
– Gives reproducible dataExperiment to experiment orInstrument to instrument
55
Summary: Setting Up Your Instrument
• Only two things need to be done to set up a single instrument for a given type of assay.
1.
Set the gain [PMT voltage], to achieve reproducible fluorescence intensity (MFI): this is achieved by creating and using application settings in parallel to use of CS&T.
2.
Correct for background from fluorescence spillover [compensation], which is instrument-dependent.
• For comparing results of assays to be run on multiple instruments, it is important that the MFIs are consistent and reproducible between the instruments.
For Research Use Only. Not for use in diagnostic or therapeutic procedures.
56
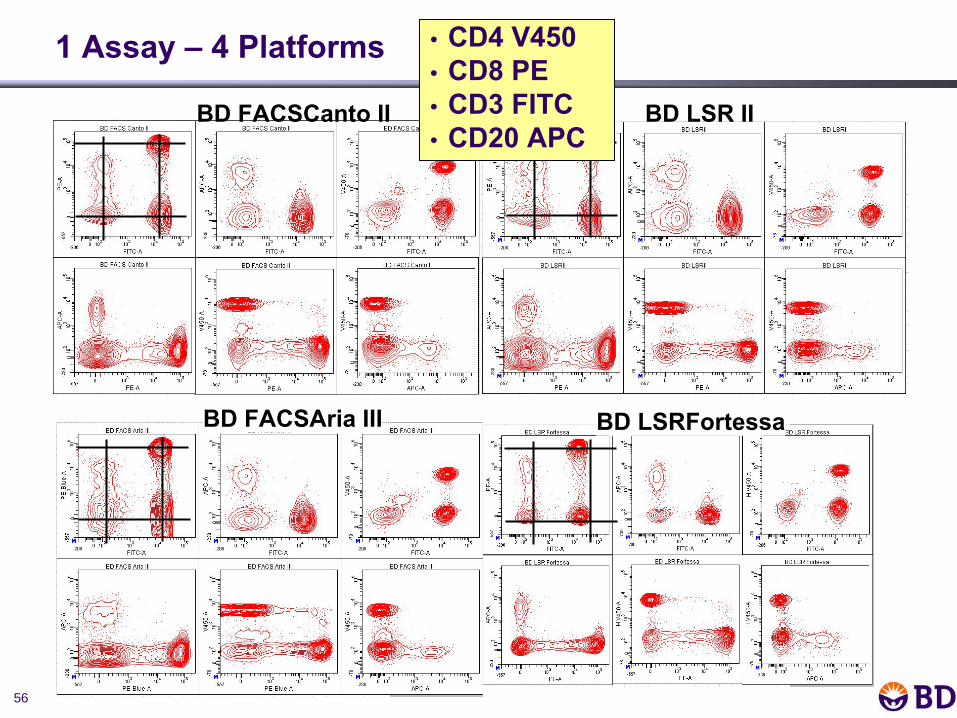
BD FACSCanto
II
1 Assay –
4 Platforms
BD LSR II
BD LSRFortessaBD FACSAria
III
• CD4 V450 • CD8 PE• CD3 FITC• CD20 APC