Embed Size (px)
Citation preview

Using Tableau Software for Financial Analysis
Robert RouseAnalytics Consultant, InterWorks, Inc.

Agenda
• What is Visual Analytics?
• Tableau Overview and Demo
• Comparing Values: KPIs, Prior Period, Plan, Budget, etc.
• Checking Data Quality

“Visual analytics is the representation and presentation of data that exploits our visual perception abilities in order to amplify cognition”
– Andy Kirk, author of “Data Visualization: a successful design process”
• Sharing data in meaningful and insightful ways
• Using knowledge of human understanding to show the ‘best’ view for users
• Creating informative yet concise visualizations
What is Visual Analytics?
© InterWorks

How Many 9s?
© InterWorks

Now?
© InterWorks
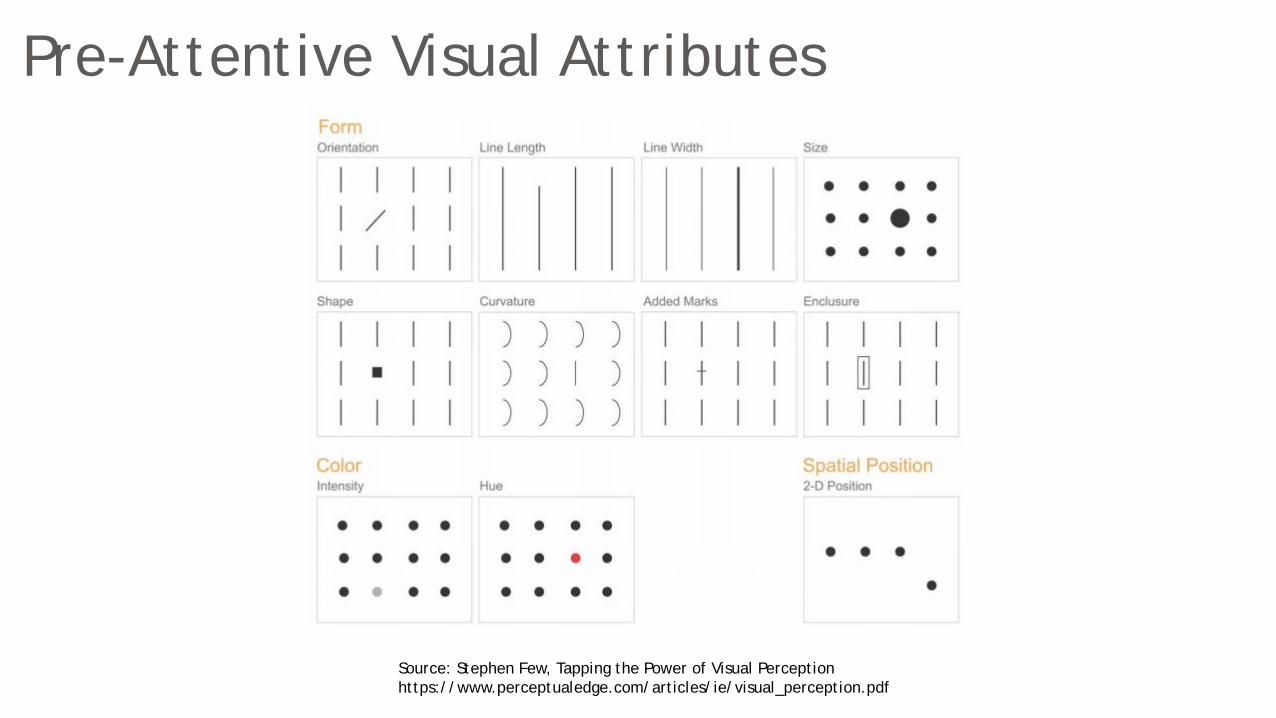
Pre-Attentive Visual Attributes
Source: Stephen Few, Tapping the Power of Visual Perception https://www.perceptualedge.com/articles/ie/visual_perception.pdf

Let’s Use Visual Analytics!
© InterWorks

When we use visual analytics, it is easy to see we have 10nines.
© InterWorks

Visual Analytics in PracticeA Sample Case Study
Can you answer?
• Which Product Type has the highest Profit?
• Which State has the highest Budget Profit?
• What percent of Profit in each Region is over budget?
• What is the trend of Profit over time?
NOT REAL DATA
© InterWorks
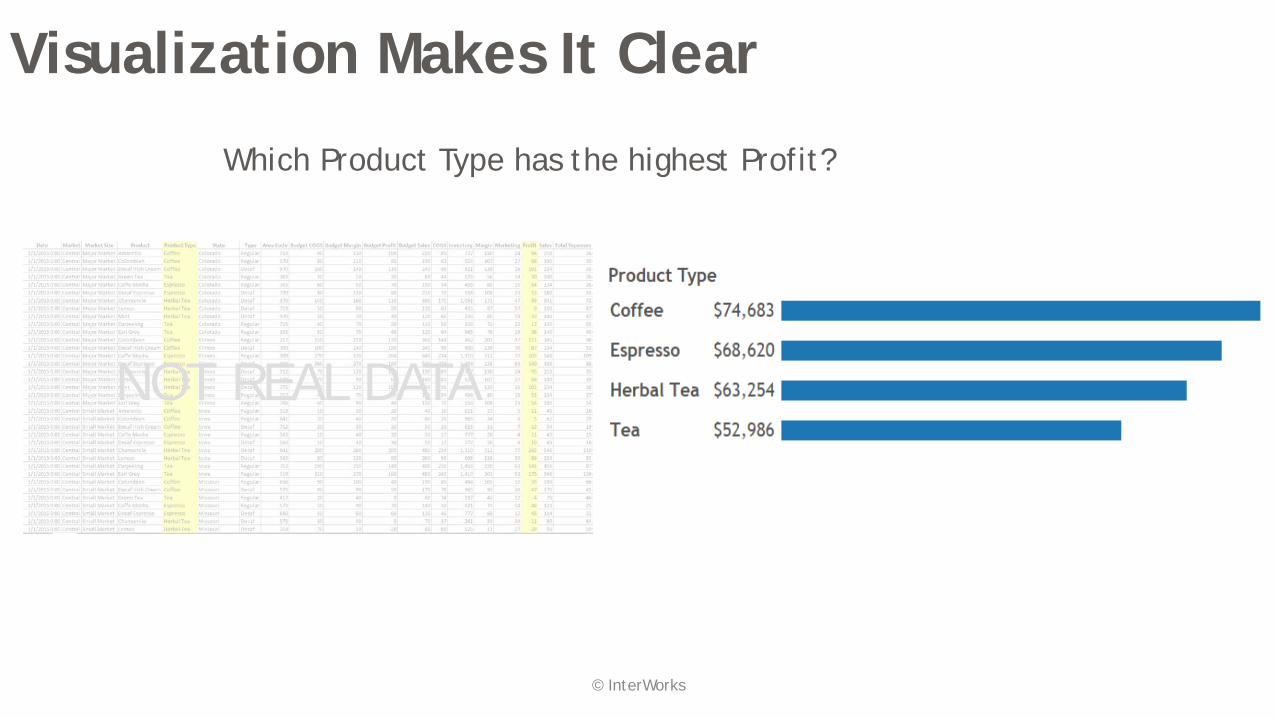
Visualization Makes It Clear
Which Product Type has the highest Profit?
NOT REAL DATA
© InterWorks

TableauDemo

Comparing Values

See Chapter 8
© InterWorks

© InterWorks

© InterWorks

Data Quality

CAPEX and O&M Projection Variances – Old Way
© InterWorks

CAPEX and O&M Projection Variances, Visualized
© InterWorks

Data Tips & Tricks?See Our Blog.• Our business intelligence blog is an expansive resource for
those digging into their data.
• Beginners and experts alike will find valuable insight from the front lines of business intelligence.

This comprehensive guide covers the core feature set for data analytics, illustrating best practices for creating and sharing specific types of dynamic data visualizations.
Available from Amazon and Barnes & Noble. www.tableauyourdata.com
Author Dan Murray:
Director of Business Intelligence Services
We Wrote the Book on Tableau!