Embed Size (px)
Citation preview
1
1
Using Strategies, Protocols, and Tools toAnalyze Data
A Presentation of theNational Reading Technical Assistance Center (NRTAC)
PRESENTER: Lexie Domaradzki
DATE: May 28, 2009
MEETING: Alaska School Leadership Institute
2
Using Strategies, Protocols, and Toolsto Analyze Data
• Understand how to deepen dataanalysis skills to inform instruction
• Develop an institutionalized protocolfor data analysis
• Identify CBM reports that are mostcritical as you move forward withreading improvement
3
State Outcome Assessment Results:•Only a part of the whole picture
•One point in time during the school year
2
4
Our Opportunity
• Use frequent assessment results to seea more complete picture of the child’sskill development
• Understand how to support the child withefficient, effective instruction thatincreases their opportunity for success
5
The path we take .....
6
Quote ....
“You can have the results you sayyou want, or you can have thereasons why you can’t have them.But you can’t have both. Reasonsor results. You get to choose.”
Susan Scott
3
7
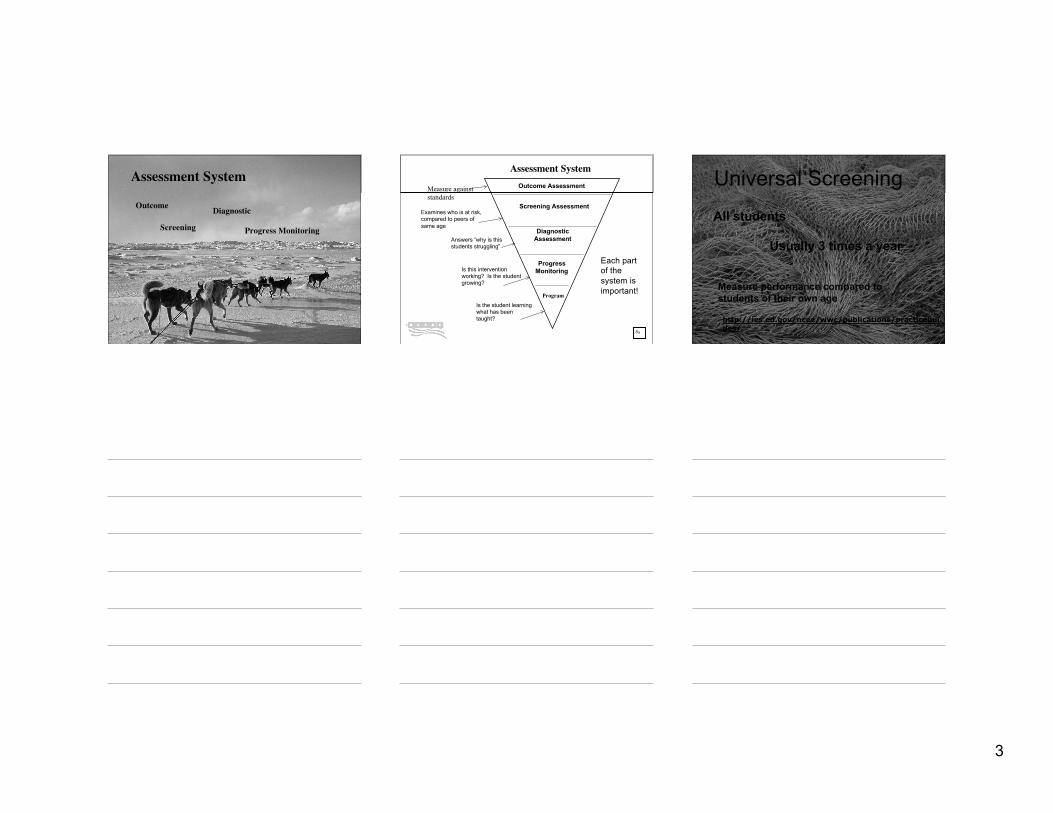
Assessment System
Outcome
Screening
Diagnostic
Progress Monitoring
88
Outcome Assessment
Screening Assessment
DiagnosticAssessment
ProgressMonitoring
Program
Measure againststandards
Examines who is at risk,compared to peers ofsame age
Answers “why is thisstudents struggling”
Is this interventionworking? Is the studentgrowing?
Is the student learningwhat has beentaught?
Each partof thesystem isimportant!
Assessment System
99
Universal Screening
All students
Usually 3 times a year
Measure performance compared tostudents of their own age
http://ies.ed.gov/ncee/wwc/publications/practiceguides/
4
1010
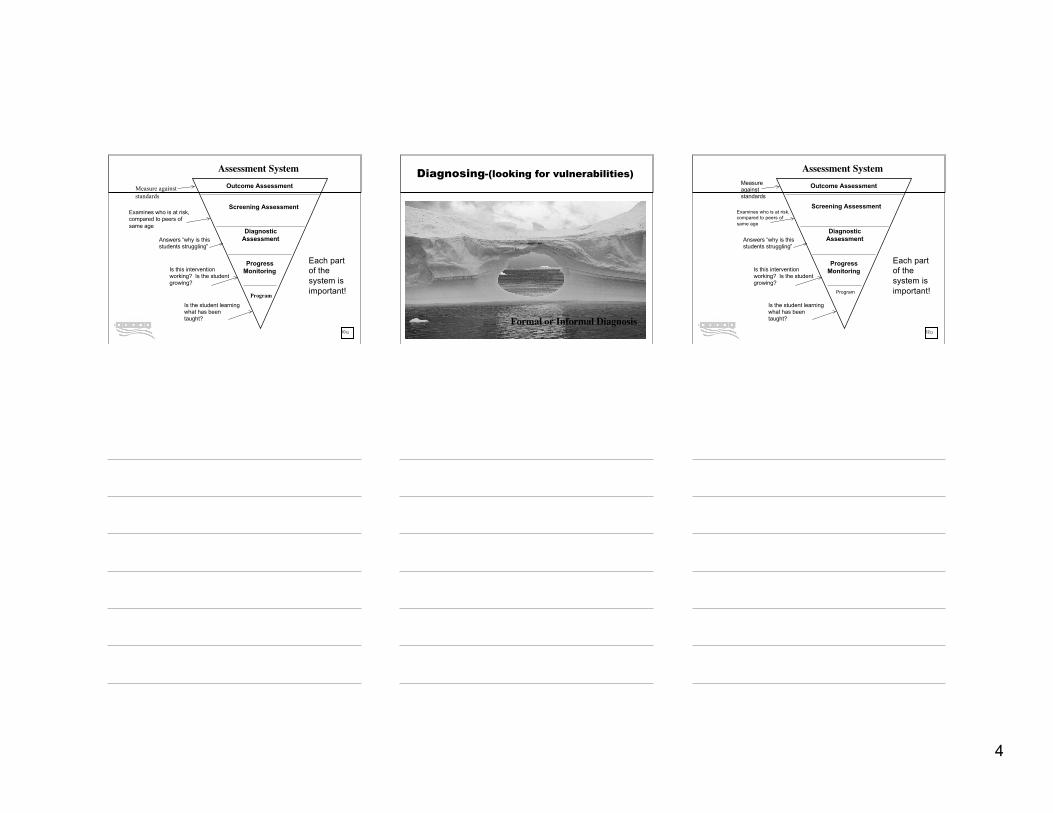
Outcome Assessment
Screening Assessment
DiagnosticAssessment
ProgressMonitoring
Program
Measure againststandards
Examines who is at risk,compared to peers ofsame age
Answers “why is thisstudents struggling”
Is this interventionworking? Is the studentgrowing?
Is the student learningwhat has beentaught?
Each partof thesystem isimportant!
Assessment System
11
Diagnosing-(looking for vulnerabilities)
Formal or Informal Diagnosis1212
Outcome Assessment
Screening Assessment
DiagnosticAssessment
ProgressMonitoring
Program
Measureagainststandards
Examines who is at risk,compared to peers ofsame age
Answers “why is thisstudents struggling”
Is this interventionworking? Is the studentgrowing?
Is the student learningwhat has beentaught?
Each partof thesystem isimportant!
Assessment System
5
13
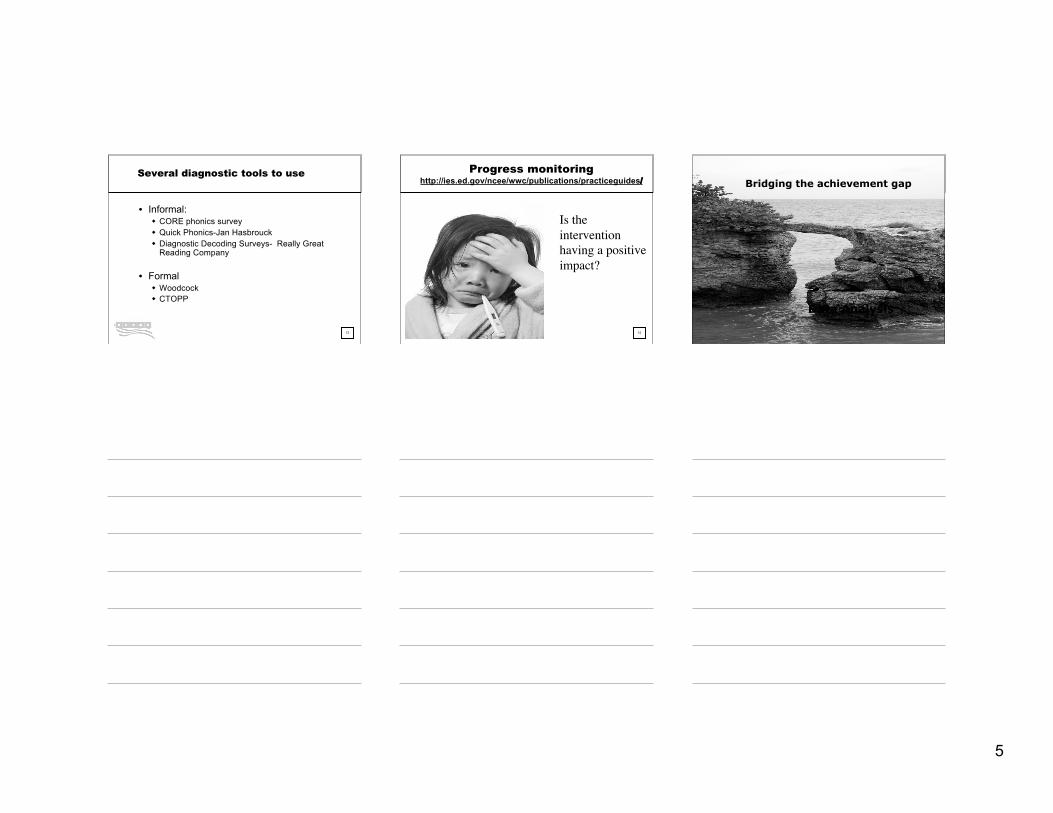
Several diagnostic tools to use
• Informal: CORE phonics survey Quick Phonics-Jan Hasbrouck Diagnostic Decoding Surveys- Really Great
Reading Company
• Formal Woodcock CTOPP
14
Progress monitoringhttp://ies.ed.gov/ncee/wwc/publications/practiceguides/
Is theinterventionhaving a positiveimpact?
15
Bridging the achievement gap
Data Analysis
6
16
Tools we use to analyze data
17
Keys to being efficient with data analysis
• Establish a data analysis protocol
• Implement protocol consistently
• Provide training for new teachers/leaders
• Understand the limitations of each assessmenttool you are using
18
Purpose of Data Analysis Protocol
7
19
Data Analysis Protocol
20
Discussing the Protocol
• What did you notice?
• What questions did the protocol raise foryou?
• What is relevant or meaningful in thistype of protocol?
21
Critical elements of using a data protocol
• Analyze from broad to narrow District-district and school patterns School-school and grade level patterns Grade level-grade level and classroom
patterns Classroom- overall class and student
patterns
• Create an environment of trust and openness
8
22
My Experience ...
23
1003
24
Important Leadership Decisions
• Which portions of the assessment are all teachersexpected to give and how often?
• Who will be the leader in learning the intricacies ofthe CBM data reports/implications of results?
• How will we build consistent collaboration into ourschedules?
• What is expected of teachers regarding bringing andsharing data?
9
25
Important Leadership Behaviors
• Establish expectations for “how we do businesshere” with CBM assessments and analysis
• Analyze data prior to attending meetings ifpossible
• Classroom observation focused on strugglingstudents and instructional success
• Celebrate successes regularly
26
1003
27
CBM reports
10
28
General Questions when using data reports
• Achievement % reportWhat do you notice?What questions does this
data bring up?
29
Achievement % report
• Report shows you: Percent of students Deficient, Emerging, Established
on a given sub-skill Number of students Deficient, Emerging, Established
on a given subskill Reports Fall, Winter, Spring results Shows all subskills All students included (not matched scores)
Limitations: Doesn’t show which students are at risk Doesn’t show individual schools on one report
30
Achievement %
• Use the district data protocol Answer as many questions as possible
with the overall District questions.
• Which questions could you answer?• Which are left unanswered?
11
31
Achievement %
• Use the district data protocol Answer as many questions as possible
with the overall School questions.
• Which questions could you answer?• Which are left unanswered?
32
Percent of Students Above & Below Target
• Report shows you: What percent of students are above and
below target on a given subskill All grades All students (not matched scores) Fall, Winter, Spring
Limitations: Only shows one subskill at a time
33
Percent of Students Above and BelowTarget
• Examine your own data:
• Use the appropriate questions from the DataProtocol What percent of students are performing on target or
“at benchmark”? What percent of students moved out of the “at risk”
categories?
12
34
Percent of Students Above and BelowTarget
• Examine your own data:
• Use the appropriate questions from the DataProtocol Which grade levels are performing exceptionally well
on this subskill? Which grade levels appear to be struggling? Which sub-skill performance is showing success? Which sub-skill performance is concerning?
35
Summary of Impact of InstructionalProgram
• Report shows you: Which students have shown growth on a given subskill Which students hit the target on a given subskill Which students continue to struggle on a given subskill Matched score/only shows those students with two sets of
scores
Limitations- Only shows one subskill at a time
36
Summary of Impact of InstructionalProgram
• Use Data Protocol to analyze your owndata
• Which questions were able to beanswered?
• Which were left unanswered?
13
37
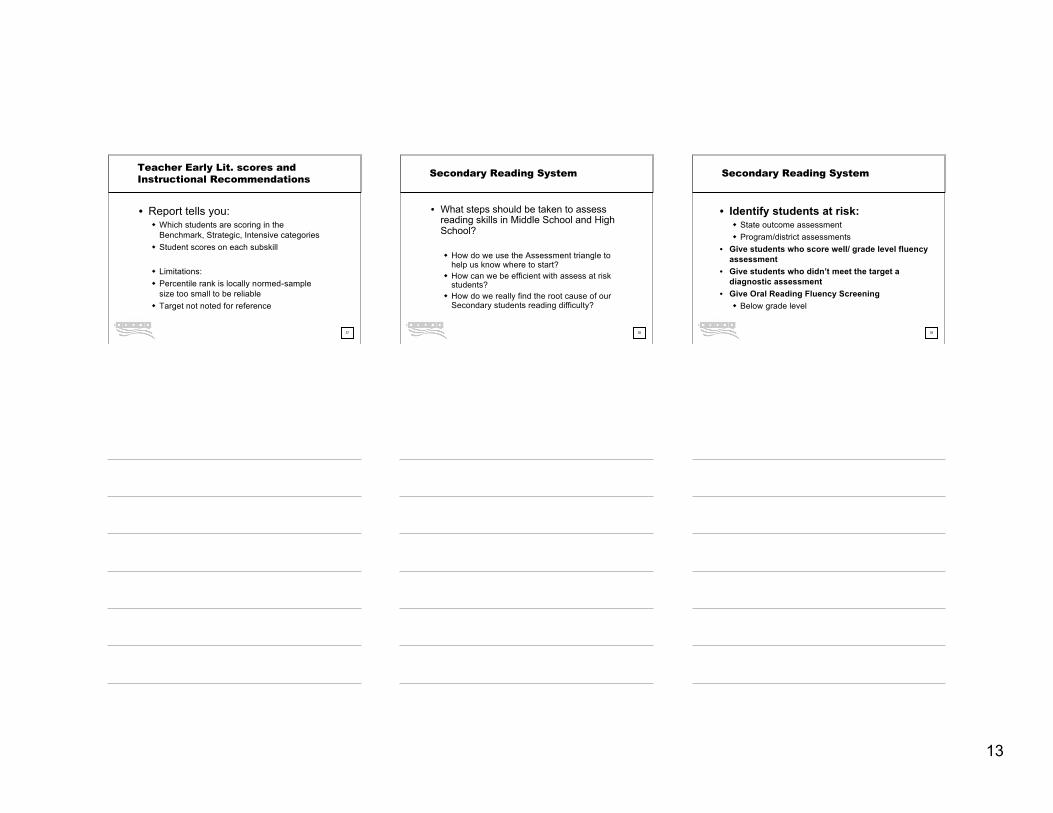
Teacher Early Lit. scores andInstructional Recommendations
• Report tells you: Which students are scoring in the
Benchmark, Strategic, Intensive categories Student scores on each subskill
Limitations: Percentile rank is locally normed-sample
size too small to be reliable Target not noted for reference
38
Secondary Reading System
• What steps should be taken to assessreading skills in Middle School and HighSchool?
How do we use the Assessment triangle tohelp us know where to start?
How can we be efficient with assess at riskstudents?
How do we really find the root cause of ourSecondary students reading difficulty?
39
Secondary Reading System
• Identify students at risk: State outcome assessment Program/district assessments
• Give students who score well/ grade level fluencyassessment
• Give students who didn’t meet the target adiagnostic assessment
• Give Oral Reading Fluency Screening Below grade level
14
40
Tip of the Iceberg ...
41
Our opportunity to help ourstudents soar 42
Quote ...
It takes courage and skillto be unambiguous andclear
Peter Senge
15
43
Thank you ....
Lexie DomaradzkiResearch AssociateRMC Research CorporationPortland Oregon Office


![Bioconjugation Protocols - Strategies and Methods [Methods in Molec Bio 283] - C. Niemeyer (Humana, 2004) WW](https://img.pdfslide.us/doc/110x75/613caba79cc893456e1e9a75/bioconjugation-protocols-strategies-and-methods-methods-in-molec-bio-283-c.jpg)