Embed Size (px)
Citation preview

International Appliance Technical Conference & Exhibition Rosemont, IL USA 2006
Using Sound Quality To Improve Your Product
BY
Jason Kunio INCE Bd. Cert. Application Engineer Marc Marroquin Great Lakes Regional Manager
Brüel & Kjær North America Inc. 2815A Colonnades Ct Norcross, GA 30071
United States of America
Phone Number: 800-332-2040 x7684 Fax: 770-448-3246
[email protected] http://www.bkhome.com/
Jason Kunio Brüel & Kjær North America Inc.
Page 1
International Appliance Technical Conference & Exhibition Rosemont, IL USA 2006
ABSTRACT
Over the last 10 years, the use of Sound Quality (SQ) has become an accepted automotive industry standard. Many other industries, such as appliance manufacturers, lawn/garden equipment, and the office equipment industry, are starting to adopt SQ as a standard way to engineer a product’s sound.
This “newer” field of acoustics has proven to be quite useful in many areas, such as; new product design, quantifying subjective opinions on products with objective metrics, troubleshooting current models, and acoustic modeling of products. This paper will cover the basics in sound quality and apply some of these fundamental concepts in a few examples of the use of sound quality in a practical engineering environment.
INTRODUCTION
The Noise, Vibration and Harshness (NVH) of automobiles over the past 30 years have improved by leaps and bounds. Some of these improvements have uncovered new problems engineers were unaware even existed. As an example, remember back to the 1970s. Cars back then were noisy, and the combinations of exhaust systems and cabin design seemed to amplify noise rather than to attenuate noise. You didn’t know that the seat squeaked when the car was moving at 65 mph or that the fan noise of the vents even existed, because these sounds were masked by other dominant noise sources. Now, cars have become so inherently quiet that at 65 mph, all we really hear are those annoying squeaks, rattles,
and buzzes, that weren’t previously audible. Similarly, industries such as the PC market and appliance markets are realizing the importance of Sound Quality measurements. These markets are similar to the auto market, since they both cater directly to the consumer. Think carefully about your own house. How many appliances do you have in your home? These appliances all produce a wide range of sounds. Do you have a particular appliance that makes a terrible noise when in operation? It may be a very loud vacuum cleaner, a refrigerator with a noisy compressor, or even a garage door opener that sounds like it is really straining to open the door. Based on your experiences with these products’ sounds, you may not want to buy the same brands in the future. In this case, sound quality has influenced your purchasing decisions. Over time products have become more advanced and consumers ever more sophisticated. This has created a need for manufacturers to measure consumer preferences. An example is the famous ‘car door closing’ sound. Everyone has heard the door close on a high end, expensive car like a Mercedes Benz and, conversely, everyone has heard the door close on a less expensive car like a Yugo. There is a clear difference, and consumers know this! They have told us over the years that they want their car, expensive or not, to sound like the Mercedes Benz. Lastly, there comes the matter of the manufacturer’s pride. No manufacturer wants their product to sound “cheaply built” or “not made
Jason Kunio Brüel & Kjær North America Inc.
Page 2
International Appliance Technical Conference & Exhibition Rosemont, IL USA 2006
right.” The manufacturer, of course, wants his product’s sound to enhance the product’s image and make this product stand out above their competition. Another example that demonstrates this feature of sound as a brand image would be Harley Davidson motorcycles. Harley Davidson has spent many years and many millions of dollars to perfect and ensure that each motorcycle has that “signature” sound that immediately identifies a Harley Davidson motorcycle. This type of brand name recognition can make or break a company based on sound quality. All of this leads into the use of Sound Quality. For years, we, as engineers, have used traditional acoustics measurements such as Sound Pressure Levels, Sound Power, and Sound Intensity ways to describe and improve product sound. The most common measurements are a CPB (Constant Percentage Bandwidth, or more commonly referred to as 1/1 or 1/3 octave real-time analysis), an FFT (Fast Fourier Transform, or narrowband analysis), or sometimes in a single number overall Sound Pressure Level (such as the number given to us by a Sound Level Meter). Lastly, we impose a weighting curve to simulate the non-linear response of the human ear, commonly referred to as the A Weighting curve. After all of these measurements, we feel that we have sufficiently characterized the sound that our product produces. For fifty years, this has been the accepted way to measure and refer to sound. Sound Quality introduces a new way of analyzing and characterizing sound that goes one step further to help us understand
how our customers perceive the quality of sound in our products. WHAT IS SOUND QUALITY AND
WHY IMPROVE IT?
Sound Quality is a new concept in how to analyze and characterize sound. First, we need to make sure that we understand the definition of Sound Quality. Second, we must identify what the difference is between ‘noise’ and ‘sound’. Lastly, we then must understand why Sound Quality is an important parameter that really differentiates your product from any other. Sound Quality Defined
What is Sound Quality? Sound Quality can be best described with an example. When you decided to invest in an automobile, think of some of the factors that influenced your decision on which model to purchase. Price, style, and comfort come to mind as influential factors that are important considerations. Sound is another very important consideration that is often over looked in the design of new products. When you test drive the car, you listen for many things: (1) how the engine sounds on acceleration; (2) how the brakes sound when the windows are open; (3) how the exhaust sounds at idle; and (4) those squeaks and rattles that occur when you drive. All of these examples influence your decision on which car to buy. With this example, you can start to get a picture of the importance of Sound Quality. Sound Quality is the
Jason Kunio Brüel & Kjær North America Inc.
Page 3
International Appliance Technical Conference & Exhibition Rosemont, IL USA 2006
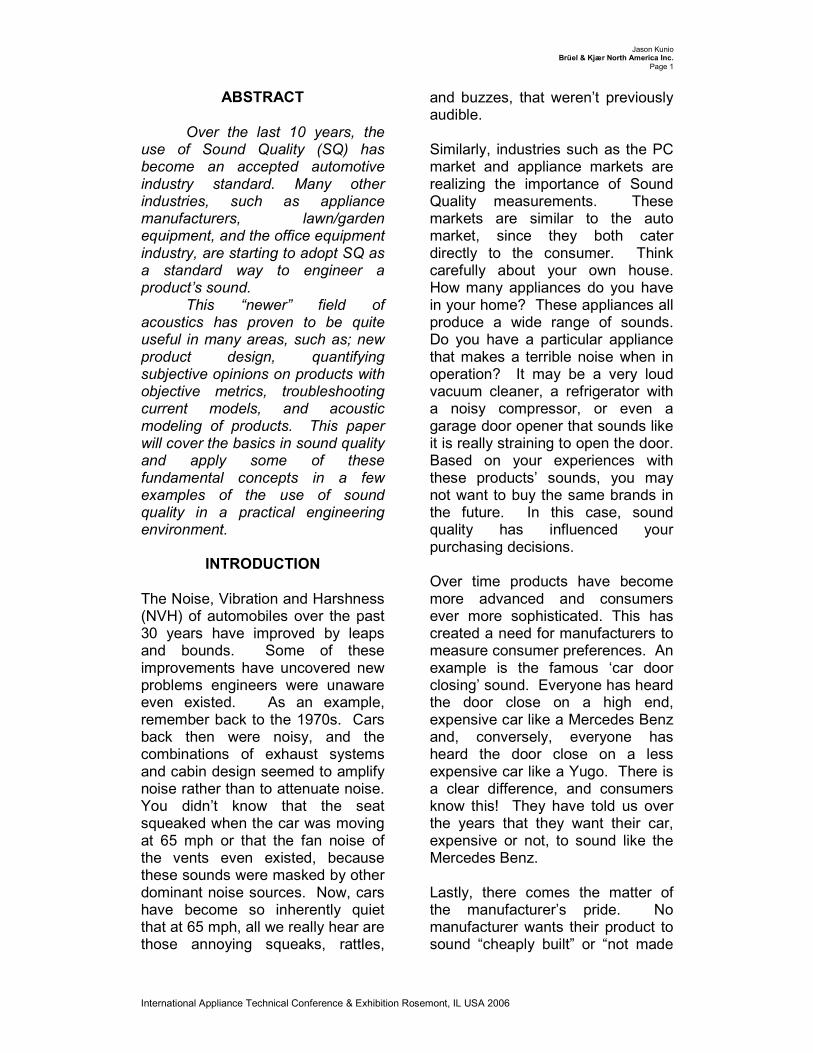
subjective opinion of a human about the sound they hear. Now, ask yourself, when you listen to the engine accelerate, does your mind say, “Oh, this engine has a sound pressure level of 89 dB(A)” Or, does your mind say, “This engine sounds like it has a lot of power?” When you think in terms of a consumer, you can see that noise levels don’t mean anything! Consumers think in terms of feelings and impressions. These feelings and impressions then guide the consumer to purchase the product they ‘like’. This ‘like’ concept is really a complex sum of many different feelings and impressions. This leads into the second part of understanding Sound Quality. Noise vs. Sound What is the difference between ‘noise’ and ‘sound’? Noise is a parameter that we have been measuring for more than fifty years. Noise is characterized by the terms ‘Sound Pressure Levels’ and ‘Sound Power Levels’. These tell us how much noise a product is emitting. Noise is measured for many reasons: (1) to fulfill regulations set forth by a governing body (like ISO or the European Union) (2) to obtain a number that can be compared to a competitive product; (3) to ensure that hearing loss will not occur; (4) to have a number that we can put on a specification sheet of a product. Noise also gives engineers a way to put an objective number on a product that describes its noise emissions.
Figure 1. Example of typical Noise
measurements Sound, on the other hand, has terms that are more subjective, more human. Sound is characterized by terms like ‘loudness’, ‘sharpness’, ‘roughness’, etc. Sound gives the human a mental opinion of whether or not the sound is ‘good’ or ‘bad’, ‘powerful’ or ‘weak’, ‘built solidly’ or ‘built poorly’. Sound is measured to: (1) predict whether or not a consumer will like the product; (2) gives us a quick insight into whether or not the product is working; (3) or understand if this is a good sound or a bad sound. ‘Noise’ and ‘sound’ are two different terms that mean different things. This is an important first step in understanding Sound Quality. Sound Pressure (Lp) and Sound Power (Lw) are great engineering tools for quantifying a product’s noise levels. Sound Quality is another tool that can be utilized to quantify the human perception of your products noise. Importance of Sound Quality Improvement Now that you are thinking like the consumer that will buy your product, you can better understand their purchasing habits. After all, it is their purchase of your product that guarantees our employment. But, how do you quantify what a powerful vacuum cleaner sounds like
Power: 0.01 Watt
Lp = 88.5 dB(A) LW = 100 dB(A)
Jason Kunio Brüel & Kjær North America Inc.
Page 4
International Appliance Technical Conference & Exhibition Rosemont, IL USA 2006
compared to a cheaply built vacuum cleaner? How do you know if this sound is what 80% of your consumers want? How do you know what sound will influence customers to buy your product? How do you know if your competitor’s product sounds better/worse than yours? This is why it is important to be conscious and improve the Sound Quality of your product. As an example, three vacuum cleaners may have identical Sound Pressure Levels of 63 dB(A). At first glance, a typical reaction would be to say that each of the three vacuum cleaners have the same sound, so they must all be ‘quiet’ since they all sound the same. Now, if we take this one step further and actually listen to the three vacuum cleaners in normal operation, chances are you will find one of the vacuum cleaners to sound the best and one to sound the worst. Did the 63 dB(A) give you any insight into which of the three vacuum cleaners had the best sound? By simply looking at the numbers, did we not make an educated assumption that all units ‘sound’ the same? It is possible that even though they all had the same sound pressure level, one sounded louder than the other two. Do you believe that your customer will know that each of these units has a sound pressure level of 63 dB(A) or do you think the customer will say that vacuum number 3 sounded the best? Then, go on to buy number 3 since it sounded better than numbers 1 and 2. This is why it is important to improve the Sound Quality of your product. Just lowering the overall sound pressure level of your product by 3
dB(A) doesn’t necessarily mean that you have made the product sound better. You may have decreased the product’s overall noise level as well as lowering the perceived sound quality of the product. New sounds that were inaudible or ‘masked’ may now be prominent. Sound Quality gives you the tools to actually measure what a person would consider good and bad sounds.
WORKING WITH SOUND QUALITY
Sound Quality can be used as an engineering and marketing tool to help determine the sound that customer’s desire. Sound Quality can be used to solve sound issues in the current product line (reactive engineering), while feeding valuable information back into the design phase of engineering. This ensures the product sounds good from the start (proactive engineering). All of these goals can be accomplished with a properly executed Sound Quality program. Recording The first step in a Sound Quality program is to record the sound of interest. Using the proper transducers to record is critical to ensure that the data analyzed is true and correct. “A chain is only as strong as its weakest link,” holds true in Sound Quality as it does in other types of testing. To properly record the sound, a recording Head and Torso Simulator (HATS) is required, Figure 2. This HATS is designed to acoustically simulate the presence of a human being in a sound field. A human
Jason Kunio Brüel & Kjær North America Inc.
Page 5
International Appliance Technical Conference & Exhibition Rosemont, IL USA 2006
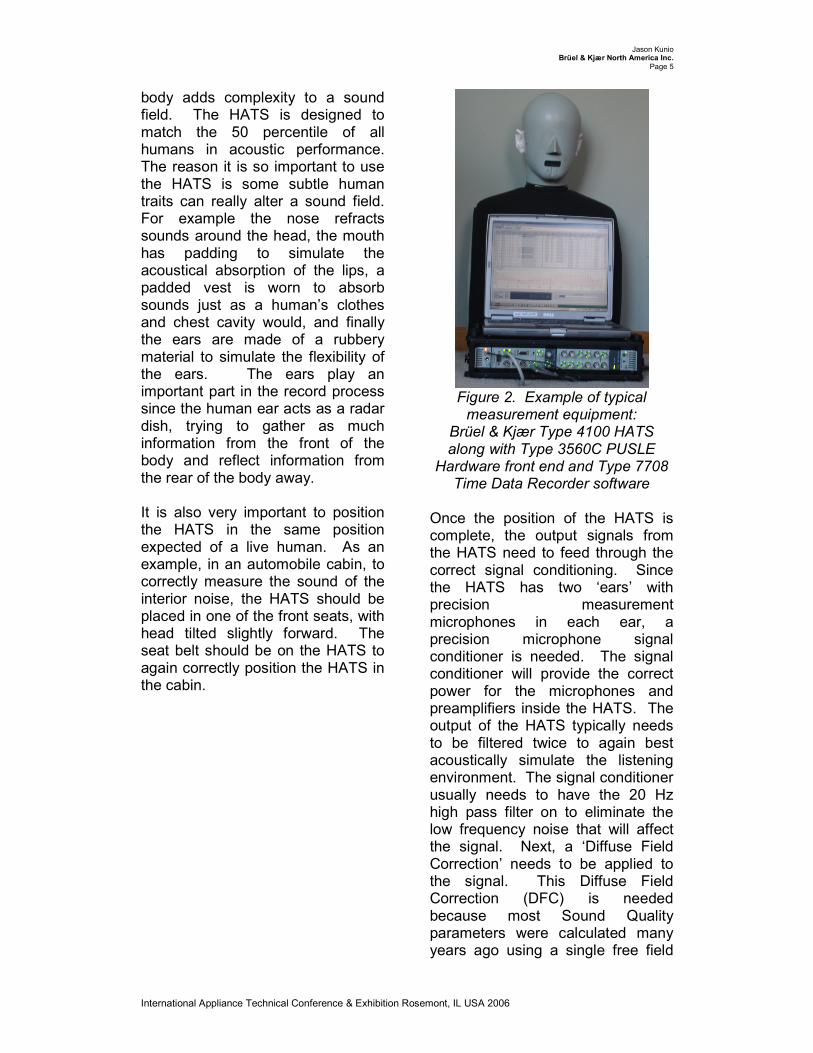
body adds complexity to a sound field. The HATS is designed to match the 50 percentile of all humans in acoustic performance. The reason it is so important to use the HATS is some subtle human traits can really alter a sound field. For example the nose refracts sounds around the head, the mouth has padding to simulate the acoustical absorption of the lips, a padded vest is worn to absorb sounds just as a human’s clothes and chest cavity would, and finally the ears are made of a rubbery material to simulate the flexibility of the ears. The ears play an important part in the record process since the human ear acts as a radar dish, trying to gather as much information from the front of the body and reflect information from the rear of the body away. It is also very important to position the HATS in the same position expected of a live human. As an example, in an automobile cabin, to correctly measure the sound of the interior noise, the HATS should be placed in one of the front seats, with head tilted slightly forward. The seat belt should be on the HATS to again correctly position the HATS in the cabin.
Figure 2. Example of typical
measurement equipment: Brüel & Kjær Type 4100 HATS along with Type 3560C PUSLE
Hardware front end and Type 7708 Time Data Recorder software
Once the position of the HATS is complete, the output signals from the HATS need to feed through the correct signal conditioning. Since the HATS has two ‘ears’ with precision measurement microphones in each ear, a precision microphone signal conditioner is needed. The signal conditioner will provide the correct power for the microphones and preamplifiers inside the HATS. The output of the HATS typically needs to be filtered twice to again best acoustically simulate the listening environment. The signal conditioner usually needs to have the 20 Hz high pass filter on to eliminate the low frequency noise that will affect the signal. Next, a ‘Diffuse Field Correction’ needs to be applied to the signal. This Diffuse Field Correction (DFC) is needed because most Sound Quality parameters were calculated many years ago using a single free field
Jason Kunio Brüel & Kjær North America Inc.
Page 6
International Appliance Technical Conference & Exhibition Rosemont, IL USA 2006
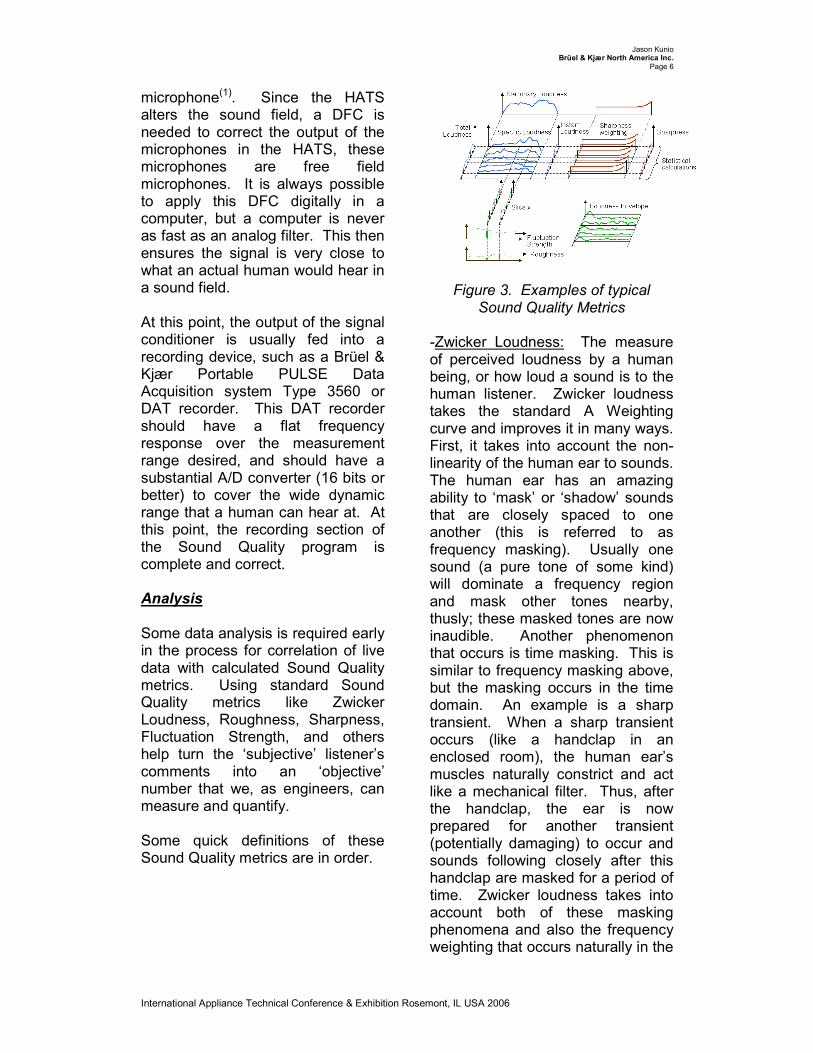
microphone(1). Since the HATS alters the sound field, a DFC is needed to correct the output of the microphones in the HATS, these microphones are free field microphones. It is always possible to apply this DFC digitally in a computer, but a computer is never as fast as an analog filter. This then ensures the signal is very close to what an actual human would hear in a sound field. At this point, the output of the signal conditioner is usually fed into a recording device, such as a Brüel & Kjær Portable PULSE Data Acquisition system Type 3560 or DAT recorder. This DAT recorder should have a flat frequency response over the measurement range desired, and should have a substantial A/D converter (16 bits or better) to cover the wide dynamic range that a human can hear at. At this point, the recording section of the Sound Quality program is complete and correct. Analysis Some data analysis is required early in the process for correlation of live data with calculated Sound Quality metrics. Using standard Sound Quality metrics like Zwicker Loudness, Roughness, Sharpness, Fluctuation Strength, and others help turn the ‘subjective’ listener’s comments into an ‘objective’ number that we, as engineers, can measure and quantify. Some quick definitions of these Sound Quality metrics are in order.
Figure 3. Examples of typical
Sound Quality Metrics -Zwicker Loudness: The measure of perceived loudness by a human being, or how loud a sound is to the human listener. Zwicker loudness takes the standard A Weighting curve and improves it in many ways. First, it takes into account the non-linearity of the human ear to sounds. The human ear has an amazing ability to ‘mask’ or ‘shadow’ sounds that are closely spaced to one another (this is referred to as frequency masking). Usually one sound (a pure tone of some kind) will dominate a frequency region and mask other tones nearby, thusly; these masked tones are now inaudible. Another phenomenon that occurs is time masking. This is similar to frequency masking above, but the masking occurs in the time domain. An example is a sharp transient. When a sharp transient occurs (like a handclap in an enclosed room), the human ear’s muscles naturally constrict and act like a mechanical filter. Thus, after the handclap, the ear is now prepared for another transient (potentially damaging) to occur and sounds following closely after this handclap are masked for a period of time. Zwicker loudness takes into account both of these masking phenomena and also the frequency weighting that occurs naturally in the
Jason Kunio Brüel & Kjær North America Inc.
Page 7
International Appliance Technical Conference & Exhibition Rosemont, IL USA 2006
human ear. Currently, Stationary Zwicker Loudness (loudness calculations performed on a stationary sound) is the only Sound Quality metric standardized, denoted by ISO 532B and DIN 45631. To get a better understanding of how and where Zwicker Loudness came about, see appendix A. -Sharpness: This measures the high frequency annoyance of a sound. High frequency sound is considered sound above about 3000 Hz up to the edge of human hearing. Sounds above 3kHz are summed and weighted according to frequency to give the final sharpness number. Generally, high sharpness values are considered poor Sound Quality. -Fluctuation Strength: This measures the modulation of a sound at low frequencies. Sounds that have a modulation frequency below 20 Hz are measured with this metric. The fluctuation strength weighting is similar to a bell curve, modulations at 4 Hz having the most impact on the metric. Again, generally speaking, high fluctuation strength is considered poor Sound Quality. -Roughness: This measures the modulation of a sound at mid frequencies; sounds modulating between 20 Hz to 300 Hz. Again, a weighting curve is implemented, and sounds modulating at around 70 Hz have the most impact on the roughness number. A high roughness rating is also not desirable in most applications. These SQ metrics, used in conjunction with normal acoustic
parameters such as CPB (1/1 or 1/3rd octave), overall sound pressure levels, etc. are used to analyze the data taken. Sometimes, an edit of the sound is desired to see if a sound can be ‘improved’ at this stage. Using a good Sound Quality software package, these edits are easily and quickly done to see if the edits ‘improve’ the sound or make it worse. Subjective Testing A subjective test is needed at this point to actually determine what the consumer’s expectations are for a product’s sound. This jury test is important and should be done on a statistically valid cross section of the consumer base. These consumers should reflect the type of market the product addresses. This jury test should also be done with a great deal of secrecy and impartiality. The secrecy is to ensure that none of the jury participants know which product is which, and impartiality is to ensure that an honest reaction is gathered from the jury test. So, it is bad judgment to use a jury of fellow colleagues or managers since they don’t represent an impartial test group. Sounds should be played back through a calibrated headphone system, never a speaker system. Since so much effort has gone into gathering the data in the most acoustically correct manner using the HATS, the recordings should be played back at their correct sound pressure levels to best simulate how the sound was recorded. A closed loop calibration is necessary to ensure that the levels played out of the headphones are correct. Speakers allow too much error to be introduced into the play list.
Jason Kunio Brüel & Kjær North America Inc.
Page 8
International Appliance Technical Conference & Exhibition Rosemont, IL USA 2006
Speakers can be adjusted, so the sound can be played back at incorrect levels, and also speakers need to fill a room that can alter the original sound with incorrect reflections and directionality. A benefit of using the HATS to record the sounds is that the HATS will preserve the stereo condition of sound that humans possess. That means that the left and right ears hear sounds slightly differently due to their relative position compared to the product. An excellent experiment to demonstrate stereo recordings vs. single microphone recording is: -Connect the output of the HATS directly into headphones. Sit down and close your eyes. Have a colleague take their car keys and jingle the keys in front of the HATS. Then, have the colleague slowly move around the HATS, still jingling the car keys, and listen. As the listener, you will be able to hear the car keys in front of you, then slowly moving around your head from one side to behind you, on to the other side, and finally in front again. -Now, perform the same test, but using a single microphone. Since the single microphone is connected to both ears, you cannot tell where the sound of the keys even is, let alone if it is on your left side or right side! This is a very simple test to demonstrate how important the use of a HATS is, especially when playing sounds back to a jury. Once tested, the jury participants should answer a test using the ‘Semantic Differential’ testing method or the ‘Paired Comparison’ method. The Semantic Differential test asks a consumer to listen to the
sound and give honest feedback about the sound. A Paired Comparison test asks the customer simple, direct questions in a multiple-choice format. An advantage of the ‘Semantic Differential’ test allows your jury to give their own opinion of your product in their own words. This can be a great way to try and understand the likes and dislikes of different customer groups. The disadvantage is that there is much more subjective information to try and understand and interpret. On the other hand, the ‘Paired Comparison’ test allows you, the engineer, to really define the test and force a customer to answer specific questions. The disadvantage of this testing is that you can inadvertently guide your jury to answers that may not be their true reaction to the sound. Neither test technique is better than the other but rather an engineer’s choice about which technique to utilize. Correlation of Subjective Test to the Objective Test Now is the time to sit down and do the number crunching. Correlation between the subjective jury test results and the objective SQ test metrics should be performed to determine which metrics best suit the consumer. As an example, a fan manufacturer would probably find their customer base prefers low sharpness, fluctuation strength, and roughness levels. Since a fan produces a broadband sound, sharpness can be a factor. Also, depending on the fan blades, a modulation can occur that can be highly annoying to a customer.
Jason Kunio Brüel & Kjær North America Inc.
Page 9
International Appliance Technical Conference & Exhibition Rosemont, IL USA 2006
Once objective metrics are correlated to consumers’ preferences, an Improved Objective Test (IOT) is produced. Y =m2*x2 + m1*x1 + c
where x2 is the metric: Statistical Loudness Min [sones]where m2 is the weight: -0.03where x1 is the metric: Tone-To-Noise Ratio [dB]where m1 is the weight: -0.02where c is the constant value of: 1.58
Figure 4. Example of IOT (preference equation)
This IOT can be used in future tests to produce reliable results that predict which sounds customers find objectionable and which sounds are desirable. This testing can be done without the expense and time of gathering a jury test or the correlation number crunching needed to make the ‘subjective results objective’. This is one of the major goals of any Sound Quality program. The ability to run computer simulations on a jury test with an IOT is an incredibly powerful tool that has wide usage; in a QC test, in the development stage of a new product, in the troubleshooting stage of a current product, etc. Another important benefit of the IOT is that now you can perform acoustic simulations on your product’s sound. You can simply reduce a dominant tone by 5 dB and then listen to the sound to see if it sounds better. Also, you can use the IOT to test the proposed 5 dB reduction of sound to see if your consumer’s would like the new sound. Other, more sophisticated edits can be done as well, allowing a myriad of edit combinations.
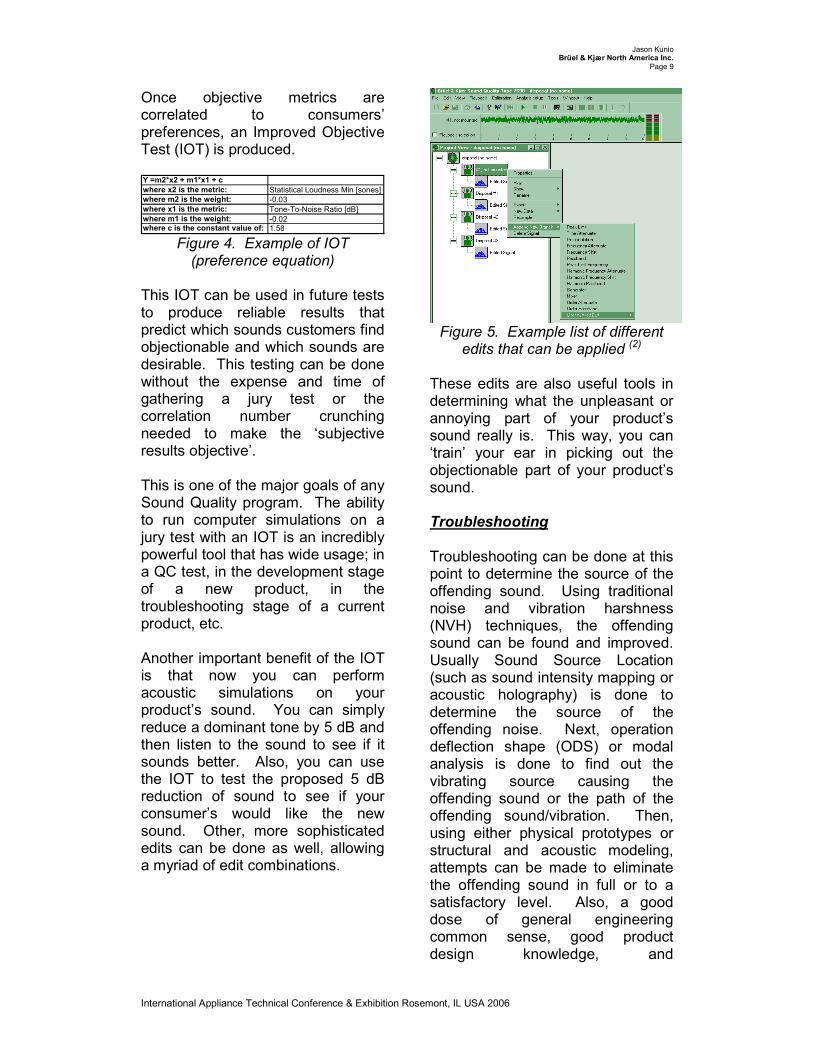
Figure 5. Example list of different edits that can be applied (2)
These edits are also useful tools in determining what the unpleasant or annoying part of your product’s sound really is. This way, you can ‘train’ your ear in picking out the objectionable part of your product’s sound. Troubleshooting Troubleshooting can be done at this point to determine the source of the offending sound. Using traditional noise and vibration harshness (NVH) techniques, the offending sound can be found and improved. Usually Sound Source Location (such as sound intensity mapping or acoustic holography) is done to determine the source of the offending noise. Next, operation deflection shape (ODS) or modal analysis is done to find out the vibrating source causing the offending sound or the path of the offending sound/vibration. Then, using either physical prototypes or structural and acoustic modeling, attempts can be made to eliminate the offending sound in full or to a satisfactory level. Also, a good dose of general engineering common sense, good product design knowledge, and
Jason Kunio Brüel & Kjær North America Inc.
Page 10
International Appliance Technical Conference & Exhibition Rosemont, IL USA 2006
troubleshooting skill help expedite this process tremendously. Product Engineering
Lastly, feeding this information back to the development process can eliminate offending noises in the first part of product development, the design stage. This can cut costs in the future troubleshooting stage, as well as ensure that the product goes to market meeting the customer’s expectations. Acoustic modeling can be done in the development stage using the editing functionality to ‘simulate’ a product improvement’s sound. Also, using editing, a target sound can be artificially made that can be the ultimate goal of the development team. Unfortunately, troubleshooting and development tasks do not have any easy solutions. Since only the manufacturer of the product knows the product and costs of production and modifications, only the manufacturer can determine what remedies are economically feasible or possible. Lowering the overall sound pressure level by 20 dB(A) may solve all of the acoustic problems that a product may encounter, but it also may make a part that costs $1.24 to produce cost $1,240 to produce. In that example, this is clearly not a good solution. Review of Sound Quality Program The following diagram outlines what a common Sound Quality program looks like in practice.
ObjectiveTest,
Metrics
SoundRecording
SubjectiveTest
ProductEngineering
Trouble-shooting
SoundQualityProgram
ObjectiveTest,
Metrics
SoundRecording
SubjectiveTest
ProductEngineering
Trouble-shooting
SoundQualityProgram
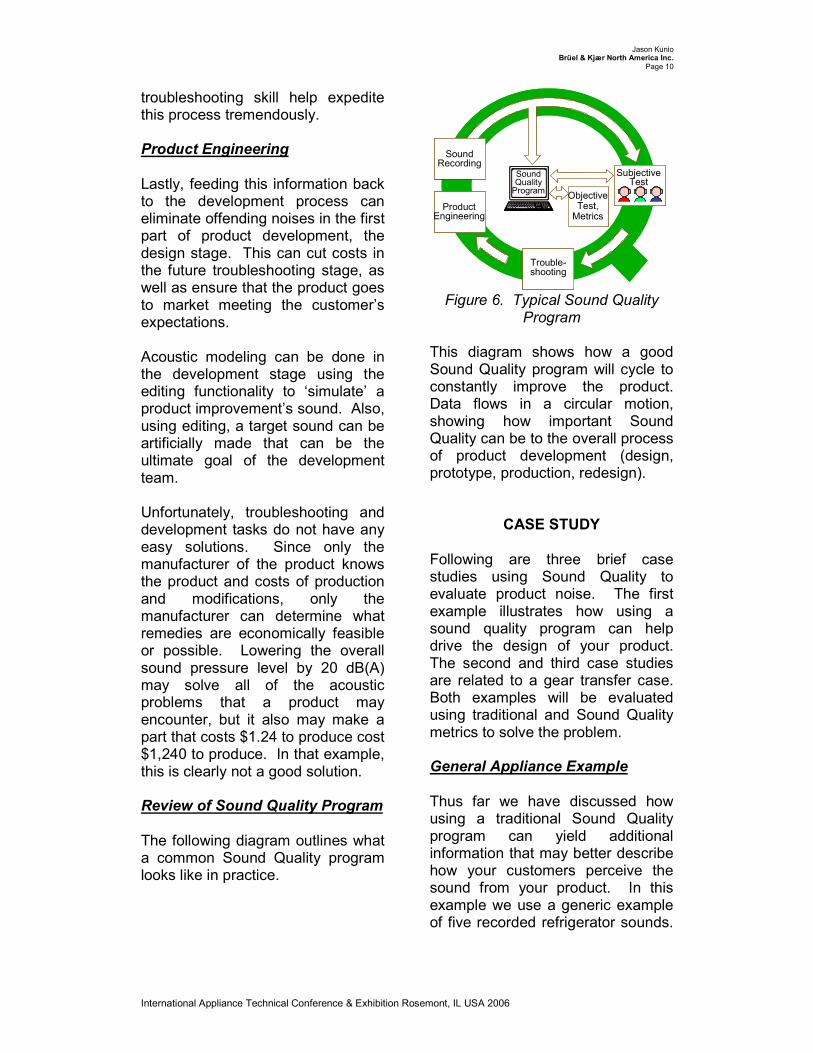
Figure 6. Typical Sound Quality
Program This diagram shows how a good Sound Quality program will cycle to constantly improve the product. Data flows in a circular motion, showing how important Sound Quality can be to the overall process of product development (design, prototype, production, redesign).
CASE STUDY
Following are three brief case studies using Sound Quality to evaluate product noise. The first example illustrates how using a sound quality program can help drive the design of your product. The second and third case studies are related to a gear transfer case. Both examples will be evaluated using traditional and Sound Quality metrics to solve the problem. General Appliance Example
Thus far we have discussed how using a traditional Sound Quality program can yield additional information that may better describe how your customers perceive the sound from your product. In this example we use a generic example of five recorded refrigerator sounds.
Jason Kunio Brüel & Kjær North America Inc.
Page 11
International Appliance Technical Conference & Exhibition Rosemont, IL USA 2006
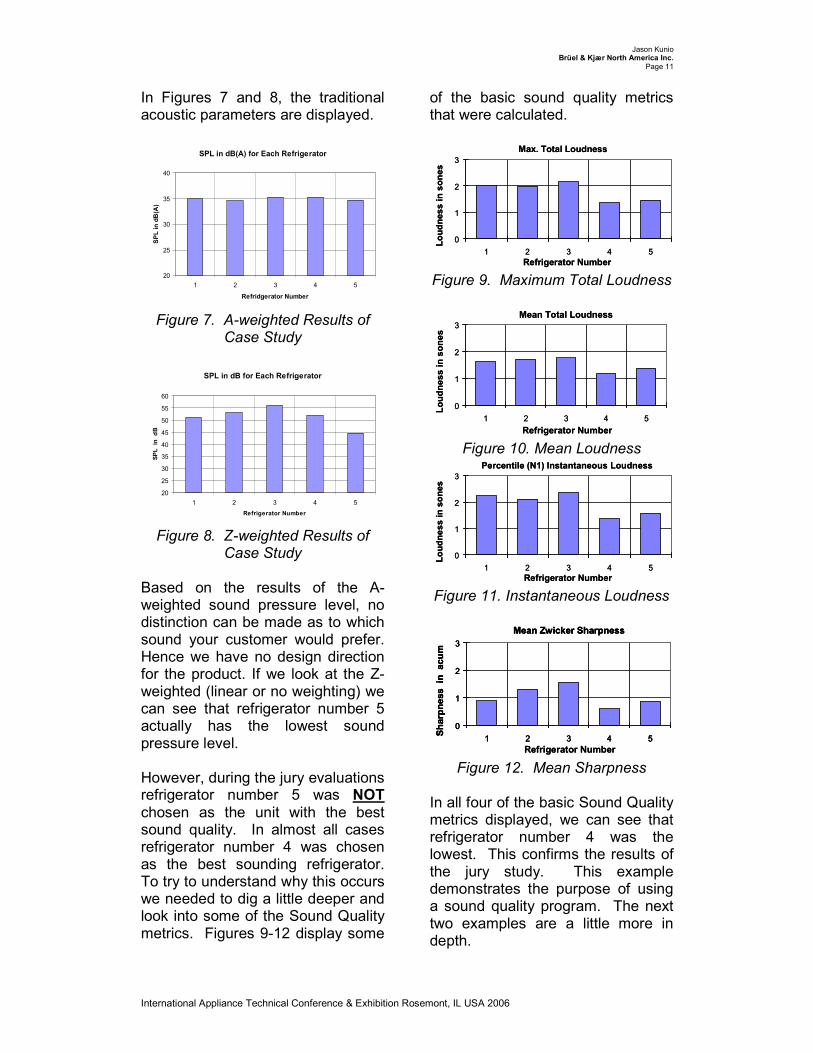
In Figures 7 and 8, the traditional acoustic parameters are displayed.
SPL in dB(A) for Each Refrigerator
20
25
30
35
40
1 2 3 4 5
Refridgerator Number
SP
L in
dB
(A)
Figure 7. A-weighted Results of Case Study
SPL in dB for Each Refrigerator
20
25
30
35
40
45
50
55
60
1 2 3 4 5
Refrigerator Number
SP
L
in
dB
Figure 8. Z-weighted Results of Case Study
Based on the results of the A-weighted sound pressure level, no distinction can be made as to which sound your customer would prefer. Hence we have no design direction for the product. If we look at the Z-weighted (linear or no weighting) we can see that refrigerator number 5 actually has the lowest sound pressure level. However, during the jury evaluations refrigerator number 5 was NOT chosen as the unit with the best sound quality. In almost all cases refrigerator number 4 was chosen as the best sounding refrigerator. To try to understand why this occurs we needed to dig a little deeper and look into some of the Sound Quality metrics. Figures 9-12 display some
of the basic sound quality metrics that were calculated.
Max. Total Loudness
0
1
2
3
1 2 3 4 5
Refrigerator Number
Lo
ud
nes
s i
n s
on
es
Max. Total Loudness
0
1
2
3
1 2 3 4 5
Refrigerator Number
Lo
ud
nes
s i
n s
on
es
Figure 9. Maximum Total Loudness
Mean Total Loudness
0
1
2
3
1 2 3 4 5
Refrigerator NumberL
ou
dn
es
s i
n s
on
es
Mean Total Loudness
0
1
2
3
1 2 3 4 5
Refrigerator NumberL
ou
dn
es
s i
n s
on
es
Figure 10. Mean Loudness Percentile (N1) Instantaneous Loudness
0
1
2
3
1 2 3 4 5
Refrigerator Number
Lo
ud
ne
ss i
n s
on
es
Percentile (N1) Instantaneous Loudness
0
1
2
3
1 2 3 4 5
Refrigerator Number
Lo
ud
ne
ss i
n s
on
es
Figure 11. Instantaneous Loudness
Refrigerator Number
Mean Zwicker Sharpness
0
1
2
3
1 2 3 4 5
Sh
arp
ne
ss
in
ac
um
Refrigerator Number
Mean Zwicker Sharpness
0
1
2
3
1 2 3 4 5
Sh
arp
ne
ss
in
ac
um
Mean Zwicker Sharpness
0
1
2
3
1 2 3 4 5
Sh
arp
ne
ss
in
ac
um
Figure 12. Mean Sharpness
In all four of the basic Sound Quality metrics displayed, we can see that refrigerator number 4 was the lowest. This confirms the results of the jury study. This example demonstrates the purpose of using a sound quality program. The next two examples are a little more in depth.
Jason Kunio Brüel & Kjær North America Inc.
Page 12
International Appliance Technical Conference & Exhibition Rosemont, IL USA 2006
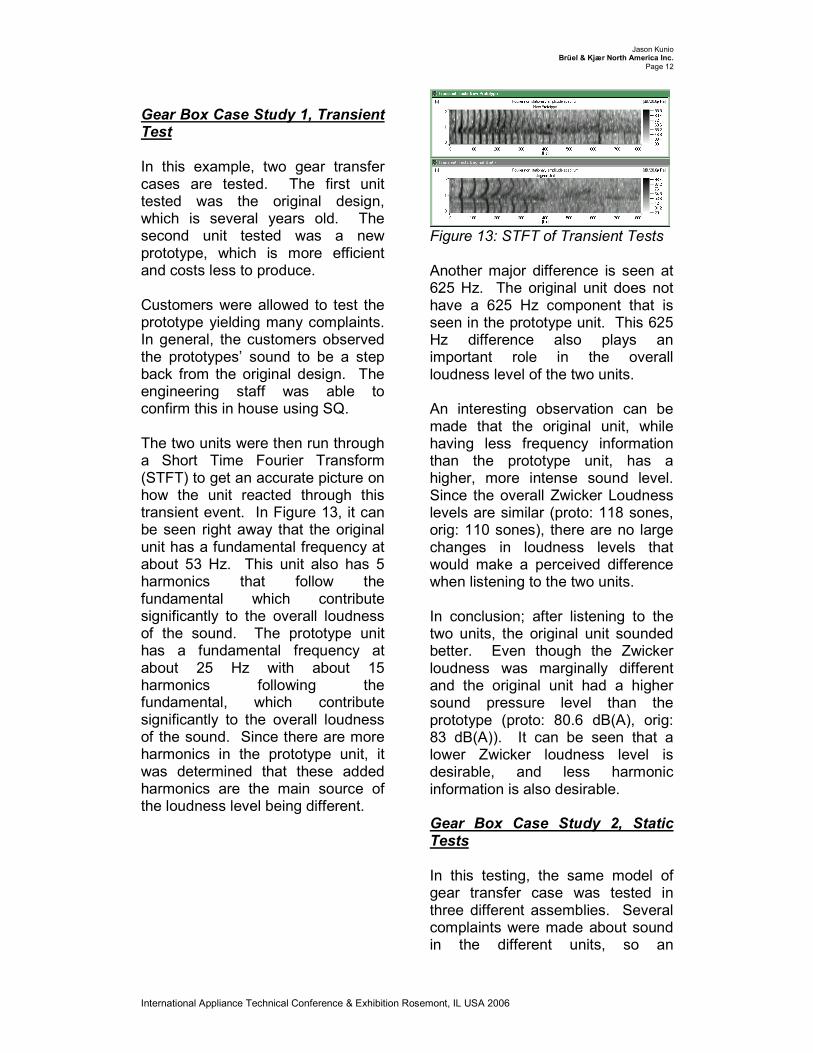
Gear Box Case Study 1, Transient Test In this example, two gear transfer cases are tested. The first unit tested was the original design, which is several years old. The second unit tested was a new prototype, which is more efficient and costs less to produce. Customers were allowed to test the prototype yielding many complaints. In general, the customers observed the prototypes’ sound to be a step back from the original design. The engineering staff was able to confirm this in house using SQ. The two units were then run through a Short Time Fourier Transform (STFT) to get an accurate picture on how the unit reacted through this transient event. In Figure 13, it can be seen right away that the original unit has a fundamental frequency at about 53 Hz. This unit also has 5 harmonics that follow the fundamental which contribute significantly to the overall loudness of the sound. The prototype unit has a fundamental frequency at about 25 Hz with about 15 harmonics following the fundamental, which contribute significantly to the overall loudness of the sound. Since there are more harmonics in the prototype unit, it was determined that these added harmonics are the main source of the loudness level being different.
Figure 13: STFT of Transient Tests Another major difference is seen at 625 Hz. The original unit does not have a 625 Hz component that is seen in the prototype unit. This 625 Hz difference also plays an important role in the overall loudness level of the two units. An interesting observation can be made that the original unit, while having less frequency information than the prototype unit, has a higher, more intense sound level. Since the overall Zwicker Loudness levels are similar (proto: 118 sones, orig: 110 sones), there are no large changes in loudness levels that would make a perceived difference when listening to the two units. In conclusion; after listening to the two units, the original unit sounded better. Even though the Zwicker loudness was marginally different and the original unit had a higher sound pressure level than the prototype (proto: 80.6 dB(A), orig: 83 dB(A)). It can be seen that a lower Zwicker loudness level is desirable, and less harmonic information is also desirable. Gear Box Case Study 2, Static Tests In this testing, the same model of gear transfer case was tested in three different assemblies. Several complaints were made about sound in the different units, so an
Jason Kunio Brüel & Kjær North America Inc.
Page 13
International Appliance Technical Conference & Exhibition Rosemont, IL USA 2006
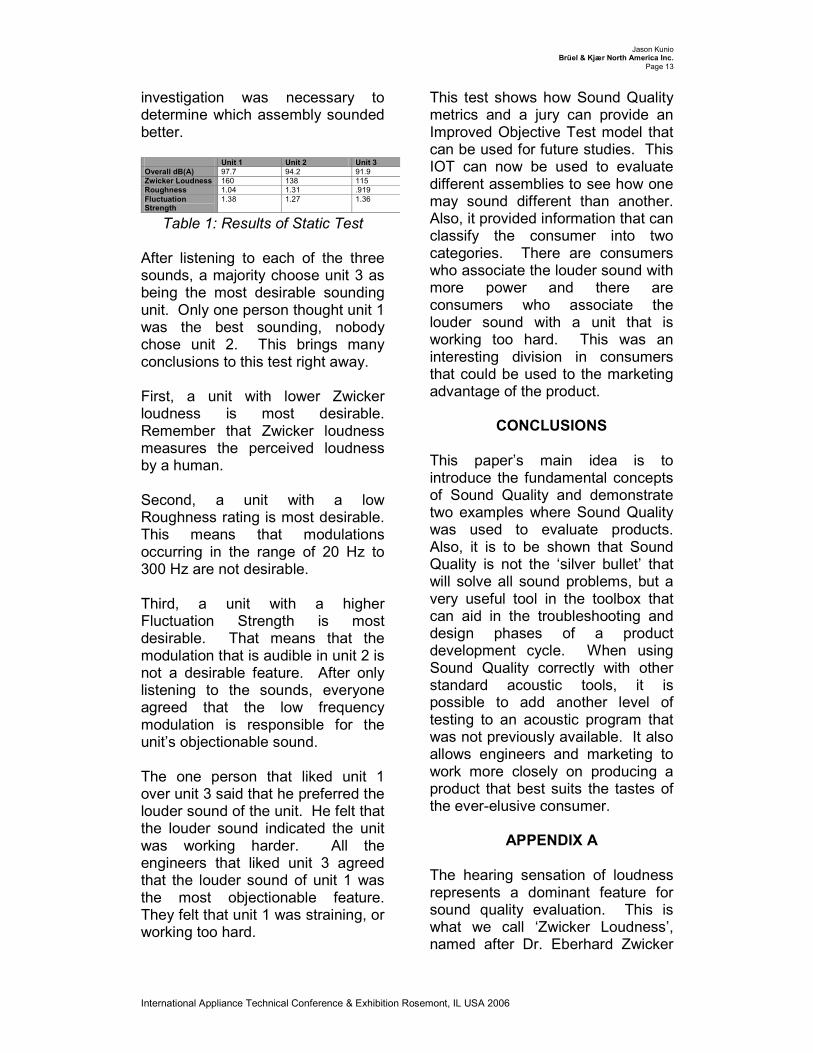
investigation was necessary to determine which assembly sounded better. Unit 1 Unit 2 Unit 3
Overall dB(A) 97.7 94.2 91.9 Zwicker Loudness 160 138 115 Roughness 1.04 1.31 .919 Fluctuation Strength
1.38 1.27 1.36
Table 1: Results of Static Test After listening to each of the three sounds, a majority choose unit 3 as being the most desirable sounding unit. Only one person thought unit 1 was the best sounding, nobody chose unit 2. This brings many conclusions to this test right away. First, a unit with lower Zwicker loudness is most desirable. Remember that Zwicker loudness measures the perceived loudness by a human. Second, a unit with a low Roughness rating is most desirable. This means that modulations occurring in the range of 20 Hz to 300 Hz are not desirable. Third, a unit with a higher Fluctuation Strength is most desirable. That means that the modulation that is audible in unit 2 is not a desirable feature. After only listening to the sounds, everyone agreed that the low frequency modulation is responsible for the unit’s objectionable sound. The one person that liked unit 1 over unit 3 said that he preferred the louder sound of the unit. He felt that the louder sound indicated the unit was working harder. All the engineers that liked unit 3 agreed that the louder sound of unit 1 was the most objectionable feature. They felt that unit 1 was straining, or working too hard.
This test shows how Sound Quality metrics and a jury can provide an Improved Objective Test model that can be used for future studies. This IOT can now be used to evaluate different assemblies to see how one may sound different than another. Also, it provided information that can classify the consumer into two categories. There are consumers who associate the louder sound with more power and there are consumers who associate the louder sound with a unit that is working too hard. This was an interesting division in consumers that could be used to the marketing advantage of the product.
CONCLUSIONS
This paper’s main idea is to introduce the fundamental concepts of Sound Quality and demonstrate two examples where Sound Quality was used to evaluate products. Also, it is to be shown that Sound Quality is not the ‘silver bullet’ that will solve all sound problems, but a very useful tool in the toolbox that can aid in the troubleshooting and design phases of a product development cycle. When using Sound Quality correctly with other standard acoustic tools, it is possible to add another level of testing to an acoustic program that was not previously available. It also allows engineers and marketing to work more closely on producing a product that best suits the tastes of the ever-elusive consumer.
APPENDIX A
The hearing sensation of loudness represents a dominant feature for sound quality evaluation. This is what we call ‘Zwicker Loudness’, named after Dr. Eberhard Zwicker
Jason Kunio Brüel & Kjær North America Inc.
Page 14
International Appliance Technical Conference & Exhibition Rosemont, IL USA 2006
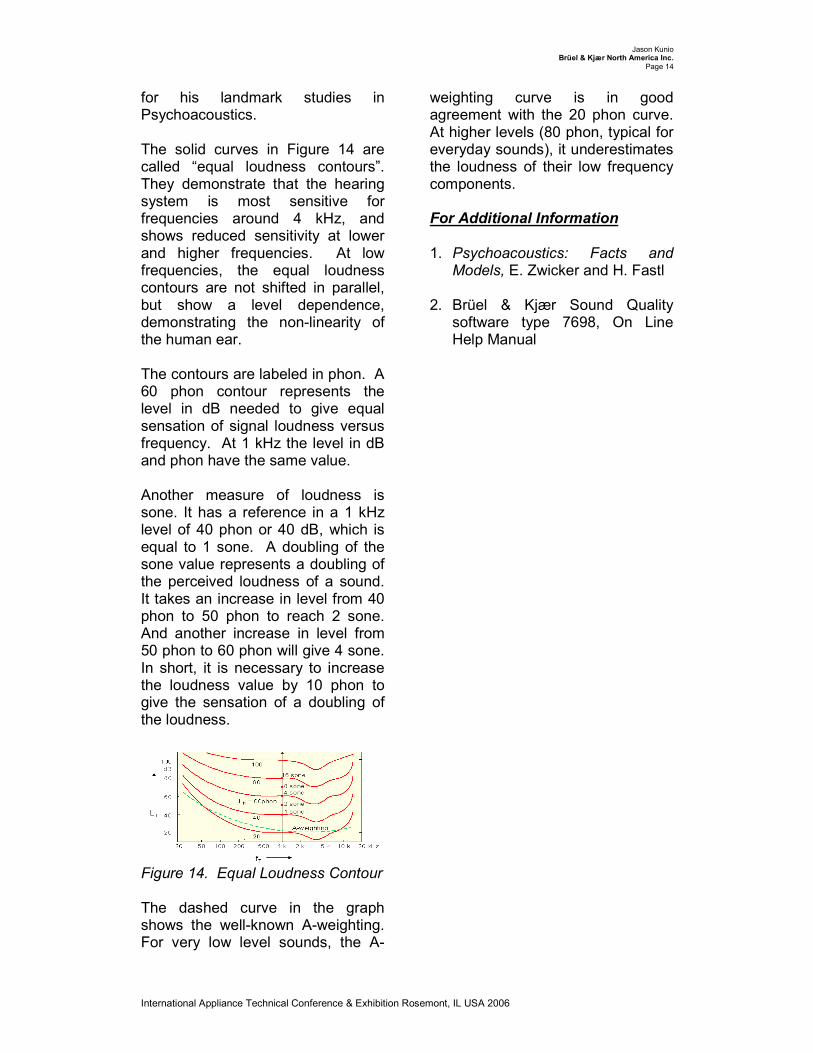
for his landmark studies in Psychoacoustics. The solid curves in Figure 14 are called “equal loudness contours”. They demonstrate that the hearing system is most sensitive for frequencies around 4 kHz, and shows reduced sensitivity at lower and higher frequencies. At low frequencies, the equal loudness contours are not shifted in parallel, but show a level dependence, demonstrating the non-linearity of the human ear. The contours are labeled in phon. A 60 phon contour represents the level in dB needed to give equal sensation of signal loudness versus frequency. At 1 kHz the level in dB and phon have the same value. Another measure of loudness is sone. It has a reference in a 1 kHz level of 40 phon or 40 dB, which is equal to 1 sone. A doubling of the sone value represents a doubling of the perceived loudness of a sound. It takes an increase in level from 40 phon to 50 phon to reach 2 sone. And another increase in level from 50 phon to 60 phon will give 4 sone. In short, it is necessary to increase the loudness value by 10 phon to give the sensation of a doubling of the loudness.
Figure 14. Equal Loudness Contour The dashed curve in the graph shows the well-known A-weighting. For very low level sounds, the A-
weighting curve is in good agreement with the 20 phon curve. At higher levels (80 phon, typical for everyday sounds), it underestimates the loudness of their low frequency components. For Additional Information 1. Psychoacoustics: Facts and
Models, E. Zwicker and H. Fastl 2. Brüel & Kjær Sound Quality
software type 7698, On Line Help Manual