Embed Size (px)
Citation preview

Mental Health Care ServicesData analysis
using
SOMNet
Youn Jin (Jina) ChungJose Alberto Salinas Perez

Mapping the structural relations of the Mental Health Care Services is essential for - Understanding the mental health database.- Discovering knowledge for planning mental health resources.
To do so, it is important to implement a well-tested operation and visualization tools.
SOMNet is developed as an interactive visual data mining model to support - Understanding data patterns and behaviours.- Knowledge discovery and Decision making.
The SOMNet encompasses a number of analytical processes in the visual fashion.
The study aimed to - Analyse the mental health care services in various mental health systems using the SOMNet- Evaluate the model usability and feasibility for improving evidence-informed decision making.
The study is carried out by a core team including the SOMNet developer, the knowledge engineer, the health geographer and the experts and researchers in the mental health research.
Case Study
Page 2 of 65
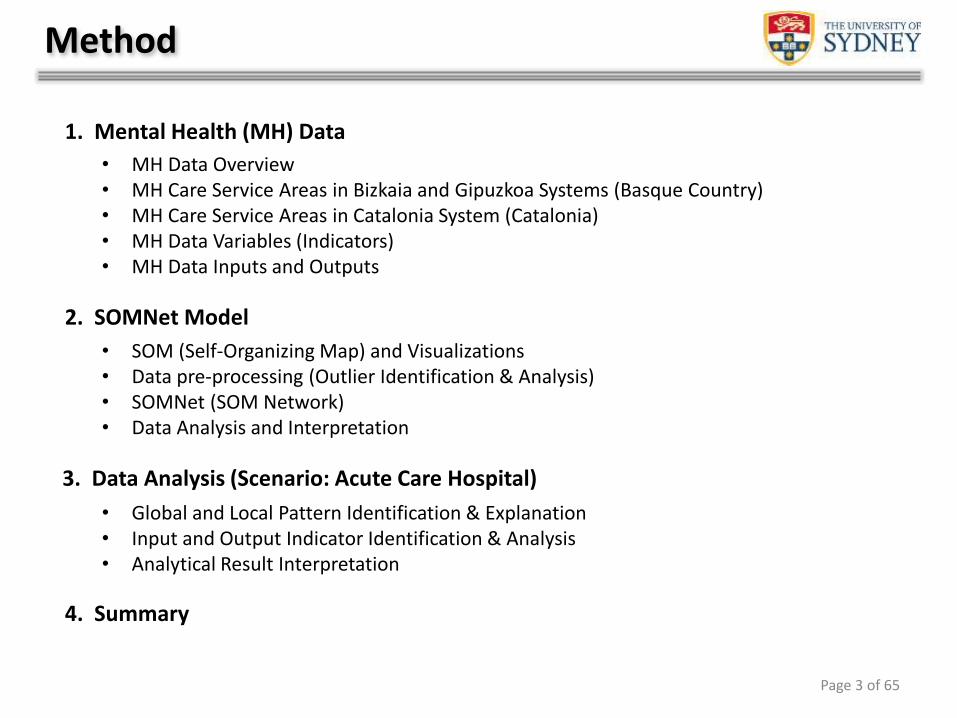
Method
1. Mental Health (MH) Data
• MH Data Overview• MH Care Service Areas in Bizkaia and Gipuzkoa Systems (Basque Country)• MH Care Service Areas in Catalonia System (Catalonia)• MH Data Variables (Indicators)• MH Data Inputs and Outputs
2. SOMNet Model
• SOM (Self-Organizing Map) and Visualizations• Data pre-processing (Outlier Identification & Analysis)• SOMNet (SOM Network)• Data Analysis and Interpretation
3. Data Analysis (Scenario: Acute Care Hospital)
• Global and Local Pattern Identification & Explanation• Input and Output Indicator Identification & Analysis• Analytical Result Interpretation
4. Summary
Page 3 of 65
1. Mental Health (MH) Data
The following slides will describe Mental Health Data (Spain).
1.1. Initial MH Data Overview
1.2. MH Service Areas & Labelling in Bizkaia and Gipuzkoa Systems (Basque Country)MH Service Areas & Labelling in Catalonia System (Catalonia)
1.3. MH Data Variables & Labelling
1.4. MH Data Inputs and Outputs
Page 4 of 65
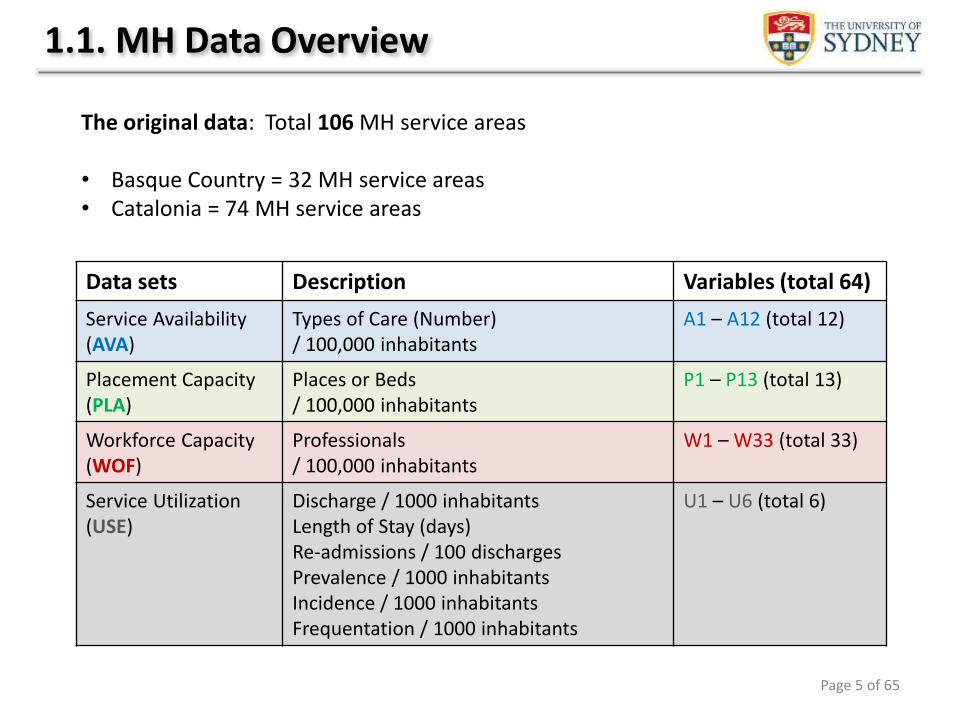
1.1. MH Data Overview
The original data: Total 106 MH service areas
• Basque Country = 32 MH service areas• Catalonia = 74 MH service areas
Data sets Description Variables (total 64)
Service Availability (AVA)
Types of Care (Number) / 100,000 inhabitants
A1 – A12 (total 12)
Placement Capacity (PLA)
Places or Beds / 100,000 inhabitants
P1 – P13 (total 13)
Workforce Capacity (WOF)
Professionals / 100,000 inhabitants
W1 – W33 (total 33)
Service Utilization (USE)
Discharge / 1000 inhabitantsLength of Stay (days)Re-admissions / 100 dischargesPrevalence / 1000 inhabitantsIncidence / 1000 inhabitantsFrequentation / 1000 inhabitants
U1 – U6 (total 6)
Page 5 of 65
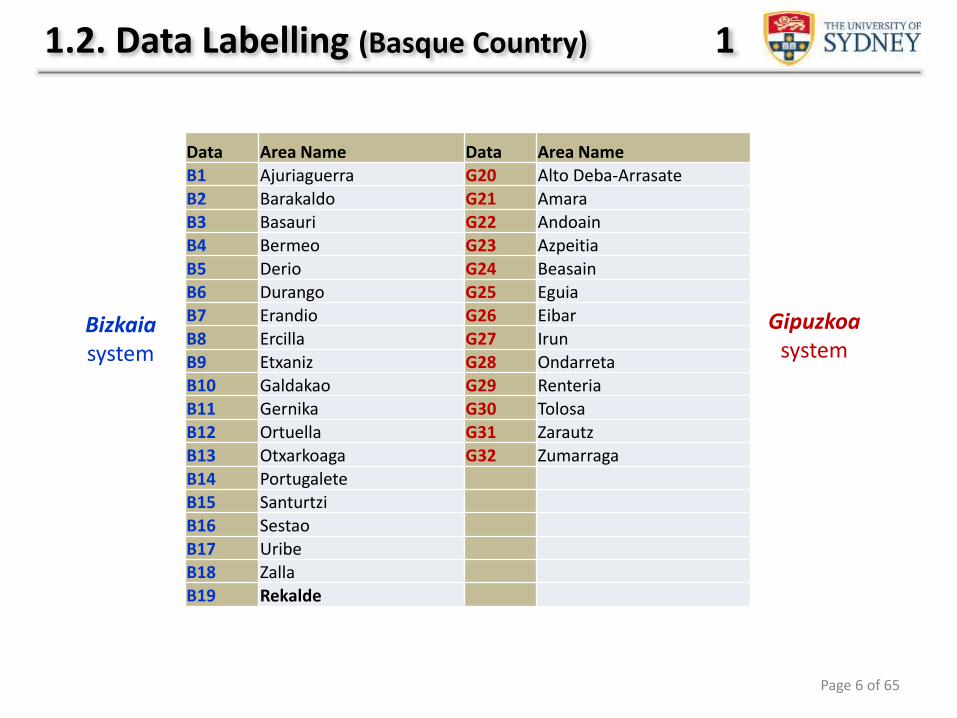
Data Area Name Data Area NameB1 Ajuriaguerra G20 Alto Deba-Arrasate
B2 Barakaldo G21 AmaraB3 Basauri G22 AndoainB4 Bermeo G23 AzpeitiaB5 Derio G24 Beasain
B6 Durango G25 Eguia
B7 Erandio G26 EibarB8 Ercilla G27 Irun
B9 Etxaniz G28 OndarretaB10 Galdakao G29 RenteriaB11 Gernika G30 TolosaB12 Ortuella G31 Zarautz
B13 Otxarkoaga G32 Zumarraga
B14 PortugaleteB15 Santurtzi
B16 SestaoB17 UribeB18 ZallaB19 Rekalde
Bizkaiasystem
Gipuzkoasystem
1.2. Data Labelling (Basque Country) 1
Page 6 of 65
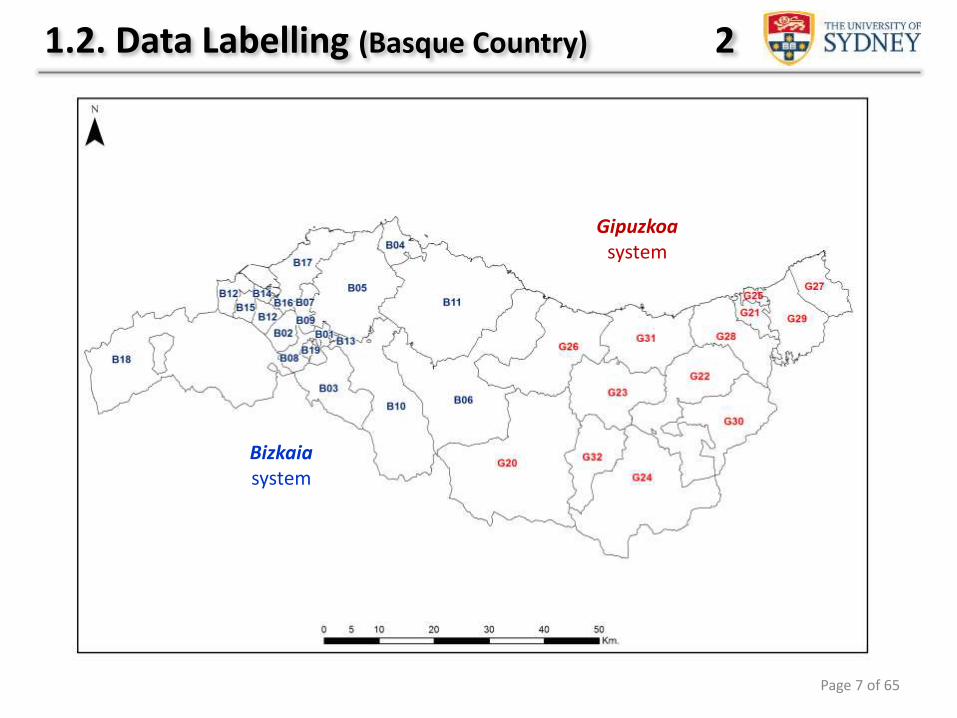
Bizkaiasystem
Gipuzkoasystem
Page 7 of 65
1.2. Data Labelling (Basque Country) 2
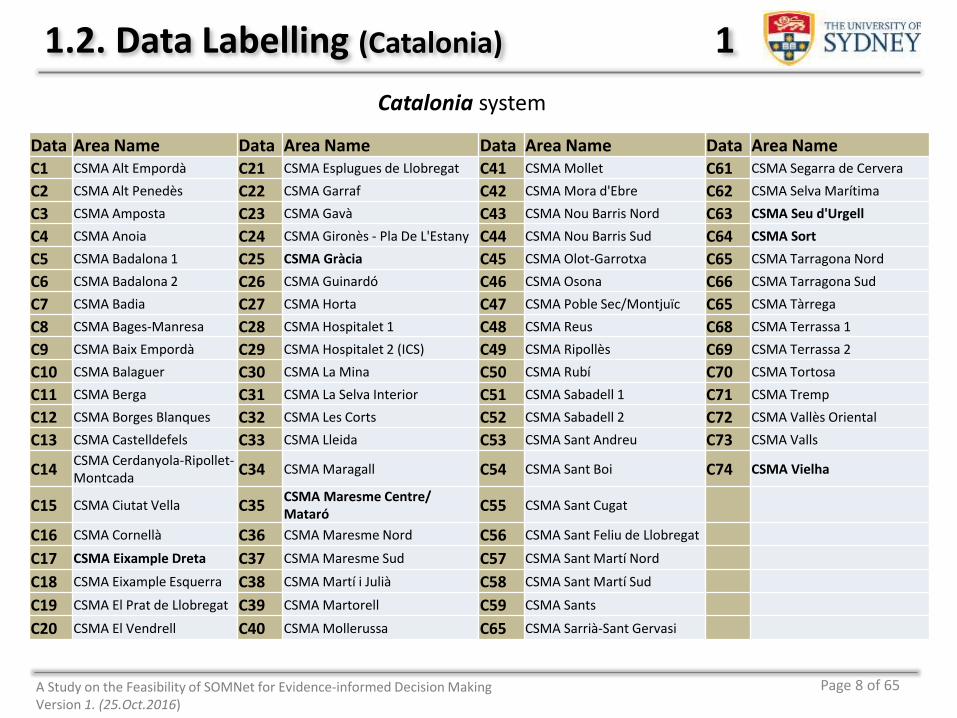
Data Area Name Data Area Name Data Area Name Data Area NameC1 CSMA Alt Empordà C21 CSMA Esplugues de Llobregat C41 CSMA Mollet C61 CSMA Segarra de Cervera
C2 CSMA Alt Penedès C22 CSMA Garraf C42 CSMA Mora d'Ebre C62 CSMA Selva Marítima
C3 CSMA Amposta C23 CSMA Gavà C43 CSMA Nou Barris Nord C63 CSMA Seu d'Urgell
C4 CSMA Anoia C24 CSMA Gironès - Pla De L'Estany C44 CSMA Nou Barris Sud C64 CSMA Sort
C5 CSMA Badalona 1 C25 CSMA Gràcia C45 CSMA Olot-Garrotxa C65 CSMA Tarragona Nord
C6 CSMA Badalona 2 C26 CSMA Guinardó C46 CSMA Osona C66 CSMA Tarragona Sud
C7 CSMA Badia C27 CSMA Horta C47 CSMA Poble Sec/Montjuïc C65 CSMA Tàrrega
C8 CSMA Bages-Manresa C28 CSMA Hospitalet 1 C48 CSMA Reus C68 CSMA Terrassa 1
C9 CSMA Baix Empordà C29 CSMA Hospitalet 2 (ICS) C49 CSMA Ripollès C69 CSMA Terrassa 2
C10 CSMA Balaguer C30 CSMA La Mina C50 CSMA Rubí C70 CSMA Tortosa
C11 CSMA Berga C31 CSMA La Selva Interior C51 CSMA Sabadell 1 C71 CSMA Tremp
C12 CSMA Borges Blanques C32 CSMA Les Corts C52 CSMA Sabadell 2 C72 CSMA Vallès Oriental
C13 CSMA Castelldefels C33 CSMA Lleida C53 CSMA Sant Andreu C73 CSMA Valls
C14CSMA Cerdanyola-Ripollet-Montcada
C34 CSMA Maragall C54 CSMA Sant Boi C74 CSMA Vielha
C15 CSMA Ciutat Vella C35CSMA Maresme Centre/Mataró
C55 CSMA Sant Cugat
C16 CSMA Cornellà C36 CSMA Maresme Nord C56 CSMA Sant Feliu de Llobregat
C17 CSMA Eixample Dreta C37 CSMA Maresme Sud C57 CSMA Sant Martí Nord
C18 CSMA Eixample Esquerra C38 CSMA Martí i Julià C58 CSMA Sant Martí Sud
C19 CSMA El Prat de Llobregat C39 CSMA Martorell C59 CSMA Sants
C20 CSMA El Vendrell C40 CSMA Mollerussa C65 CSMA Sarrià-Sant Gervasi
1.2. Data Labelling (Catalonia) 1
Catalonia system
A Study on the Feasibility of SOMNet for Evidence-informed Decision MakingVersion 1. (25.Oct.2016)
Page 8 of 65
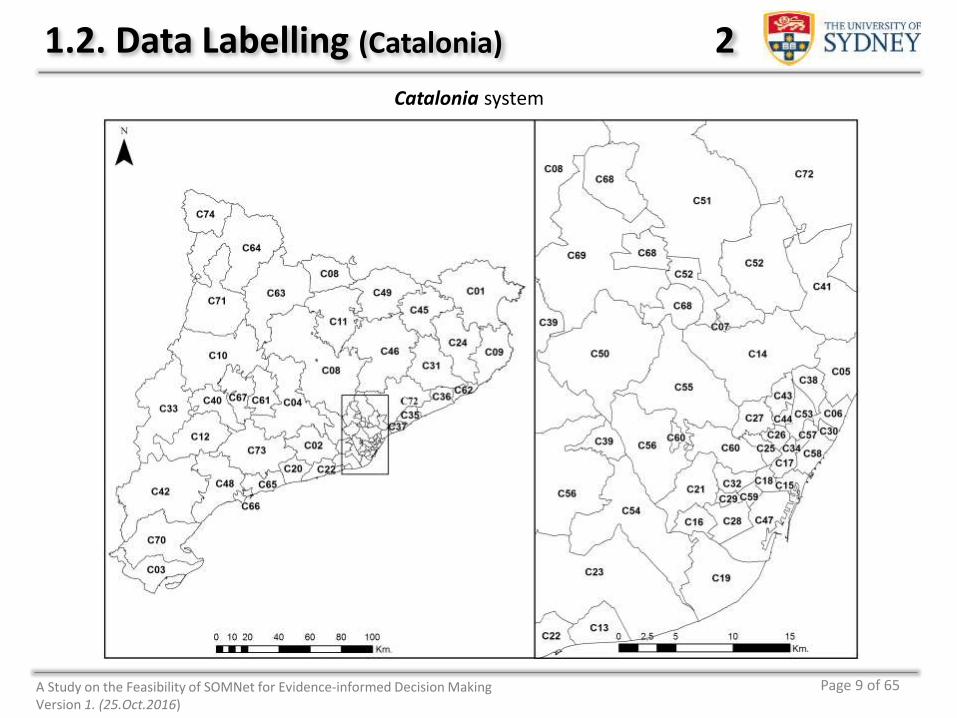
1.2. Data Labelling (Catalonia) 2
A Study on the Feasibility of SOMNet for Evidence-informed Decision MakingVersion 1. (25.Oct.2016)
Catalonia system
Page 9 of 65
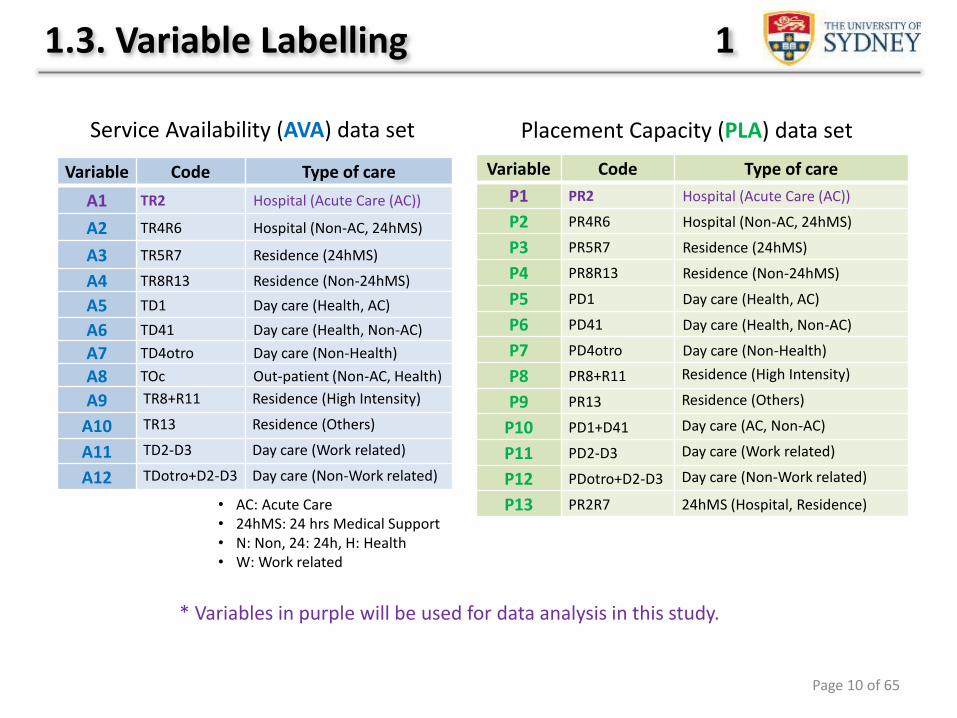
Service Availability (AVA) data set Placement Capacity (PLA) data set
Variable Code Type of care
P1 PR2 Hospital (Acute Care (AC))
P2 PR4R6 Hospital (Non-AC, 24hMS)
P3 PR5R7 Residence (24hMS)
P4 PR8R13 Residence (Non-24hMS)
P5 PD1 Day care (Health, AC)
P6 PD41 Day care (Health, Non-AC)
P7 PD4otro Day care (Non-Health)
P8 PR8+R11 Residence (High Intensity)
P9 PR13 Residence (Others)
P10 PD1+D41 Day care (AC, Non-AC)
P11 PD2-D3 Day care (Work related)
P12 PDotro+D2-D3 Day care (Non-Work related)
P13 PR2R7 24hMS (Hospital, Residence)
* Variables in purple will be used for data analysis in this study.
1.3. Variable Labelling 1
• AC: Acute Care• 24hMS: 24 hrs Medical Support• N: Non, 24: 24h, H: Health• W: Work related
Variable Code Type of care
A1 TR2 Hospital (Acute Care (AC))
A2 TR4R6 Hospital (Non-AC, 24hMS)
A3 TR5R7 Residence (24hMS)
A4 TR8R13 Residence (Non-24hMS)
A5 TD1 Day care (Health, AC)
A6 TD41 Day care (Health, Non-AC)
A7 TD4otro Day care (Non-Health)
A8 TOc Out-patient (Non-AC, Health)
A9 TR8+R11 Residence (High Intensity)
A10 TR13 Residence (Others)
A11 TD2-D3 Day care (Work related)
A12 TDotro+D2-D3 Day care (Non-Work related)
Page 10 of 65
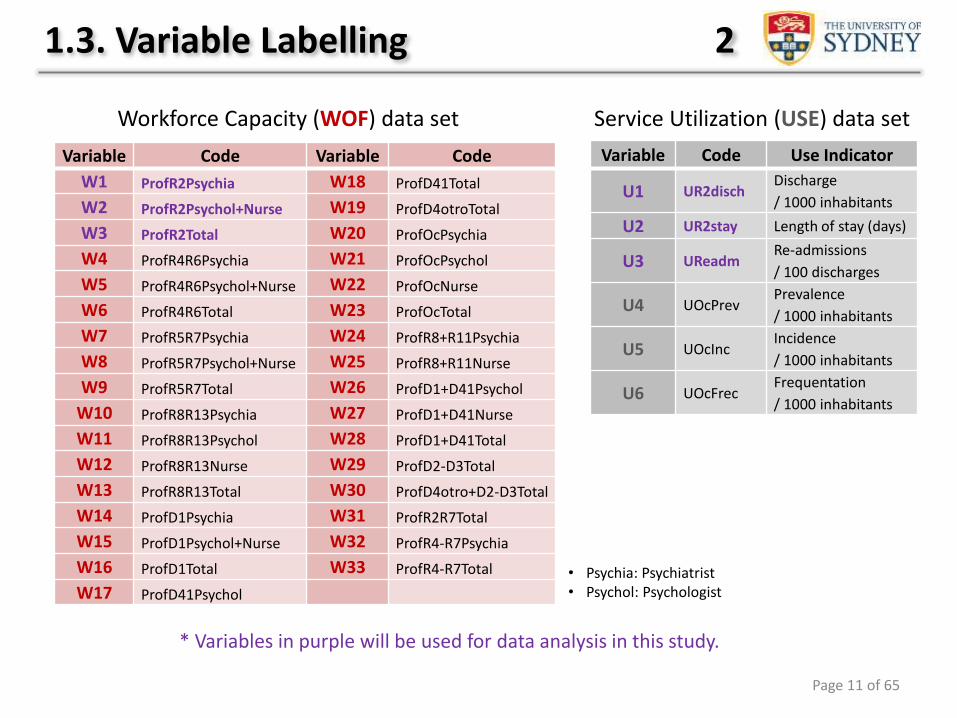
Workforce Capacity (WOF) data set
Variable Code Variable Code
W1 ProfR2Psychia W18 ProfD41Total
W2 ProfR2Psychol+Nurse W19 ProfD4otroTotal
W3 ProfR2Total W20 ProfOcPsychia
W4 ProfR4R6Psychia W21 ProfOcPsychol
W5 ProfR4R6Psychol+Nurse W22 ProfOcNurse
W6 ProfR4R6Total W23 ProfOcTotal
W7 ProfR5R7Psychia W24 ProfR8+R11Psychia
W8 ProfR5R7Psychol+Nurse W25 ProfR8+R11Nurse
W9 ProfR5R7Total W26 ProfD1+D41Psychol
W10 ProfR8R13Psychia W27 ProfD1+D41Nurse
W11 ProfR8R13Psychol W28 ProfD1+D41Total
W12 ProfR8R13Nurse W29 ProfD2-D3Total
W13 ProfR8R13Total W30 ProfD4otro+D2-D3Total
W14 ProfD1Psychia W31 ProfR2R7Total
W15 ProfD1Psychol+Nurse W32 ProfR4-R7Psychia
W16 ProfD1Total W33 ProfR4-R7Total
W17 ProfD41Psychol
• Psychia: Psychiatrist• Psychol: Psychologist
1.3. Variable Labelling 2
Service Utilization (USE) data set
Variable Code Use Indicator
U1 UR2dischDischarge
/ 1000 inhabitants
U2 UR2stay Length of stay (days)
U3 UReadmRe-admissions
/ 100 discharges
U4 UOcPrevPrevalence
/ 1000 inhabitants
U5 UOcIncIncidence
/ 1000 inhabitants
U6 UOcFrecFrequentation
/ 1000 inhabitants
Page 11 of 65
* Variables in purple will be used for data analysis in this study.
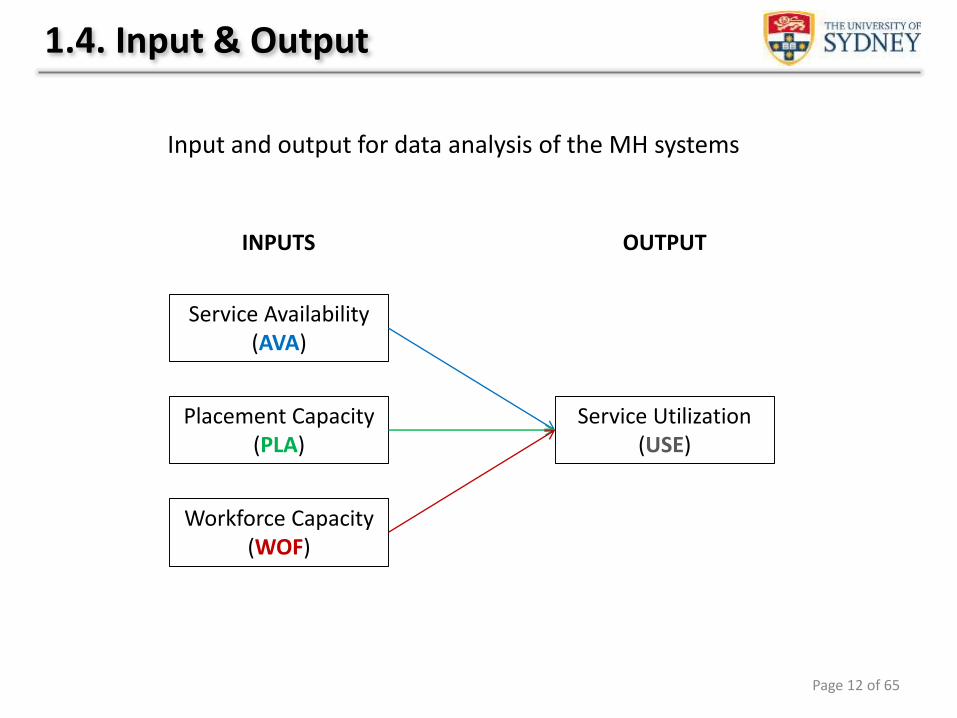
Workforce Capacity (WOF)
INPUTS
1.4. Input & Output
Service Utilization (USE)
Service Availability (AVA)
Placement Capacity (PLA)
OUTPUT
Input and output for data analysis of the MH systems
Page 12 of 65
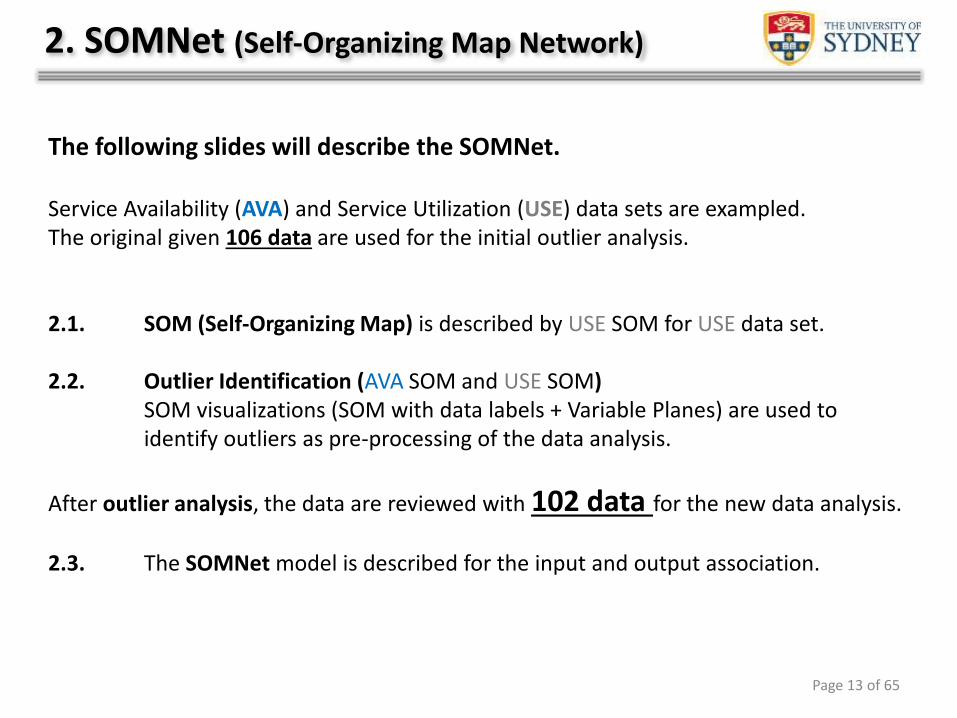
2. SOMNet (Self-Organizing Map Network)
Page 13 of 65
The following slides will describe the SOMNet.
Service Availability (AVA) and Service Utilization (USE) data sets are exampled. The original given 106 data are used for the initial outlier analysis.
2.1. SOM (Self-Organizing Map) is described by USE SOM for USE data set.
2.2. Outlier Identification (AVA SOM and USE SOM)SOM visualizations (SOM with data labels + Variable Planes) are used to identify outliers as pre-processing of the data analysis.
After outlier analysis, the data are reviewed with 102 data for the new data analysis.
2.3. The SOMNet model is described for the input and output association.
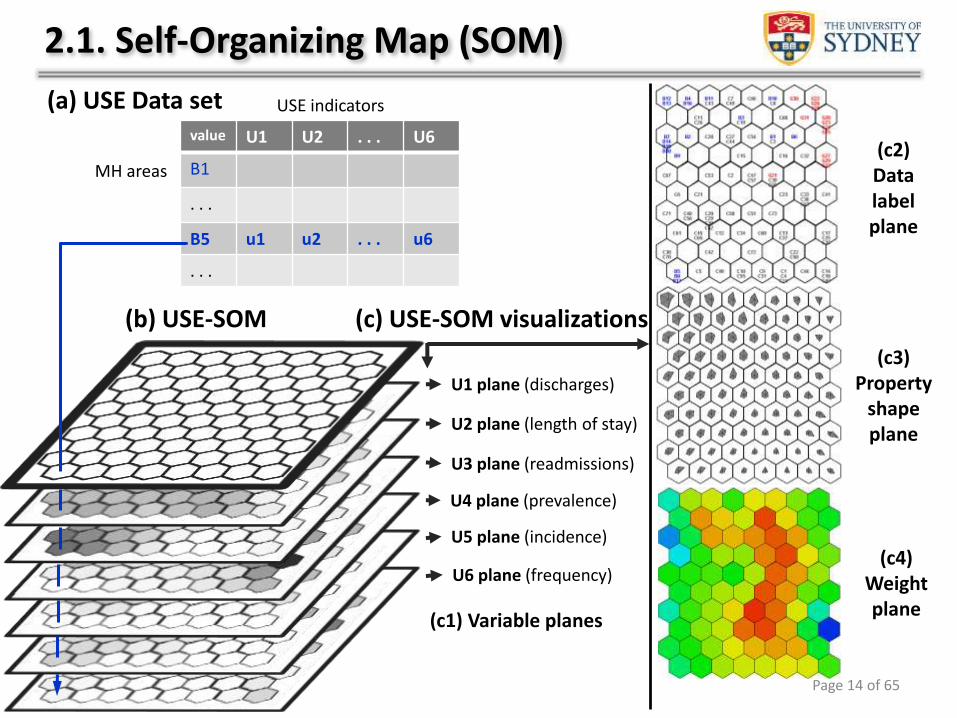
2.1. Self-Organizing Map (SOM)
Page 14 of 65
U1 plane (discharges)
U2 plane (length of stay)
U3 plane (readmissions)
U4 plane (prevalence)
U5 plane (incidence)
U6 plane (frequency)
(b) USE-SOM
(c3) Property
shape plane
(c2) Data label plane
(c4) Weight plane
value U1 U2 . . . U6
B1
. . .
B5 u1 u2 . . . u6
. . .
(a) USE Data set
MH areas
USE indicators
(c) USE-SOM visualizations
(c1) Variable planes
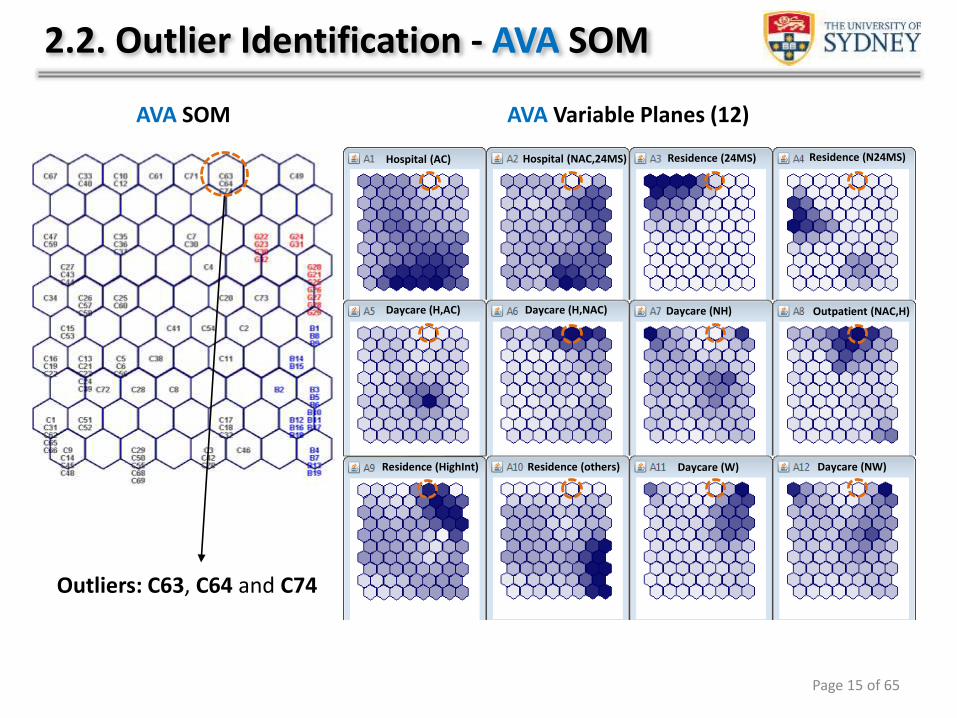
2.2. Outlier Identification - AVA SOM
AVA SOM AVA Variable Planes (12)
Residence (N24MS)
Hospital (AC) Hospital (NAC,24MS) Residence (24MS)
Daycare (H,AC) Daycare (H,NAC) Daycare (NH) Outpatient (NAC,H)
Residence (HighInt) Residence (others) Daycare (W) Daycare (NW)
Outliers: C63, C64 and C74
Residence (N24MS)
Page 15 of 65
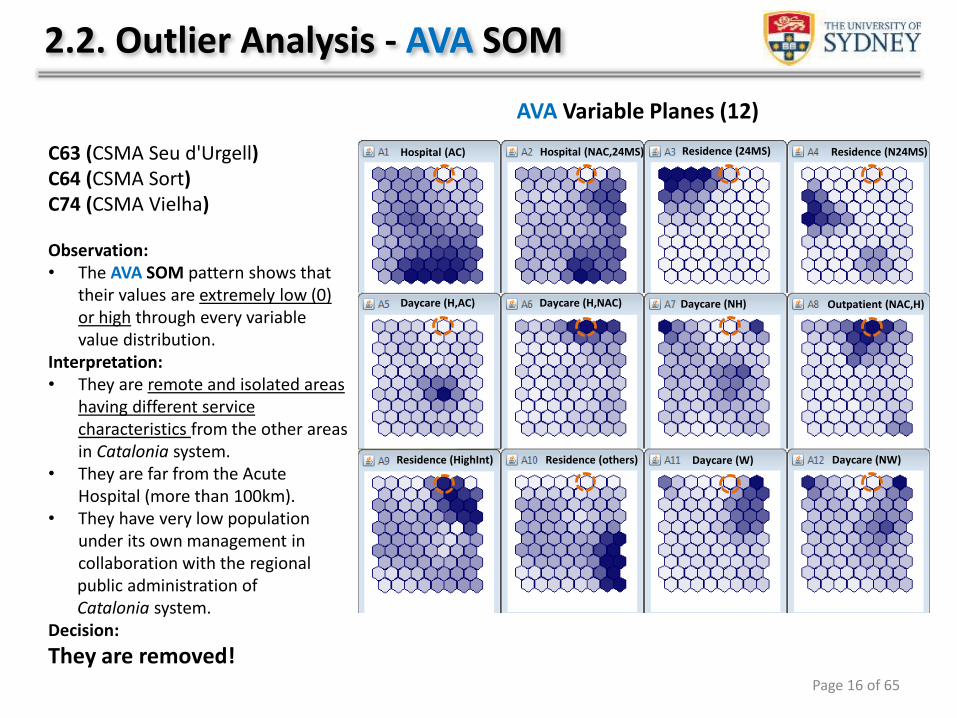
2.2. Outlier Analysis - AVA SOM
AVA Variable Planes (12)
Residence (N24MS)
C63 (CSMA Seu d'Urgell)C64 (CSMA Sort)C74 (CSMA Vielha)
Observation:• The AVA SOM pattern shows that
their values are extremely low (0) or high through every variable value distribution.
Interpretation:• They are remote and isolated areas
having different service characteristics from the other areas in Catalonia system.
• They are far from the Acute Hospital (more than 100km).
• They have very low population under its own management in collaboration with the regional public administration of Catalonia system.
Decision:
They are removed!
Hospital (AC) Hospital (NAC,24MS) Residence (24MS)
Daycare (H,AC) Daycare (H,NAC) Daycare (NH) Outpatient (NAC,H)
Residence (HighInt) Residence (others) Daycare (W) Daycare (NW)
Residence (N24MS)
Page 16 of 65
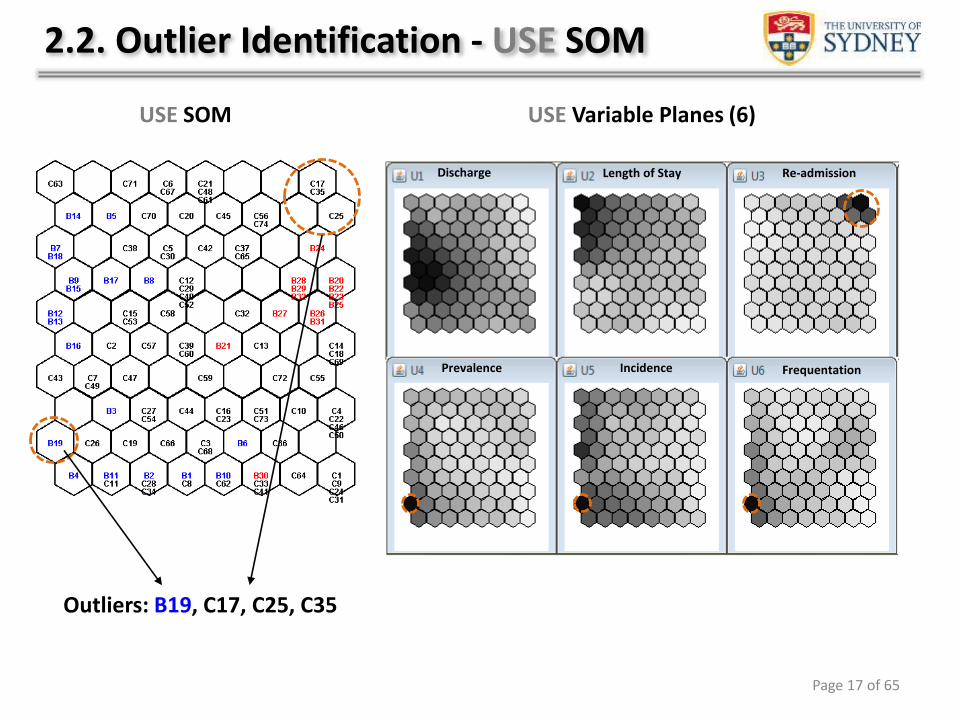
2.2. Outlier Identification - USE SOM
USE SOM USE Variable Planes (6)
Outliers: B19, C17, C25, C35
Discharge Length of Stay Re-admission
Prevalence Incidence Frequentation
Page 17 of 65
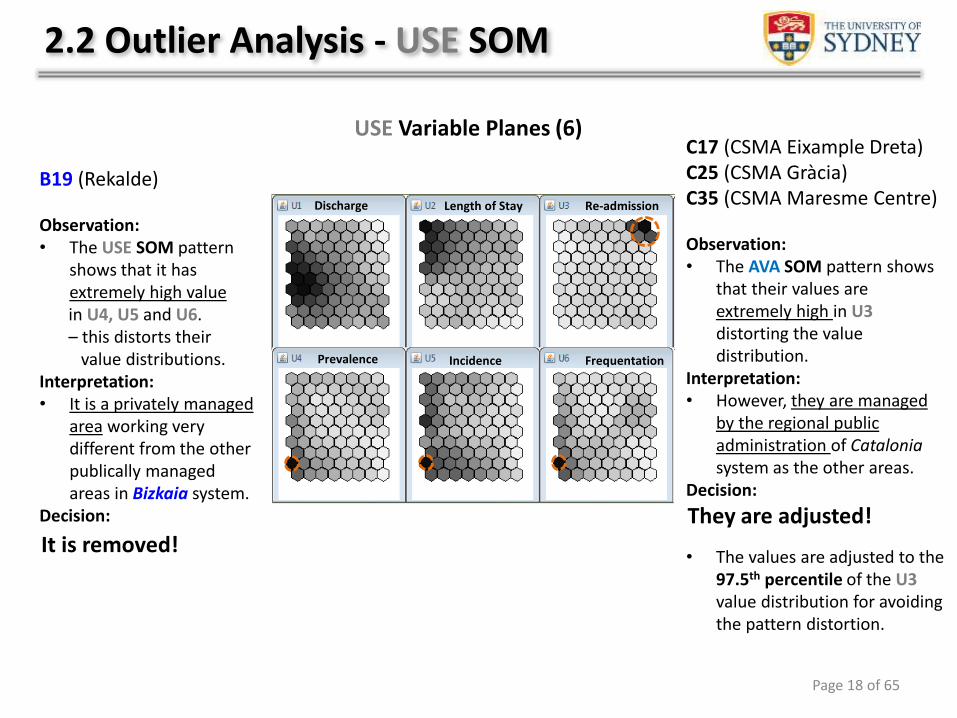
2.2 Outlier Analysis - USE SOM
USE Variable Planes (6)
Discharge Length of Stay Re-admission
Prevalence Incidence Frequentation
B19 (Rekalde)
Observation:• The USE SOM pattern
shows that it has extremely high value in U4, U5 and U6. – this distorts their
value distributions.Interpretation:• It is a privately managed
area working very different from the other publically managed areas in Bizkaia system.
Decision:
C17 (CSMA Eixample Dreta)C25 (CSMA Gràcia)C35 (CSMA Maresme Centre)
Observation:• The AVA SOM pattern shows
that their values are extremely high in U3distorting the value distribution.
Interpretation:• However, they are managed
by the regional public administration of Cataloniasystem as the other areas.
Decision:
• The values are adjusted to the 97.5th percentile of the U3 value distribution for avoiding the pattern distortion.
It is removed!They are adjusted!
Page 18 of 65
Bizkaiasystem
Gipuzkoasystem
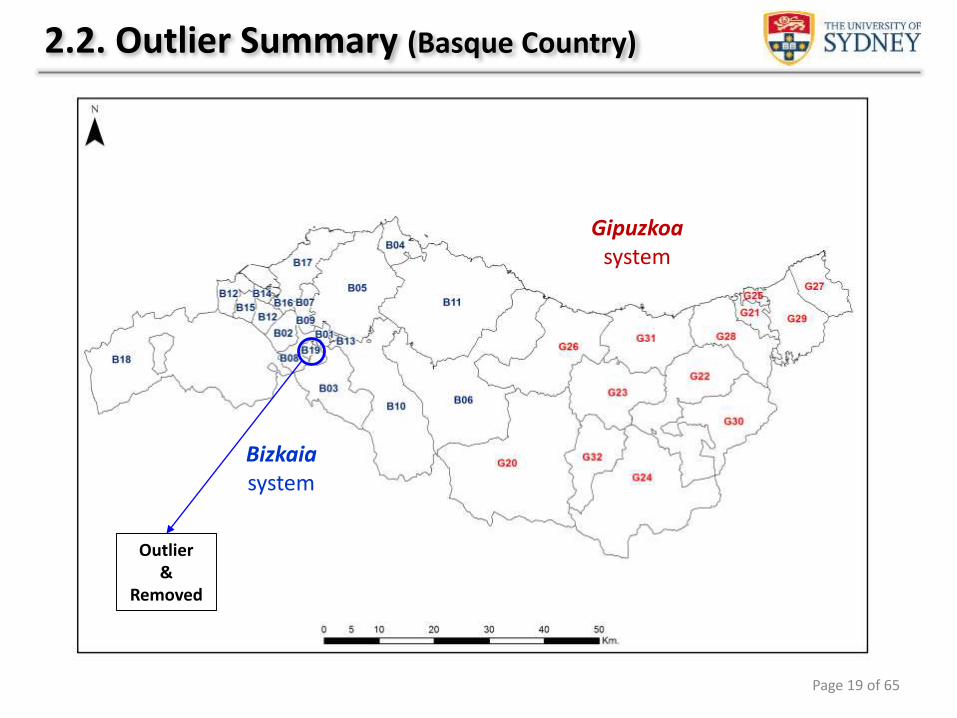
2.2. Outlier Summary (Basque Country)
Outlier&
Removed
Page 19 of 65
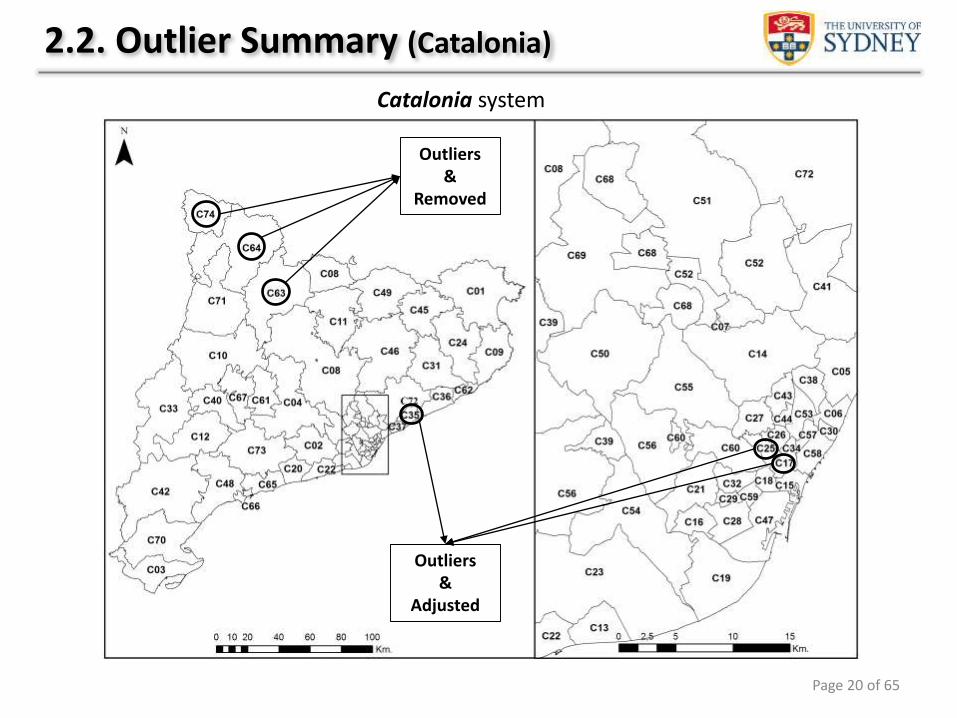
2.2. Outlier Summary (Catalonia)
Catalonia system
Outliers&
Removed
Outliers&
Adjusted
Page 20 of 65
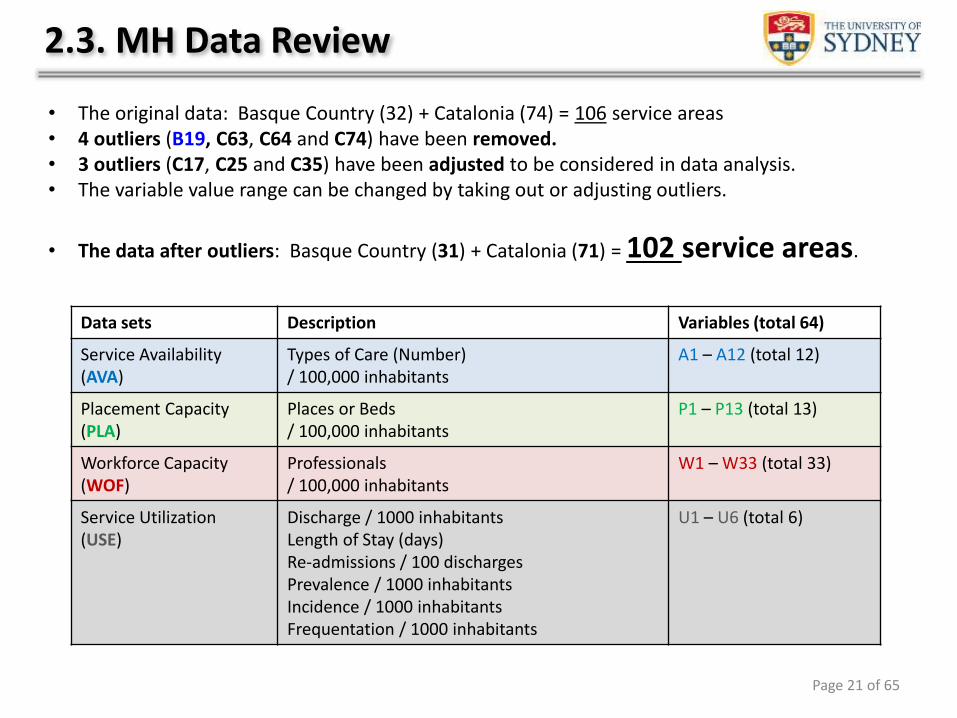
2.3. MH Data Review
• The original data: Basque Country (32) + Catalonia (74) = 106 service areas• 4 outliers (B19, C63, C64 and C74) have been removed.• 3 outliers (C17, C25 and C35) have been adjusted to be considered in data analysis.• The variable value range can be changed by taking out or adjusting outliers.
• The data after outliers: Basque Country (31) + Catalonia (71) = 102 service areas.
Data sets Description Variables (total 64)
Service Availability (AVA)
Types of Care (Number) / 100,000 inhabitants
A1 – A12 (total 12)
Placement Capacity (PLA)
Places or Beds / 100,000 inhabitants
P1 – P13 (total 13)
Workforce Capacity (WOF)
Professionals / 100,000 inhabitants
W1 – W33 (total 33)
Service Utilization (USE)
Discharge / 1000 inhabitantsLength of Stay (days)Re-admissions / 100 dischargesPrevalence / 1000 inhabitantsIncidence / 1000 inhabitantsFrequentation / 1000 inhabitants
U1 – U6 (total 6)
Page 21 of 65
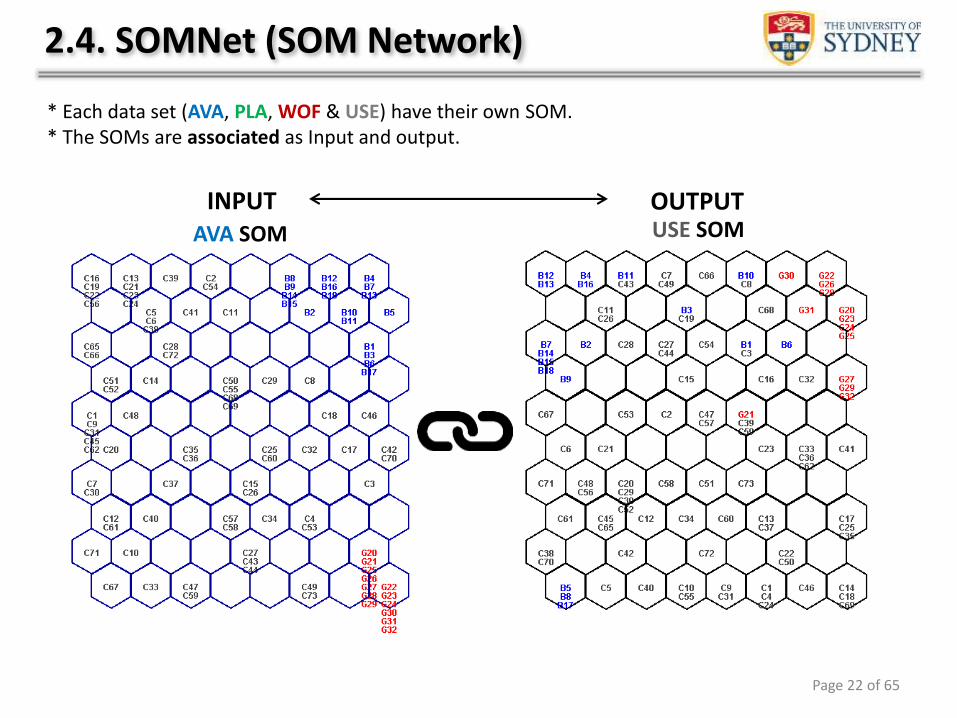
* Each data set (AVA, PLA, WOF & USE) have their own SOM.* The SOMs are associated as Input and output.
2.4. SOMNet (SOM Network)
AVA SOM
INPUT OUTPUTUSE SOM
Page 22 of 65
3. Data Analysis
Page 23 of 65
The following slides will show how data are analysed in this study.
• All SOMs for Service Availability (AVA), Placement Capacity (PLA), Workforce Capacity (WOF) and Service Utilization (USE) data sets are created with the reviewed 102 data.
• 4 Main Tasks are listed for the visual data analysis of a given scenario.
• Goals and Achievements are described for each task.
• Different SOM visualizations are used for different data analysis.
Task 1. Pattern IdentificationIdentify patterns of the regional MH systems (Bizkaia, Gipuzkoa and Calanoia systems)Identify meaningful clusters by showing the relation of small MH areas
Pattern ExplanationExplain variables that explain MH system patterns
Task 2. Indicator IdentificationIdentify the output variable values that better explain the given inputsIdentify the input variable values that better explain the given output?
Task 3. Analytical Interpretation Derive reasonable interpretation on the analytical results with the experts in the study areaGuide further data analysis based on analytical results
3. Data Analysis Tasks
Scenario: Identify relations between resource indicators as inputs and service
utilization as output for Acute Care Hospital
Page 24 of 65
Goals• Identify global patterns of the regional MH systems in each data set.• Identify meaningful clusters between or within Bizkaia, Gipuzkoa and Calanoia systems.• Identify local relations of small MH service areas within each system.
Achievements• Each SOM shows global and local differences between MH systems and areas.• The MH areas in a neuron as a unit cluster show the closest property.• The MH areas in a group of neighbour neurons as a local cluster show the similar property. • The further MH areas represent different properties.• Any local regions (a group of MH areas) of interest can be further explored• The local pattern or characteristics of interest can be observed.
Task 1-1. Pattern Identification
Page 25 of 65
AVA SOM
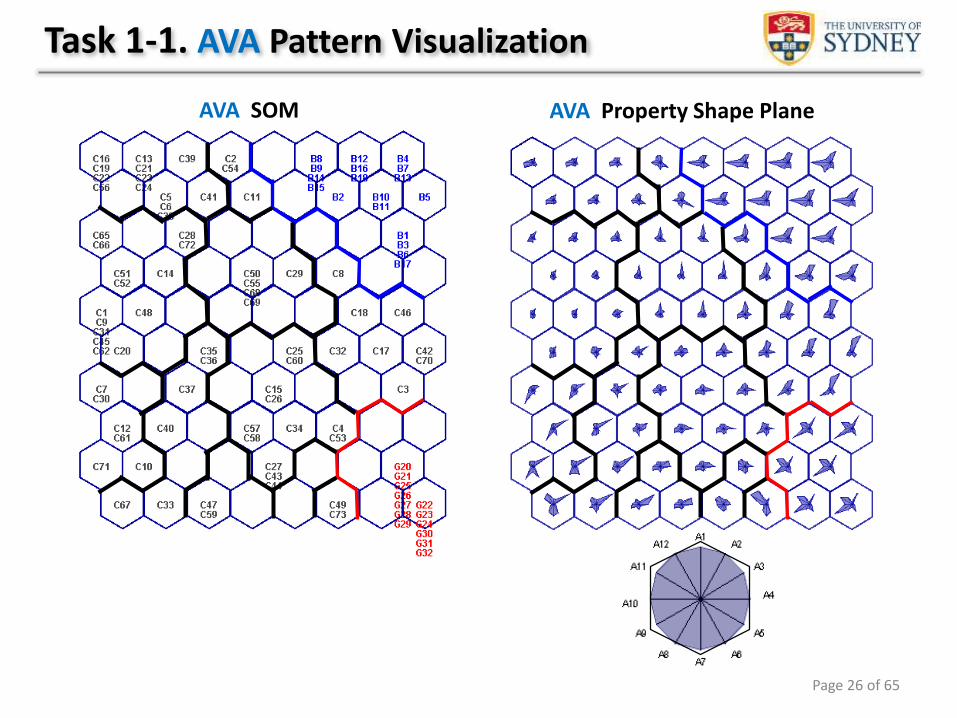
Task 1-1. AVA Pattern Visualization
AVA Property Shape Plane
Page 26 of 65
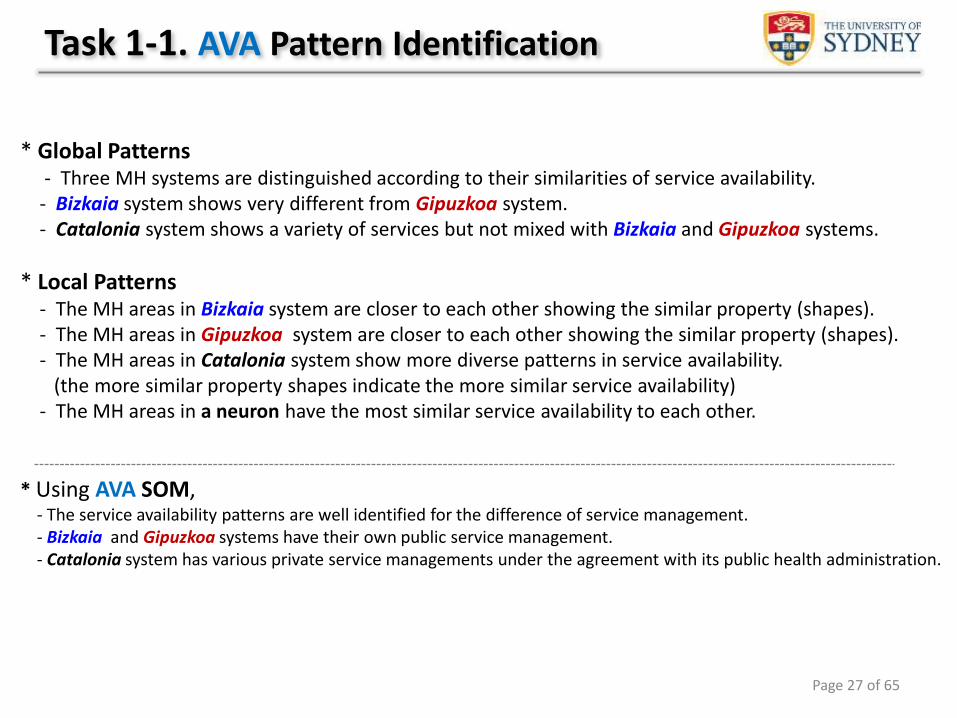
* Global Patterns- Three MH systems are distinguished according to their similarities of service availability.- Bizkaia system shows very different from Gipuzkoa system.- Catalonia system shows a variety of services but not mixed with Bizkaia and Gipuzkoa systems.
* Local Patterns - The MH areas in Bizkaia system are closer to each other showing the similar property (shapes). - The MH areas in Gipuzkoa system are closer to each other showing the similar property (shapes).- The MH areas in Catalonia system show more diverse patterns in service availability.
(the more similar property shapes indicate the more similar service availability)- The MH areas in a neuron have the most similar service availability to each other.
* Using AVA SOM, - The service availability patterns are well identified for the difference of service management.- Bizkaia and Gipuzkoa systems have their own public service management.- Catalonia system has various private service managements under the agreement with its public health administration.
Page 27 of 65
Task 1-1. AVA Pattern Identification
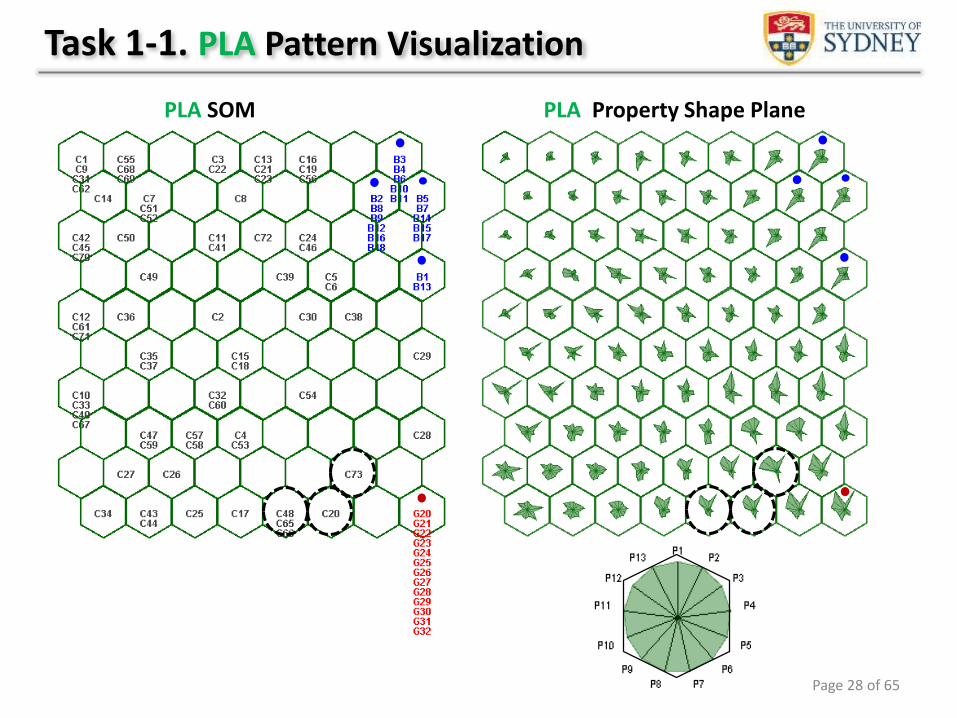
PLA SOM
Task 1-1. PLA Pattern Visualization
PLA Property Shape Plane
Page 28 of 65
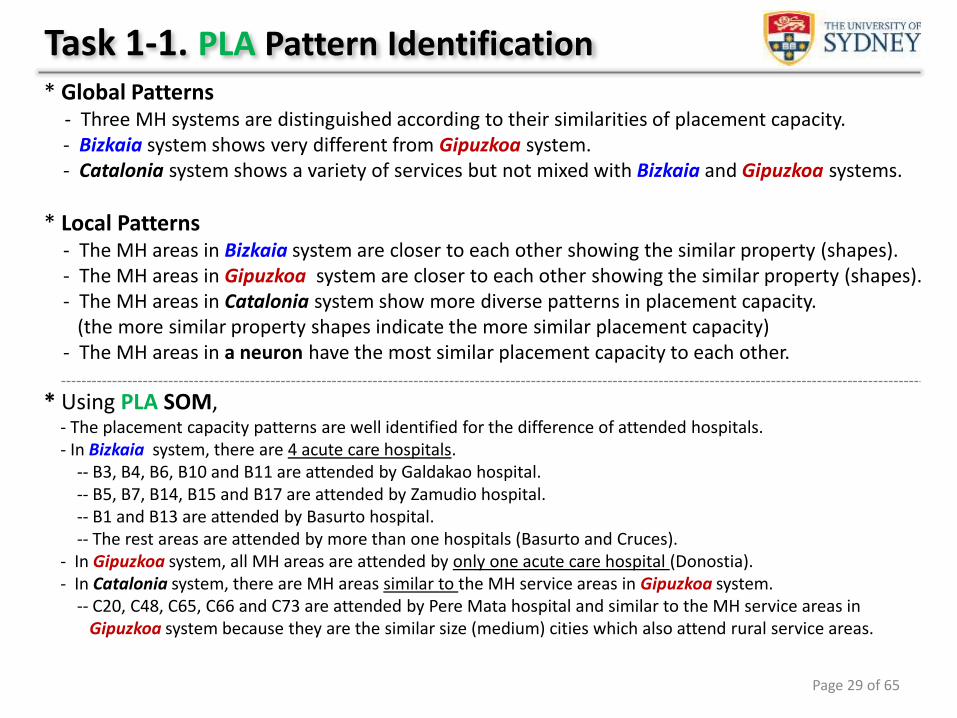
Task 1-1. PLA Pattern Identification* Global Patterns
- Three MH systems are distinguished according to their similarities of placement capacity.- Bizkaia system shows very different from Gipuzkoa system.- Catalonia system shows a variety of services but not mixed with Bizkaia and Gipuzkoa systems.
* Local Patterns - The MH areas in Bizkaia system are closer to each other showing the similar property (shapes). - The MH areas in Gipuzkoa system are closer to each other showing the similar property (shapes).- The MH areas in Catalonia system show more diverse patterns in placement capacity.
(the more similar property shapes indicate the more similar placement capacity)- The MH areas in a neuron have the most similar placement capacity to each other.
* Using PLA SOM, - The placement capacity patterns are well identified for the difference of attended hospitals.- In Bizkaia system, there are 4 acute care hospitals.
-- B3, B4, B6, B10 and B11 are attended by Galdakao hospital. -- B5, B7, B14, B15 and B17 are attended by Zamudio hospital.-- B1 and B13 are attended by Basurto hospital. -- The rest areas are attended by more than one hospitals (Basurto and Cruces).
- In Gipuzkoa system, all MH areas are attended by only one acute care hospital (Donostia). - In Catalonia system, there are MH areas similar to the MH service areas in Gipuzkoa system.
-- C20, C48, C65, C66 and C73 are attended by Pere Mata hospital and similar to the MH service areas in Gipuzkoa system because they are the similar size (medium) cities which also attend rural service areas.
Page 29 of 65
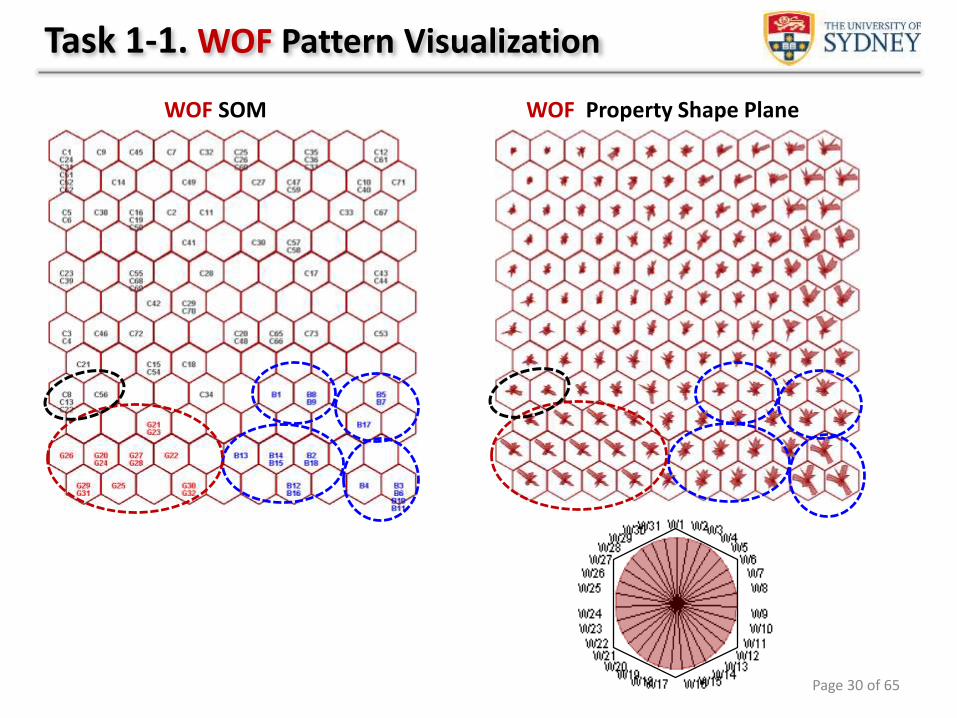
WOF SOM
Task 1-1. WOF Pattern Visualization
WOF Property Shape Plane
Page 30 of 65
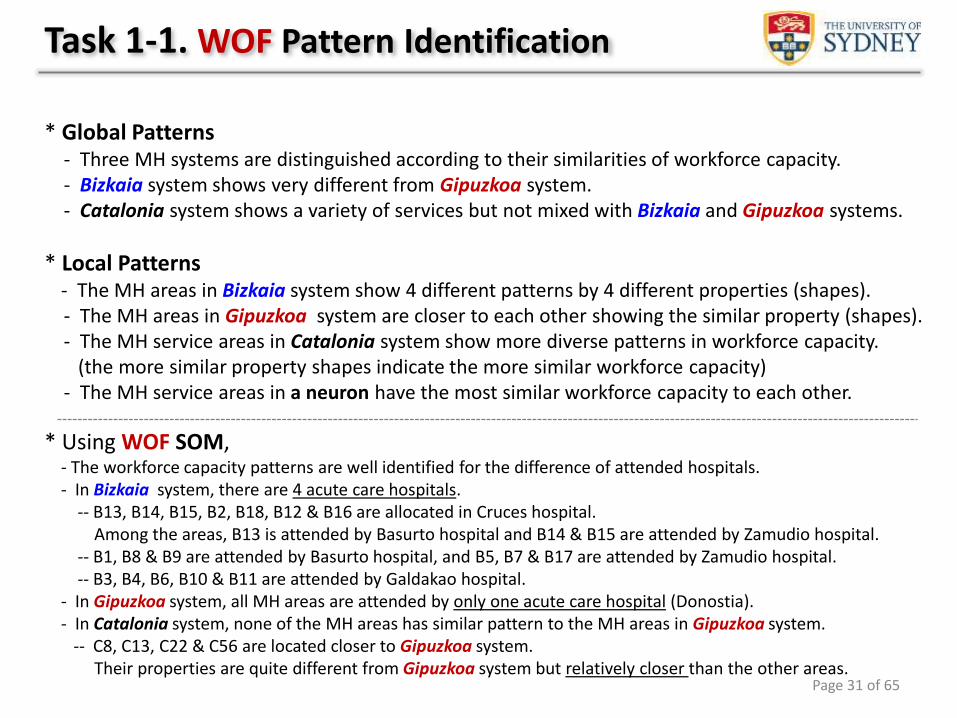
Task 1-1. WOF Pattern Identification
* Global Patterns - Three MH systems are distinguished according to their similarities of workforce capacity.- Bizkaia system shows very different from Gipuzkoa system.- Catalonia system shows a variety of services but not mixed with Bizkaia and Gipuzkoa systems.
* Local Patterns- The MH areas in Bizkaia system show 4 different patterns by 4 different properties (shapes). - The MH areas in Gipuzkoa system are closer to each other showing the similar property (shapes).- The MH service areas in Catalonia system show more diverse patterns in workforce capacity.
(the more similar property shapes indicate the more similar workforce capacity)- The MH service areas in a neuron have the most similar workforce capacity to each other.
* Using WOF SOM, - The workforce capacity patterns are well identified for the difference of attended hospitals.- In Bizkaia system, there are 4 acute care hospitals.
-- B13, B14, B15, B2, B18, B12 & B16 are allocated in Cruces hospital.Among the areas, B13 is attended by Basurto hospital and B14 & B15 are attended by Zamudio hospital.
-- B1, B8 & B9 are attended by Basurto hospital, and B5, B7 & B17 are attended by Zamudio hospital.-- B3, B4, B6, B10 & B11 are attended by Galdakao hospital.
- In Gipuzkoa system, all MH areas are attended by only one acute care hospital (Donostia).- In Catalonia system, none of the MH areas has similar pattern to the MH areas in Gipuzkoa system.
-- C8, C13, C22 & C56 are located closer to Gipuzkoa system.Their properties are quite different from Gipuzkoa system but relatively closer than the other areas.
Page 31 of 65
USE SOM
Task 1-1. USE Pattern Visualization
USE Property Shape Plane
Page 32 of 65
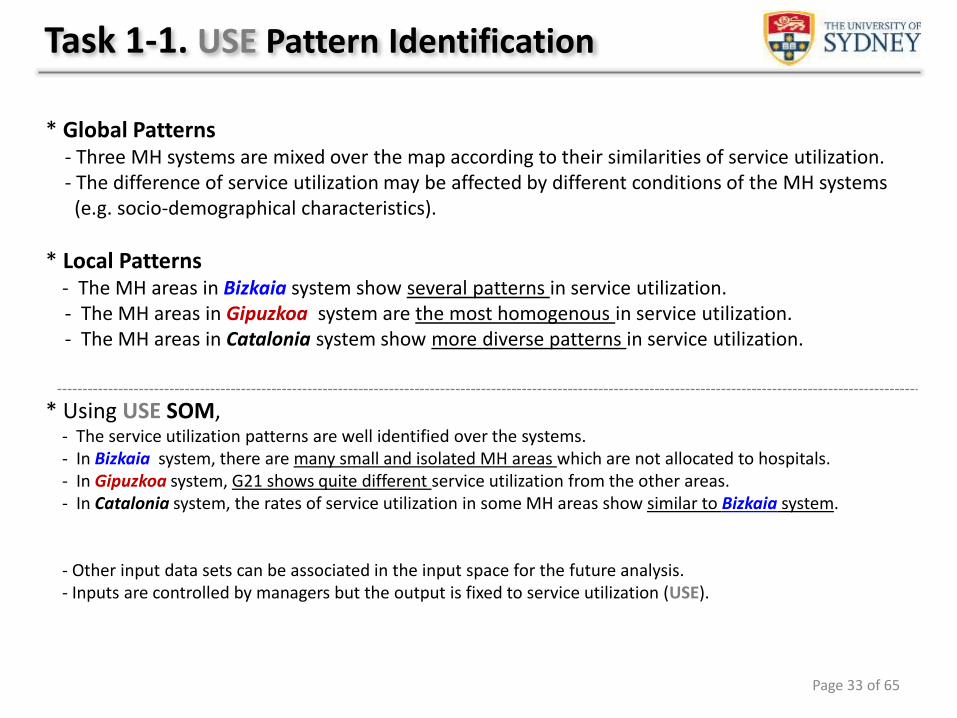
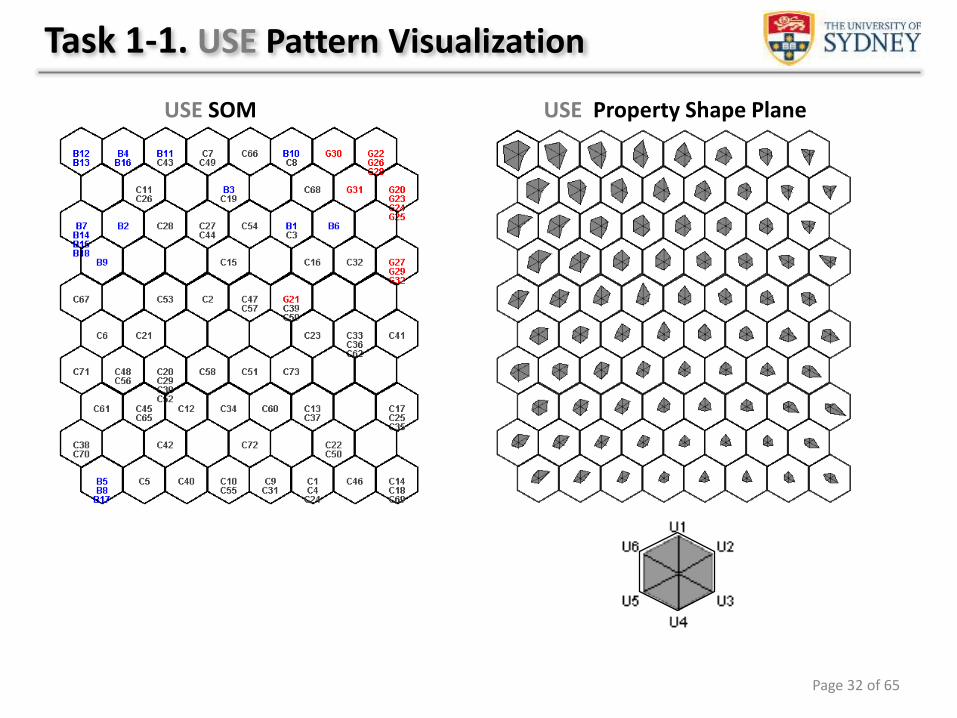
Task 1-1. USE Pattern Identification
* Global Patterns- Three MH systems are mixed over the map according to their similarities of service utilization.- The difference of service utilization may be affected by different conditions of the MH systems(e.g. socio-demographical characteristics).
* Local Patterns- The MH areas in Bizkaia system show several patterns in service utilization.- The MH areas in Gipuzkoa system are the most homogenous in service utilization.- The MH areas in Catalonia system show more diverse patterns in service utilization.
* Using USE SOM, - The service utilization patterns are well identified over the systems.- In Bizkaia system, there are many small and isolated MH areas which are not allocated to hospitals.- In Gipuzkoa system, G21 shows quite different service utilization from the other areas. - In Catalonia system, the rates of service utilization in some MH areas show similar to Bizkaia system.
- Other input data sets can be associated in the input space for the future analysis. - Inputs are controlled by managers but the output is fixed to service utilization (USE).
Page 33 of 65
Task 1-2. Pattern Explanation
Goals• Identify variables that explain the patterns between the regional MH systems in a data set.• Explain what variables make the MH systems different and why.• Explain the variable relations among MH service areas within a MH system.
Achievements• Each labelled SOM shows data the global and local property differences among MH areas. • The patterns can be explained by comparing the properties.
AVA SOM and USE SOM are used for pattern explanation.
Page 34 of 65
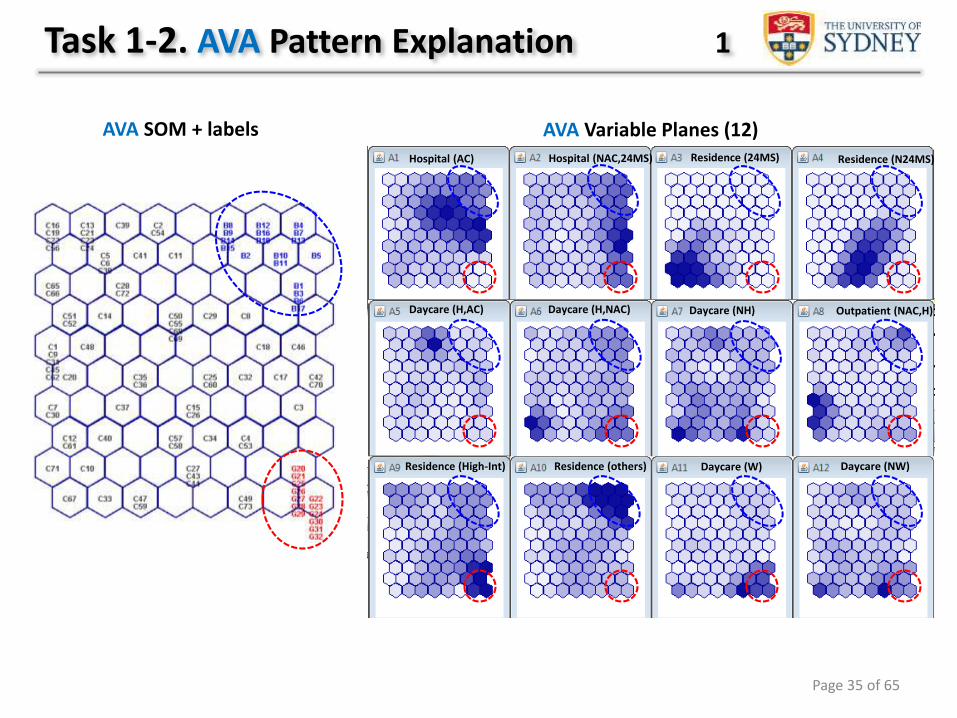
AVA SOM + labels AVA Variable Planes (12)Hospital (AC) Hospital (NAC,24MS) Residence (24MS)
Daycare (H,AC) Daycare (H,NAC) Daycare (NH) Outpatient (NAC,H)
Residence (High-Int) Residence (others) Daycare (W) Daycare (NW)
Residence (N24MS)
Task 1-2. AVA Pattern Explanation 1
Page 35 of 65
AVA Variable Planes (12)
Hospital (AC) Hospital (NAC,24MS) Residence (24MS)
Daycare (H,AC) Daycare (H,NAC) Daycare (NH) Outpatient (NAC,H)
Residence (HighInt) Residence (others) Daycare (W) Daycare (NW)
Residence (N24MS)
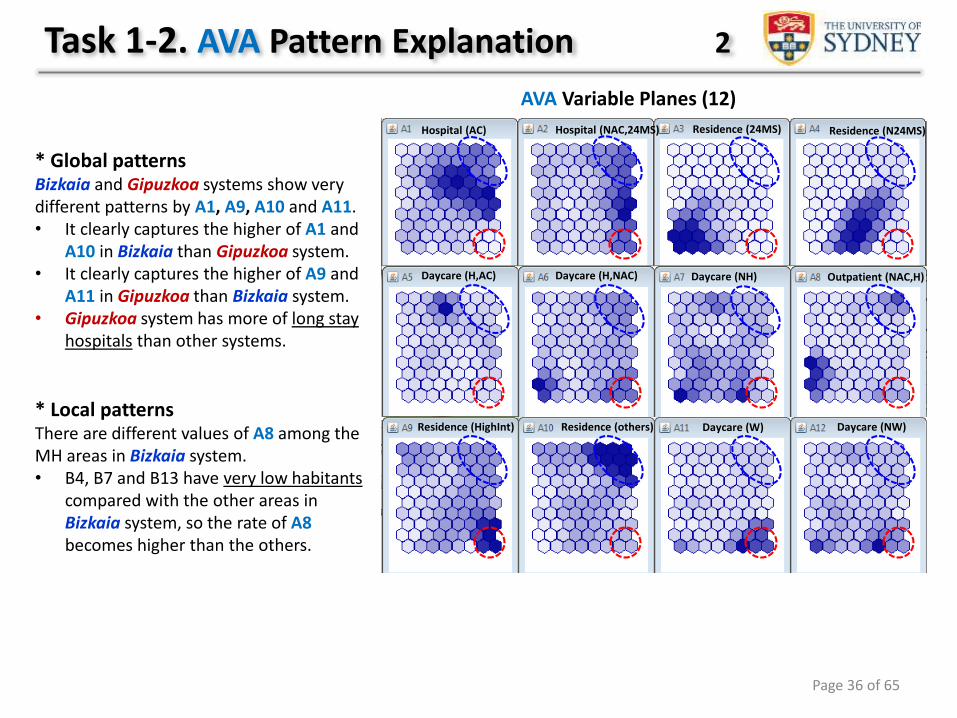
* Global patternsBizkaia and Gipuzkoa systems show very different patterns by A1, A9, A10 and A11.• It clearly captures the higher of A1 and
A10 in Bizkaia than Gipuzkoa system. • It clearly captures the higher of A9 and
A11 in Gipuzkoa than Bizkaia system. • Gipuzkoa system has more of long stay
hospitals than other systems.
* Local patternsThere are different values of A8 among the MH areas in Bizkaia system.• B4, B7 and B13 have very low habitants
compared with the other areas in Bizkaia system, so the rate of A8becomes higher than the others.
Task 1-2. AVA Pattern Explanation 2
Page 36 of 65
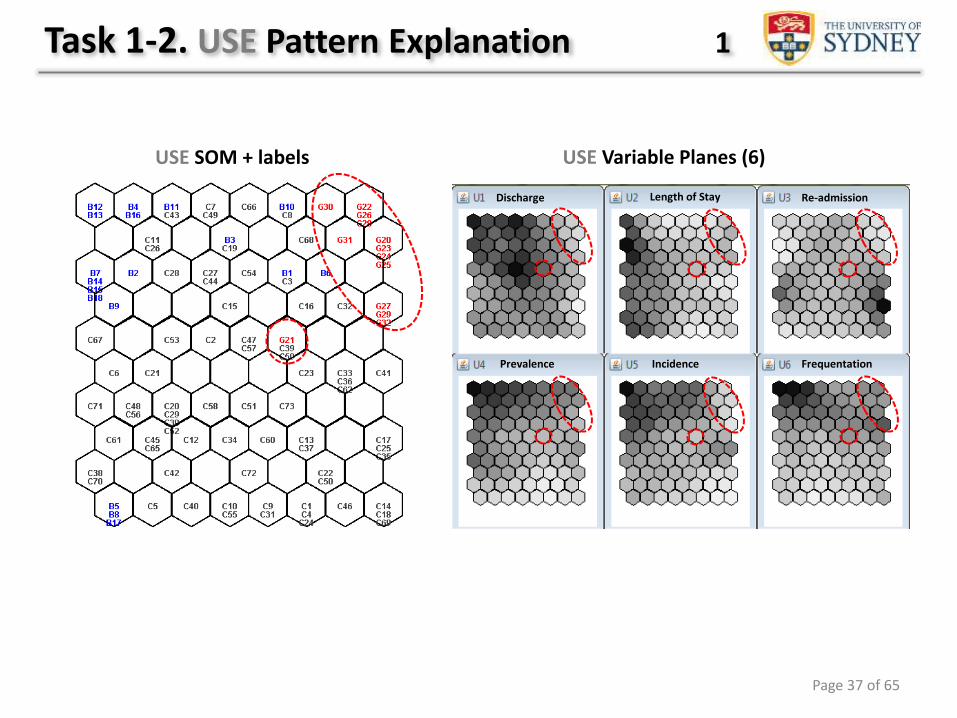
Discharge Length of Stay Re-admission
Prevalence Incidence Frequentation
Task 1-2. USE Pattern Explanation 1
USE SOM + labels USE Variable Planes (6)
Page 37 of 65
Discharge Length of Stay Re-admission
Prevalence Incidence Frequentation
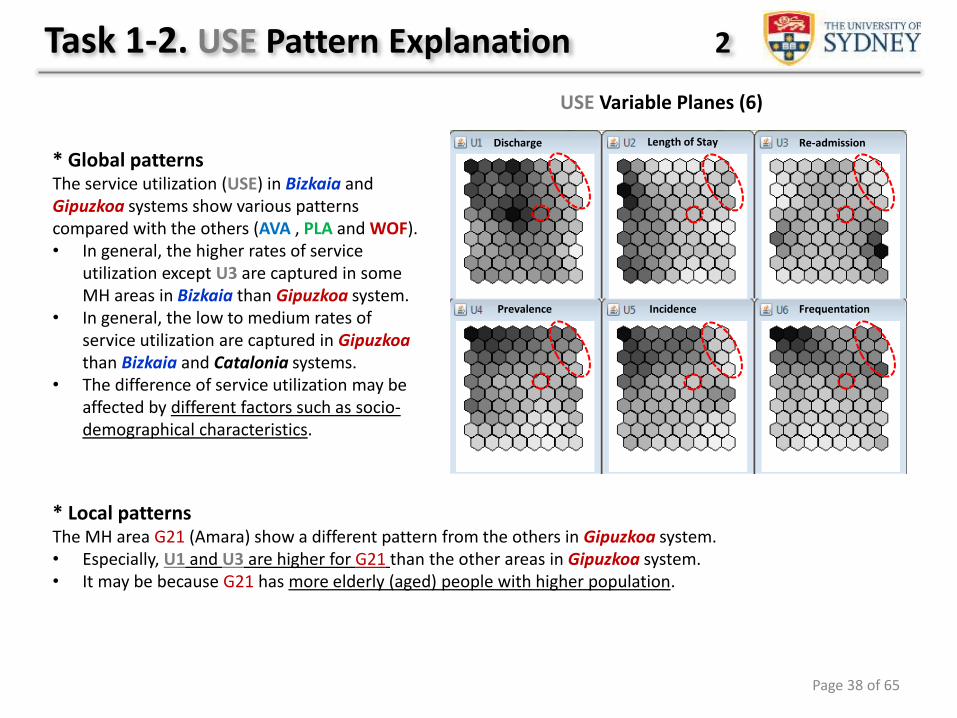
Task 1-2. USE Pattern Explanation 2
* Global patternsThe service utilization (USE) in Bizkaia and Gipuzkoa systems show various patterns compared with the others (AVA , PLA and WOF).• In general, the higher rates of service
utilization except U3 are captured in some MH areas in Bizkaia than Gipuzkoa system.
• In general, the low to medium rates of service utilization are captured in Gipuzkoathan Bizkaia and Catalonia systems.
• The difference of service utilization may be affected by different factors such as socio-demographical characteristics.
USE Variable Planes (6)
* Local patternsThe MH area G21 (Amara) show a different pattern from the others in Gipuzkoa system. • Especially, U1 and U3 are higher for G21 than the other areas in Gipuzkoa system.• It may be because G21 has more elderly (aged) people with higher population.
Page 38 of 65
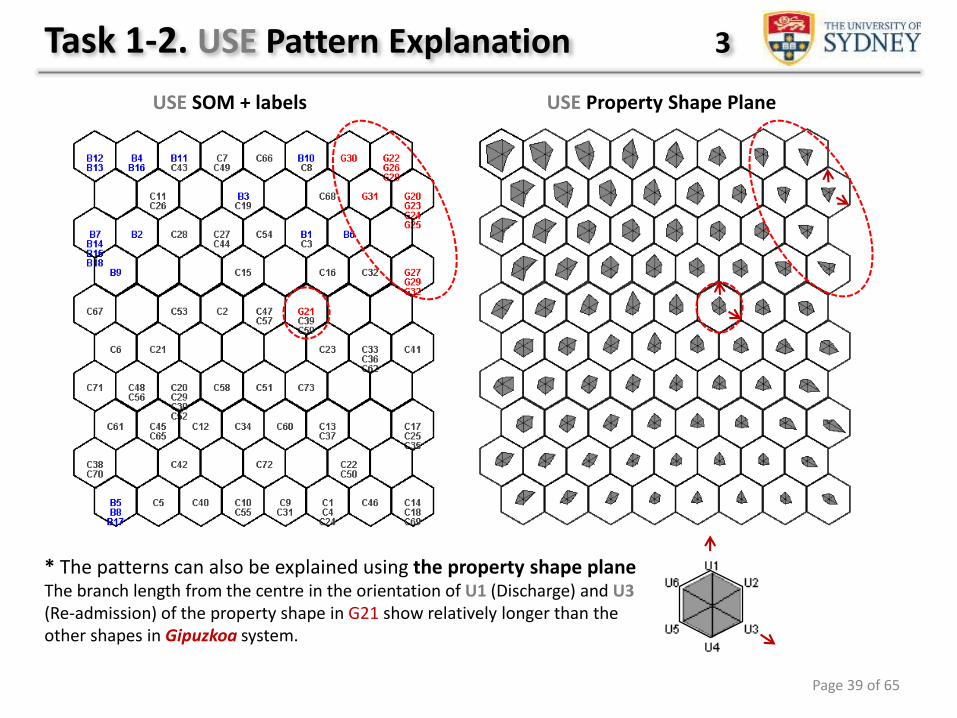
Task 1-2. USE Pattern Explanation 3
USE Property Shape Plane
* The patterns can also be explained using the property shape plane The branch length from the centre in the orientation of U1 (Discharge) and U3(Re-admission) of the property shape in G21 show relatively longer than the other shapes in Gipuzkoa system.
USE SOM + labels
Page 39 of 65
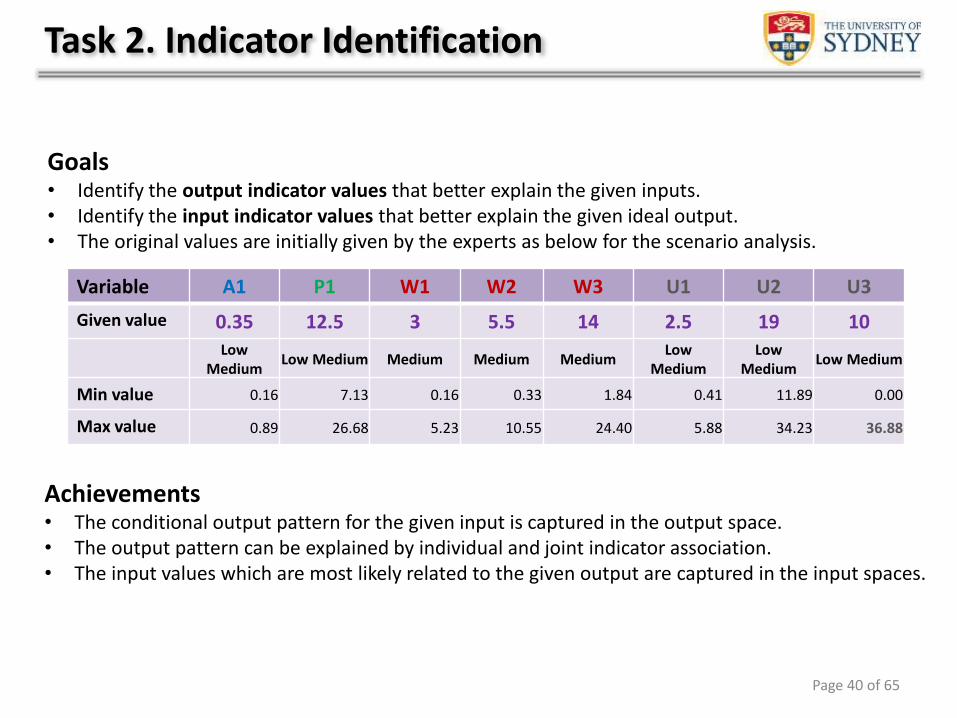
Variable A1 P1 W1 W2 W3 U1 U2 U3
Given value 0.35 12.5 3 5.5 14 2.5 19 10Low
MediumLow Medium Medium Medium Medium
Low Medium
Low Medium
Low Medium
Min value 0.16 7.13 0.16 0.33 1.84 0.41 11.89 0.00
Max value 0.89 26.68 5.23 10.55 24.40 5.88 34.23 36.88
Task 2. Indicator Identification
Goals• Identify the output indicator values that better explain the given inputs.• Identify the input indicator values that better explain the given ideal output.• The original values are initially given by the experts as below for the scenario analysis.
Achievements• The conditional output pattern for the given input is captured in the output space.• The output pattern can be explained by individual and joint indicator association. • The input values which are most likely related to the given output are captured in the input spaces.
Page 40 of 65
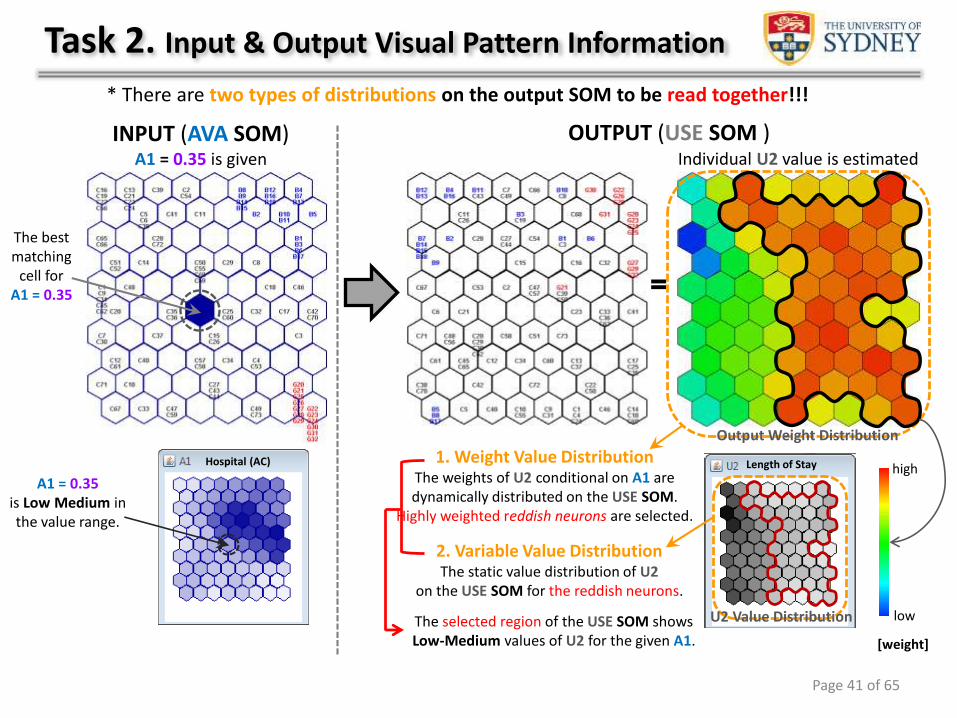
INPUT (AVA SOM) A1 = 0.35 is given
The best matching
cell for A1 = 0.35
OUTPUT (USE SOM )
1. Weight Value DistributionThe weights of U2 conditional on A1 are dynamically distributed on the USE SOM.
Highly weighted reddish neurons are selected.
A1 = 0.35is Low Medium in the value range.
2. Variable Value DistributionThe static value distribution of U2
on the USE SOM for the reddish neurons.
* There are two types of distributions on the output SOM to be read together!!!
The selected region of the USE SOM shows Low-Medium values of U2 for the given A1.
Hospital (AC)
Individual U2 value is estimated
Task 2. Input & Output Visual Pattern Information
Length of Stay high
low
[weight]
Output Weight Distribution
Page 41 of 65
U2 Value Distribution
Page 42 of 65
Estimation Procedure
• The input A1, P1, W1, W2 & W3 are given to estimate the patterns of U1, U2 & U3.
• The output USE SOM pattern for each of the given inputs is visualized.1. Read the weight distribution by reddish region2. Match the region in the value distributions of U1, U2 & U3 in the USE SOM.
• The computational results are also given based on the given value range.
• The weighted output patterns for all inputs are compared.
Task 2-1. Estimate Output for Given Input
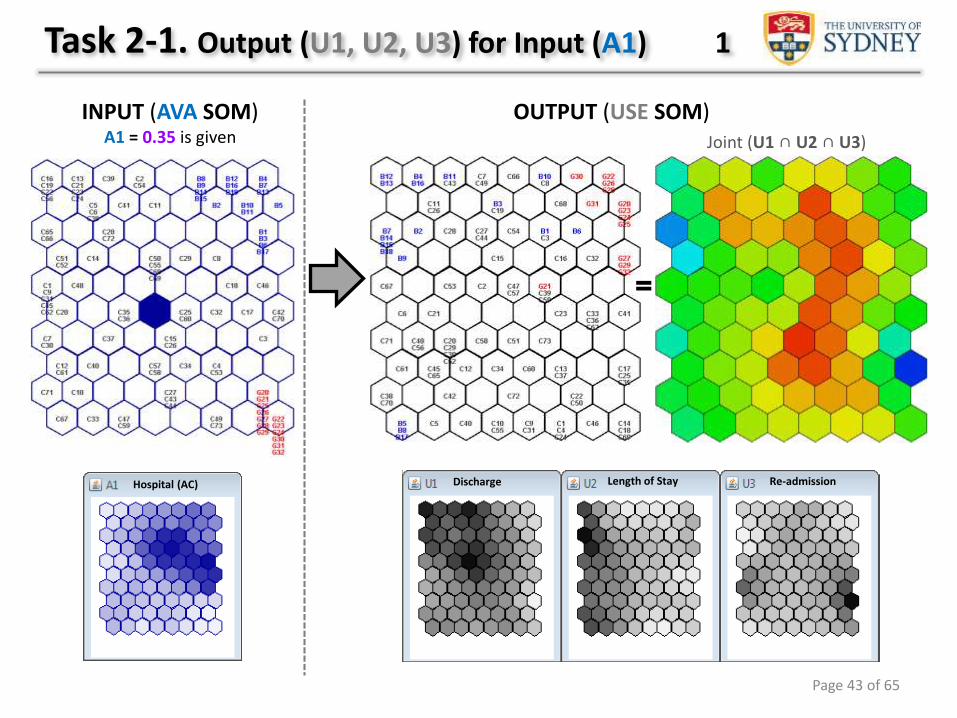
OUTPUT (USE SOM)
Task 2-1. Output (U1, U2, U3) for Input (A1) 1
Joint (U1 ∩ U2 ∩ U3)
Discharge Length of Stay Re-admission
INPUT (AVA SOM) A1 = 0.35 is given
Hospital (AC)
Page 43 of 65
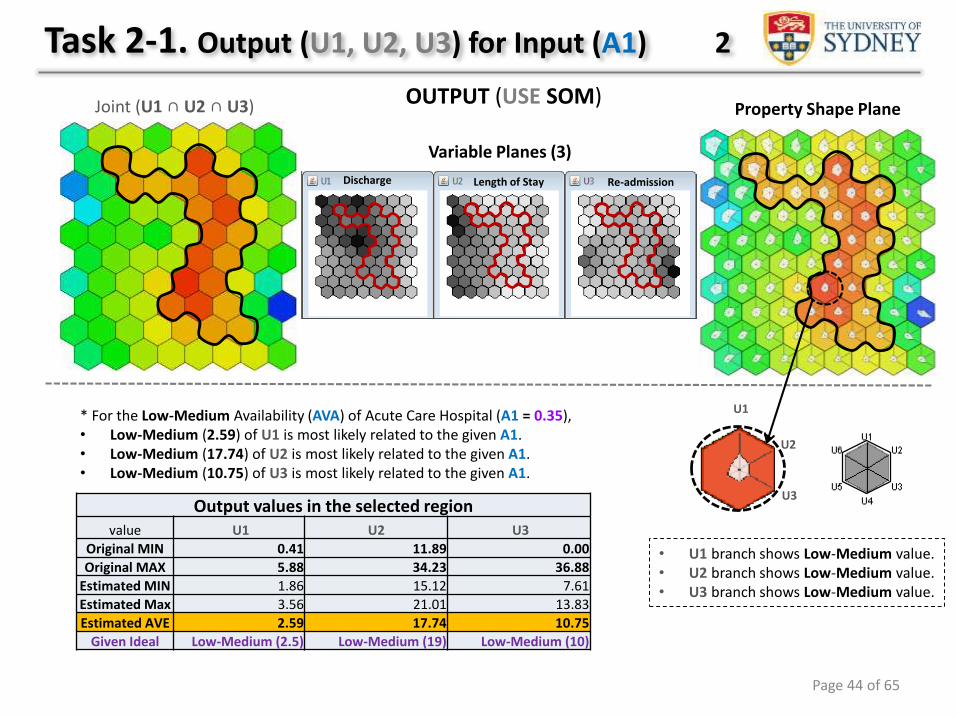
* For the Low-Medium Availability (AVA) of Acute Care Hospital (A1 = 0.35),• Low-Medium (2.59) of U1 is most likely related to the given A1.• Low-Medium (17.74) of U2 is most likely related to the given A1. • Low-Medium (10.75) of U3 is most likely related to the given A1.
OUTPUT (USE SOM)
Output values in the selected regionvalue U1 U2 U3
Original MIN 0.41 11.89 0.00
Original MAX 5.88 34.23 36.88
Estimated MIN 1.86 15.12 7.61
Estimated Max 3.56 21.01 13.83
Estimated AVE 2.59 17.74 10.75
Given Ideal Low-Medium (2.5) Low-Medium (19) Low-Medium (10)
Task 2-1. Output (U1, U2, U3) for Input (A1) 2
Joint (U1 ∩ U2 ∩ U3)
Discharge Length of Stay Re-admission
Variable Planes (3)
Property Shape Plane
• U1 branch shows Low-Medium value.• U2 branch shows Low-Medium value.• U3 branch shows Low-Medium value.
U1
U2
U3
Page 44 of 65
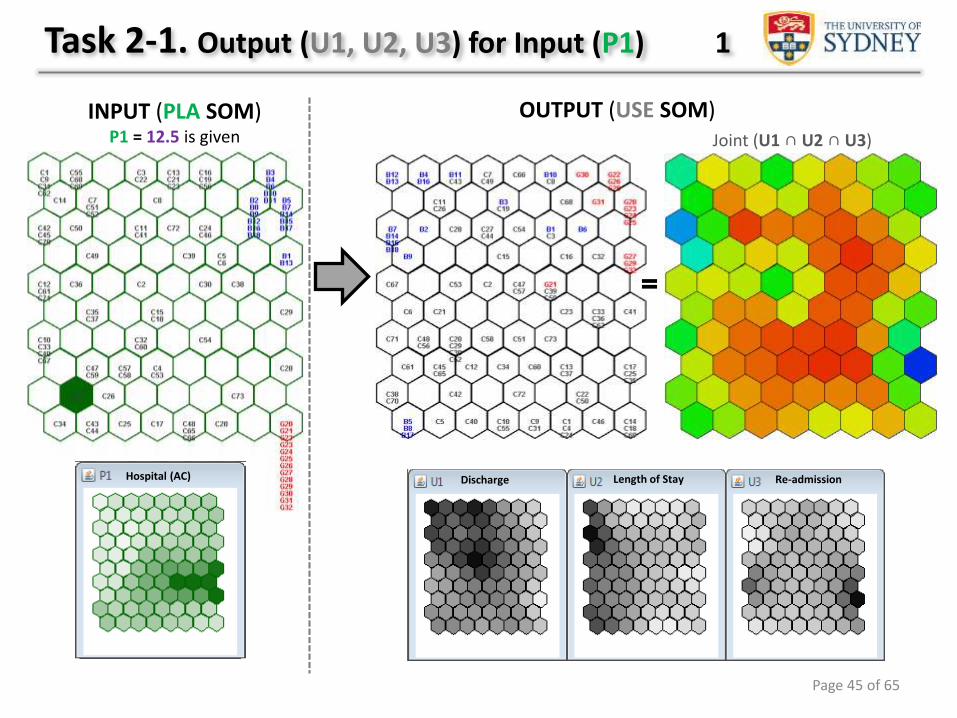
OUTPUT (USE SOM)Joint (U1 ∩ U2 ∩ U3)
Discharge Length of Stay Re-admission
INPUT (PLA SOM) P1 = 12.5 is given
Task 2-1. Output (U1, U2, U3) for Input (P1) 1
Hospital (AC)
Page 45 of 65
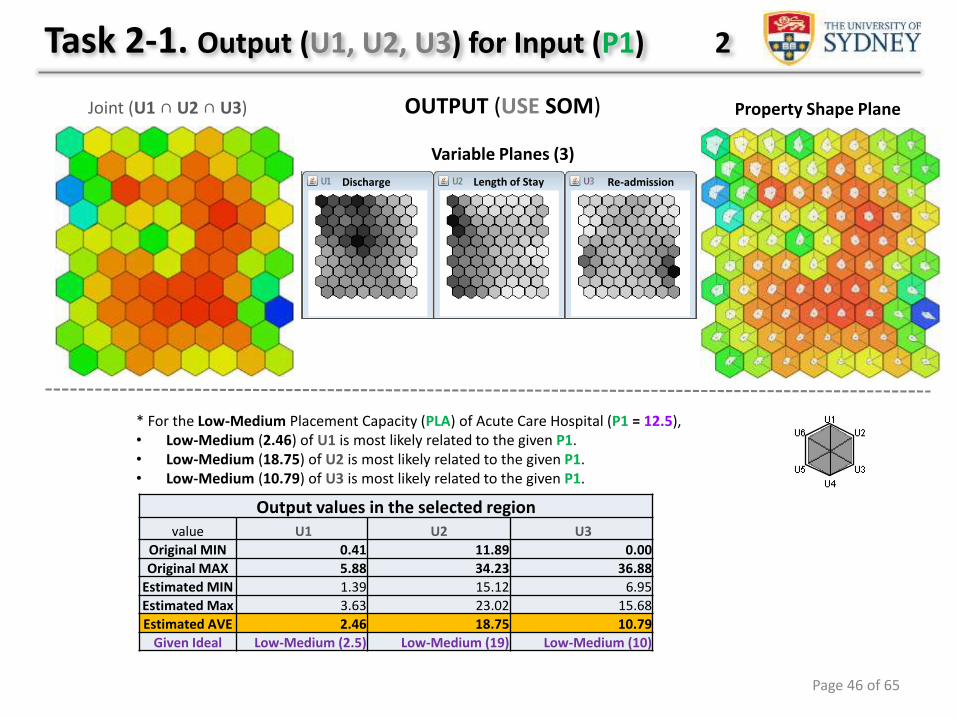
* For the Low-Medium Placement Capacity (PLA) of Acute Care Hospital (P1 = 12.5),• Low-Medium (2.46) of U1 is most likely related to the given P1.• Low-Medium (18.75) of U2 is most likely related to the given P1. • Low-Medium (10.79) of U3 is most likely related to the given P1.
OUTPUT (USE SOM)
Output values in the selected regionvalue U1 U2 U3
Original MIN 0.41 11.89 0.00
Original MAX 5.88 34.23 36.88
Estimated MIN 1.39 15.12 6.95
Estimated Max 3.63 23.02 15.68
Estimated AVE 2.46 18.75 10.79
Given Ideal Low-Medium (2.5) Low-Medium (19) Low-Medium (10)
Task 2-1. Output (U1, U2, U3) for Input (P1) 2
Joint (U1 ∩ U2 ∩ U3)
Discharge Length of Stay Re-admission
Variable Planes (3)
Property Shape Plane
Page 46 of 65
OUTPUT (USE SOM)Joint (U1 ∩ U2 ∩ U3)
Discharge Length of Stay Re-admission
Output Weight Distribution
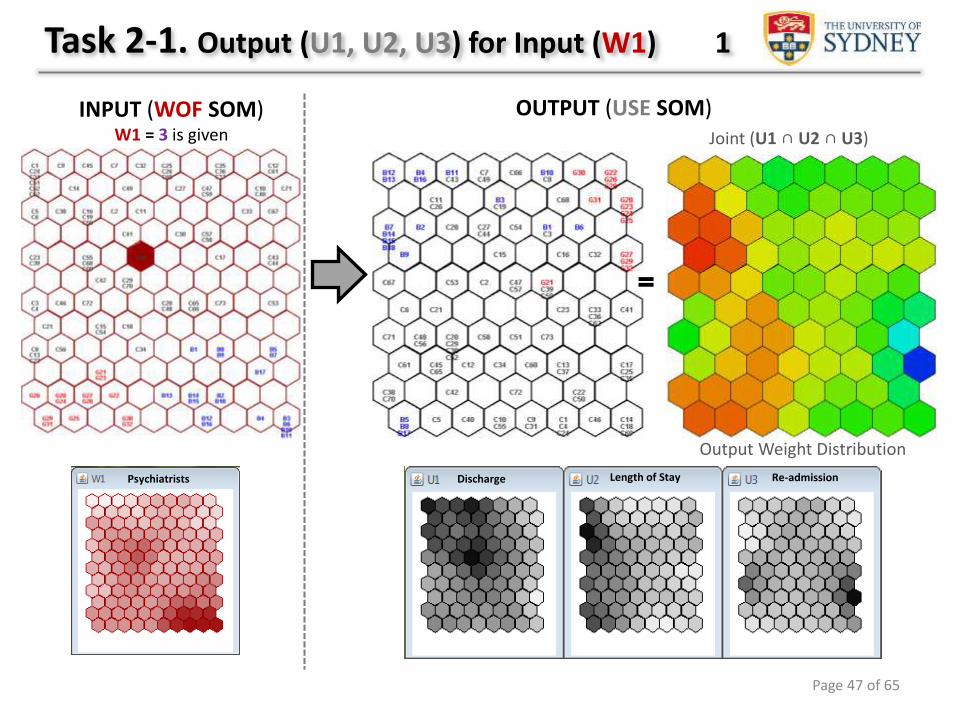
INPUT (WOF SOM) W1 = 3 is given
Task 2-1. Output (U1, U2, U3) for Input (W1) 1
Psychiatrists
Page 47 of 65
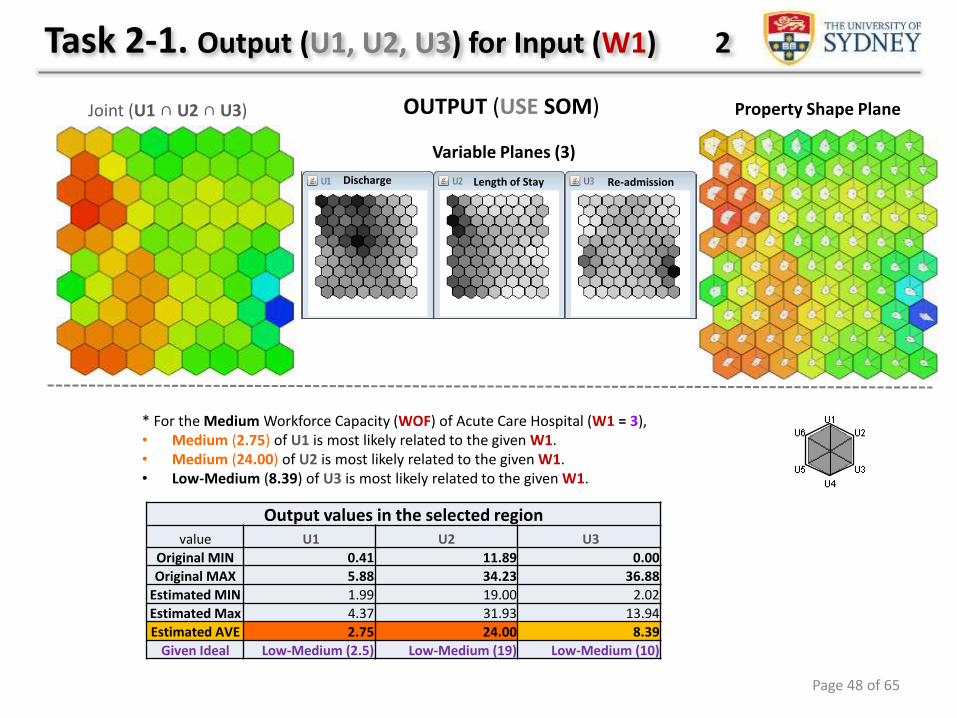
* For the Medium Workforce Capacity (WOF) of Acute Care Hospital (W1 = 3),• Medium (2.75) of U1 is most likely related to the given W1.• Medium (24.00) of U2 is most likely related to the given W1. • Low-Medium (8.39) of U3 is most likely related to the given W1.
OUTPUT (USE SOM)
Output values in the selected regionvalue U1 U2 U3
Original MIN 0.41 11.89 0.00
Original MAX 5.88 34.23 36.88
Estimated MIN 1.99 19.00 2.02
Estimated Max 4.37 31.93 13.94
Estimated AVE 2.75 24.00 8.39
Given Ideal Low-Medium (2.5) Low-Medium (19) Low-Medium (10)
Task 2-1. Output (U1, U2, U3) for Input (W1) 2
Joint (U1 ∩ U2 ∩ U3)
Discharge Length of Stay Re-admission
Variable Planes (3)
Property Shape Plane
Page 48 of 65
OUTPUT (USE SOM)Joint (U1 ∩ U2 ∩ U3)
Discharge Length of Stay Re-admission
Output Weight Distribution
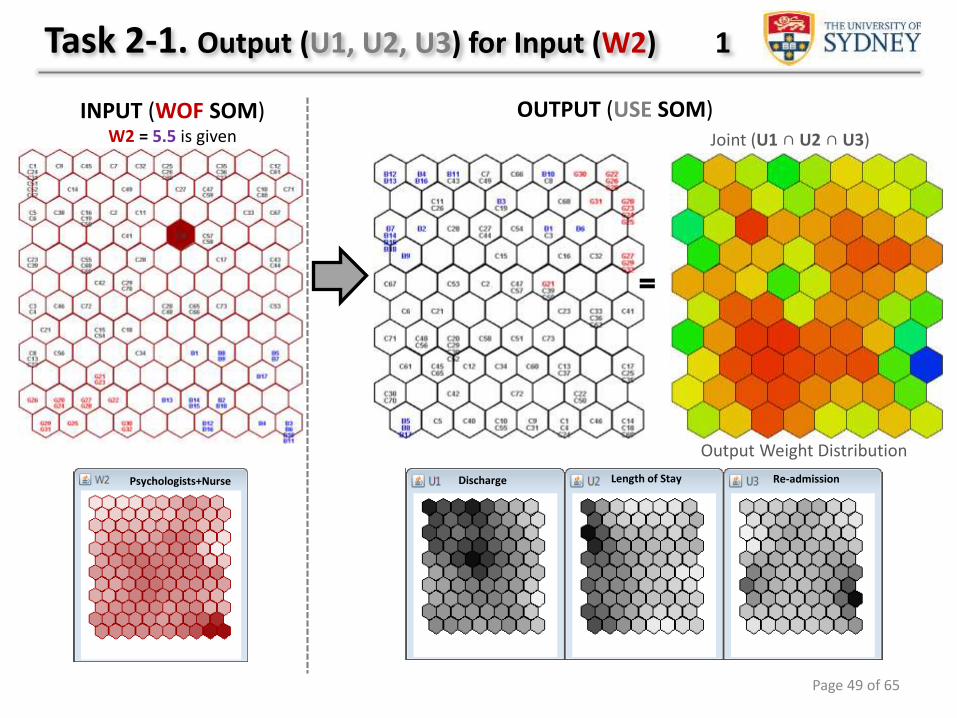
INPUT (WOF SOM) W2 = 5.5 is given
Task 2-1. Output (U1, U2, U3) for Input (W2) 1
Psychologists+Nurse
Page 49 of 65
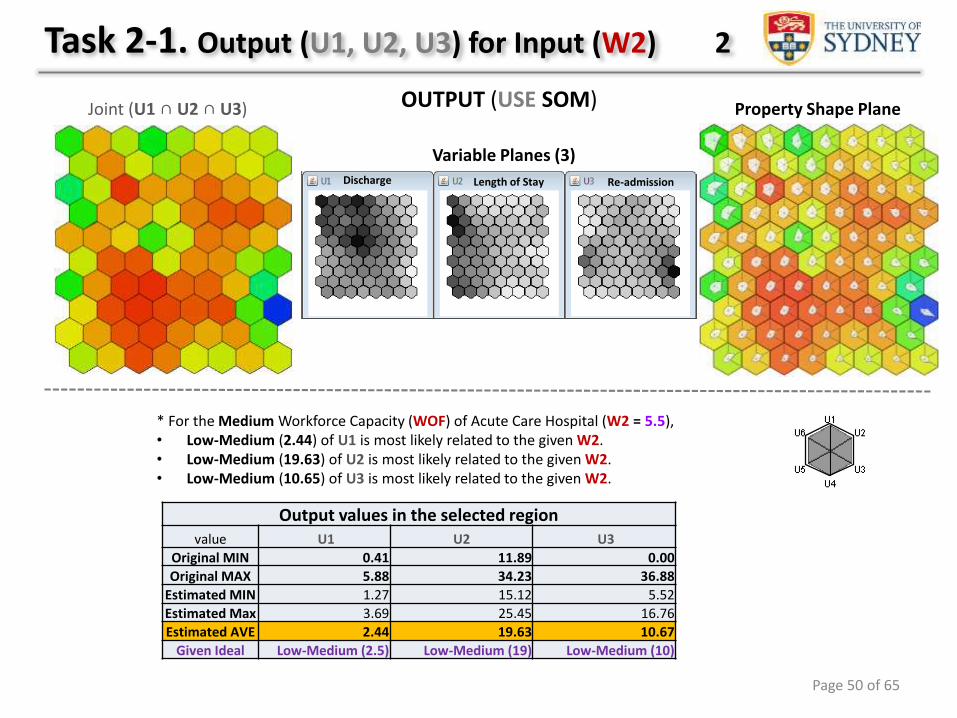
* For the Medium Workforce Capacity (WOF) of Acute Care Hospital (W2 = 5.5),• Low-Medium (2.44) of U1 is most likely related to the given W2.• Low-Medium (19.63) of U2 is most likely related to the given W2. • Low-Medium (10.65) of U3 is most likely related to the given W2.
OUTPUT (USE SOM)
Output values in the selected regionvalue U1 U2 U3
Original MIN 0.41 11.89 0.00
Original MAX 5.88 34.23 36.88
Estimated MIN 1.27 15.12 5.52
Estimated Max 3.69 25.45 16.76
Estimated AVE 2.44 19.63 10.67
Given Ideal Low-Medium (2.5) Low-Medium (19) Low-Medium (10)
Task 2-1. Output (U1, U2, U3) for Input (W2) 2
Joint (U1 ∩ U2 ∩ U3)
Discharge Length of Stay Re-admission
Variable Planes (3)
Property Shape Plane
Page 50 of 65
OUTPUT (USE SOM)Joint (U1 ∩ U2 ∩ U3)
Discharge Length of Stay Re-admission
Output Weight Distribution
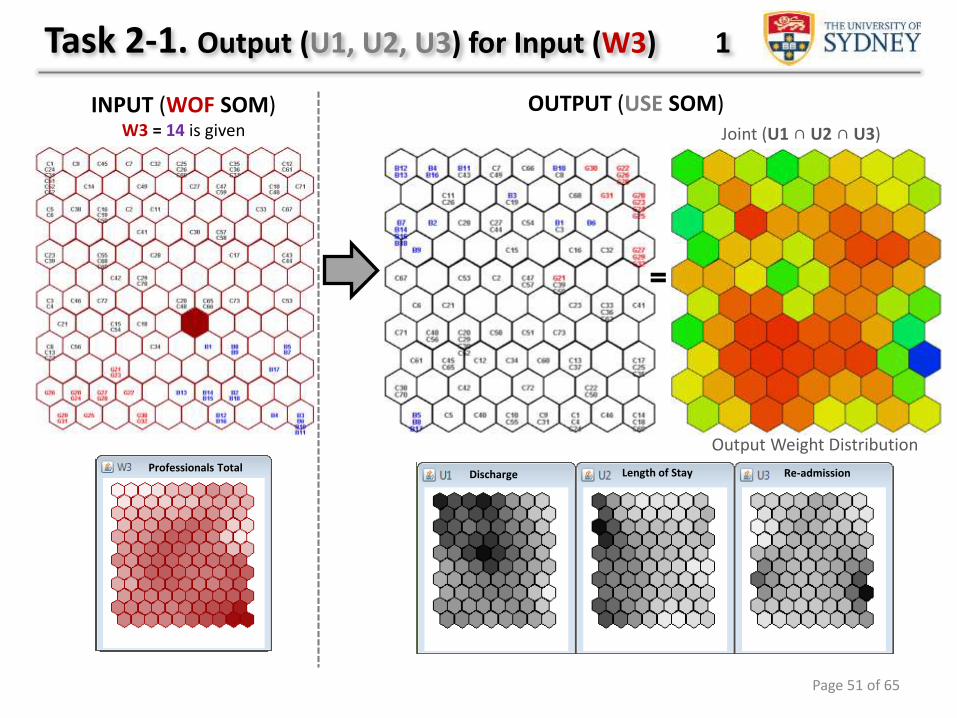
INPUT (WOF SOM) W3 = 14 is given
Task 2-1. Output (U1, U2, U3) for Input (W3) 1
Professionals Total
Page 51 of 65
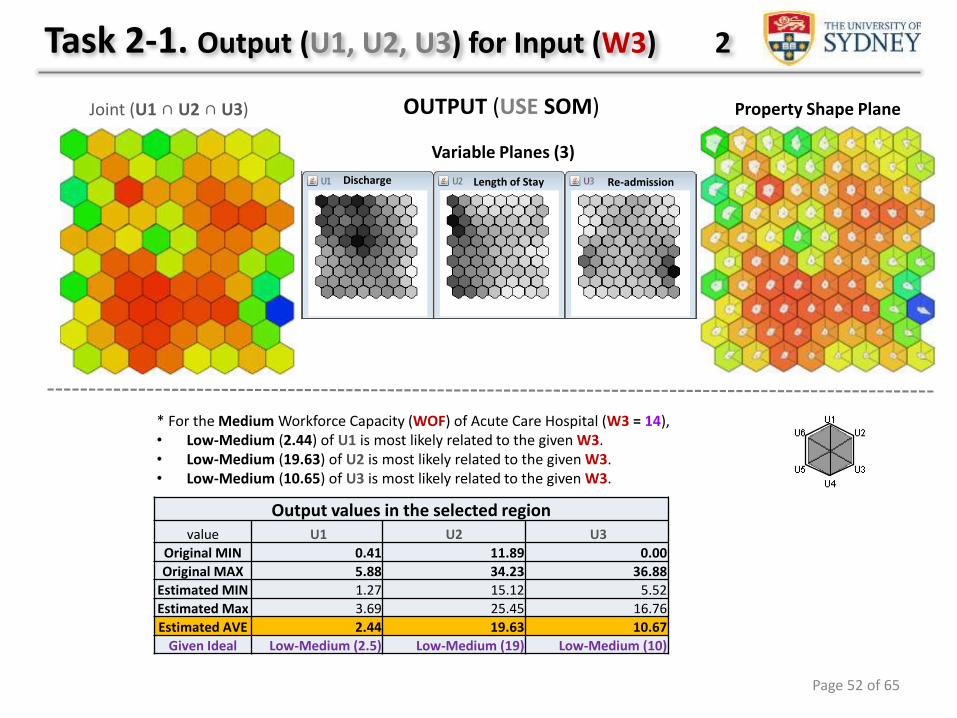
* For the Medium Workforce Capacity (WOF) of Acute Care Hospital (W3 = 14),• Low-Medium (2.44) of U1 is most likely related to the given W3.• Low-Medium (19.63) of U2 is most likely related to the given W3. • Low-Medium (10.65) of U3 is most likely related to the given W3.
OUTPUT (USE SOM)
Output values in the selected regionvalue U1 U2 U3
Original MIN 0.41 11.89 0.00
Original MAX 5.88 34.23 36.88
Estimated MIN 1.27 15.12 5.52
Estimated Max 3.69 25.45 16.76
Estimated AVE 2.44 19.63 10.67
Given Ideal Low-Medium (2.5) Low-Medium (19) Low-Medium (10)
Task 2-1. Output (U1, U2, U3) for Input (W3) 2
Joint (U1 ∩ U2 ∩ U3)
Discharge Length of Stay Re-admission
Variable Planes (3)
Property Shape Plane
Page 52 of 65
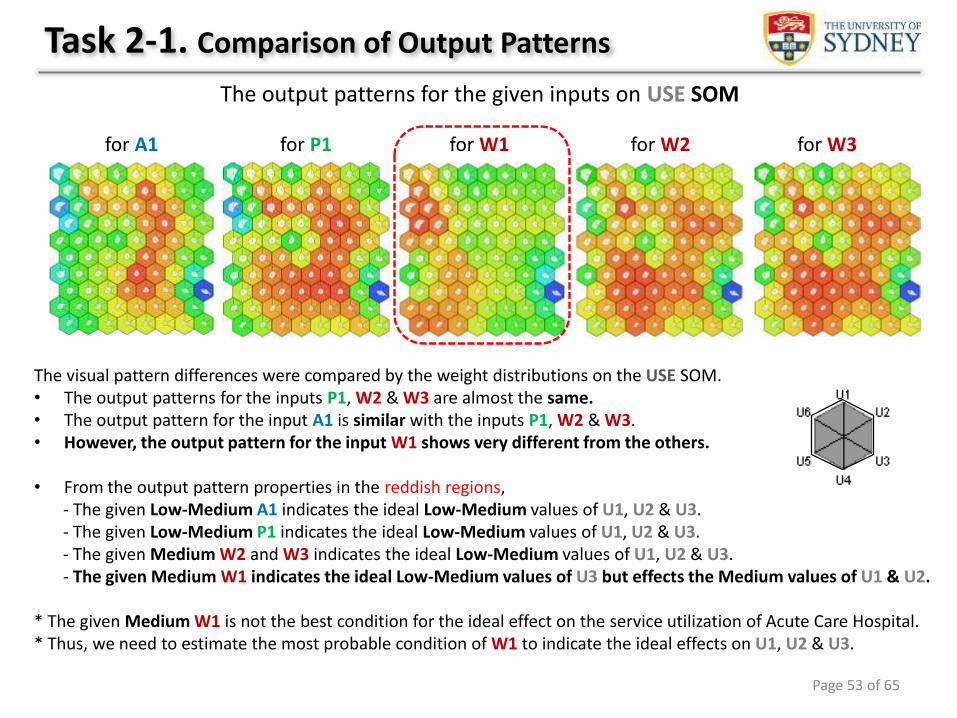
Task 2-1. Comparison of Output Patterns
The output patterns for the given inputs on USE SOM
for A1 for P1 for W1 for W2 for W3
The visual pattern differences were compared by the weight distributions on the USE SOM.• The output patterns for the inputs P1, W2 & W3 are almost the same.• The output pattern for the input A1 is similar with the inputs P1, W2 & W3. • However, the output pattern for the input W1 shows very different from the others.
• From the output pattern properties in the reddish regions, - The given Low-Medium A1 indicates the ideal Low-Medium values of U1, U2 & U3.- The given Low-Medium P1 indicates the ideal Low-Medium values of U1, U2 & U3.- The given Medium W2 and W3 indicates the ideal Low-Medium values of U1, U2 & U3.- The given Medium W1 indicates the ideal Low-Medium values of U3 but effects the Medium values of U1 & U2.
* The given Medium W1 is not the best condition for the ideal effect on the service utilization of Acute Care Hospital.* Thus, we need to estimate the most probable condition of W1 to indicate the ideal effects on U1, U2 & U3.
Page 53 of 65
Page 54 of 65
Estimation Procedure
The reverse association between input and output SOMs can allow estimating the most probable value of W1 related to the ideal output (U1, U2 & U3).
• The ideal values of U1, U2 & U3 are given to estimate the most related value of W1 .
• The input WOF SOM pattern for each of the given outputs is visualized.1. Read the weight distribution by reddish region 2. Match the region in the value distribution of W1 in the WOF SOM.
• The computational results are also given based on the given value range.
• The weighted input patterns for all outputs are compared.
Task 2-2. Estimate Input for Ideal Output
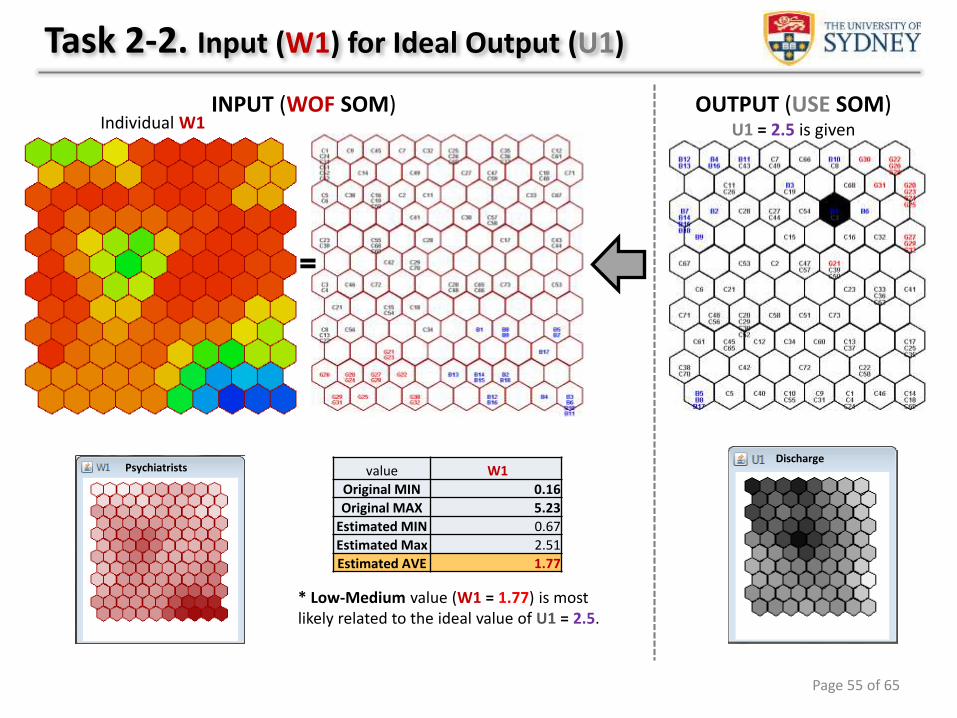
Task 2-2. Input (W1) for Ideal Output (U1)
OUTPUT (USE SOM)U1 = 2.5 is given
INPUT (WOF SOM)
DischargePsychiatrists value W1
Original MIN 0.16
Original MAX 5.23
Estimated MIN 0.67
Estimated Max 2.51
Estimated AVE 1.77
* Low-Medium value (W1 = 1.77) is most likely related to the ideal value of U1 = 2.5.
Individual W1
Page 55 of 65
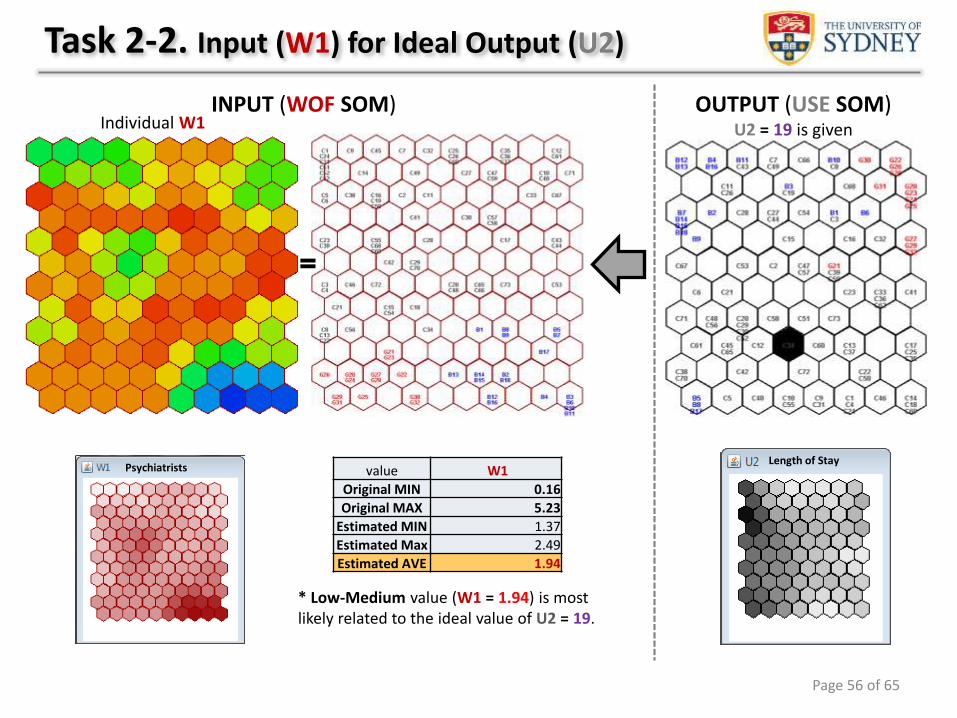
Task 2-2. Input (W1) for Ideal Output (U2)
OUTPUT (USE SOM)U2 = 19 is given
INPUT (WOF SOM)
Psychiatrists value W1
Original MIN 0.16
Original MAX 5.23
Estimated MIN 1.37
Estimated Max 2.49
Estimated AVE 1.94
* Low-Medium value (W1 = 1.94) is most likely related to the ideal value of U2 = 19.
Individual W1
Length of Stay
Page 56 of 65
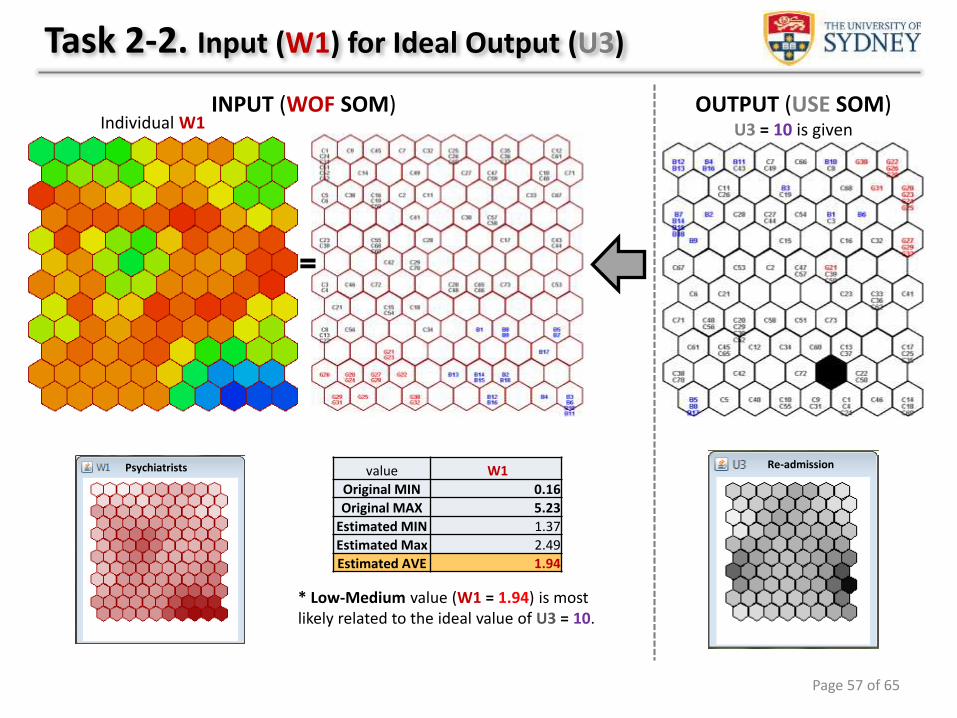
Task 2-2. Input (W1) for Ideal Output (U3)
OUTPUT (USE SOM)U3 = 10 is given
INPUT (WOF SOM)
Psychiatrists value W1
Original MIN 0.16
Original MAX 5.23
Estimated MIN 1.37
Estimated Max 2.49
Estimated AVE 1.94
* Low-Medium value (W1 = 1.94) is most likely related to the ideal value of U3 = 10.
Individual W1
Re-admission
Page 57 of 65
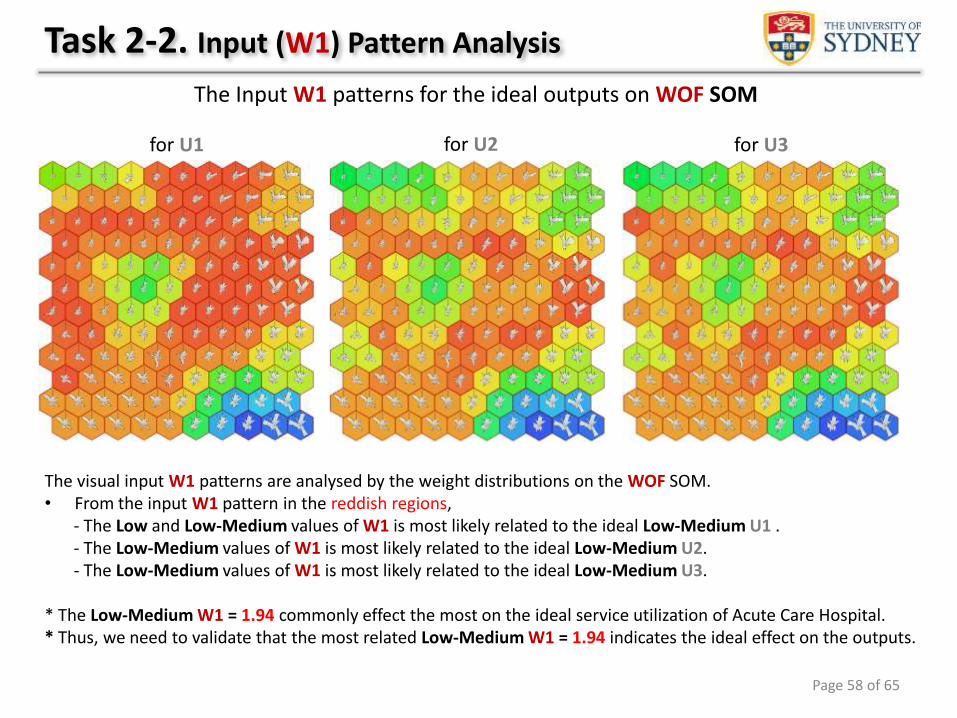
Task 2-2. Input (W1) Pattern Analysis
The Input W1 patterns for the ideal outputs on WOF SOM
for U1 for U2 for U3
The visual input W1 patterns are analysed by the weight distributions on the WOF SOM.• From the input W1 pattern in the reddish regions,
- The Low and Low-Medium values of W1 is most likely related to the ideal Low-Medium U1 .- The Low-Medium values of W1 is most likely related to the ideal Low-Medium U2.- The Low-Medium values of W1 is most likely related to the ideal Low-Medium U3.
* The Low-Medium W1 = 1.94 commonly effect the most on the ideal service utilization of Acute Care Hospital.* Thus, we need to validate that the most related Low-Medium W1 = 1.94 indicates the ideal effect on the outputs.
Page 58 of 65
Page 59 of 65
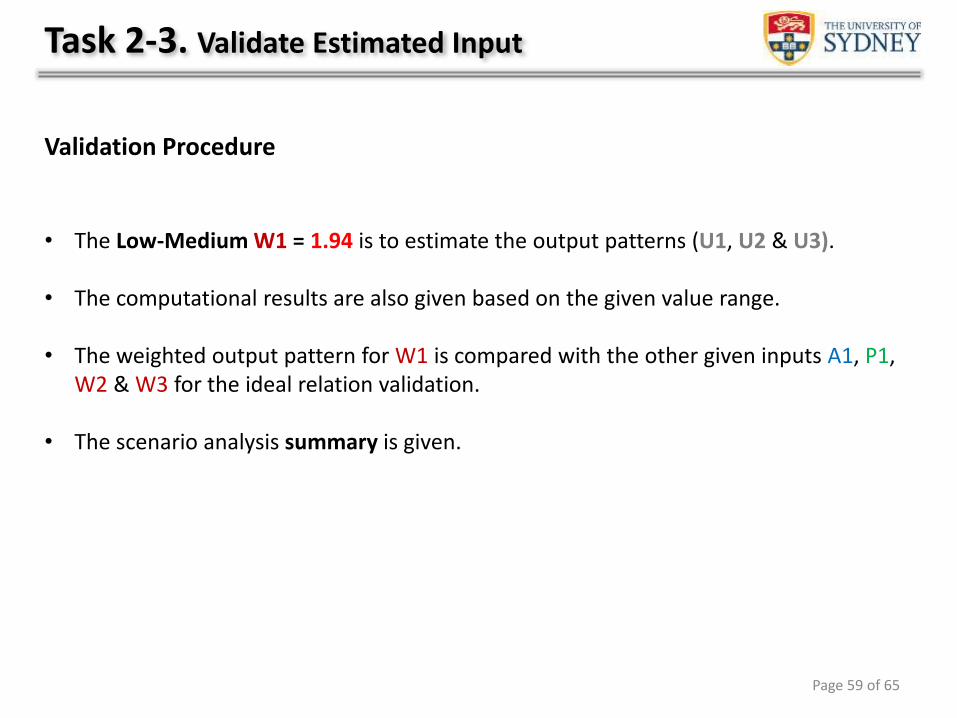
Validation Procedure
• The Low-Medium W1 = 1.94 is to estimate the output patterns (U1, U2 & U3).
• The computational results are also given based on the given value range.
• The weighted output pattern for W1 is compared with the other given inputs A1, P1, W2 & W3 for the ideal relation validation.
• The scenario analysis summary is given.
Task 2-3. Validate Estimated Input
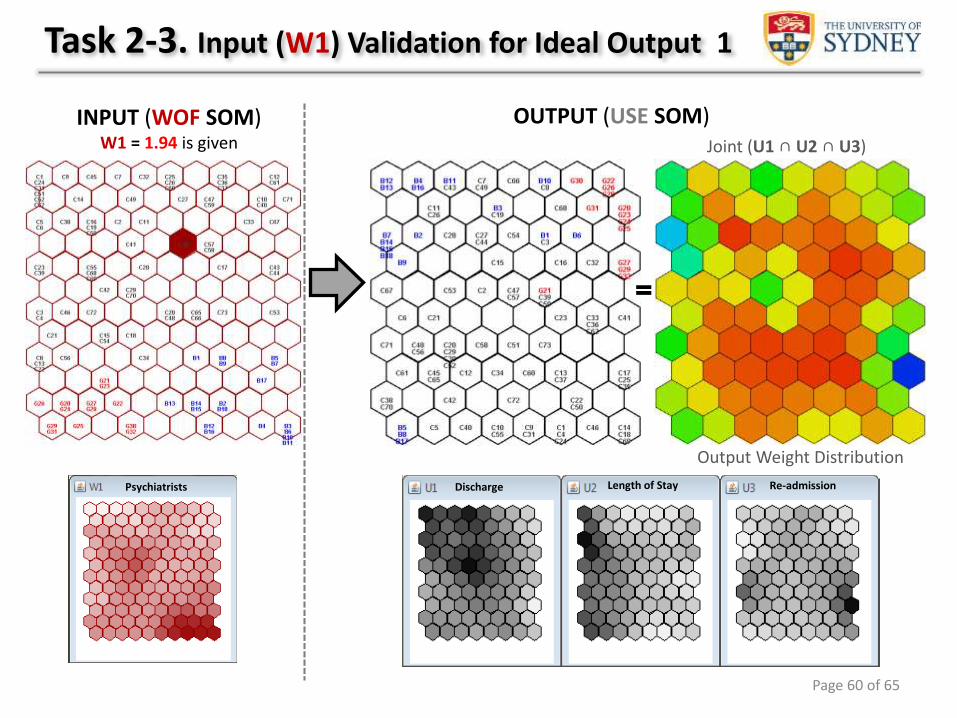
OUTPUT (USE SOM)Joint (U1 ∩ U2 ∩ U3)
Discharge Length of Stay Re-admission
Output Weight Distribution
INPUT (WOF SOM) W1 = 1.94 is given
Task 2-3. Input (W1) Validation for Ideal Output 1
Psychiatrists
Page 60 of 65
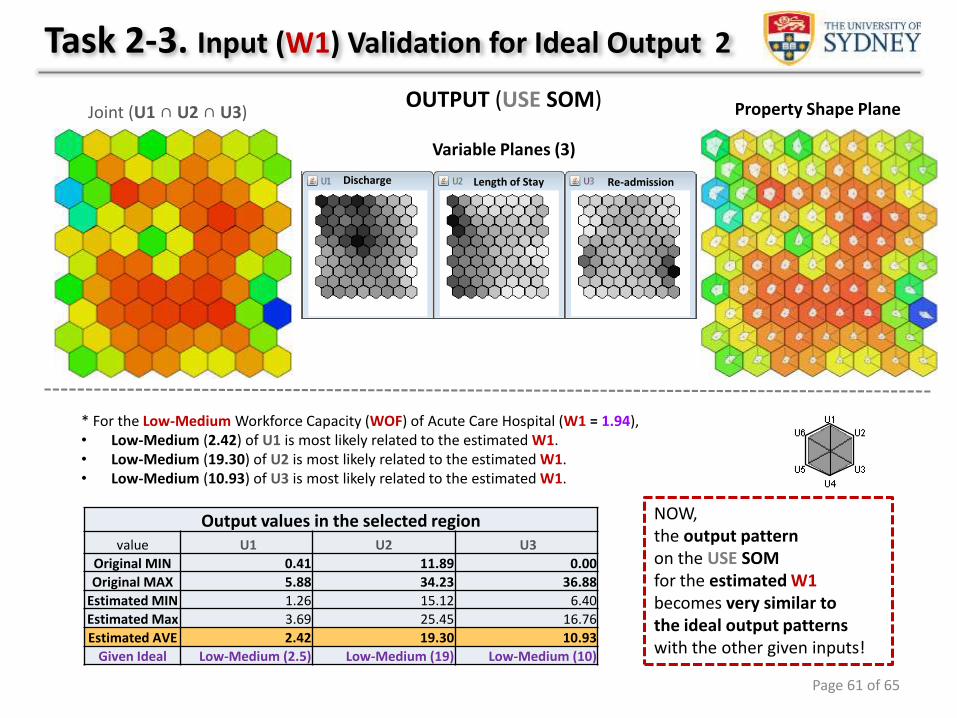
* For the Low-Medium Workforce Capacity (WOF) of Acute Care Hospital (W1 = 1.94),• Low-Medium (2.42) of U1 is most likely related to the estimated W1.• Low-Medium (19.30) of U2 is most likely related to the estimated W1. • Low-Medium (10.93) of U3 is most likely related to the estimated W1.
OUTPUT (USE SOM)
Output values in the selected regionvalue U1 U2 U3
Original MIN 0.41 11.89 0.00
Original MAX 5.88 34.23 36.88
Estimated MIN 1.26 15.12 6.40
Estimated Max 3.69 25.45 16.76
Estimated AVE 2.42 19.30 10.93
Given Ideal Low-Medium (2.5) Low-Medium (19) Low-Medium (10)
Joint (U1 ∩ U2 ∩ U3)
Discharge Length of Stay Re-admission
Variable Planes (3)
Property Shape Plane
Task 2-3. Input (W1) Validation for Ideal Output 2
Page 61 of 65
NOW, the output patternon the USE SOM for the estimated W1becomes very similar to the ideal output patterns with the other given inputs!
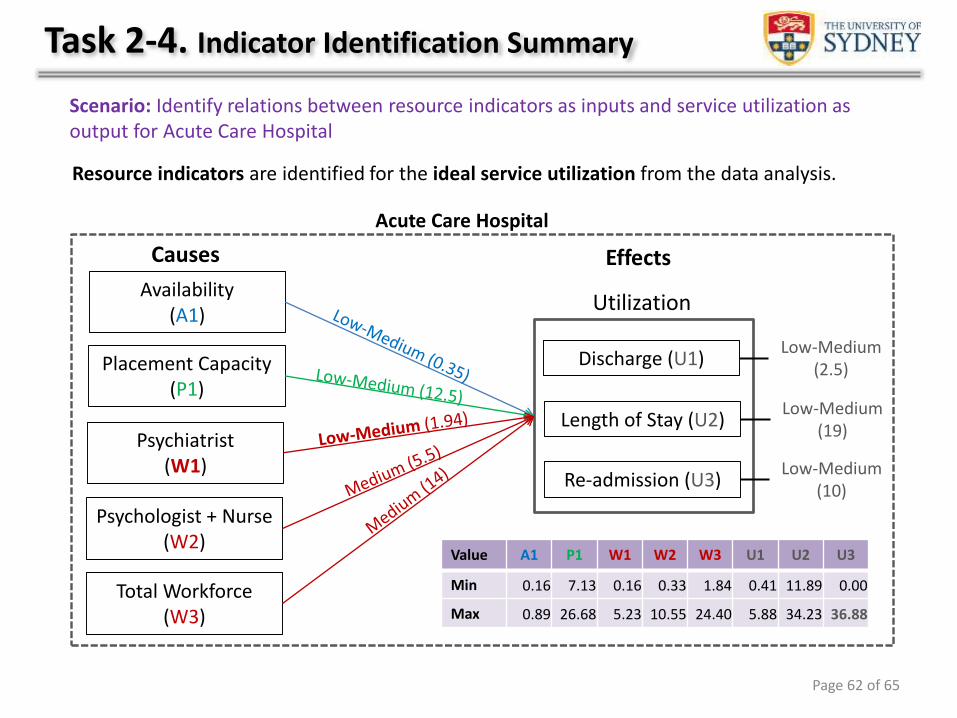
Resource indicators are identified for the ideal service utilization from the data analysis.
Availability (A1)
Placement Capacity (P1)
Psychiatrist (W1)
Psychologist + Nurse (W2)
Total Workforce (W3)
Discharge (U1)
Length of Stay (U2)
Re-admission (U3)
Low-Medium(2.5)
Utilization
Low-Medium(19)
Low-Medium(10)
Causes Effects
Task 2-4. Indicator Identification Summary
Scenario: Identify relations between resource indicators as inputs and service utilization as output for Acute Care Hospital
Acute Care Hospital
Value A1 P1 W1 W2 W3 U1 U2 U3
Min 0.16 7.13 0.16 0.33 1.84 0.41 11.89 0.00
Max 0.89 26.68 5.23 10.55 24.40 5.88 34.23 36.88
Page 62 of 65
Task 3. Analytical Interpretation
Goals• Provide the analytical results for the decision makers to derive reasonable interpretation.• Discover tacit knowledge for improving evidence-informed decision making.
Achievements• The identified indicator information is provided from the data analysis for the given scenario.• The input condition is interpreted and implicit knowledge is discovered for the ideal outputs.• The relevant conclusion can be derived to guide the MH policy planners.
Page 63 of 65
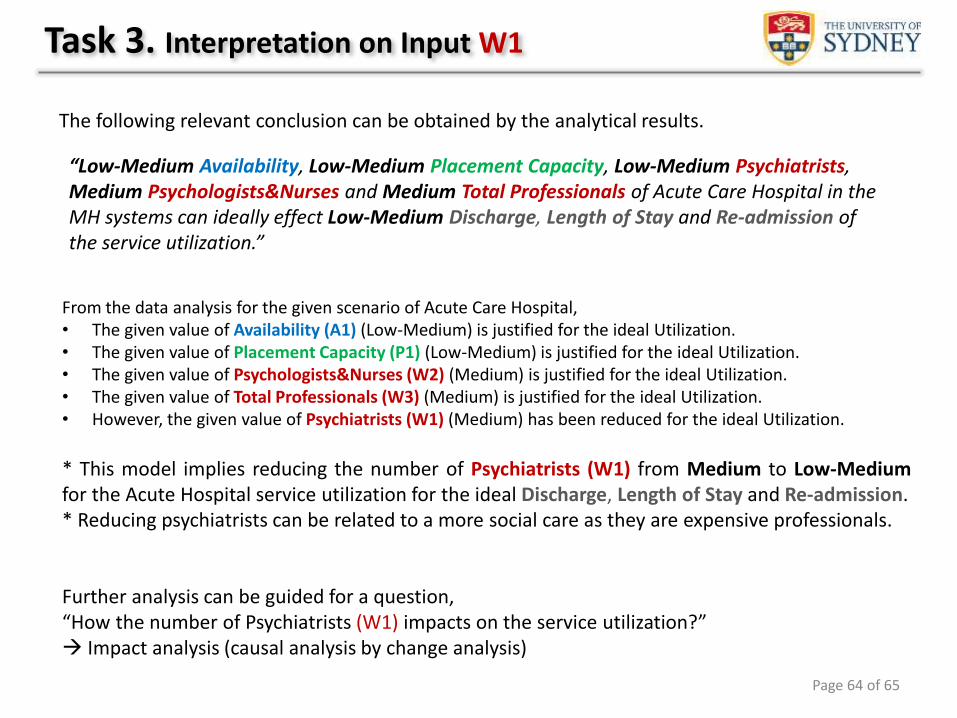
Task 3. Interpretation on Input W1
“Low-Medium Availability, Low-Medium Placement Capacity, Low-Medium Psychiatrists,Medium Psychologists&Nurses and Medium Total Professionals of Acute Care Hospital in the MH systems can ideally effect Low-Medium Discharge, Length of Stay and Re-admission of the service utilization.”
The following relevant conclusion can be obtained by the analytical results.
From the data analysis for the given scenario of Acute Care Hospital,• The given value of Availability (A1) (Low-Medium) is justified for the ideal Utilization.• The given value of Placement Capacity (P1) (Low-Medium) is justified for the ideal Utilization.• The given value of Psychologists&Nurses (W2) (Medium) is justified for the ideal Utilization.• The given value of Total Professionals (W3) (Medium) is justified for the ideal Utilization.• However, the given value of Psychiatrists (W1) (Medium) has been reduced for the ideal Utilization.
* This model implies reducing the number of Psychiatrists (W1) from Medium to Low-Mediumfor the Acute Hospital service utilization for the ideal Discharge, Length of Stay and Re-admission.* Reducing psychiatrists can be related to a more social care as they are expensive professionals.
Further analysis can be guided for a question,“How the number of Psychiatrists (W1) impacts on the service utilization?” Impact analysis (causal analysis by change analysis)
Page 64 of 65
Summary of the SOMNet application
Page 65 of 65
1. Pattern Identification• The global patterns of the regional MH systems (Bizkaia, Gipuzkoa and Calanoia systems) are identified by
visualizing the MH service area distribution in the systems on each SOM.• The local relations of small MH service areas within a system are identified and understood by observing the
difference of property shapes in the cells of the SOM. • The meaningful clusters and characteristics are identified based on the similarity of property shapes.
2. Pattern Explanation• The variables and their characteristics which explain the patterns are clearly captured using the variable planes
or property shape plane of the SOM.• The outliers could be captured by inspecting the variable value distributions of the SOM.
3. Indicator Identification• The input and output are associated by the weight distribution of their connection similarity in the data space.• The output patterns of the service utilization for the given inputs (service availability, placement capacity and
workforce capacity) are captured by exploring the highly weighted regions on the output SOM.• The input values which are most likely related to the ideal output are estimated and the input indicators are
identified by the reverse association.
4. Analytical Interpretation• The relevant conclusion on the analytical results can be derived to guide the mental health policy planners. • Decision making support is feasible based on the evidence-based information provided by the SOMNet model.