Embed Size (px)
Citation preview
Using Six Sigma to Determine
Risk Management Focus
Joyce Zerkich, CPHIMS, MBA, PMP
Project Manager/Scrum Master, RelWare
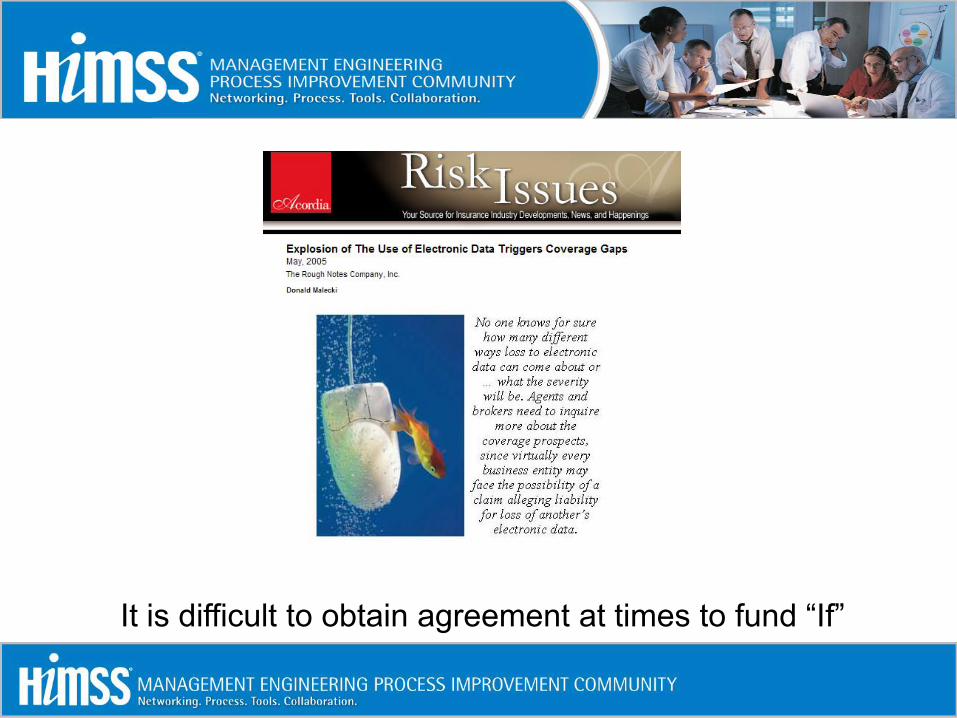
It is difficult to obtain agreement at times to fund “If”
Topic Focus
This session will present a
brief overview of
using Six Sigma
to formulate a Risk Management Plan
you can explain to others
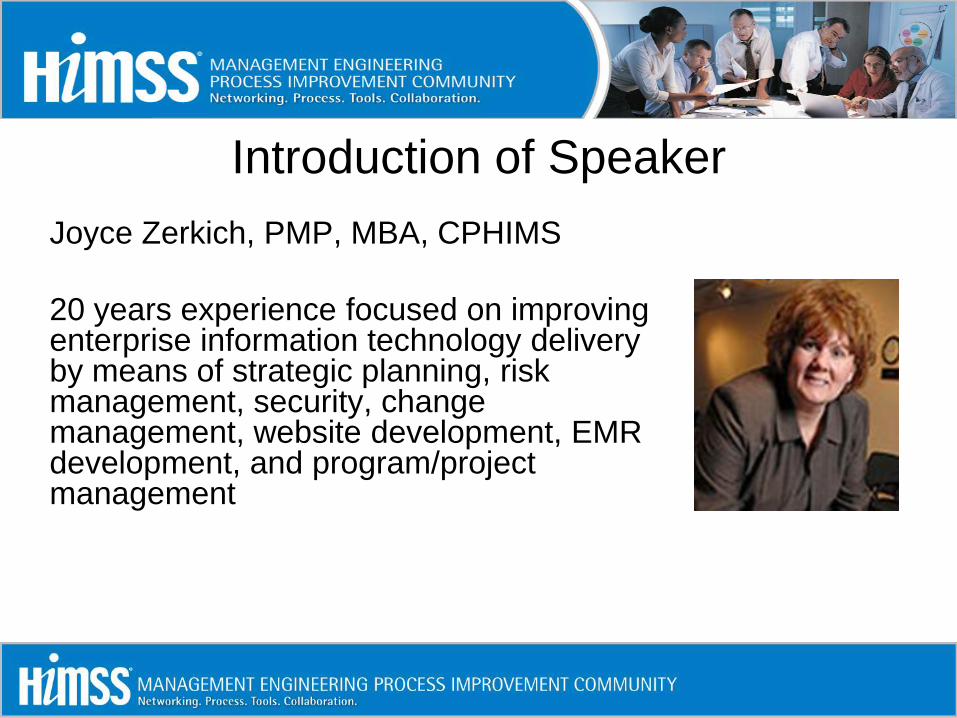
Introduction of Speaker
Joyce Zerkich, PMP, MBA, CPHIMS
20 years experience focused on improving enterprise information technology delivery by means of strategic planning, risk management, security, change management, website development, EMR development, and program/project management

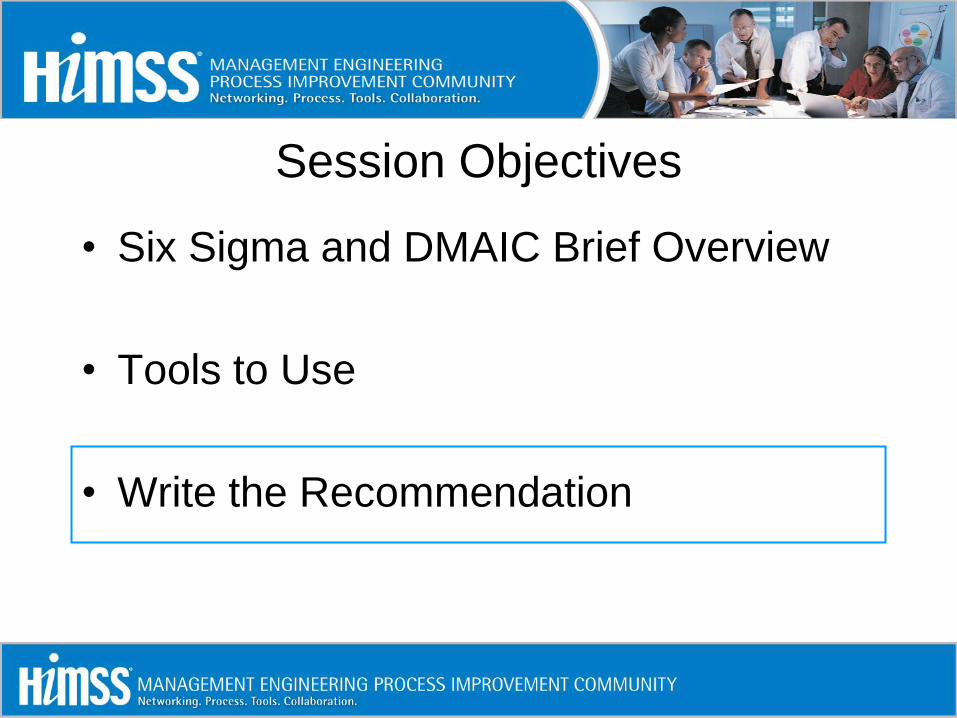
Session Objectives
• Six Sigma and DMAIC Brief Overview
• Tools to Use
• Write the Recommendation
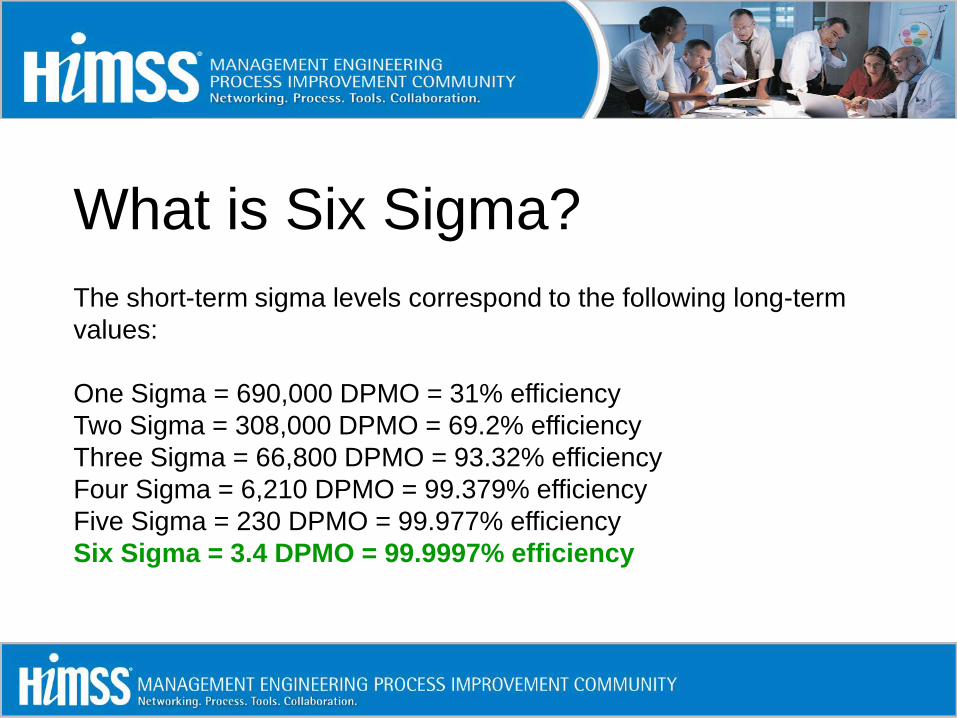
What is Six Sigma?
The short-term sigma levels correspond to the following long-term
values:
One Sigma = 690,000 DPMO = 31% efficiency
Two Sigma = 308,000 DPMO = 69.2% efficiency
Three Sigma = 66,800 DPMO = 93.32% efficiency
Four Sigma = 6,210 DPMO = 99.379% efficiency
Five Sigma = 230 DPMO = 99.977% efficiency
Six Sigma = 3.4 DPMO = 99.9997% efficiency
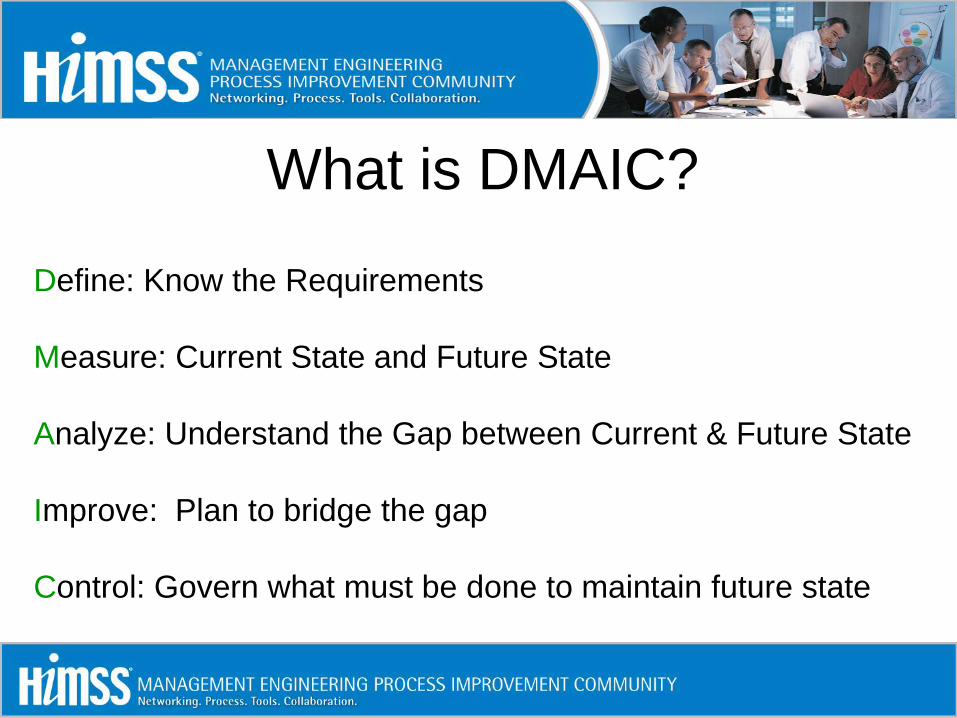
What is DMAIC?
Define: Know the Requirements
Measure: Current State and Future State
Analyze: Understand the Gap between Current & Future State
Improve: Plan to bridge the gap
Control: Govern what must be done to maintain future state
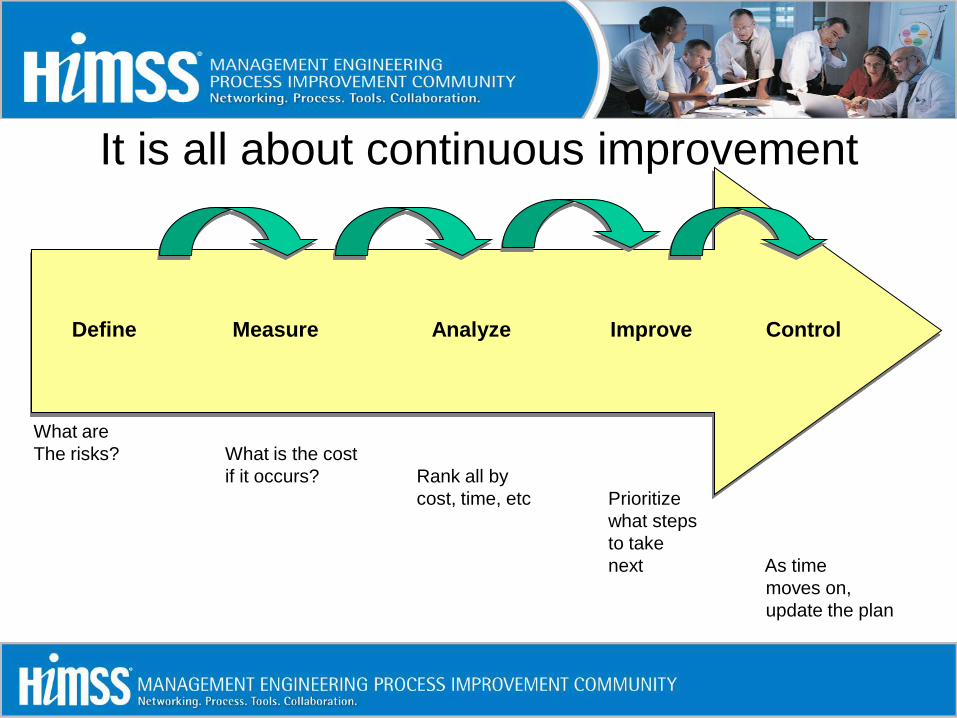
It is all about continuous improvement
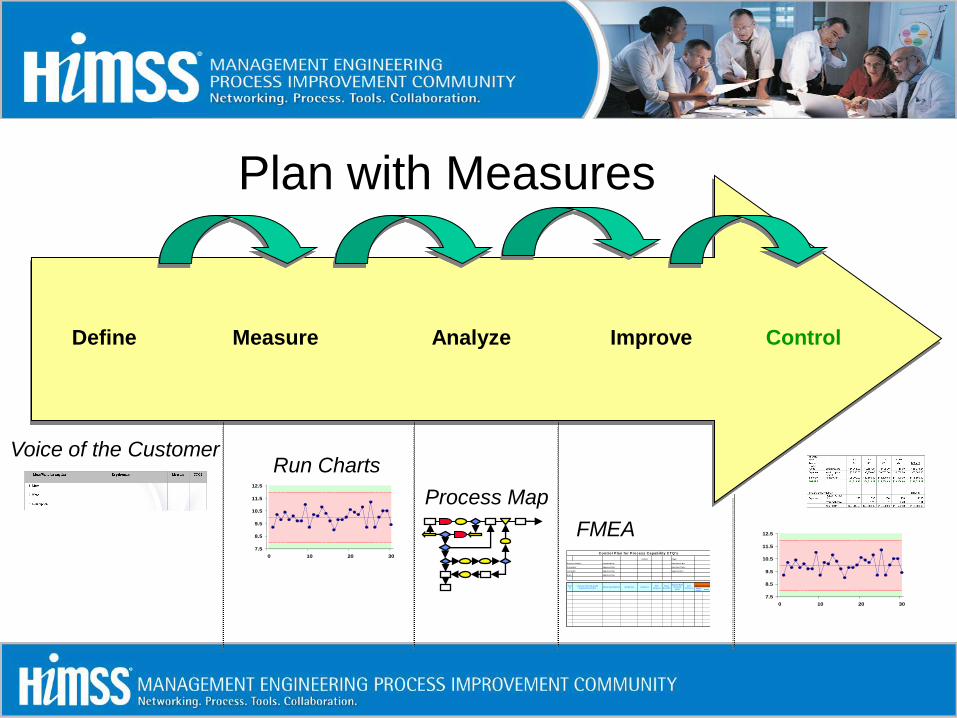
Define Measure Analyze Improve Control
What are
The risks? What is the cost
if it occurs? Rank all by
cost, time, etc Prioritize
what steps
to take
next As time
moves on,
update the plan
Session Objectives
• Six Sigma and DMAIC Brief Overview
• Tools to Use
• Write the Recommendation
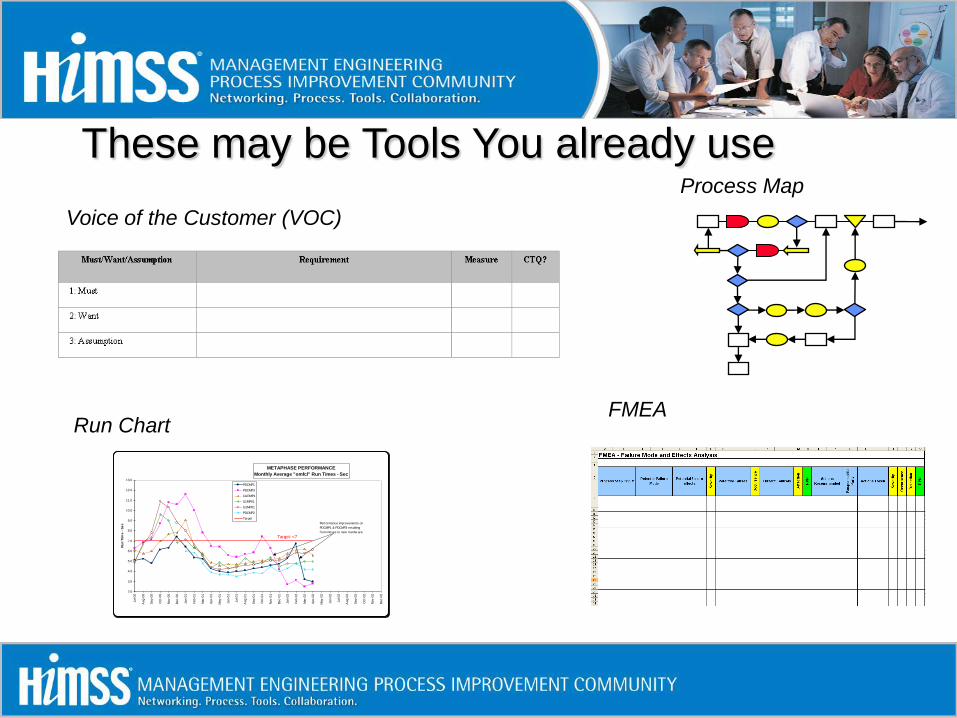
These may be Tools You already useProcess Map
METAPHASE PERFORMANCE
Monthly Average "omfcl" Run Times - Sec
2.0
3.0
4.0
5.0
6.0
7.0
8.0
9.0
10.0
11.0
12.0
13.0
Jul-00
Aug-0
0
Sep-0
0
Oct-
00
Nov-0
0
Dec-0
0
Jan-0
1
Feb-0
1
Mar-
01
Apr-
01
May-0
1
Jun-0
1
Jul-01
Aug-0
1
Sep-0
1
Oct-
01
Nov-0
1
Dec-0
1
Jan-0
2
Feb-0
2
Mar-
02
Apr-
02
May-0
2
Jun-0
2
Jul-02
Aug-0
2
Sep-0
2
Oct-
02
Nov-0
2
Dec-0
2
Ru
n T
ime
- S
ec
PDCMP1
PDCMP3
CARMP1
U1MP01
G1MP01
PDCMP2
Target
Target: <7
Performance improvements on
PDCMP1 & PDCMP3 resulting
from moves to new hardw are.
Run Chart
Voice of the Customer (VOC)
FMEA
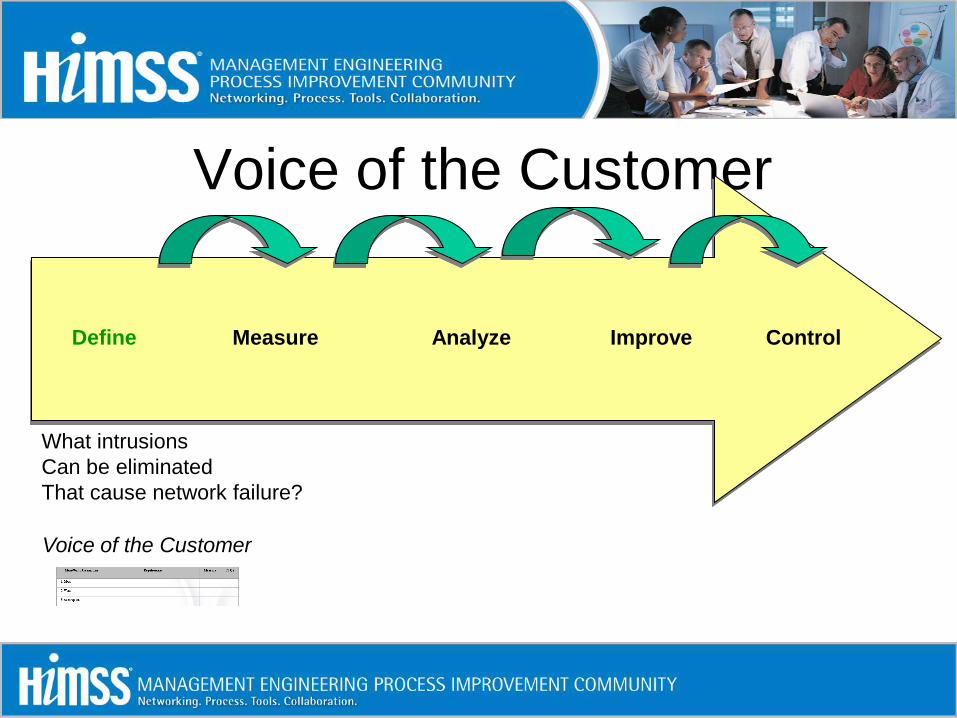
Voice of the Customer
Define Measure Analyze Improve Control
What intrusions
Can be eliminated
That cause network failure?
Voice of the Customer
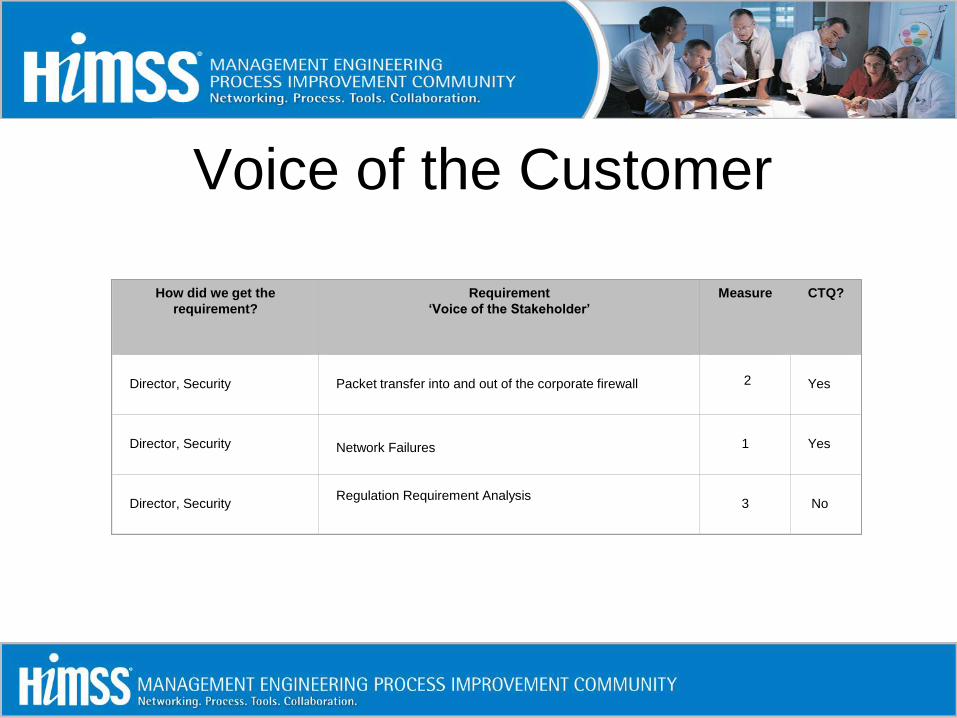
Voice of the Customer
How did we get the
requirement?
Requirement
‘Voice of the Stakeholder’
Measure CTQ?
Director, Security Packet transfer into and out of the corporate firewall
Network Failures
Regulation Requirement Analysis
Yes
Director, Security 1 Yes
Director, Security 3 No
2

Voice of the Customer(s)
2

Run Charts
7.5
8.5
9.5
10.5
11.5
12.5
0 10 20 30
Run Charts
Voice of the Customer
Define Measure Analyze Improve Control
What do things really look like?
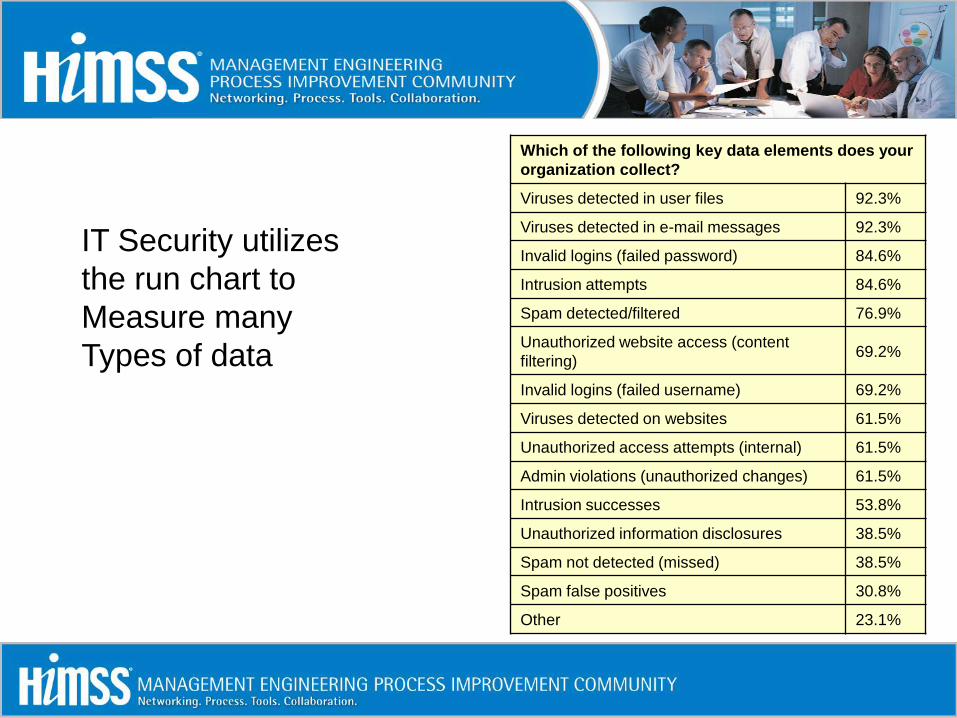
IT Security utilizes
the run chart to
Measure many
Types of data
Which of the following key data elements does your
organization collect?
Viruses detected in user files 92.3%
Viruses detected in e-mail messages 92.3%
Invalid logins (failed password) 84.6%
Intrusion attempts 84.6%
Spam detected/filtered 76.9%
Unauthorized website access (content
filtering)69.2%
Invalid logins (failed username) 69.2%
Viruses detected on websites 61.5%
Unauthorized access attempts (internal) 61.5%
Admin violations (unauthorized changes) 61.5%
Intrusion successes 53.8%
Unauthorized information disclosures 38.5%
Spam not detected (missed) 38.5%
Spam false positives 30.8%
Other 23.1%
Process Map
7.5
8.5
9.5
10.5
11.5
12.5
0 10 20 30
Run ChartsVoice of the Customer
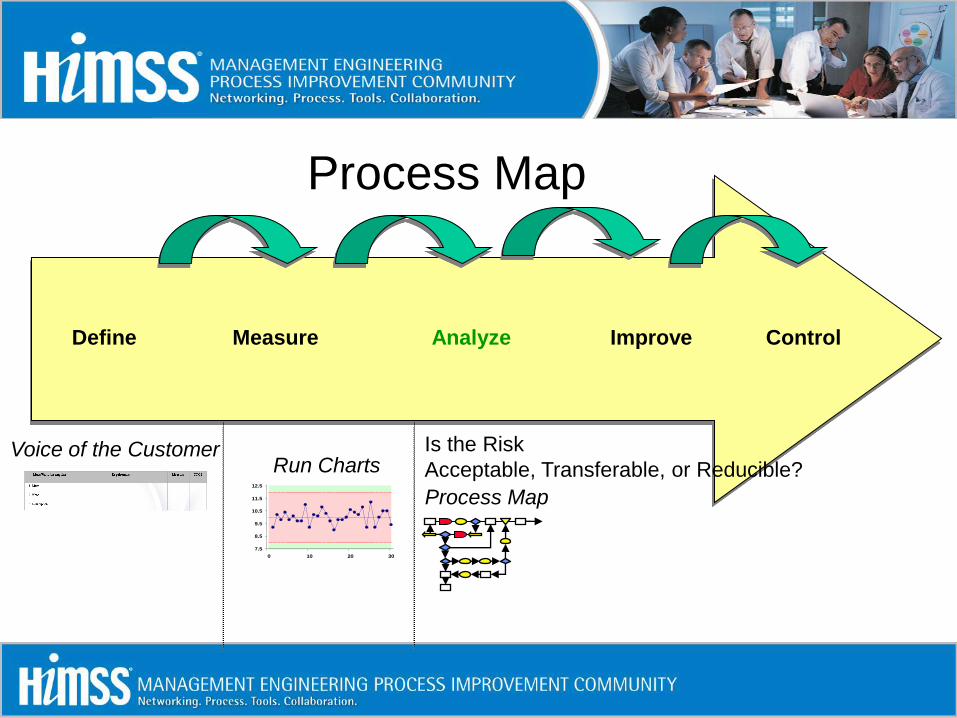
Define Measure Analyze Improve Control
Process Map
Is the Risk
Acceptable, Transferable, or Reducible?
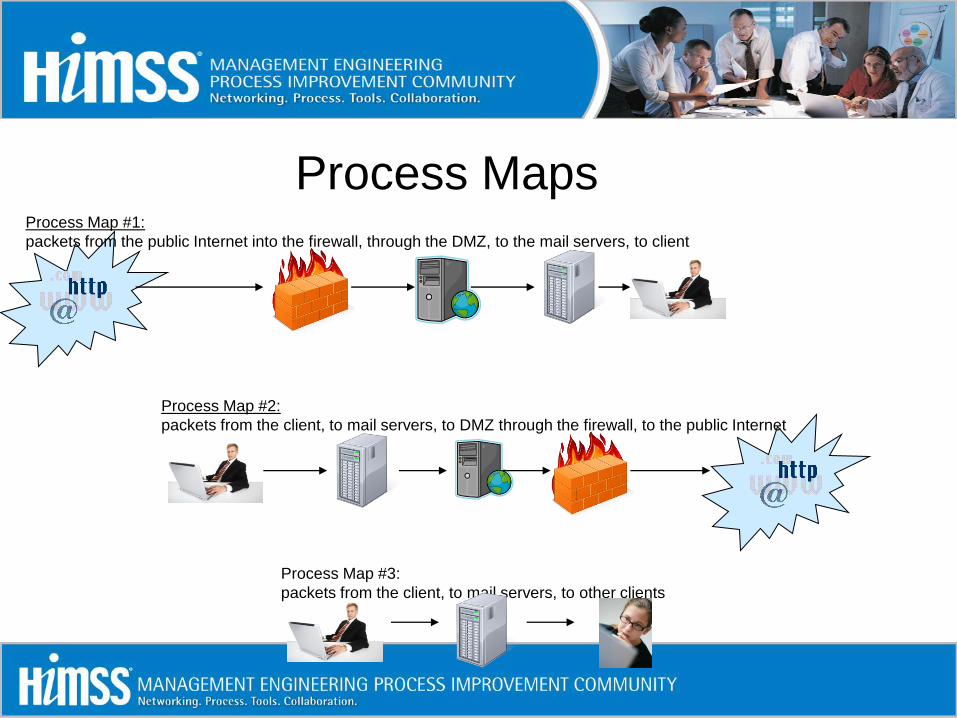
Process Maps
Process Map #3:
packets from the client, to mail servers, to other clients
Process Map #1:
packets from the public Internet into the firewall, through the DMZ, to the mail servers, to client
Process Map #2:
packets from the client, to mail servers, to DMZ through the firewall, to the public Internet
FMEA
7.5
8.5
9.5
10.5
11.5
12.5
0 10 20 30
Run ChartsVoice of the Customer
Define Measure Analyze Improve Control
Process Map
In t/Ext
Process N am e: Prepared by: D ocum ent N o:
C ustom er Approved by: R evision D ate:
Location: Approved by: Supercedes:
Area: Approved by:
Sigm a
ValueDPM O
Im plem entationDecision Rule/
Corrective
Action
SO P
Reference
W ho
M easures
W here
Recorded
Req't
IDM easurem ent M ethod Frequency
Custom er Critical to Q uality
Requirem ents (CTQ 's)Sam ple S ize
Page:
C ontrol P lan for Process C apability C TQ 's
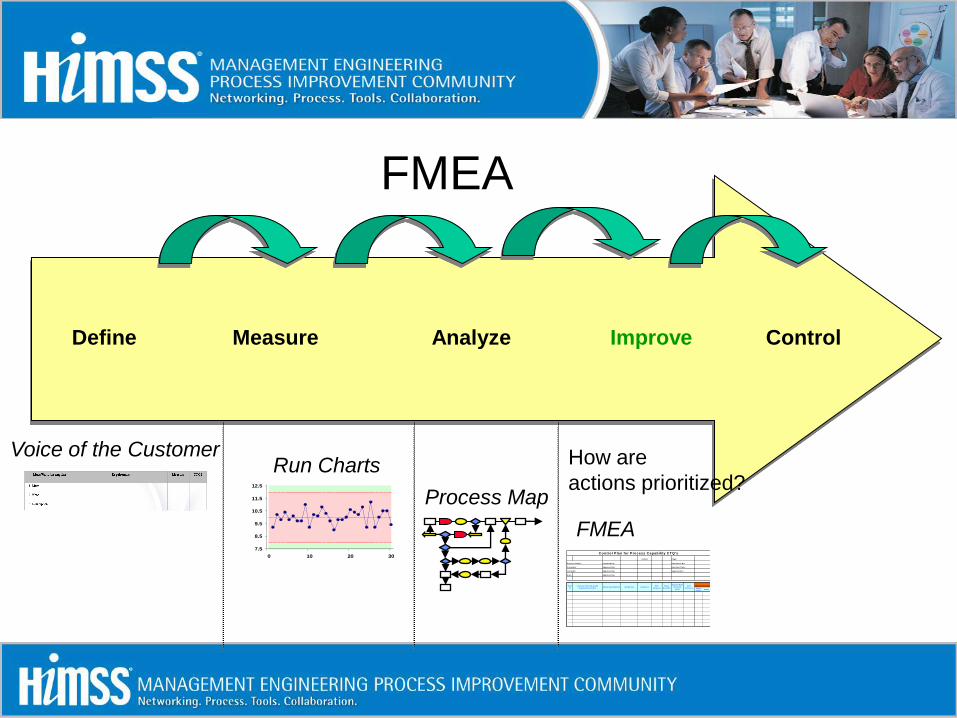
FMEA
How are
actions prioritized?
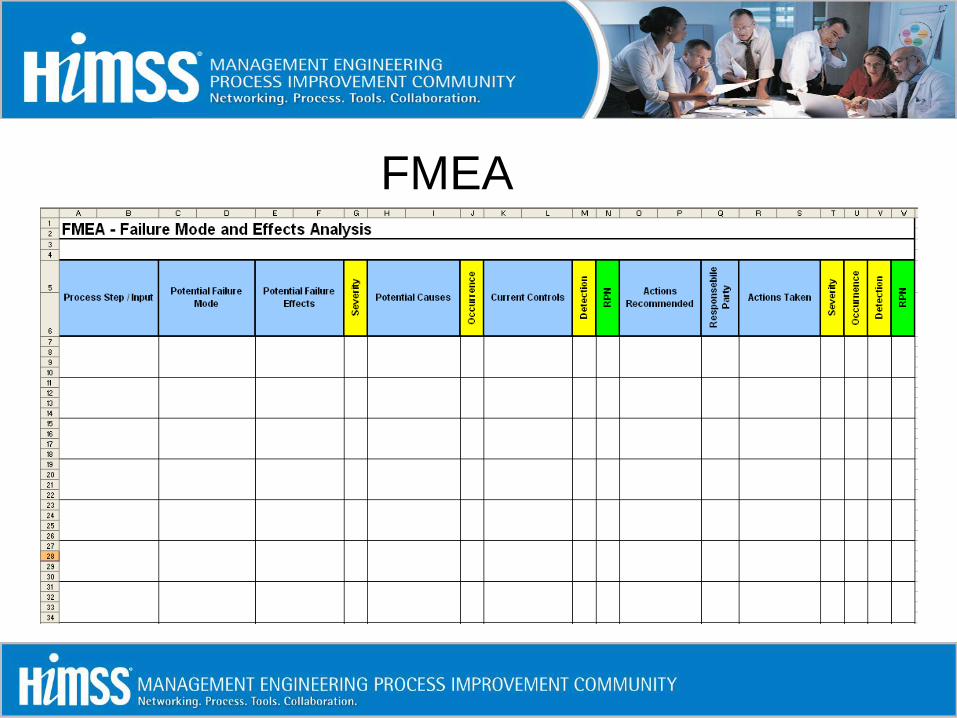
FMEA

FMEA
Session Objectives
• Six Sigma and DMAIC Brief Overview
• Tools to Use
• Write the Recommendation
Plan with Measures
7.5
8.5
9.5
10.5
11.5
12.5
0 10 20 30
Run ChartsVoice of the Customer
Define Measure Analyze Improve Control
Process Map
In t/Ext
Process N am e: Prepared by: D ocum ent N o:
C ustom er Approved by: R evision D ate:
Location: Approved by: Supercedes:
Area: Approved by:
Sigm a
ValueDPM O
Im plem entationDecision Rule/
Corrective
Action
SO P
Reference
W ho
M easures
W here
Recorded
Req't
IDM easurem ent M ethod Frequency
Custom er Critical to Q uality
Requirem ents (CTQ 's)Sam ple S ize
Page:
C ontrol P lan for Process C apability C TQ 's
FMEA
7.5
8.5
9.5
10.5
11.5
12.5
0 10 20 30
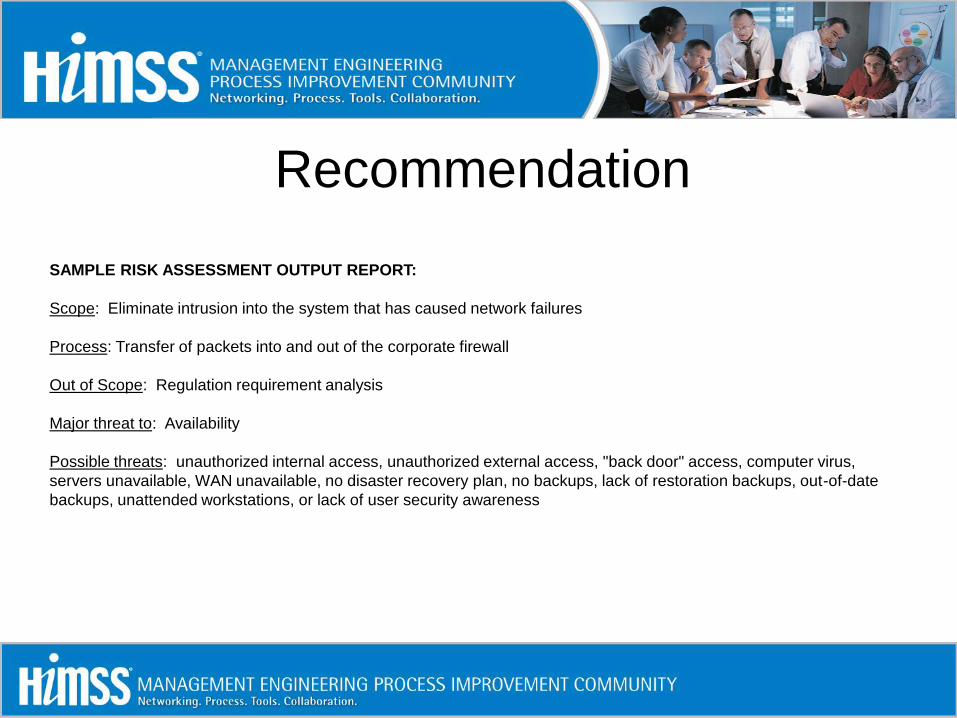
Recommendation
SAMPLE RISK ASSESSMENT OUTPUT REPORT:
Scope: Eliminate intrusion into the system that has caused network failures
Process: Transfer of packets into and out of the corporate firewall
Out of Scope: Regulation requirement analysis
Major threat to: Availability
Possible threats: unauthorized internal access, unauthorized external access, "back door" access, computer virus,
servers unavailable, WAN unavailable, no disaster recovery plan, no backups, lack of restoration backups, out-of-date
backups, unattended workstations, or lack of user security awareness
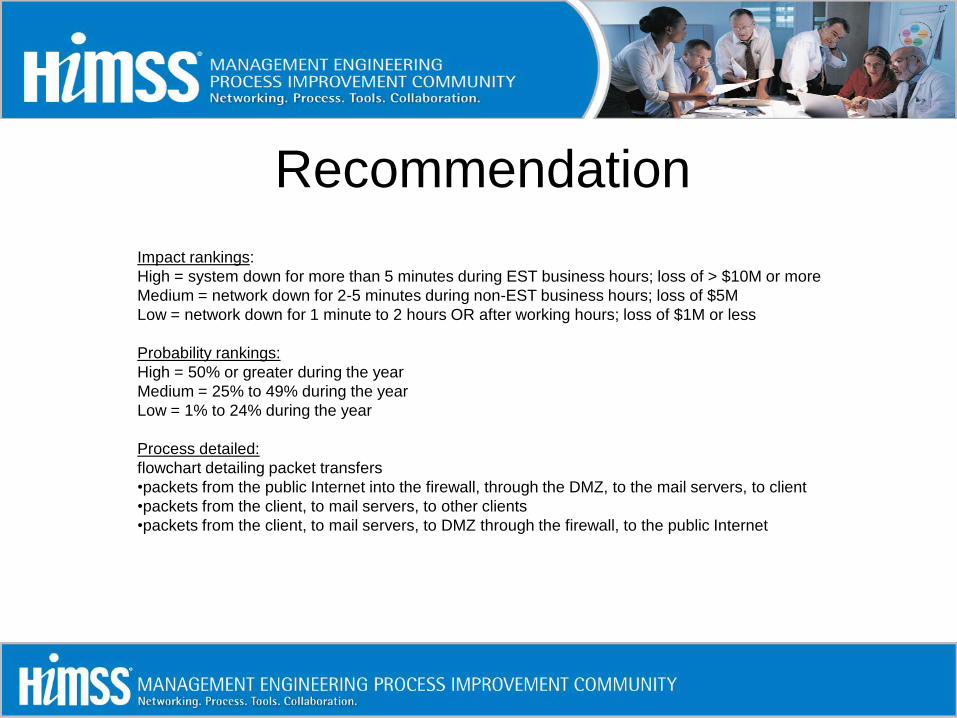
Recommendation
Impact rankings:
High = system down for more than 5 minutes during EST business hours; loss of > $10M or more
Medium = network down for 2-5 minutes during non-EST business hours; loss of $5M
Low = network down for 1 minute to 2 hours OR after working hours; loss of $1M or less
Probability rankings:
High = 50% or greater during the year
Medium = 25% to 49% during the year
Low = 1% to 24% during the year
Process detailed:
flowchart detailing packet transfers
•packets from the public Internet into the firewall, through the DMZ, to the mail servers, to client
•packets from the client, to mail servers, to other clients
•packets from the client, to mail servers, to DMZ through the firewall, to the public Internet
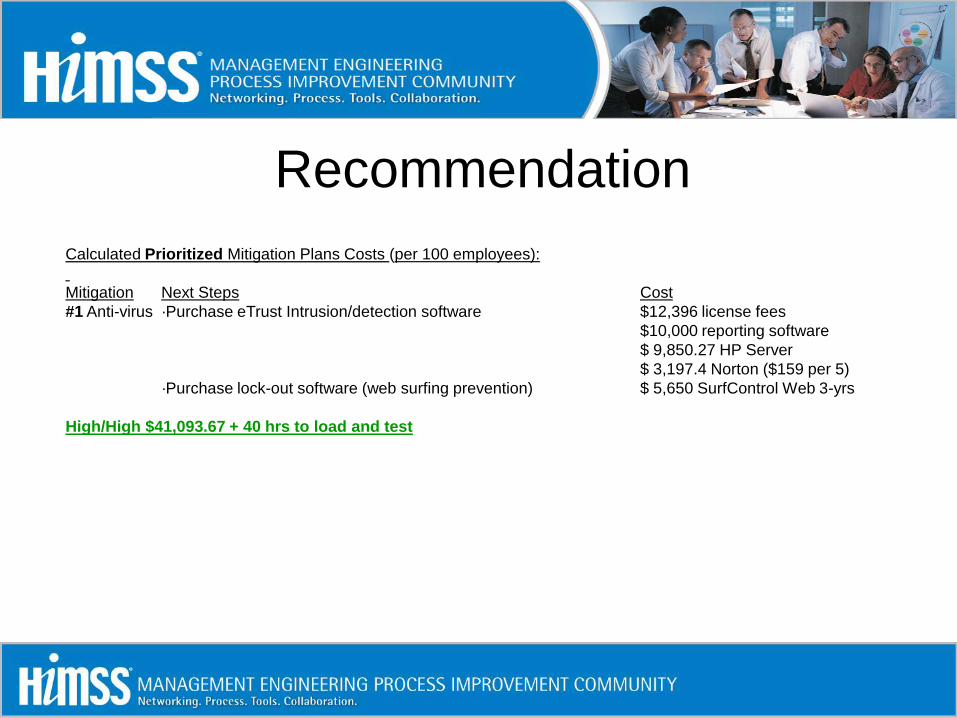
Recommendation
Calculated Prioritized Mitigation Plans Costs (per 100 employees):
Mitigation Next Steps Cost
#1 Anti-virus ·Purchase eTrust Intrusion/detection software $12,396 license fees
$10,000 reporting software
$ 9,850.27 HP Server
$ 3,197.4 Norton ($159 per 5)
·Purchase lock-out software (web surfing prevention) $ 5,650 SurfControl Web 3-yrs
High/High $41,093.67 + 40 hrs to load and test
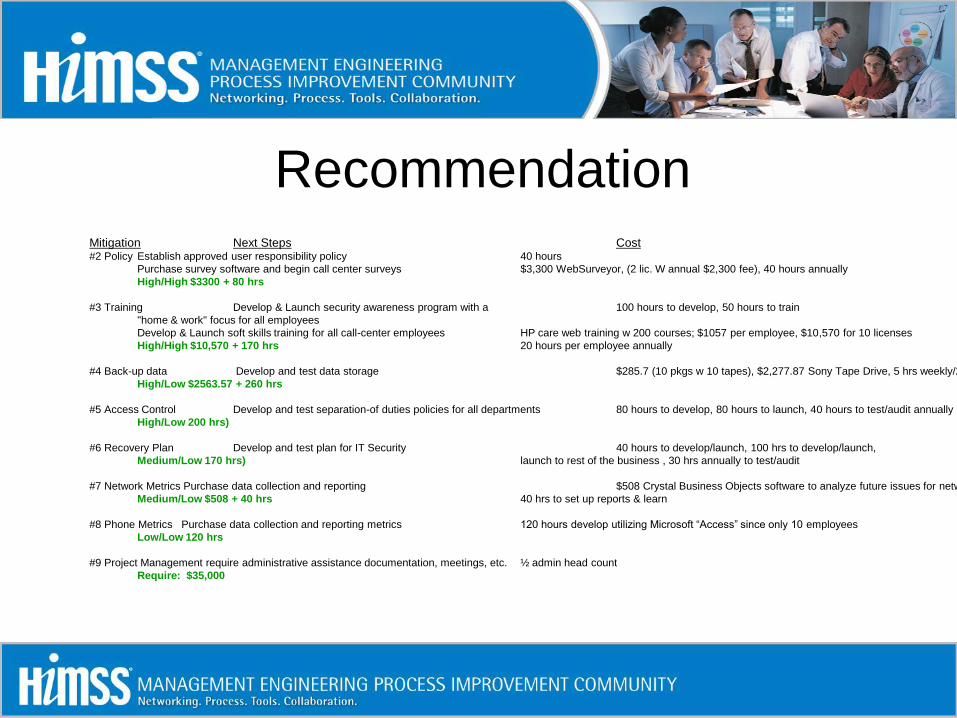
RecommendationMitigation Next Steps Cost#2 Policy Establish approved user responsibility policy 40 hours
Purchase survey software and begin call center surveys $3,300 WebSurveyor, (2 lic. W annual $2,300 fee), 40 hours annually
High/High $3300 + 80 hrs
#3 Training Develop & Launch security awareness program with a 100 hours to develop, 50 hours to train
"home & work" focus for all employees
Develop & Launch soft skills training for all call-center employees HP care web training w 200 courses; $1057 per employee, $10,570 for 10 licenses
High/High $10,570 + 170 hrs 20 hours per employee annually
#4 Back-up data Develop and test data storage $285.7 (10 pkgs w 10 tapes), $2,277.87 Sony Tape Drive, 5 hrs weekly/260 annual
High/Low $2563.57 + 260 hrs
#5 Access Control Develop and test separation-of duties policies for all departments 80 hours to develop, 80 hours to launch, 40 hours to test/audit annually
High/Low 200 hrs)
#6 Recovery Plan Develop and test plan for IT Security 40 hours to develop/launch, 100 hrs to develop/launch,
Medium/Low 170 hrs) launch to rest of the business , 30 hrs annually to test/audit
#7 Network Metrics Purchase data collection and reporting $508 Crystal Business Objects software to analyze future issues for network analysis
Medium/Low $508 + 40 hrs 40 hrs to set up reports & learn
#8 Phone Metrics Purchase data collection and reporting metrics 120 hours develop utilizing Microsoft “Access” since only 10 employees
Low/Low 120 hrs
#9 Project Management require administrative assistance documentation, meetings, etc. ½ admin head count
Require: $35,000
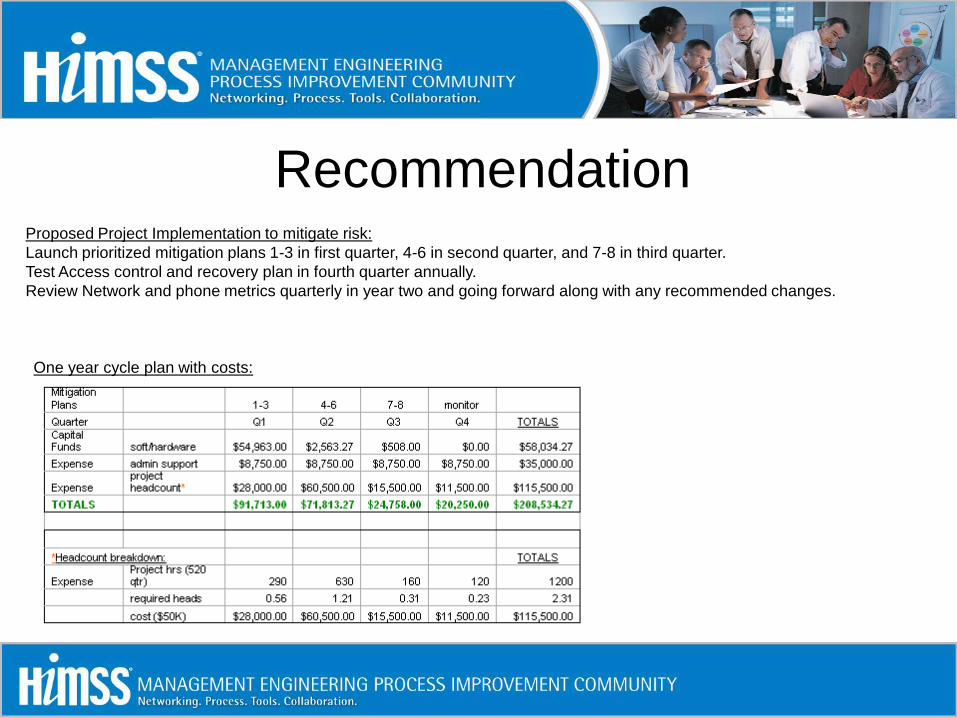
RecommendationProposed Project Implementation to mitigate risk:
Launch prioritized mitigation plans 1-3 in first quarter, 4-6 in second quarter, and 7-8 in third quarter.
Test Access control and recovery plan in fourth quarter annually.
Review Network and phone metrics quarterly in year two and going forward along with any recommended changes.
One year cycle plan with costs:

Closing Thoughts
• Follow DMAIC
• Use the Tools
• Write a human readable recommendation
More Information
See the HIMSS MEPI Web Page for the
tool kit:
http://www.himss.org/asp/topics_FocusDynamic.asp?faid=309
More Information
• Burton Group, http://www.csoonline.com/analyst/report2412.html
• Burton Group, http://www.burtongroup.com/Content/doc.aspx?cid=664&display=full#19765
• Burton Group, "Security Metrics: Horses for Courses", Fred Cohen, June 2005, http://www.burtongroup.com/Content/doc.aspx?cid=664&display=full#19736
• ISO 17799:2005(E), page 5, Sections 4.1 and 4.2
• www.isixsigma.com, Overall Methodology