Embed Size (px)
Citation preview
Using SharePoint and Teams as a Modern
Dashboarding Platform
White paper
Microsoft 365 Business Apps | 2
Copyright
The information contained in this document represents the current view of Microsoft Corporation on the
issues discussed as of the date of publication. Because Microsoft must respond to changing market conditions,
it should not be interpreted to be a commitment on the part of Microsoft, and Microsoft cannot guarantee the
accuracy of any information presented after the date of publication.
This white paper is for informational purposes only. MICROSOFT MAKES NO WARRANTIES, EXPRESS, IMPLIED,
OR STATUTORY, AS TO THE INFORMATION IN THIS DOCUMENT.
Complying with all applicable copyright laws is the responsibility of the user. Without limiting the rights under
copyright, no part of this document may be reproduced, stored in, or introduced into a retrieval system, or
transmitted in any form or by any means (electronic, mechanical, photocopying, recording, or otherwise), or
for any purpose, without the express written permission of Microsoft Corporation.
Microsoft may have patents, patent applications, trademarks, copyrights, or other intellectual property rights
covering subject matter in this document. Except as expressly provided in any written license agreement from
Microsoft, the furnishing of this document does not give you any license to these patents, trademarks,
copyrights, or other intellectual property.
© 2019 Microsoft Corporation. All rights reserved.
v1.0 June 2019
Microsoft, Azure, Office, Office 365, Excel, Word, PowerPoint, OneNote, OneDrive, SharePoint, Skype for
Business, Teams, Planner, Flow, Graph, Yammer, and Delve are trademarks of the Microsoft group of
companies. The exclusion of a specific trademark herein shall not be constituted as a waiver of Microsoft’s
rights.
All other trademarks are property of their respective owners.
Microsoft 365 Business Apps | 3
Table of Contents Executive Summary .............................................................................................................................................. 4
Quick Chart Web Part (modern) ...................................................................................................................... 4
Power BI Reports ................................................................................................................................................... 6
Power BI Web Part .................................................................................................................................................................................. 6
Embed Web Part...................................................................................................................................................................................... 8
Script Editor Web Part (On-premises) ........................................................................................................ 10
Power BI Free .......................................................................................................................................................................................... 13
Power BI Pro ............................................................................................................................................................................................ 13
Power BI Dedicated Capacity EM SKUs ........................................................................................................................................ 13
Power BI Dedicated Capacity P (Premium) SKUs ...................................................................................................................... 14
What to use when ................................................................................................................................................................................. 14
Excel Reports ....................................................................................................................................................... 15
Embed Web Part.................................................................................................................................................................................... 15
Excel Services Web Part (Classic sites) .......................................................................................................................................... 16
Script Editor Web Part or embed (Classic sites) ........................................................................................................................ 16
Paginated Reports ............................................................................................................................................. 20
Using SharePoint pages in Teams ............................................................................................................... 21
Recap and Recommendations ...................................................................................................................... 23
Microsoft 365 Business Apps | 4
Executive Summary SharePoint has a long history of providing a first-class platform for business intelligence dashboards.
SharePoint sites and pages continue this tradition, bringing together content from Power BI, Excel, and many
other sources into rich, immersive pages. Adding conversations and other collaborative content to these
pages, help to bring context to the content and help to foster a data culture.
SharePoint pages, as well as lists, can be integrated into Microsoft Teams, bringing all this richness to the
Teams collaborative environment, and focusing on the conversation around reports. Dashboards delivered
via SharePoint pages are now a first-class citizen in Microsoft Teams.
On-premises, SharePoint Server 2019 has made many changes with regards to business intelligence
capabilities. Business intelligence features such as Power Pivot for SharePoint and SQL Server Reporting
Services are no longer available in the server, while others such as PerformancePoint have been deprecated.
However, these capabilities are now available through tools like Power BI, Excel Online, and Power BI Report
server. This paper will outline the various approaches to building dashboards in SharePoint, Microsoft Teams
and SharePoint Server.
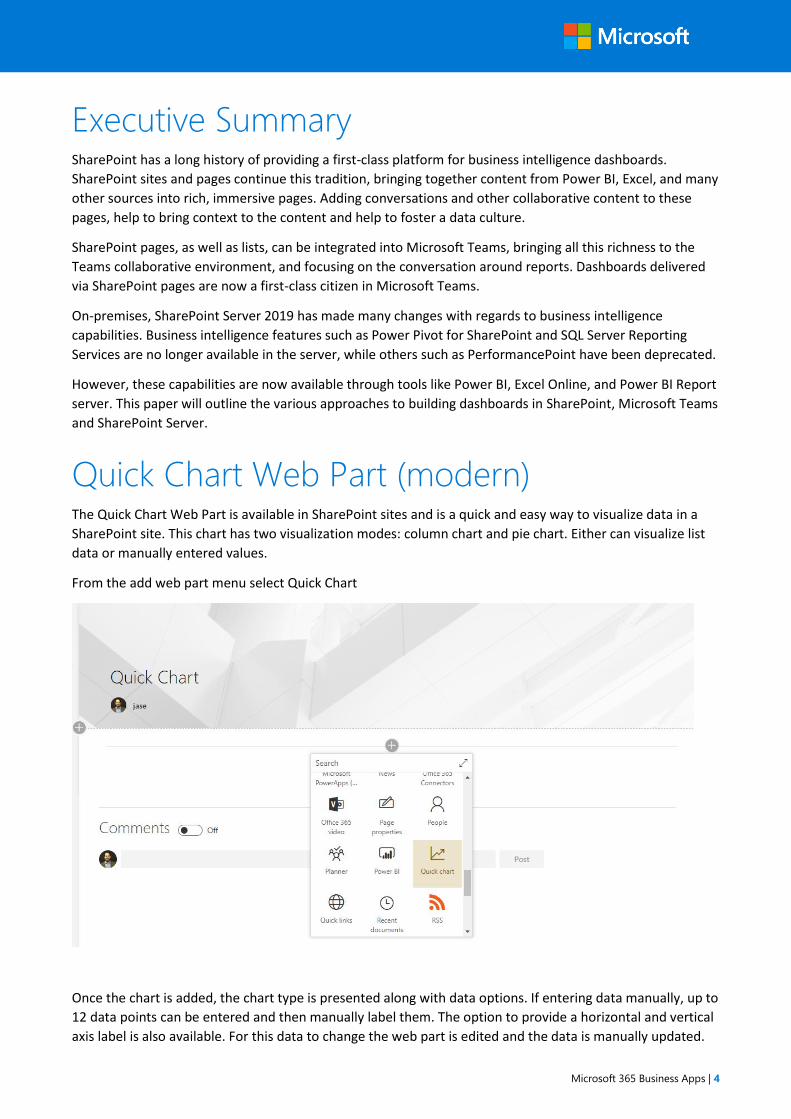
Quick Chart Web Part (modern) The Quick Chart Web Part is available in SharePoint sites and is a quick and easy way to visualize data in a
SharePoint site. This chart has two visualization modes: column chart and pie chart. Either can visualize list
data or manually entered values.
From the add web part menu select Quick Chart
Once the chart is added, the chart type is presented along with data options. If entering data manually, up to
12 data points can be entered and then manually label them. The option to provide a horizontal and vertical
axis label is also available. For this data to change the web part is edited and the data is manually updated.
Microsoft 365 Business Apps | 5
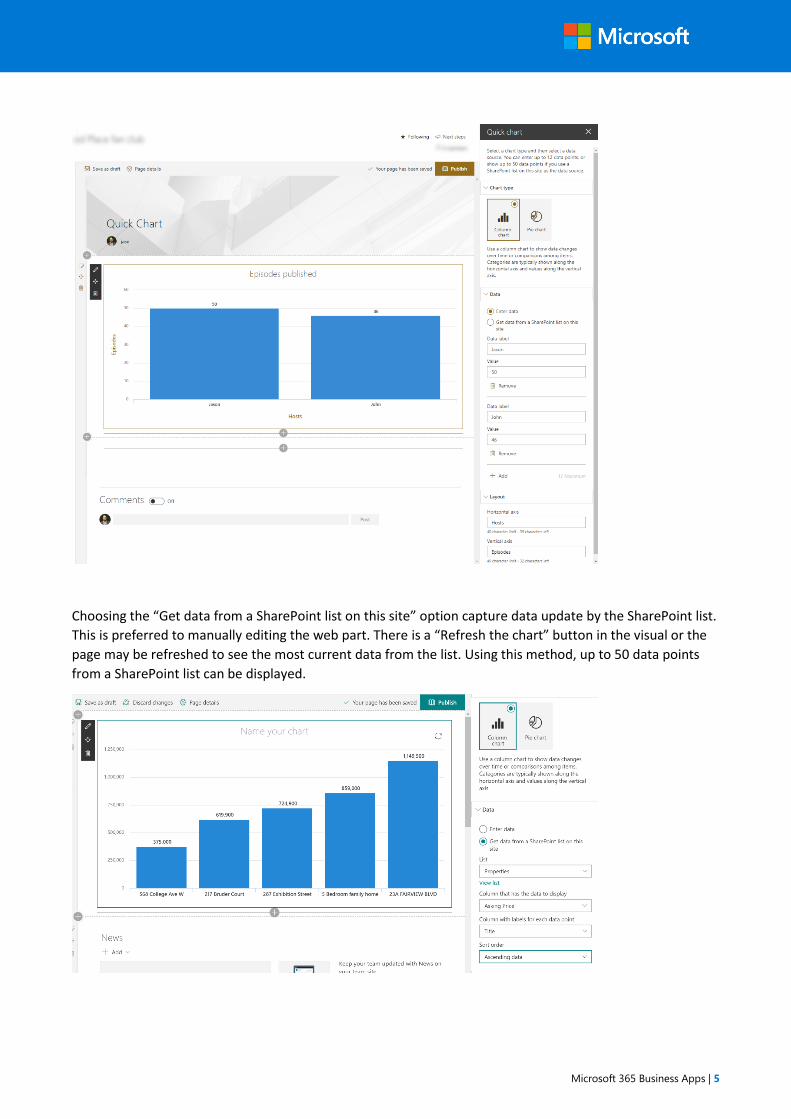
Choosing the “Get data from a SharePoint list on this site” option capture data update by the SharePoint list.
This is preferred to manually editing the web part. There is a “Refresh the chart” button in the visual or the
page may be refreshed to see the most current data from the list. Using this method, up to 50 data points
from a SharePoint list can be displayed.
Microsoft 365 Business Apps | 6
Unlike other reporting methods that follow, the attraction of this reporting method is the quick and easy
nature of creating visuals included in the SharePoint Online licensing model. However, limiting the number
of data points and lack of customizations to the look and feel of the report, is restrictive to many scenarios
where the Quick Charts web part can be utilized.
Power BI Reports The latest tool for reporting from Microsoft is Power BI. This tool allows you to build beautiful, interactive
reports which can be consumed in multiple ways, making it approachable for everyone. There are licensing
requirements when visualizing Power BI Reports in SharePoint that will be covered in a later section of this
white paper. For purposes of this section, assume the required licensing is in place and the report is
published to the Power BI Service.
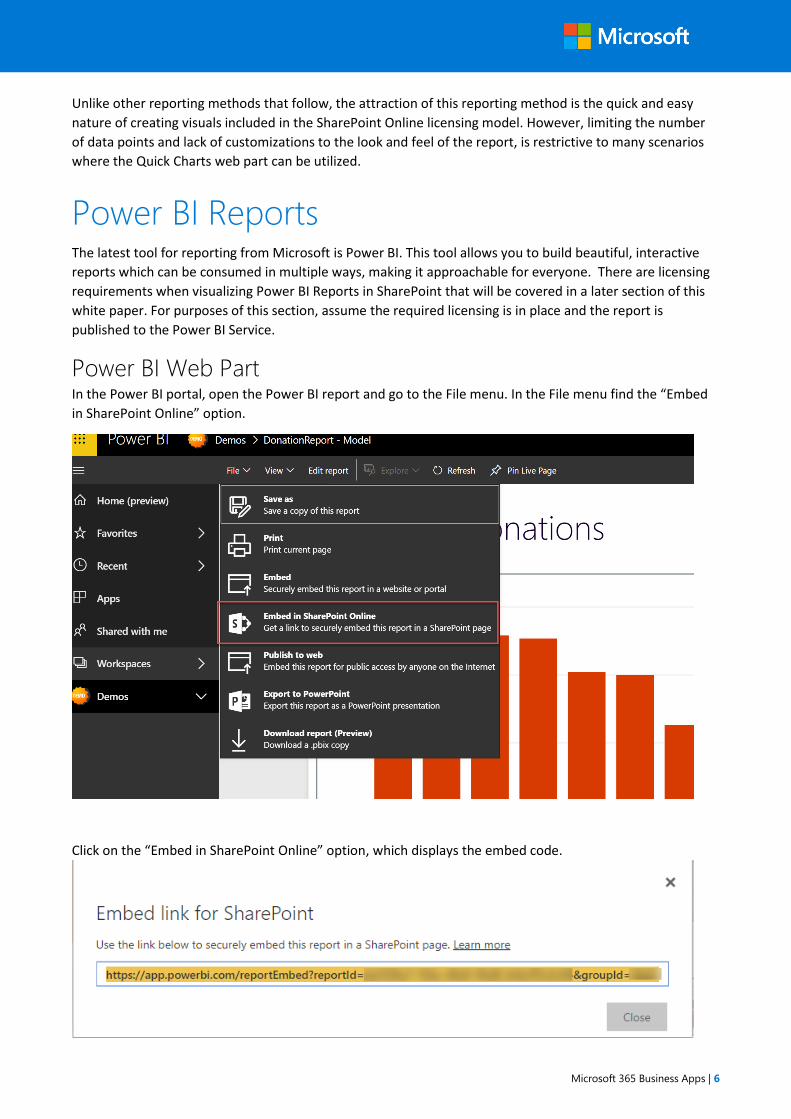
Power BI Web Part In the Power BI portal, open the Power BI report and go to the File menu. In the File menu find the “Embed
in SharePoint Online” option.
Click on the “Embed in SharePoint Online” option, which displays the embed code.
Microsoft 365 Business Apps | 7
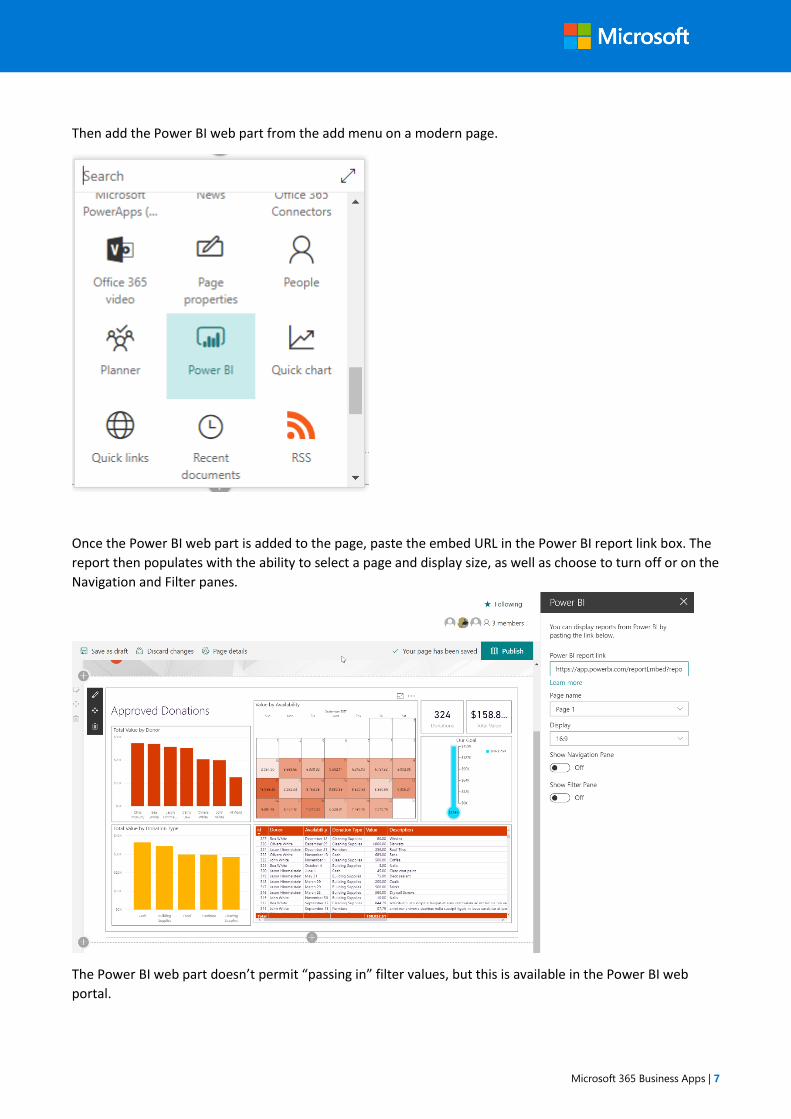
Then add the Power BI web part from the add menu on a modern page.
Once the Power BI web part is added to the page, paste the embed URL in the Power BI report link box. The
report then populates with the ability to select a page and display size, as well as choose to turn off or on the
Navigation and Filter panes.
The Power BI web part doesn’t permit “passing in” filter values, but this is available in the Power BI web
portal.
Microsoft 365 Business Apps | 8
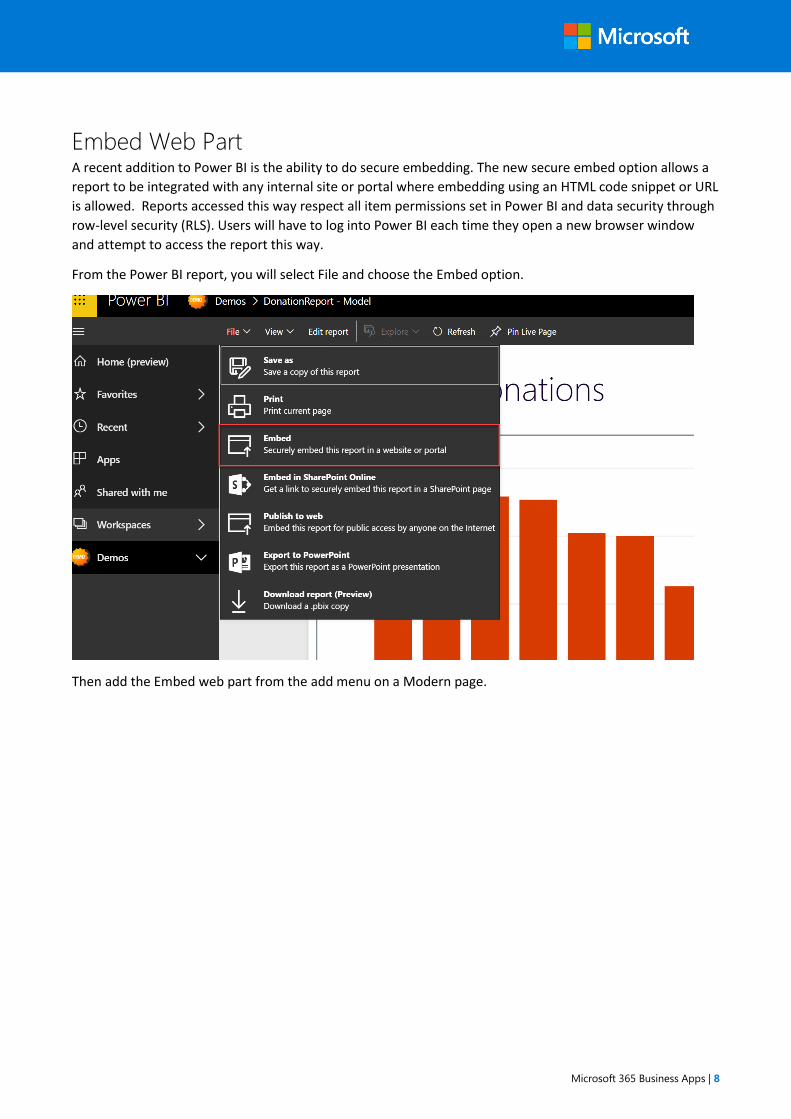
Embed Web Part A recent addition to Power BI is the ability to do secure embedding. The new secure embed option allows a
report to be integrated with any internal site or portal where embedding using an HTML code snippet or URL
is allowed. Reports accessed this way respect all item permissions set in Power BI and data security through
row-level security (RLS). Users will have to log into Power BI each time they open a new browser window
and attempt to access the report this way.
From the Power BI report, you will select File and choose the Embed option.
Then add the Embed web part from the add menu on a Modern page.
Microsoft 365 Business Apps | 9
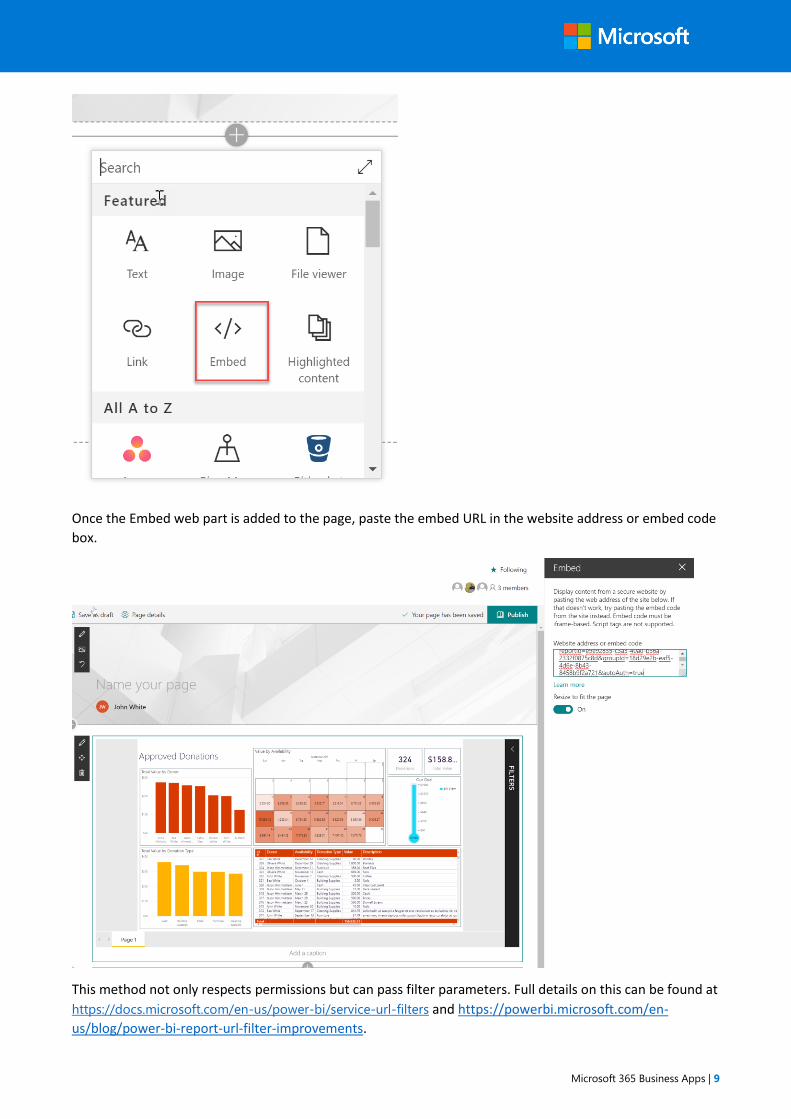
Once the Embed web part is added to the page, paste the embed URL in the website address or embed code
box.
This method not only respects permissions but can pass filter parameters. Full details on this can be found at
https://docs.microsoft.com/en-us/power-bi/service-url-filters and https://powerbi.microsoft.com/en-
us/blog/power-bi-report-url-filter-improvements.
Microsoft 365 Business Apps | 10
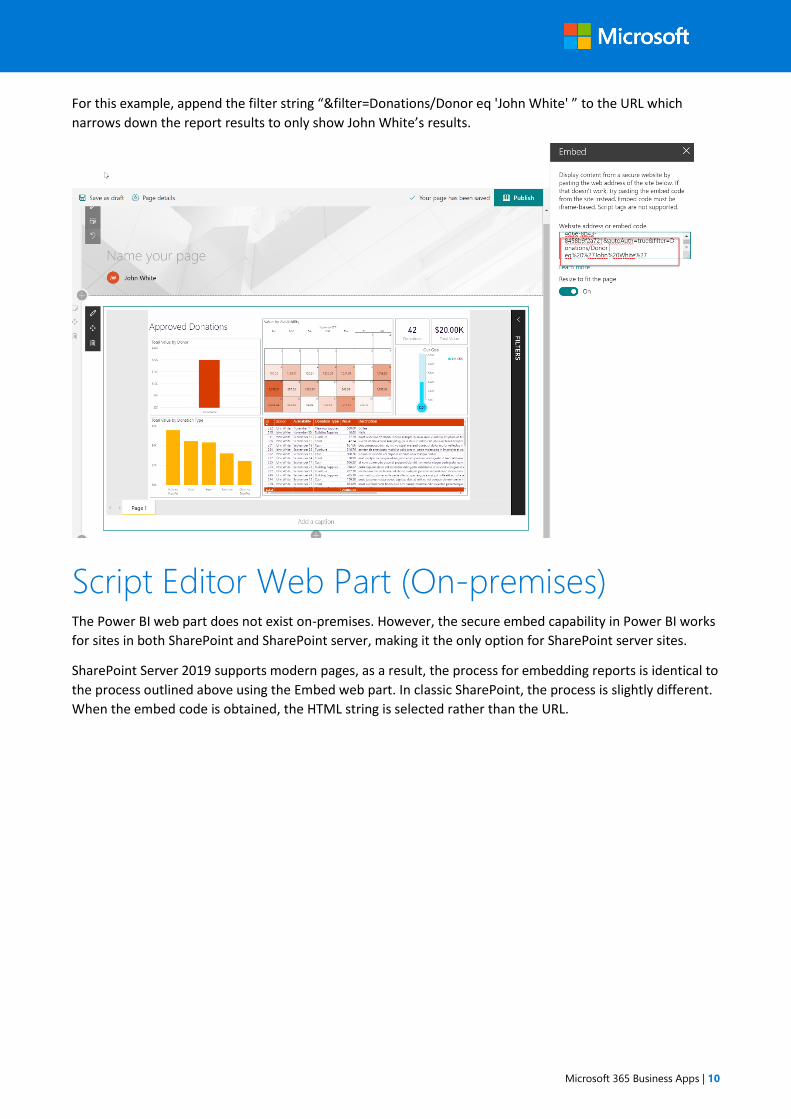
For this example, append the filter string “&filter=Donations/Donor eq 'John White' ” to the URL which
narrows down the report results to only show John White’s results.
Script Editor Web Part (On-premises) The Power BI web part does not exist on-premises. However, the secure embed capability in Power BI works
for sites in both SharePoint and SharePoint server, making it the only option for SharePoint server sites.
SharePoint Server 2019 supports modern pages, as a result, the process for embedding reports is identical to
the process outlined above using the Embed web part. In classic SharePoint, the process is slightly different.
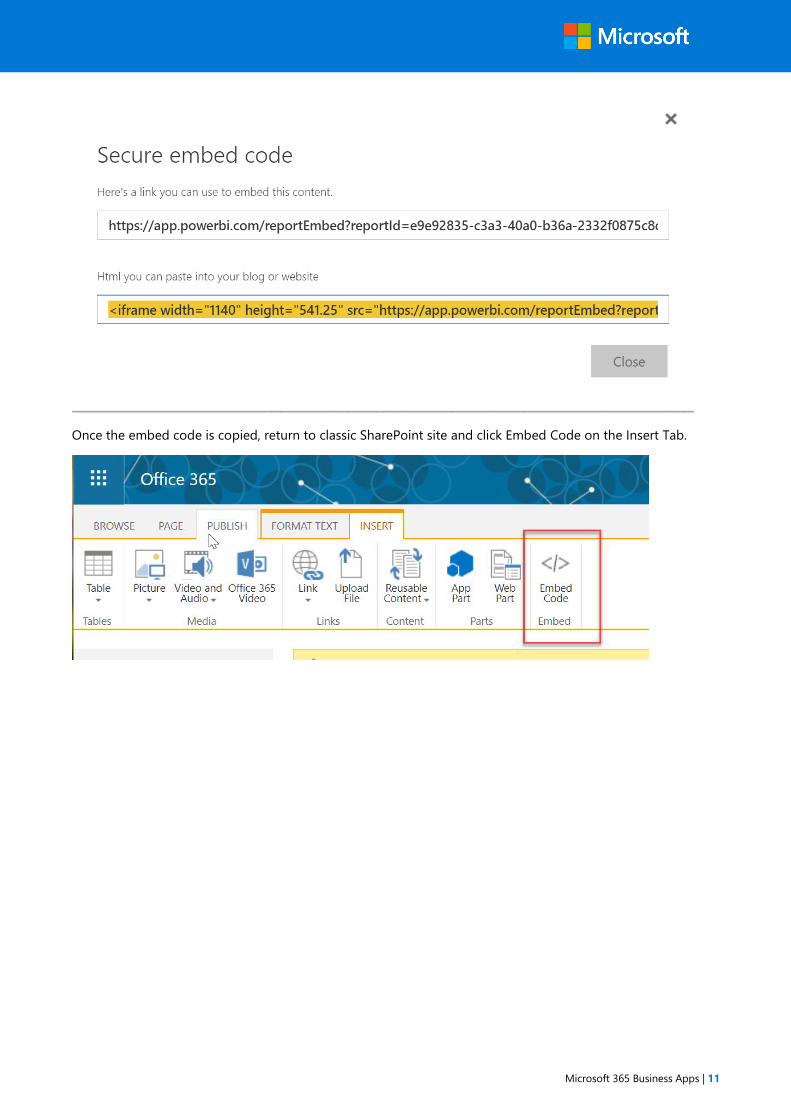
When the embed code is obtained, the HTML string is selected rather than the URL.
Microsoft 365 Business Apps | 11
Once the embed code is copied, return to classic SharePoint site and click Embed Code on the Insert Tab.
Microsoft 365 Business Apps | 12
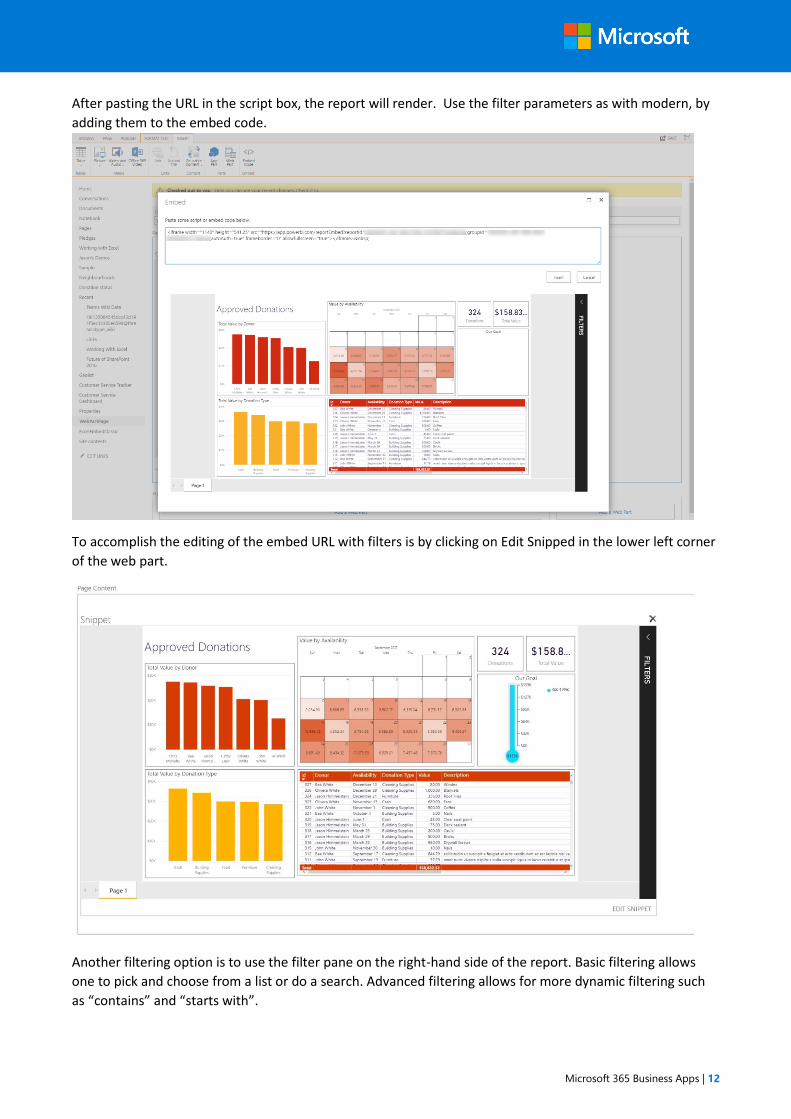
After pasting the URL in the script box, the report will render. Use the filter parameters as with modern, by
adding them to the embed code.
To accomplish the editing of the embed URL with filters is by clicking on Edit Snipped in the lower left corner
of the web part.
Another filtering option is to use the filter pane on the right-hand side of the report. Basic filtering allows
one to pick and choose from a list or do a search. Advanced filtering allows for more dynamic filtering such
as “contains” and “starts with”.
Microsoft 365 Business Apps | 13
Power BI Licensing
In order to embed Power BI content, there must be a license in place, and there are several licensing options
to choose from. What follows is a simplified attempt to help in understanding what is needed in order to do
Power BI reporting as previously outlined. It is strongly recommend to visit
https://powerbi.microsoft.com/en-us/pricing/ for any updates to licensing.
Power BI Free A free Power BI license is available which provides access to all features of Power BI except for sharing and
dedicated capacity. These exceptions will be discussed in further detail below.
A user can use a free license to build highly complex reports and publish them to their personal workspace.
However, if that user wants to share the report with other users through any sharing mechanism, some form
of paid license is required.
Power BI Pro Power BI Pro is the most common paid license model for users of Power BI. This SKU is included in the E5
license of Office 365 but may also be purchased for individual users that do not have E5.
A user must have a Power BI Pro (or Premium) license to publish shared reports. A Pro license is also
required to publish reports to shared workspaces. In addition, any user consuming the report must also have
a Pro license, unless the shared workspace is running in dedicated capacity. This is also true when using the
Power BI modern web part in SharePoint. The Premium SKUs, detailed in the next 2 sections, are licenses for
consumers of reports not for the report publisher.
Power BI Dedicated Capacity EM SKUs The EM SKU (EM is for embedding – NOT Embedded) covers off everything contained in the Power BI
Embedded A SKU, but also offers the ability to share Power BI reports within an organization through
content embedding. Currently, this can be accomplished using the SharePoint Power BI web part for modern
pages, or the through tabs using Microsoft Teams.
There are three EM SKUs, and while the largest, EM3, can be purchased through Office 365 monthly, the
smaller 2 (EM1 and EM2) must be purchased through volume licensing. Volume licensing represents an
annual commitment and may be an incentive for ISVs to remain on the A SKU, even if they are not pausing
their service. EM SKUs cannot be paused; a month is the smallest available billing unit. Additionally, scaling
on EM SKUs requires that you retain your monthly or annual commitment to the initial SKU purchased until
the end of the contract term.
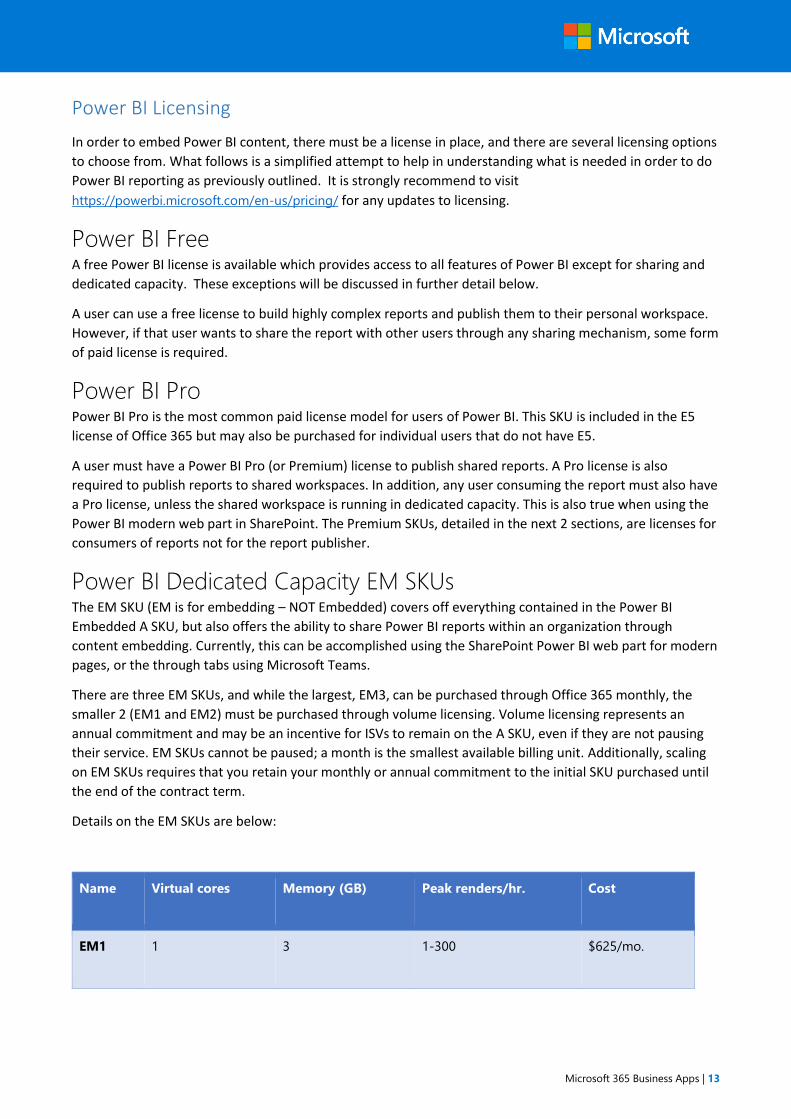
Details on the EM SKUs are below:
Name Virtual cores Memory (GB) Peak renders/hr. Cost
EM1 1 3 1-300 $625/mo.
Microsoft 365 Business Apps | 14
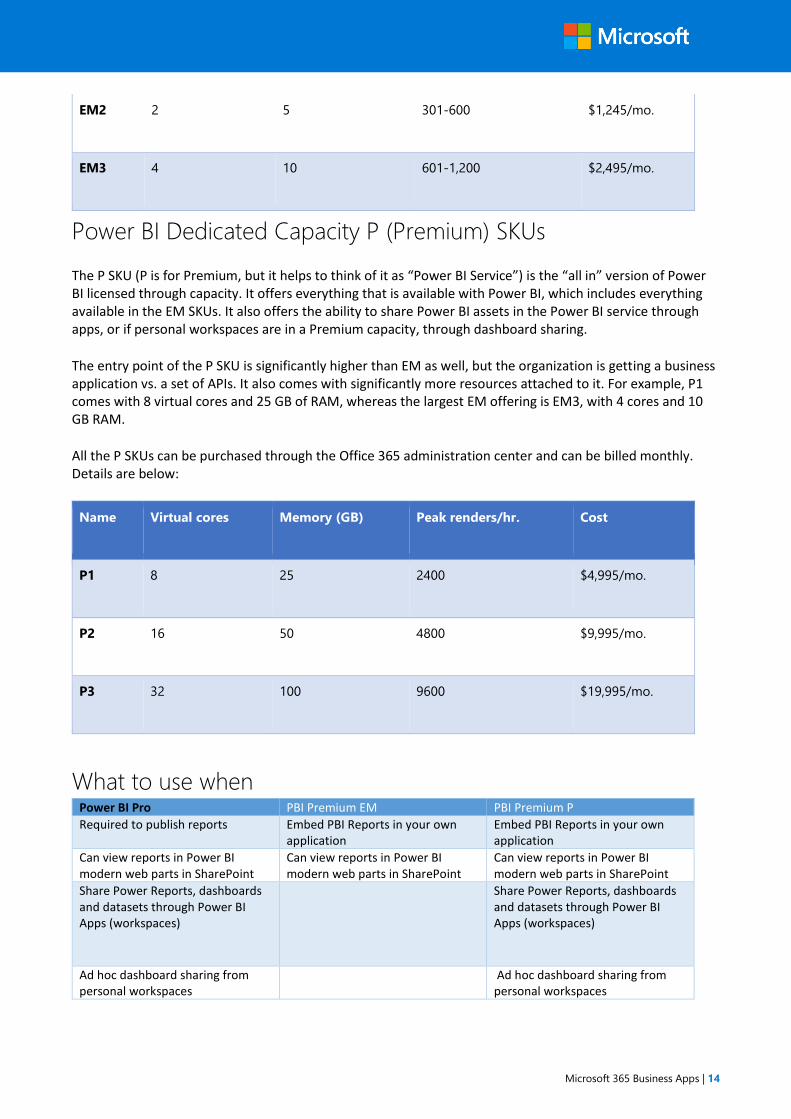
EM2 2 5 301-600 $1,245/mo.
EM3 4 10 601-1,200 $2,495/mo.
Power BI Dedicated Capacity P (Premium) SKUs
The P SKU (P is for Premium, but it helps to think of it as “Power BI Service”) is the “all in” version of Power BI licensed through capacity. It offers everything that is available with Power BI, which includes everything available in the EM SKUs. It also offers the ability to share Power BI assets in the Power BI service through apps, or if personal workspaces are in a Premium capacity, through dashboard sharing.
The entry point of the P SKU is significantly higher than EM as well, but the organization is getting a business application vs. a set of APIs. It also comes with significantly more resources attached to it. For example, P1 comes with 8 virtual cores and 25 GB of RAM, whereas the largest EM offering is EM3, with 4 cores and 10 GB RAM.
All the P SKUs can be purchased through the Office 365 administration center and can be billed monthly. Details are below:
Name Virtual cores Memory (GB) Peak renders/hr. Cost
P1 8 25 2400 $4,995/mo.
P2 16 50 4800 $9,995/mo.
P3 32 100 9600 $19,995/mo.
What to use when Power BI Pro PBI Premium EM PBI Premium P
Required to publish reports Embed PBI Reports in your own application
Embed PBI Reports in your own application
Can view reports in Power BI modern web parts in SharePoint
Can view reports in Power BI modern web parts in SharePoint
Can view reports in Power BI modern web parts in SharePoint
Share Power Reports, dashboards and datasets through Power BI Apps (workspaces)
Share Power Reports, dashboards and datasets through Power BI Apps (workspaces)
Ad hoc dashboard sharing from personal workspaces
Ad hoc dashboard sharing from personal workspaces
Microsoft 365 Business Apps | 15
An organization that has a few data analysts or power users that need to share reports with a broader audience would likely be well served with one of the EM SKUs. This scenario assumes that the organization is also using SharePoint Online, Microsoft Teams, or both. This approach will allow the power users (who will require a Pro license as well) to embed Power BI content within a SharePoint page or a Microsoft Teams tab where it can be accessed by users without a Pro license.
Finally, larger organizations with a significant investment in Power BI would benefit from a P SKU which gives them dedicated capacity. With this, the Power BI interface could be utilized by end users to access shared content without a Pro license. Given the cost of a P SKU to the cost of Pro, the organization would need to have at least 500 active report consumers for this to be considered.
Excel Reports Until recent years Excel Services was a core part of SharePoint and was the main tool for sharing what
people consider to be “dashboards”. In 2016 Excel moved from being a shared application that runs on
SharePoint, to the Office Online suite which runs alongside SharePoint and connects to it. There are a few
ways that Excel is viewed in SharePoint today.
Excel itself is a first-class Business Intelligence client. Excel includes the core analytics features provided with
Power BI Desktop including, Power Query, Power Pivot, and even Power BI visuals. Excel files can be
published to the Power BI service, and when they include a data model, they can be automatically refreshed.
This can only be done when the Excel file is stored in a SharePoint document library, or in OneDrive.
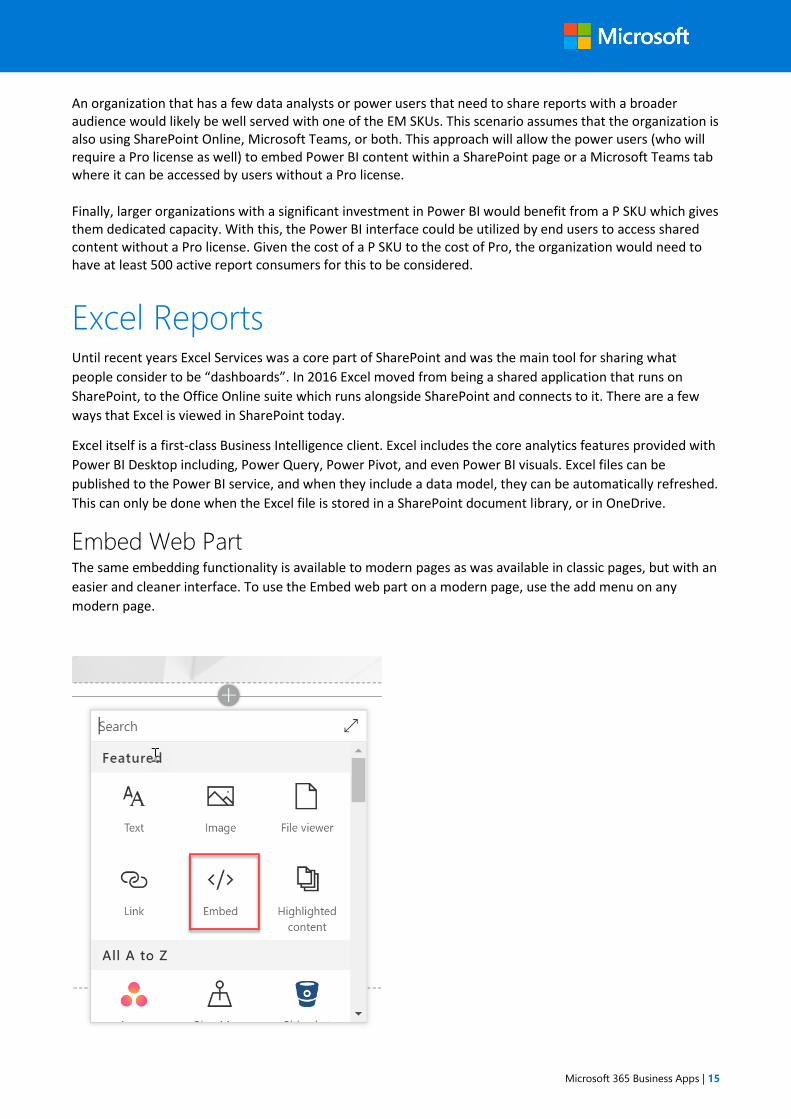
Embed Web Part The same embedding functionality is available to modern pages as was available in classic pages, but with an
easier and cleaner interface. To use the Embed web part on a modern page, use the add menu on any
modern page.
Microsoft 365 Business Apps | 16
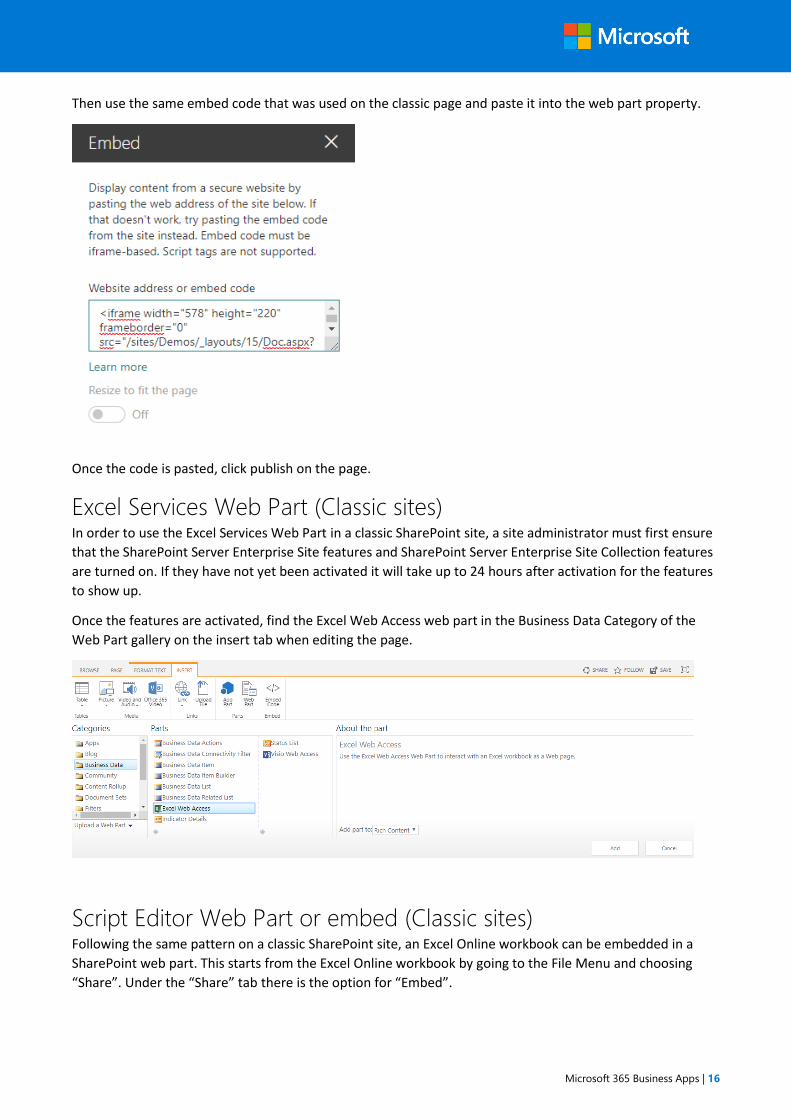
Then use the same embed code that was used on the classic page and paste it into the web part property.
Once the code is pasted, click publish on the page.
Excel Services Web Part (Classic sites) In order to use the Excel Services Web Part in a classic SharePoint site, a site administrator must first ensure
that the SharePoint Server Enterprise Site features and SharePoint Server Enterprise Site Collection features
are turned on. If they have not yet been activated it will take up to 24 hours after activation for the features
to show up.
Once the features are activated, find the Excel Web Access web part in the Business Data Category of the
Web Part gallery on the insert tab when editing the page.
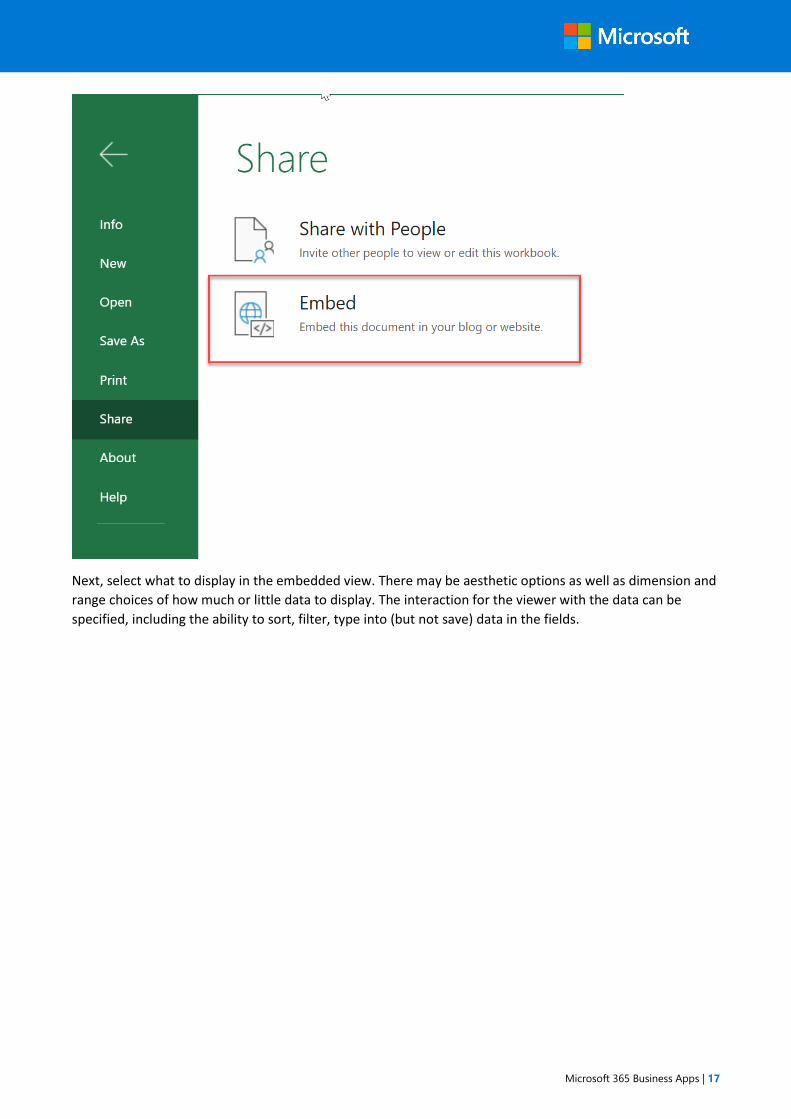
Script Editor Web Part or embed (Classic sites) Following the same pattern on a classic SharePoint site, an Excel Online workbook can be embedded in a
SharePoint web part. This starts from the Excel Online workbook by going to the File Menu and choosing
“Share”. Under the “Share” tab there is the option for “Embed”.
Microsoft 365 Business Apps | 17
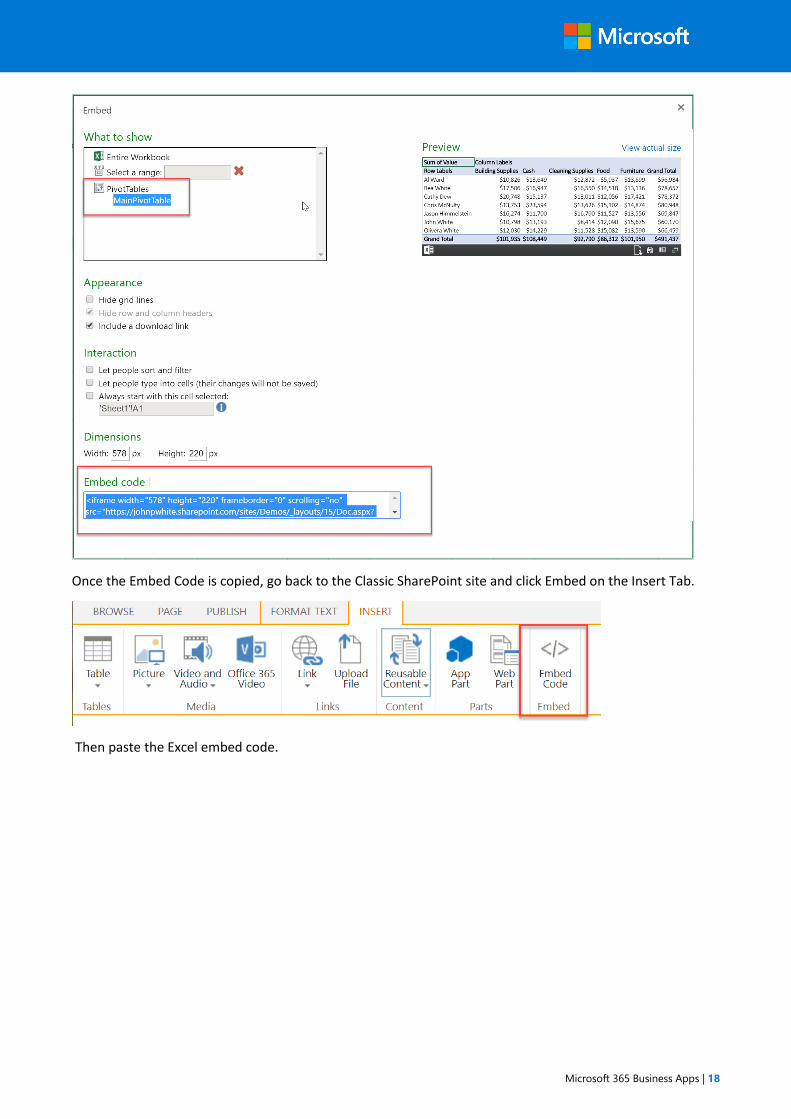
Next, select what to display in the embedded view. There may be aesthetic options as well as dimension and
range choices of how much or little data to display. The interaction for the viewer with the data can be
specified, including the ability to sort, filter, type into (but not save) data in the fields.
Microsoft 365 Business Apps | 18
Once the Embed Code is copied, go back to the Classic SharePoint site and click Embed on the Insert Tab.
Then paste the Excel embed code.
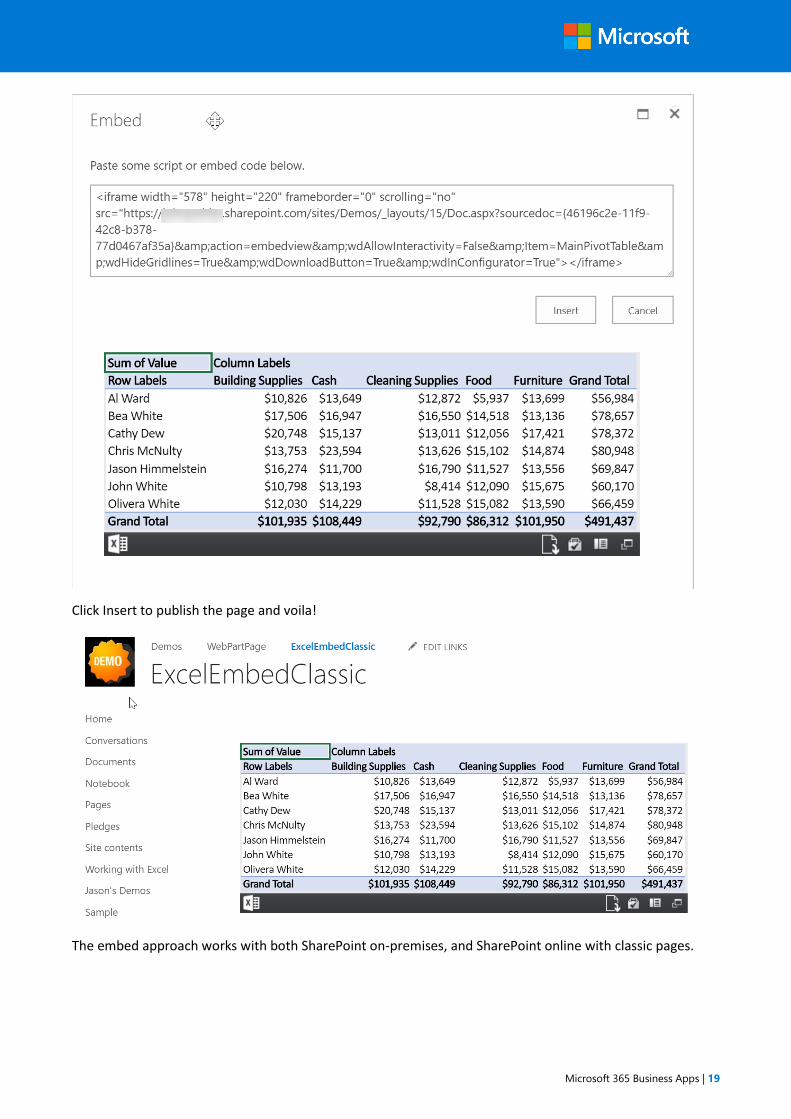
Microsoft 365 Business Apps | 19
Click Insert to publish the page and voila!
The embed approach works with both SharePoint on-premises, and SharePoint online with classic pages.
Microsoft 365 Business Apps | 20
Paginated Reports SQL Server Reporting Services (SSRS) reports have been around since 2004 and are one of the most relied
upon methods of reporting. While SharePoint Integrated mode is a thing of the past, there are still ways to
display SSRS reports in a SharePoint in both classic and modern pages.
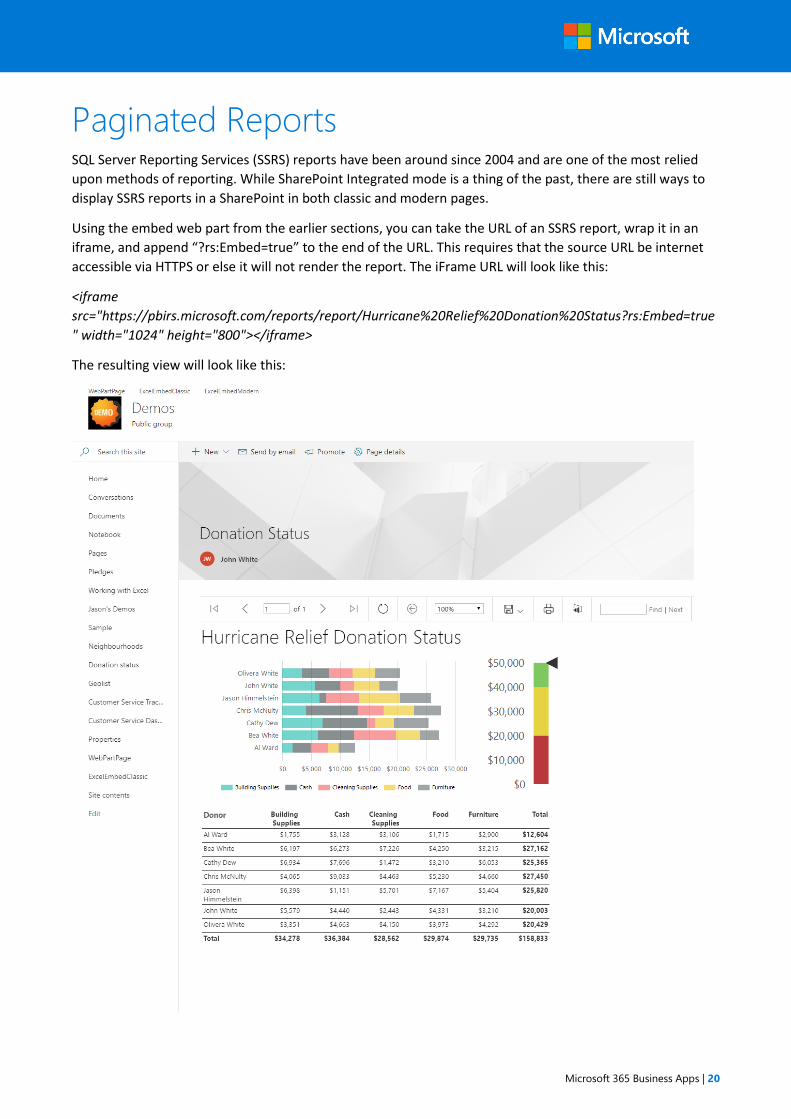
Using the embed web part from the earlier sections, you can take the URL of an SSRS report, wrap it in an
iframe, and append “?rs:Embed=true” to the end of the URL. This requires that the source URL be internet
accessible via HTTPS or else it will not render the report. The iFrame URL will look like this:
<iframe
src="https://pbirs.microsoft.com/reports/report/Hurricane%20Relief%20Donation%20Status?rs:Embed=true
" width="1024" height="800"></iframe>
The resulting view will look like this:
Microsoft 365 Business Apps | 21
Using SharePoint pages in Teams SharePoint pages in Microsoft 365 can be embedded into Microsoft Teams with full fidelity and interactivity.
Doing this allows organizations to not only distribute dashboards, but to spark conversations around the
dashboard, clarifying their meaning, or suggesting improvements.
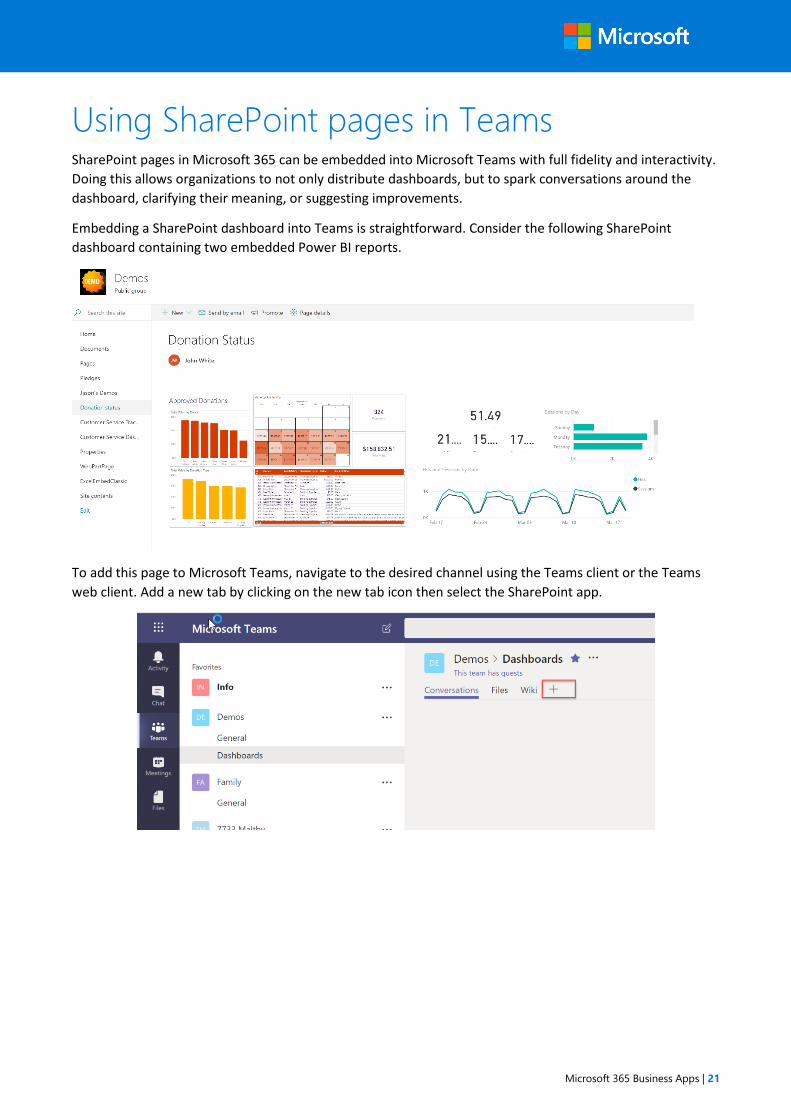
Embedding a SharePoint dashboard into Teams is straightforward. Consider the following SharePoint
dashboard containing two embedded Power BI reports.
To add this page to Microsoft Teams, navigate to the desired channel using the Teams client or the Teams
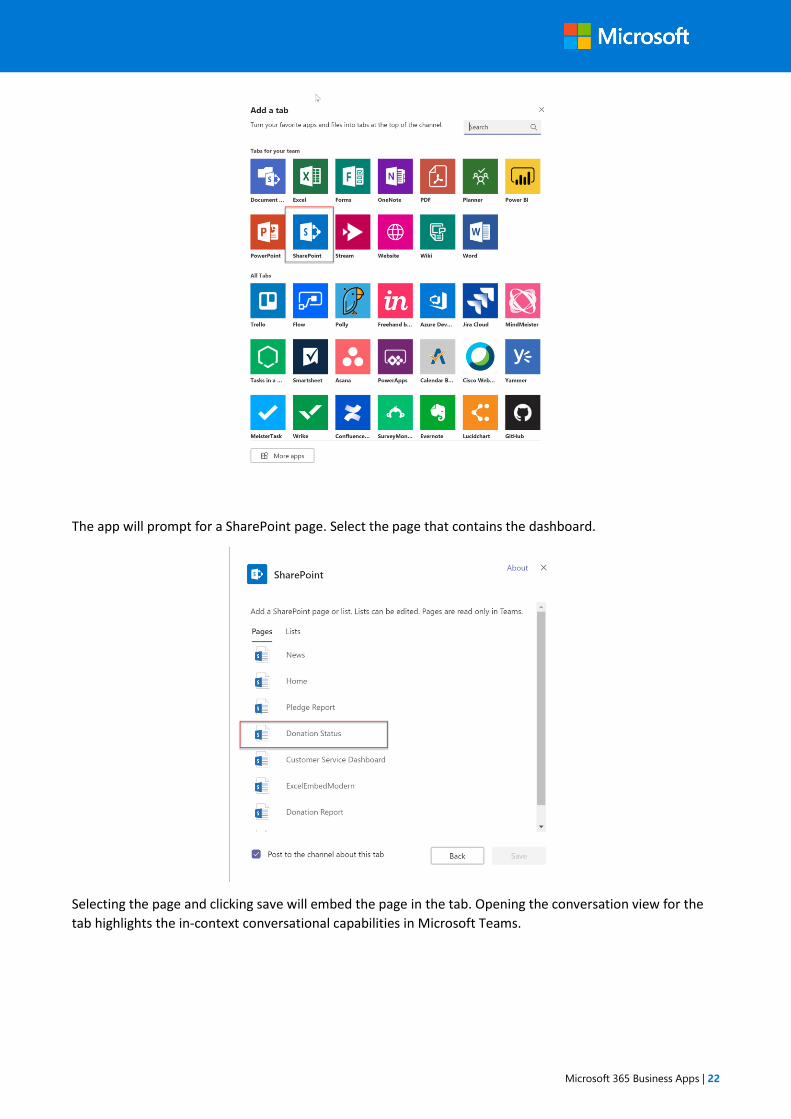
web client. Add a new tab by clicking on the new tab icon then select the SharePoint app.
Microsoft 365 Business Apps | 22
The app will prompt for a SharePoint page. Select the page that contains the dashboard.
Selecting the page and clicking save will embed the page in the tab. Opening the conversation view for the
tab highlights the in-context conversational capabilities in Microsoft Teams.
Microsoft 365 Business Apps | 23
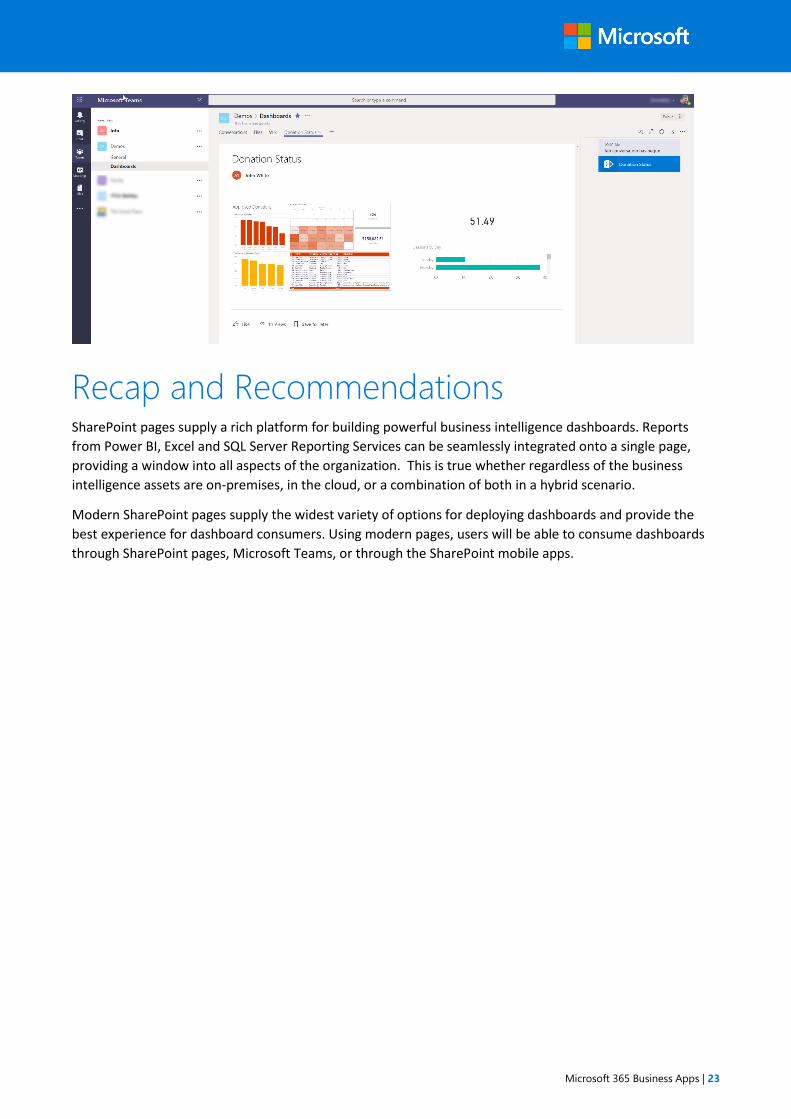
Recap and Recommendations SharePoint pages supply a rich platform for building powerful business intelligence dashboards. Reports
from Power BI, Excel and SQL Server Reporting Services can be seamlessly integrated onto a single page,
providing a window into all aspects of the organization. This is true whether regardless of the business
intelligence assets are on-premises, in the cloud, or a combination of both in a hybrid scenario.
Modern SharePoint pages supply the widest variety of options for deploying dashboards and provide the
best experience for dashboard consumers. Using modern pages, users will be able to consume dashboards
through SharePoint pages, Microsoft Teams, or through the SharePoint mobile apps.