Embed Size (px)
Citation preview
Associated Gas in Russia – Appendices | Page 1 December 2007
Gas Group Consulting
Using Russia’s Associated Gas
Appendices
10 December 2007
Associated Gas in Russia – Appendices | Page 2 December 2007
Gas Group Consulting
APPENDICES
Item Title Page
Appendix A Estimating Russia’s flared gas volumes
Appendix B Western Siberian Pipelines: Current and Projected Utilization
Appendix C Economic Analysis of Options for Utilizing Associated Gas
Appendix D International Review of Policies Designed to Limit Gas Flaring
Appendix E Economics of APG Gathering Pipelines
Appendix F Associated Gas Utilization Plans of Russian Oil Producers
Appendix G Gas Processing Plants and Sibur Holdings JSC
Associated Gas in Russia – Appendices | Page 3 December 2007
Gas Group Consulting
Appendix A
Estimating Russia’s Flared Gas Volumes
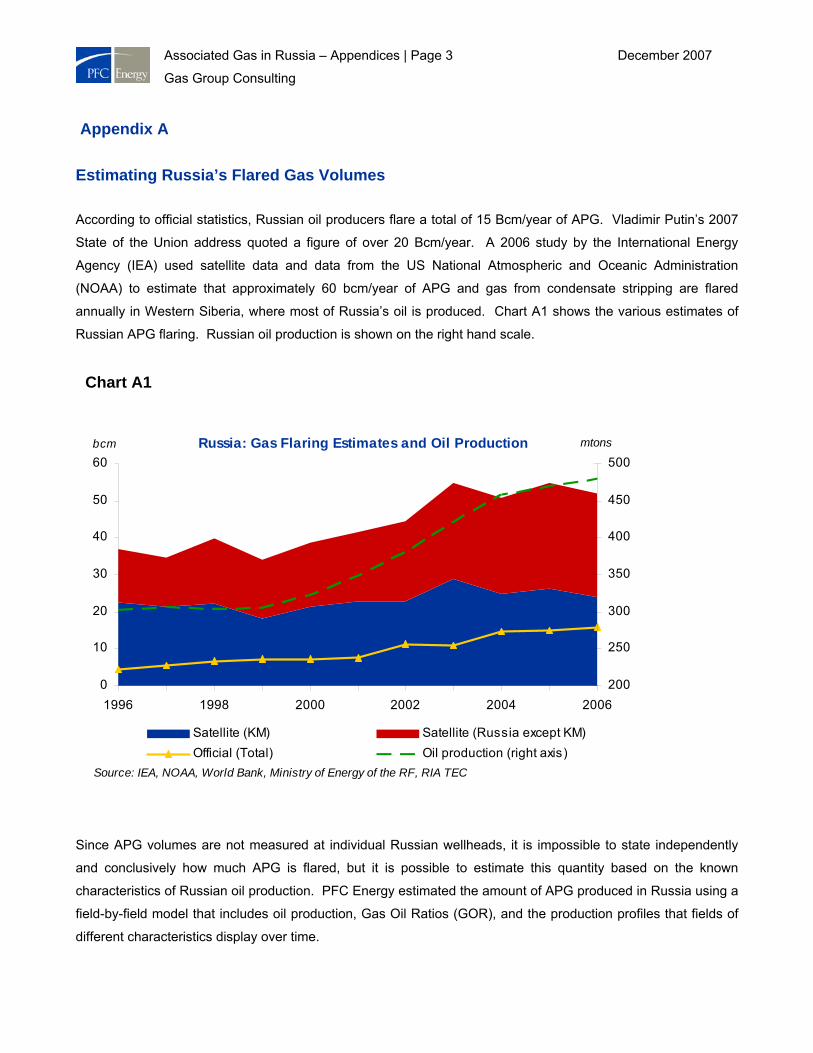
According to official statistics, Russian oil producers flare a total of 15 Bcm/year of APG. Vladimir Putin’s 2007
State of the Union address quoted a figure of over 20 Bcm/year. A 2006 study by the International Energy
Agency (IEA) used satellite data and data from the US National Atmospheric and Oceanic Administration
(NOAA) to estimate that approximately 60 bcm/year of APG and gas from condensate stripping are flared
annually in Western Siberia, where most of Russia’s oil is produced. Chart A1 shows the various estimates of
Russian APG flaring. Russian oil production is shown on the right hand scale.
Since APG volumes are not measured at individual Russian wellheads, it is impossible to state independently
and conclusively how much APG is flared, but it is possible to estimate this quantity based on the known
characteristics of Russian oil production. PFC Energy estimated the amount of APG produced in Russia using a
field-by-field model that includes oil production, Gas Oil Ratios (GOR), and the production profiles that fields of
different characteristics display over time.
Chart A1
Russia: Gas Flaring Estimates and Oil Production
0
10
20
30
40
50
60
1996 1998 2000 2002 2004 2006
bcm
200
250
300
350
400
450
500mtons
Satellite (KM) Satellite (Russia except KM)Official (Total) Oil production (right axis)
Source: IEA, NOAA, World Bank, Ministry of Energy of the RF, RIA TEC
Associated Gas in Russia – Appendices | Page 4 December 2007
Gas Group Consulting
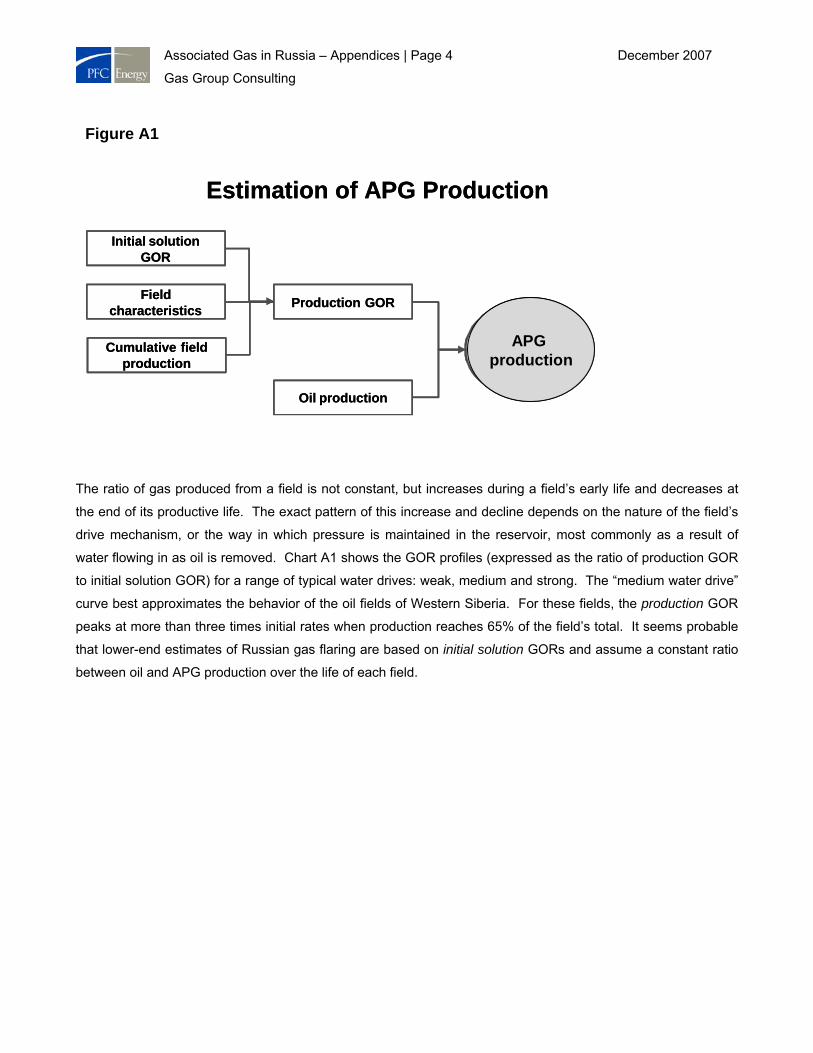
The ratio of gas produced from a field is not constant, but increases during a field’s early life and decreases at
the end of its productive life. The exact pattern of this increase and decline depends on the nature of the field’s
drive mechanism, or the way in which pressure is maintained in the reservoir, most commonly as a result of
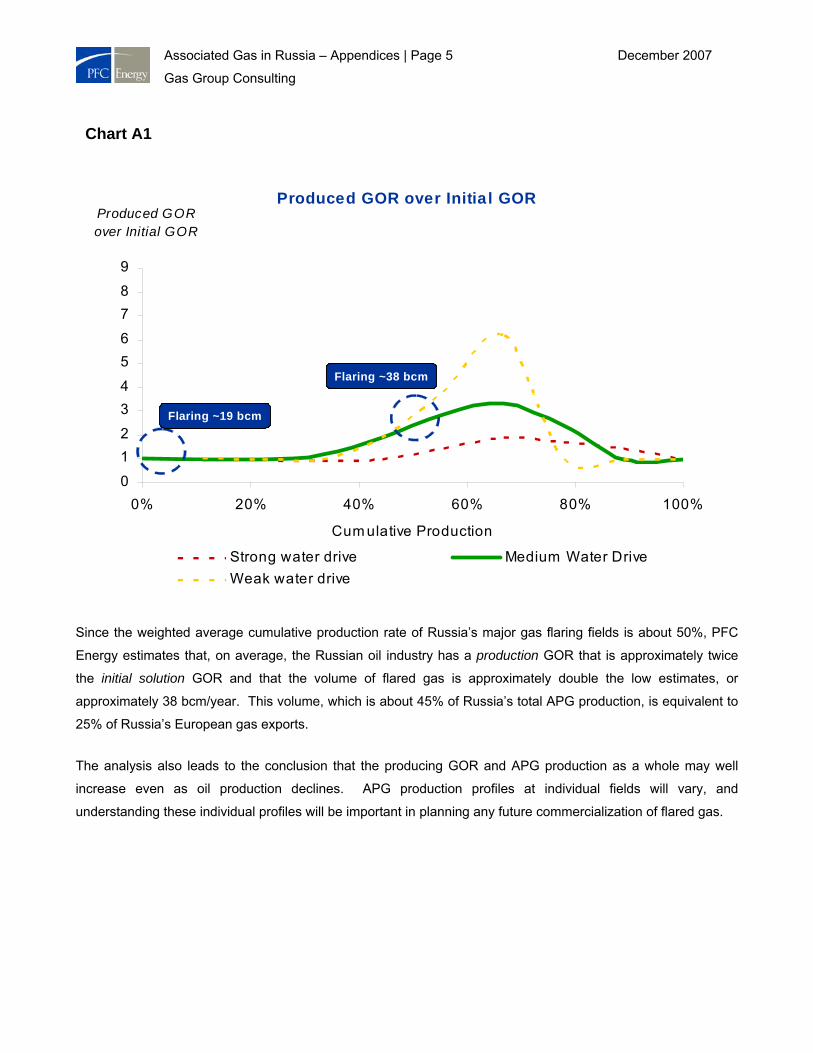
water flowing in as oil is removed. Chart A1 shows the GOR profiles (expressed as the ratio of production GOR
to initial solution GOR) for a range of typical water drives: weak, medium and strong. The “medium water drive”
curve best approximates the behavior of the oil fields of Western Siberia. For these fields, the production GOR
peaks at more than three times initial rates when production reaches 65% of the field’s total. It seems probable
that lower-end estimates of Russian gas flaring are based on initial solution GORs and assume a constant ratio
between oil and APG production over the life of each field.
Figure A1
Initial solution GOR
Production GOR
Oil production
Field characteristics
Cumulative field production
ANG production
APG production
Estimation of APG Production
Initial solution GOR
Production GOR
Oil production
Field characteristics
Cumulative field production
ANG production
APG production
Estimation of APG Production
Associated Gas in Russia – Appendices | Page 5 December 2007
Gas Group Consulting
Since the weighted average cumulative production rate of Russia’s major gas flaring fields is about 50%, PFC
Energy estimates that, on average, the Russian oil industry has a production GOR that is approximately twice
the initial solution GOR and that the volume of flared gas is approximately double the low estimates, or
approximately 38 bcm/year. This volume, which is about 45% of Russia’s total APG production, is equivalent to
25% of Russia’s European gas exports.
The analysis also leads to the conclusion that the producing GOR and APG production as a whole may well
increase even as oil production declines. APG production profiles at individual fields will vary, and
understanding these individual profiles will be important in planning any future commercialization of flared gas.
Chart A1
Produced GOR over Initia l GOR
0
12
34
56
78
9
0% 20% 40% 60% 80% 100%
Cum ulative Production
Produced GOR over Initial GOR
Strong water drive Medium Water DriveWeak water drive
Flaring ~19 bcm
Flaring ~38 bcm

Associated Gas in Russia – Appendices | Page 6 December 2007
Gas Group Consulting
Appendix B
Western Siberian Gas Pipelines: Current and Projected Utilization
If APG from Western Siberian oilfields is to be sold for export or to Russia’s largest domestic markets in the
European part of the country, it must be transported through existing or future long-distance pipelines. This
appendix examines the routes and capacities of those pipelines and the current and projected availability of
capacity in these pipelines to carry substantial additional volumes.
Analysis of Russia’s pipeline infrastructure is complicated by the lack of detailed information on capacities,
technical factors, and actual operating and field performance. This analysis uses published information and PFC
Energy’s proprietary models to identify key issues and probable constraints.
Current Capacity Utilization in the Gazprom Pipeline System
Most of Russia’s gas production must be transmitted considerable distances to consumption centers in
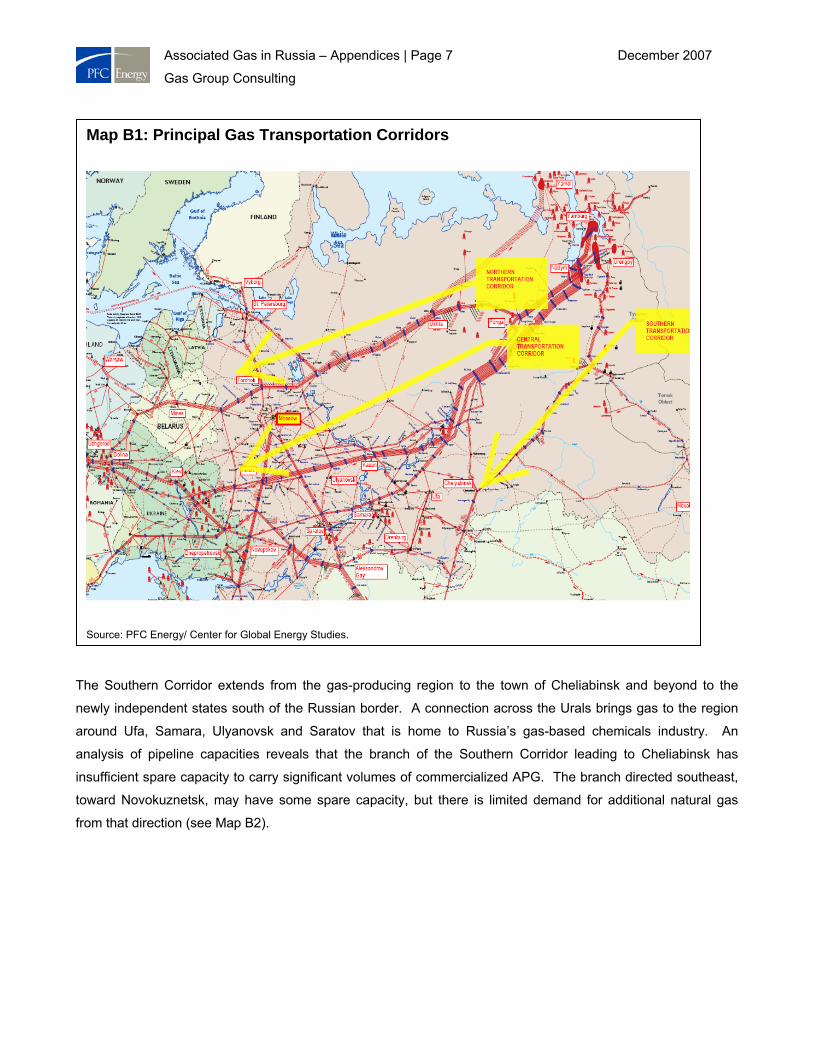
European Russia and export markets in Western and Central Europe. Three main arteries of the Russian gas
transportation system (UGTS) transport gas from Western Siberia to these centers. These are (1) the Southern
Corridor, (2) the Central Transportation Corridor, and the (3) Northern Corridor shown in Map B1.
Associated Gas in Russia – Appendices | Page 7 December 2007
Gas Group Consulting
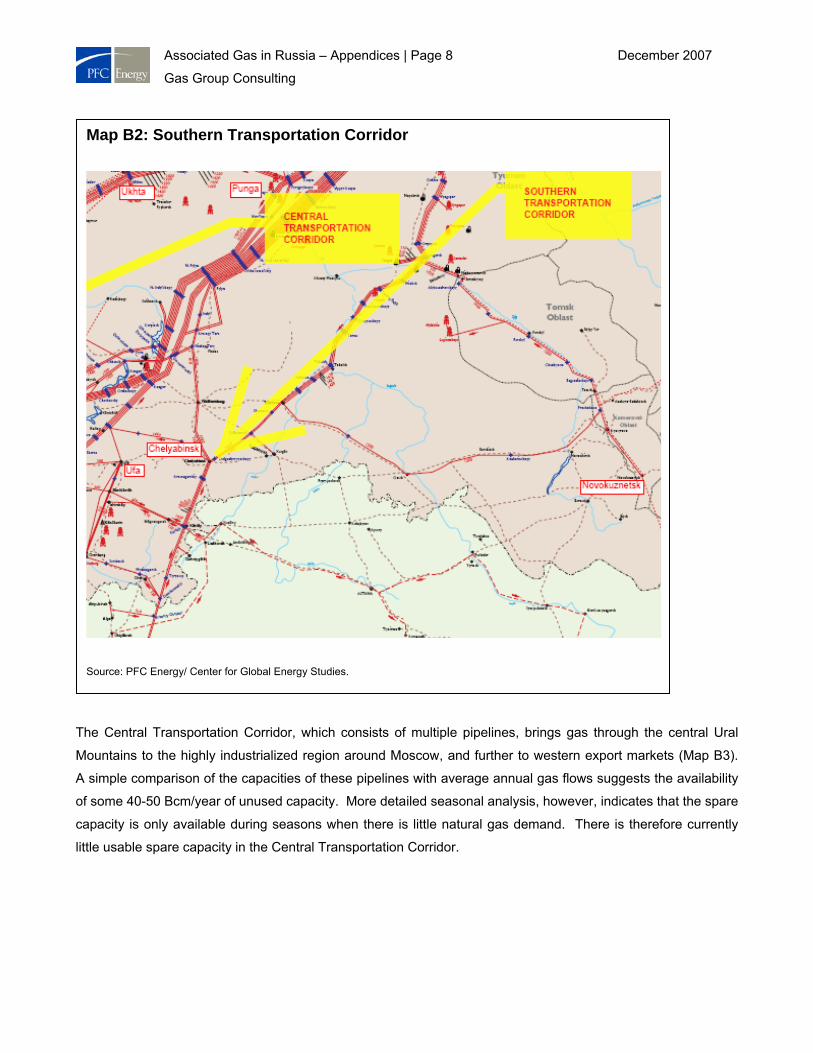
The Southern Corridor extends from the gas-producing region to the town of Cheliabinsk and beyond to the
newly independent states south of the Russian border. A connection across the Urals brings gas to the region
around Ufa, Samara, Ulyanovsk and Saratov that is home to Russia’s gas-based chemicals industry. An
analysis of pipeline capacities reveals that the branch of the Southern Corridor leading to Cheliabinsk has
insufficient spare capacity to carry significant volumes of commercialized APG. The branch directed southeast,
toward Novokuznetsk, may have some spare capacity, but there is limited demand for additional natural gas
from that direction (see Map B2).
Map B1: Principal Gas Transportation Corridors
Source: PFC Energy/ Center for Global Energy Studies.
Associated Gas in Russia – Appendices | Page 8 December 2007
Gas Group Consulting
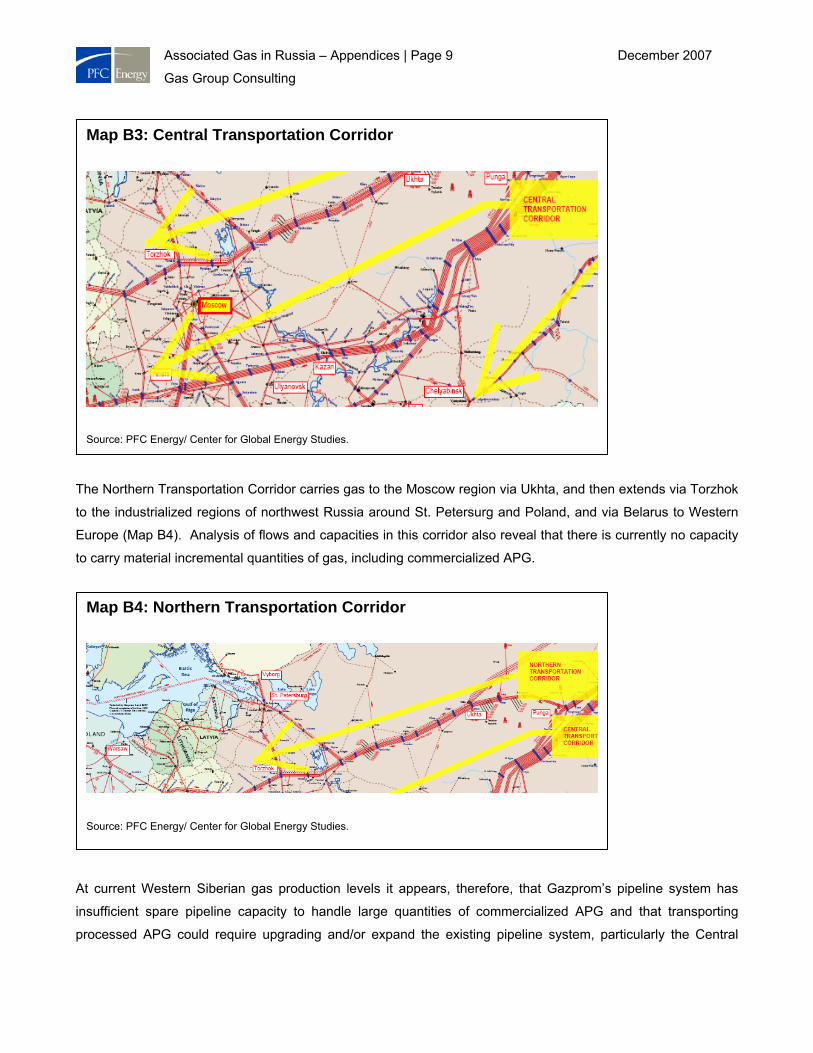
The Central Transportation Corridor, which consists of multiple pipelines, brings gas through the central Ural
Mountains to the highly industrialized region around Moscow, and further to western export markets (Map B3).
A simple comparison of the capacities of these pipelines with average annual gas flows suggests the availability
of some 40-50 Bcm/year of unused capacity. More detailed seasonal analysis, however, indicates that the spare
capacity is only available during seasons when there is little natural gas demand. There is therefore currently
little usable spare capacity in the Central Transportation Corridor.
Map B2: Southern Transportation Corridor
Source: PFC Energy/ Center for Global Energy Studies.
Associated Gas in Russia – Appendices | Page 9 December 2007
Gas Group Consulting
The Northern Transportation Corridor carries gas to the Moscow region via Ukhta, and then extends via Torzhok
to the industrialized regions of northwest Russia around St. Petersurg and Poland, and via Belarus to Western
Europe (Map B4). Analysis of flows and capacities in this corridor also reveal that there is currently no capacity
to carry material incremental quantities of gas, including commercialized APG.
At current Western Siberian gas production levels it appears, therefore, that Gazprom’s pipeline system has
insufficient spare pipeline capacity to handle large quantities of commercialized APG and that transporting
processed APG could require upgrading and/or expand the existing pipeline system, particularly the Central
Map B3: Central Transportation Corridor
Source: PFC Energy/ Center for Global Energy Studies.
Map B4: Northern Transportation Corridor
Source: PFC Energy/ Center for Global Energy Studies.
Associated Gas in Russia – Appendices | Page 10 December 2007
Gas Group Consulting
Corridor, which links to the areas of highest demand in the Moscow region and via Ukraine to Europe.
Gas Production Outlook from Existing Fields in Western Siberia
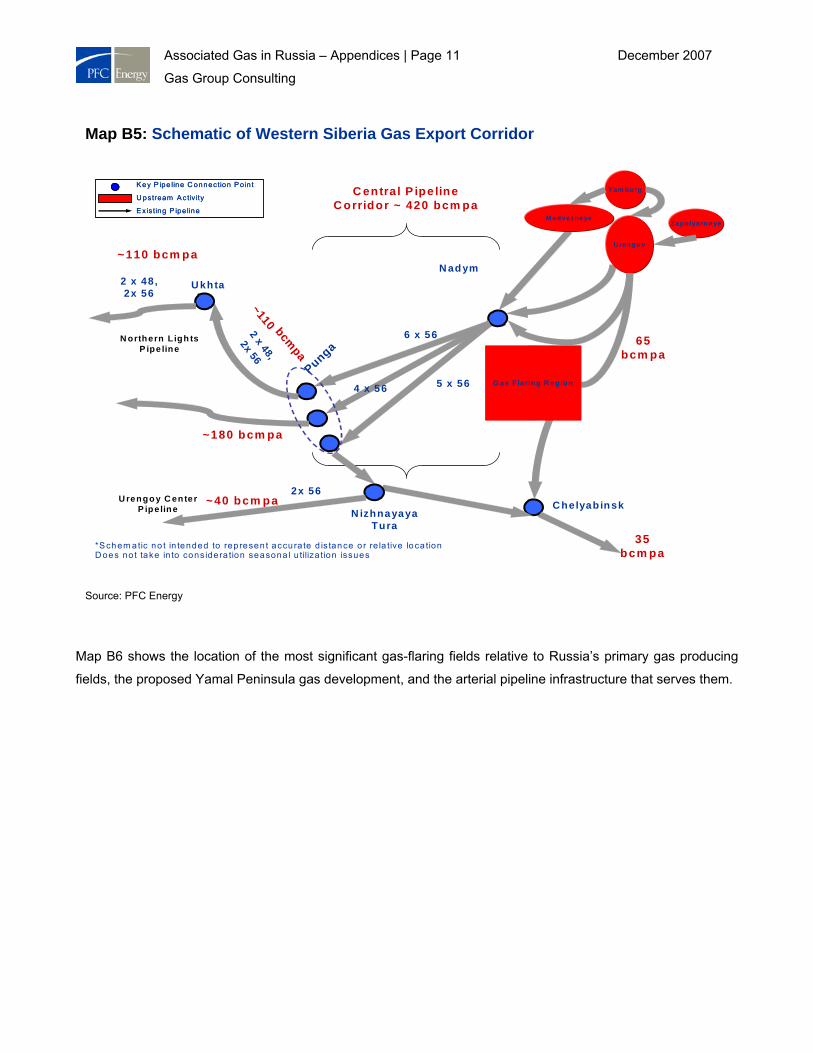
Whether the existing pipeline system could transport an additional 20 - 30 Bcm1 of currently flared gas depends
on future projected natural gas and APG output and the potential to expand and upgrade the aging pipeline
system (ref Map B5)/
1 Estimated dry gas volume based on assumed 60% methane content of APG
Associated Gas in Russia – Appendices | Page 11 December 2007
Gas Group Consulting
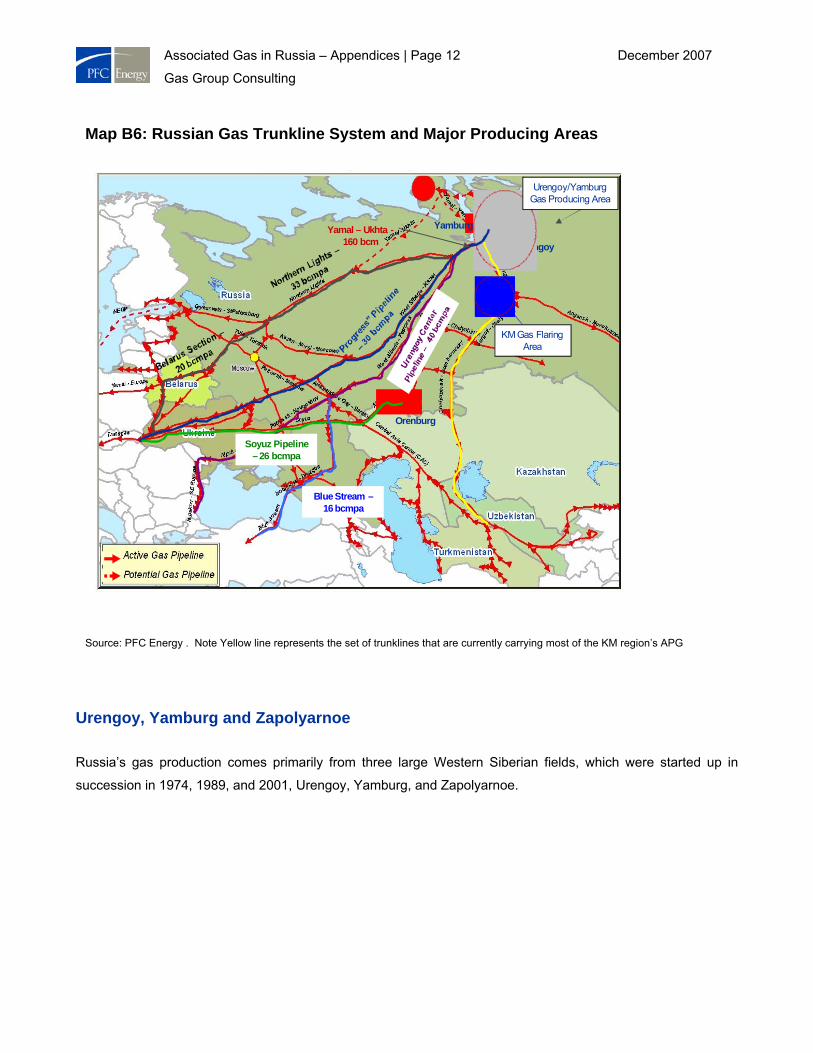
Map B6 shows the location of the most significant gas-flaring fields relative to Russia’s primary gas producing
fields, the proposed Yamal Peninsula gas development, and the arterial pipeline infrastructure that serves them.
Map B5: Schematic of Western Siberia Gas Export Corridor
U rengo y
N ad ym
N izhnayayaTura
M edvezhe ye
Yam burg
Punga
U khta
N orthern L igh ts P ipe line
C helyabinsk
2 x 48, 2x 56
6 x 56
5 x 56 4 x 56
C entra l P ipe line C orridor ~ 420 bcm pa
65 bcm pa
~110 bcmpa
2x 56
2 x 48,
2x 56
35 bcm pa
U rengo y C enter P ipe line
G as F laring R eg io n
*S chem atic no t in tended to represen t accurate d is tance o r re la tive loca tion D oes no t take in to considera tion seasona l u tiliza tion issues
K ey P ipe line C onnection P o in t
U pstream A ctiv ity
E x is ting P ipe line
K ey P ipe line C onnection P o in t
U pstream A ctiv ity
E x is ting P ipe line
~180 bcm pa
~40 bcm pa
Zapolyarno ye
~110 bcm pa
Source: PFC Energy
Associated Gas in Russia – Appendices | Page 12 December 2007
Gas Group Consulting
Urengoy, Yamburg and Zapolyarnoe
Russia’s gas production comes primarily from three large Western Siberian fields, which were started up in
succession in 1974, 1989, and 2001, Urengoy, Yamburg, and Zapolyarnoe.
Map B6: Russian Gas Trunkline System and Major Producing Areas
Urengoy
Orenburg
Yamburg
Urengoy/YamburgGas Producing Area
Blue Stream –16 bcmpa
Yamal – Ukhta -160 bcm
Soyuz Pipeline – 26 bcmpa
KM Gas Flaring Area
Source: PFC Energy . Note Yellow line represents the set of trunklines that are currently carrying most of the KM region’s APG
Associated Gas in Russia – Appendices | Page 13 December 2007
Gas Group Consulting
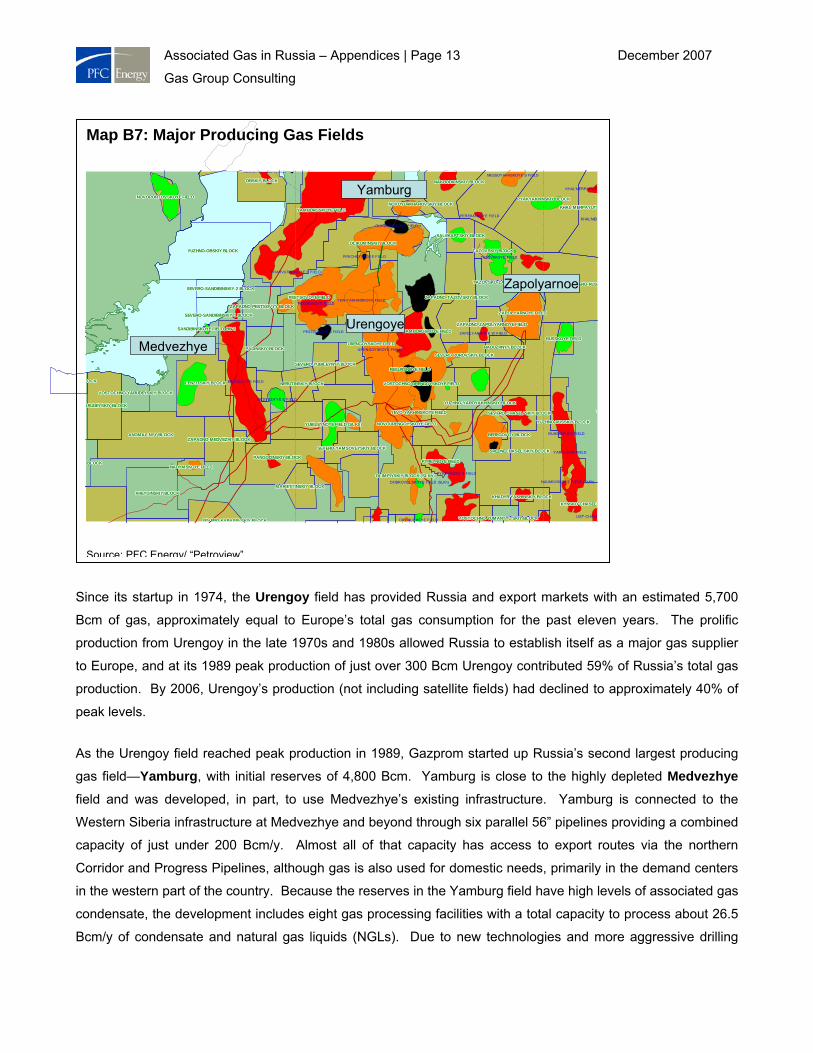
Since its startup in 1974, the Urengoy field has provided Russia and export markets with an estimated 5,700
Bcm of gas, approximately equal to Europe’s total gas consumption for the past eleven years. The prolific
production from Urengoy in the late 1970s and 1980s allowed Russia to establish itself as a major gas supplier
to Europe, and at its 1989 peak production of just over 300 Bcm Urengoy contributed 59% of Russia’s total gas
production. By 2006, Urengoy’s production (not including satellite fields) had declined to approximately 40% of
peak levels.
As the Urengoy field reached peak production in 1989, Gazprom started up Russia’s second largest producing
gas field—Yamburg, with initial reserves of 4,800 Bcm. Yamburg is close to the highly depleted Medvezhye
field and was developed, in part, to use Medvezhye’s existing infrastructure. Yamburg is connected to the
Western Siberia infrastructure at Medvezhye and beyond through six parallel 56” pipelines providing a combined
capacity of just under 200 Bcm/y. Almost all of that capacity has access to export routes via the northern
Corridor and Progress Pipelines, although gas is also used for domestic needs, primarily in the demand centers
in the western part of the country. Because the reserves in the Yamburg field have high levels of associated gas
condensate, the development includes eight gas processing facilities with a total capacity to process about 26.5
Bcm/y of condensate and natural gas liquids (NGLs). Due to new technologies and more aggressive drilling
Map B7: Major Producing Gas Fields
ANOMAL'NYY BLOCKANOMAL'NYY BLOCKANOMAL'NYY BLOCKANOMAL'NYY BLOCKANOMAL'NYY BLOCKANOMAL'NYY BLOCKANOMAL'NYY BLOCKANOMAL'NYY BLOCKANOMAL'NYY BLOCK BEREGOVOY BLOCKBEREGOVOY BLOCKBEREGOVOY BLOCKBEREGOVOY BLOCKBEREGOVOY BLOCKBEREGOVOY BLOCKBEREGOVOY BLOCKBEREGOVOY BLOCKBEREGOVOY BLOCK
KHADYR'YAKHINSKIY BLOCKKHADYR'YAKHINSKIY BLOCKKHADYR'YAKHINSKIY BLOCKKHADYR'YAKHINSKIY BLOCKKHADYR'YAKHINSKIY BLOCKKHADYR'YAKHINSKIY BLOCKKHADYR'YAKHINSKIY BLOCKKHADYR'YAKHINSKIY BLOCKKHADYR'YAKHINSKIY BLOCK
KHAL'MERPAYUTIKHAL'MERPAYUTIKHAL'MERPAYUTIKHAL'MERPAYUTIKHAL'MERPAYUTIKHAL'MERPAYUTIKHAL'MERPAYUTIKHAL'MERPAYUTIKHAL'MERPAYUTI
KHEYGINSKIY BLOCKKHEYGINSKIY BLOCKKHEYGINSKIY BLOCKKHEYGINSKIY BLOCKKHEYGINSKIY BLOCKKHEYGINSKIY BLOCKKHEYGINSKIY BLOCKKHEYGINSKIY BLOCKKHEYGINSKIY BLOCK
OCKOCKOCKLOCKLOCKLOCKLOCKLOCKLOCK
KYNSKO-CHASEL'KYNSKO-CHASEL'KYNSKO-CHASEL'KYNSKO-CHASEL'KYNSKO-CHASEL'KYNSKO-CHASELKYNSKO-CHASELKYNSKO-CHASELKYNSKO-CHASEL'
LENZITSKIY BLOCKLENZITSKIY BLOCKLENZITSKIY BLOCKLENZITSKIY BLOCKLENZITSKIY BLOCKLENZITSKIY BLOCKLENZITSKIY BLOCKLENZITSKIY BLOCKLENZITSKIY BLOCK
MARIETTINSKIY BLOCKMARIETTINSKIY BLOCKMARIETTINSKIY BLOCKMARIETTINSKIY BLOCKMARIETTINSKIY BLOCKMARIETTINSKIY BLOCKMARIETTINSKIY BLOCKMARIETTINSKIY BLOCKMARIETTINSKIY BLOCK
NADYMSKOYE FIELDNADYMSKOYE FIELDNADYMSKOYE FIELDNADYMSKOYE FIELDNADYMSKOYE FIELDNADYMSKOYE FIELDNADYMSKOYE FIELDNADYMSKOYE FIELDNADYMSKOYE FIELD
NAKHODKINSKIY BLOCKNAKHODKINSKIY BLOCKNAKHODKINSKIY BLOCKNAKHODKINSKIY BLOCKNAKHODKINSKIY BLOCKNAKHODKINSKIY BLOCKNAKHODKINSKIY BLOCKNAKHODKINSKIY BLOCKNAKHODKINSKIY BLOCK
NERUTINSKIY BLOCKNERUTINSKIY BLOCKNERUTINSKIY BLOCKNERUTINSKIY BLOCKNERUTINSKIY BLOCKNERUTINSKIY BLOCKNERUTINSKIY BLOCKNERUTINSKIY BLOCKNERUTINSKIY BLOCK
NOVOPORTOVSKOYE FIELDNOVOPORTOVSKOYE FIELDNOVOPORTOVSKOYE FIELDNOVOPORTOVSKOYE FIELDNOVOPORTOVSKOYE FIELDNOVOPORTOVSKOYE FIELDNOVOPORTOVSKOYE FIELDNOVOPORTOVSKOYE FIELDNOVOPORTOVSKOYE FIELD
NOVOURENGOYSKOYE FIELDNOVOURENGOYSKOYE FIELDNOVOURENGOYSKOYE FIELDNOVOURENGOYSKOYE FIELDNOVOURENGOYSKOYE FIELDNOVOURENGOYSKOYE FIELDNOVOURENGOYSKOYE FIELDNOVOURENGOYSKOYE FIELDNOVOURENGOYSKOYE FIELD
NOVOYURKHAROVSKIY BLOCKNOVOYURKHAROVSKIY BLOCKNOVOYURKHAROVSKIY BLOCKNOVOYURKHAROVSKIY BLOCKNOVOYURKHAROVSKIY BLOCKNOVOYURKHAROVSKIY BLOCKNOVOYURKHAROVSKIY BLOCKNOVOYURKHAROVSKIY BLOCKNOVOYURKHAROVSKIY BLOCK
OBSKIY BLOCKOBSKIY BLOCKOBSKIY BLOCKOBSKIY BLOCKOBSKIY BLOCKOBSKIY BLOCKOBSKIY BLOCKOBSKIY BLOCKOBSKIY BLOCK
OLIKUMINSKIY BLOCKOLIKUMINSKIY BLOCKOLIKUMINSKIY BLOCKOLIKUMINSKIY BLOCKOLIKUMINSKIY BLOCKOLIKUMINSKIY BLOCKOLIKUMINSKIY BLOCKOLIKUMINSKIY BLOCKOLIKUMINSKIY BLOCK
OLIMPIYSKIY BLOCK (SLKh)OLIMPIYSKIY BLOCK (SLKh)OLIMPIYSKIY BLOCK (SLKh)OLIMPIYSKIY BLOCK (SLKh)OLIMPIYSKIY BLOCK (SLKh)OLIMPIYSKIY BLOCK (SLKh)OLIMPIYSKIY BLOCK (SLKh)OLIMPIYSKIY BLOCK (SLKh)OLIMPIYSKIY BLOCK (SLKh)
PADINSKIY BLOCKPADINSKIY BLOCKPADINSKIY BLOCKPADINSKIY BLOCKPADINSKIY BLOCKPADINSKIY BLOCKPADINSKIY BLOCKPADINSKIY BLOCKPADINSKIY BLOCK
PANGODINSKIY BLOCKPANGODINSKIY BLOCKPANGODINSKIY BLOCKPANGODINSKIY BLOCKPANGODINSKIY BLOCKPANGODINSKIY BLOCKPANGODINSKIY BLOCKPANGODINSKIY BLOCKPANGODINSKIY BLOCK
PESTSOVOYE FIELDPESTSOVOYE FIELDPESTSOVOYE FIELDPESTSOVOYE FIELDPESTSOVOYE FIELDPESTSOVOYE FIELDPESTSOVOYE FIELDPESTSOVOYE FIELDPESTSOVOYE FIELD
PYAKYAKHINSKIY BLOCKPYAKYAKHINSKIY BLOCKPYAKYAKHINSKIY BLOCKPYAKYAKHINSKIY BLOCKPYAKYAKHINSKIY BLOCKPYAKYAKHINSKIY BLOCKPYAKYAKHINSKIY BLOCKPYAKYAKHINSKIY BLOCKPYAKYAKHINSKIY BLOCK
PYREYNOYE FIELDPYREYNOYE FIELDPYREYNOYE FIELDPYREYNOYE FIELDPYREYNOYE FIELDPYREYNOYE FIELDPYREYNOYE FIELDPYREYNOYE FIELDPYREYNOYE FIELD
RADUZHNYY BLOCKRADUZHNYY BLOCKRADUZHNYY BLOCKRADUZHNYY BLOCKRADUZHNYY BLOCKRADUZHNYY BLOCKRADUZHNYY BLOCKRADUZHNYY BLOCKRADUZHNYY BLOCK
RESURSNOYE FIELDRESURSNOYE FIELDRESURSNOYE FIELDRESURSNOYE FIELDRESURSNOYE FIELDRESURSNOYE FIELDRESURSNOYE FIELDRESURSNOYE FIELDRESURSNOYE FIELD
RUSSKOYE FIELDRUSSKOYE FIELDRUSSKOYE FIELDRUSSKOYE FIELDRUSSKOYE FIELDRUSSKOYE FIELDRUSSKOYE FIELDRUSSKOYE FIELDRUSSKOYE FIELD
SALEKAPTSKIY BLOCKSALEKAPTSKIY BLOCKSALEKAPTSKIY BLOCKSALEKAPTSKIY BLOCKSALEKAPTSKIY BLOCKSALEKAPTSKIY BLOCKSALEKAPTSKIY BLOCKSALEKAPTSKIY BLOCKSALEKAPTSKIY BLOCK
SAMBURGSKOYE FIELDSAMBURGSKOYE FIELDSAMBURGSKOYE FIELDSAMBURGSKOYE FIELDSAMBURGSKOYE FIELDSAMBURGSKOYE FIELDSAMBURGSKOYE FIELDSAMBURGSKOYE FIELDSAMBURGSKOYE FIELDSANDIBINSKOYE FIELD; BN-6SANDIBINSKOYE FIELD; BN-6SANDIBINSKOYE FIELD; BN-6SANDIBINSKOYE FIELD; BN-6SANDIBINSKOYE FIELD; BN-6SANDIBINSKOYE FIELD; BN-6SANDIBINSKOYE FIELD; BN-6SANDIBINSKOYE FIELD; BN-6SANDIBINSKOYE FIELD; BN-6
SEVERO-CHASEL'SKIY BLOCKSEVERO-CHASEL'SKIY BLOCKSEVERO-CHASEL'SKIY BLOCKSEVERO-CHASEL'SKIY BLOCKSEVERO-CHASEL'SKIY BLOCKSEVERO-CHASEL'SKIY BLOCKSEVERO-CHASEL'SKIY BLOCKSEVERO-CHASEL'SKIY BLOCKSEVERO-CHASEL'SKIY BLOCK
SEVERO-KARASEVSKIY BLOCKSEVERO-KARASEVSKIY BLOCKSEVERO-KARASEVSKIY BLOCKSEVERO-KARASEVSKIY BLOCKSEVERO-KARASEVSKIY BLOCKSEVERO-KARASEVSKIY BLOCKSEVERO-KARASEVSKIY BLOCKSEVERO-KARASEVSKIY BLOCKSEVERO-KARASEVSKIY BLOCK
SEVERO-PUROVSKIY BLOCKSEVERO-PUROVSKIY BLOCKSEVERO-PUROVSKIY BLOCKSEVERO-PUROVSKIY BLOCKSEVERO-PUROVSKIY BLOCKSEVERO-PUROVSKIY BLOCKSEVERO-PUROVSKIY BLOCKSEVERO-PUROVSKIY BLOCKSEVERO-PUROVSKIY BLOCK
SEVERO-RUSSSEVERO-RUSSSEVERO-RUSSSEVERO-RUSSEVERO-RUSSEVERO-RUSSEVERO-RUSSEVERO-RUSSEVERO-RUS
SEVERO-SANDIBINSKIY-1 BLOCKSEVERO-SANDIBINSKIY-1 BLOCKSEVERO-SANDIBINSKIY-1 BLOCKSEVERO-SANDIBINSKIY-1 BLOCKSEVERO-SANDIBINSKIY-1 BLOCKSEVERO-SANDIBINSKIY-1 BLOCKSEVERO-SANDIBINSKIY-1 BLOCKSEVERO-SANDIBINSKIY-1 BLOCKSEVERO-SANDIBINSKIY-1 BLOCK
SEVERO-SANDIBINSKIY-2 BLOCKSEVERO-SANDIBINSKIY-2 BLOCKSEVERO-SANDIBINSKIY-2 BLOCKSEVERO-SANDIBINSKIY-2 BLOCKSEVERO-SANDIBINSKIY-2 BLOCKSEVERO-SANDIBINSKIY-2 BLOCKSEVERO-SANDIBINSKIY-2 BLOCKSEVERO-SANDIBINSKIY-2 BLOCKSEVERO-SANDIBINSKIY-2 BLOCK
SEVERO-YAMSOVEYSKIY BLOCKSEVERO-YAMSOVEYSKIY BLOCKSEVERO-YAMSOVEYSKIY BLOCKSEVERO-YAMSOVEYSKIY BLOCKSEVERO-YAMSOVEYSKIY BLOCKSEVERO-YAMSOVEYSKIY BLOCKSEVERO-YAMSOVEYSKIY BLOCKSEVERO-YAMSOVEYSKIY BLOCKSEVERO-YAMSOVEYSKIY BLOCK
SEVERO-YUBILEYNYY BLOCKSEVERO-YUBILEYNYY BLOCKSEVERO-YUBILEYNYY BLOCKSEVERO-YUBILEYNYY BLOCKSEVERO-YUBILEYNYY BLOCKSEVERO-YUBILEYNYY BLOCKSEVERO-YUBILEYNYY BLOCKSEVERO-YUBILEYNYY BLOCKSEVERO-YUBILEYNYY BLOCK
SREDNECHASEL'SKIY BLOCKSREDNECHASEL'SKIY BLOCKSREDNECHASEL'SKIY BLOCKSREDNECHASEL'SKIY BLOCKSREDNECHASEL'SKIY BLOCKSREDNECHASEL'SKIY BLOCKSREDNECHASEL'SKIY BLOCKSREDNECHASEL'SKIY BLOCKSREDNECHASEL'SKIY BLOCK
TAZOVSKIY BLOCKTAZOVSKIY BLOCKTAZOVSKIY BLOCKTAZOVSKIY BLOCKTAZOVSKIY BLOCKTAZOVSKIY BLOCKTAZOVSKIY BLOCKTAZOVSKIY BLOCKTAZOVSKIY BLOCK
TAZOVSKO-ZAPOLYARNYY BLOCKTAZOVSKO-ZAPOLYARNYY BLOCKTAZOVSKO-ZAPOLYARNYY BLOCKTAZOVSKO-ZAPOLYARNYY BLOCKTAZOVSKO-ZAPOLYARNYY BLOCKTAZOVSKO-ZAPOLYARNYY BLOCKTAZOVSKO-ZAPOLYARNYY BLOCKTAZOVSKO-ZAPOLYARNYY BLOCKTAZOVSKO-ZAPOLYARNYY BLOCK
TTTTTTTTT
URENGOYSKOYE FIELDURENGOYSKOYE FIELDURENGOYSKOYE FIELDURENGOYSKOYE FIELDURENGOYSKOYE FIELDURENGOYSKOYE FIELDURENGOYSKOYE FIELDURENGOYSKOYE FIELDURENGOYSKOYE FIELD
BLOCKBLOCKBLOCKBLOCKBLOCKBLOCKBLOCKBLOCKBLOCK
VOSTOCHNO-URENGOYSKOYE FIELDVOSTOCHNO-URENGOYSKOYE FIELDVOSTOCHNO-URENGOYSKOYE FIELDVOSTOCHNO-URENGOYSKOYE FIELDVOSTOCHNO-URENGOYSKOYE FIELDVOSTOCHNO-URENGOYSKOYE FIELDVOSTOCHNO-URENGOYSKOYE FIELDVOSTOCHNO-URENGOYSKOYE FIELDVOSTOCHNO-URENGOYSKOYE FIELD
VOSTOCHNO-YARUDEYSKIY BLOCKVOSTOCHNO-YARUDEYSKIY BLOCKVOSTOCHNO-YARUDEYSKIY BLOCKVOSTOCHNO-YARUDEYSKIY BLOCKVOSTOCHNO-YARUDEYSKIY BLOCKVOSTOCHNO-YARUDEYSKIY BLOCKVOSTOCHNO-YARUDEYSKIY BLOCKVOSTOCHNO-YARUDEYSKIY BLOCKVOSTOCHNO-YARUDEYSKIY BLOCK
VOSTOCHNO-YUMANTYL'SKIY BLOCKVOSTOCHNO-YUMANTYL'SKIY BLOCKVOSTOCHNO-YUMANTYL'SKIY BLOCKVOSTOCHNO-YUMANTYL'SKIY BLOCKVOSTOCHNO-YUMANTYL'SKIY BLOCKVOSTOCHNO-YUMANTYL'SKIY BLOCKVOSTOCHNO-YUMANTYL'SKIY BLOCKVOSTOCHNO-YUMANTYL'SKIY BLOCKVOSTOCHNO-YUMANTYL'SKIY BLOCK
YAMBURGSKOYE FIELDYAMBURGSKOYE FIELDYAMBURGSKOYE FIELDYAMBURGSKOYE FIELDYAMBURGSKOYE FIELDYAMBURGSKOYE FIELDYAMBURGSKOYE FIELDYAMBURGSKOYE FIELDYAMBURGSKOYE FIELD
ARUDEYSKIY BLOCKARUDEYSKIY BLOCKARUDEYSKIY BLOCKARUDEYSKIY BLOCKARUDEYSKIY BLOCKARUDEYSKIY BLOCKARUDEYSKIY BLOCKARUDEYSKIY BLOCKARUDEYSKIY BLOCKYEVO-YAKHINSKOYE FIELDYEVO-YAKHINSKOYE FIELDYEVO-YAKHINSKOYE FIELDYEVO-YAKHINSKOYE FIELDYEVO-YAKHINSKOYE FIELDYEVO-YAKHINSKOYE FIELDYEVO-YAKHINSKOYE FIELDYEVO-YAKHINSKOYE FIELDYEVO-YAKHINSKOYE FIELD
YUBILEYNOYE FIELD (SLKh)YUBILEYNOYE FIELD (SLKh)YUBILEYNOYE FIELD (SLKh)YUBILEYNOYE FIELD (SLKh)YUBILEYNOYE FIELD (SLKh)YUBILEYNOYE FIELD (SLKh)YUBILEYNOYE FIELD (SLKh)YUBILEYNOYE FIELD (SLKh)YUBILEYNOYE FIELD (SLKh)
YUZHNO-OBSKIY BLOCKYUZHNO-OBSKIY BLOCKYUZHNO-OBSKIY BLOCKYUZHNO-OBSKIY BLOCKYUZHNO-OBSKIY BLOCKYUZHNO-OBSKIY BLOCKYUZHNO-OBSKIY BLOCKYUZHNO-OBSKIY BLOCKYUZHNO-OBSKIY BLOCK
YUZHNO-RUSSKIY BLOCKYUZHNO-RUSSKIY BLOCKYUZHNO-RUSSKIY BLOCKYUZHNO-RUSSKIY BLOCKYUZHNO-RUSSKIY BLOCKYUZHNO-RUSSKIY BLOCKYUZHNO-RUSSKIY BLOCKYUZHNO-RUSSKIY BLOCKYUZHNO-RUSSKIY BLOCK
YUZHNO-YAROYAKHINSKIY BLOCKYUZHNO-YAROYAKHINSKIY BLOCKYUZHNO-YAROYAKHINSKIY BLOCKYUZHNO-YAROYAKHINSKIY BLOCKYUZHNO-YAROYAKHINSKIY BLOCKYUZHNO-YAROYAKHINSKIY BLOCKYUZHNO-YAROYAKHINSKIY BLOCKYUZHNO-YAROYAKHINSKIY BLOCKYUZHNO-YAROYAKHINSKIY BLOCK
ZAPADNO-MEDVEZHIY BLOCKZAPADNO-MEDVEZHIY BLOCKZAPADNO-MEDVEZHIY BLOCKZAPADNO-MEDVEZHIY BLOCKZAPADNO-MEDVEZHIY BLOCKZAPADNO-MEDVEZHIY BLOCKZAPADNO-MEDVEZHIY BLOCKZAPADNO-MEDVEZHIY BLOCKZAPADNO-MEDVEZHIY BLOCK
ZAPADNO-PESTSOVYY BLOCKZAPADNO-PESTSOVYY BLOCKZAPADNO-PESTSOVYY BLOCKZAPADNO-PESTSOVYY BLOCKZAPADNO-PESTSOVYY BLOCKZAPADNO-PESTSOVYY BLOCKZAPADNO-PESTSOVYY BLOCKZAPADNO-PESTSOVYY BLOCKZAPADNO-PESTSOVYY BLOCK
ZAPADNO-TAZOVSKIY BLOCKZAPADNO-TAZOVSKIY BLOCKZAPADNO-TAZOVSKIY BLOCKZAPADNO-TAZOVSKIY BLOCKZAPADNO-TAZOVSKIY BLOCKZAPADNO-TAZOVSKIY BLOCKZAPADNO-TAZOVSKIY BLOCKZAPADNO-TAZOVSKIY BLOCKZAPADNO-TAZOVSKIY BLOCK
ZAPADNO-ZAPOLYARNOYE FIELDZAPADNO-ZAPOLYARNOYE FIELDZAPADNO-ZAPOLYARNOYE FIELDZAPADNO-ZAPOLYARNOYE FIELDZAPADNO-ZAPOLYARNOYE FIELDZAPADNO-ZAPOLYARNOYE FIELDZAPADNO-ZAPOLYARNOYE FIELDZAPADNO-ZAPOLYARNOYE FIELDZAPADNO-ZAPOLYARNOYE FIELD
ZAPOLYARNOYE FIELDZAPOLYARNOYE FIELDZAPOLYARNOYE FIELDZAPOLYARNOYE FIELDZAPOLYARNOYE FIELDZAPOLYARNOYE FIELDZAPOLYARNOYE FIELDZAPOLYARNOYE FIELDZAPOLYARNOYE FIELD
DOBROVOL'SKOYE FIELD (SLKh)
DREMUCHEYE FIELD
KHAL'MERPAYUTI
KHAL'MER
KHARVUTINSKOYE E FIELD
MEDVEZH'YE FIELD
MEDVEZH'YE E FIELD
MESSOYAKHSKOYE S FIELD
NAUMOVSKOYE FIELD (SLKh)
OBSKOYE FIELD (ShKM)
OLIKUMINSKOYE FIELD
PEREKATNOYE FIELD
PESTSOVOYE FIELD
PESTSOVOYE S FIELD
PIRICHEYSKOYE FIELD
PYREYNOYE S FIELD
RUSSKOYE S FIELD
TAZOVSKOYE FIELD
URENGOYSKOYE FIELD
UST'-CHASE
YAROVOYE FIELD
YEN-YAKHINSKOYE FIELD
ZAPOLYARNOYE W FIELD
Urengoye
Zapolyarnoe
Yamburg
Medvezhye
Source: PFC Energy/ “Petroview”
Associated Gas in Russia – Appendices | Page 14 December 2007
Gas Group Consulting
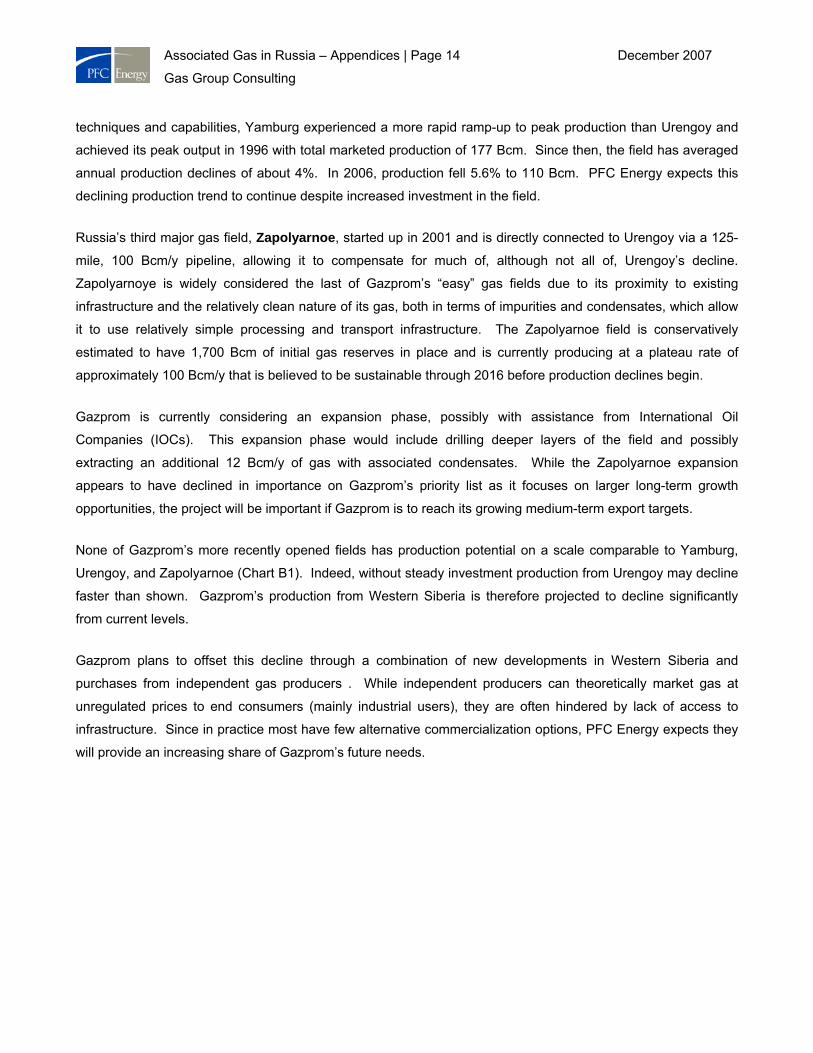
techniques and capabilities, Yamburg experienced a more rapid ramp-up to peak production than Urengoy and
achieved its peak output in 1996 with total marketed production of 177 Bcm. Since then, the field has averaged
annual production declines of about 4%. In 2006, production fell 5.6% to 110 Bcm. PFC Energy expects this
declining production trend to continue despite increased investment in the field.
Russia’s third major gas field, Zapolyarnoe, started up in 2001 and is directly connected to Urengoy via a 125-
mile, 100 Bcm/y pipeline, allowing it to compensate for much of, although not all of, Urengoy’s decline.
Zapolyarnoye is widely considered the last of Gazprom’s “easy” gas fields due to its proximity to existing
infrastructure and the relatively clean nature of its gas, both in terms of impurities and condensates, which allow
it to use relatively simple processing and transport infrastructure. The Zapolyarnoe field is conservatively
estimated to have 1,700 Bcm of initial gas reserves in place and is currently producing at a plateau rate of
approximately 100 Bcm/y that is believed to be sustainable through 2016 before production declines begin.
Gazprom is currently considering an expansion phase, possibly with assistance from International Oil
Companies (IOCs). This expansion phase would include drilling deeper layers of the field and possibly
extracting an additional 12 Bcm/y of gas with associated condensates. While the Zapolyarnoe expansion
appears to have declined in importance on Gazprom’s priority list as it focuses on larger long-term growth
opportunities, the project will be important if Gazprom is to reach its growing medium-term export targets.
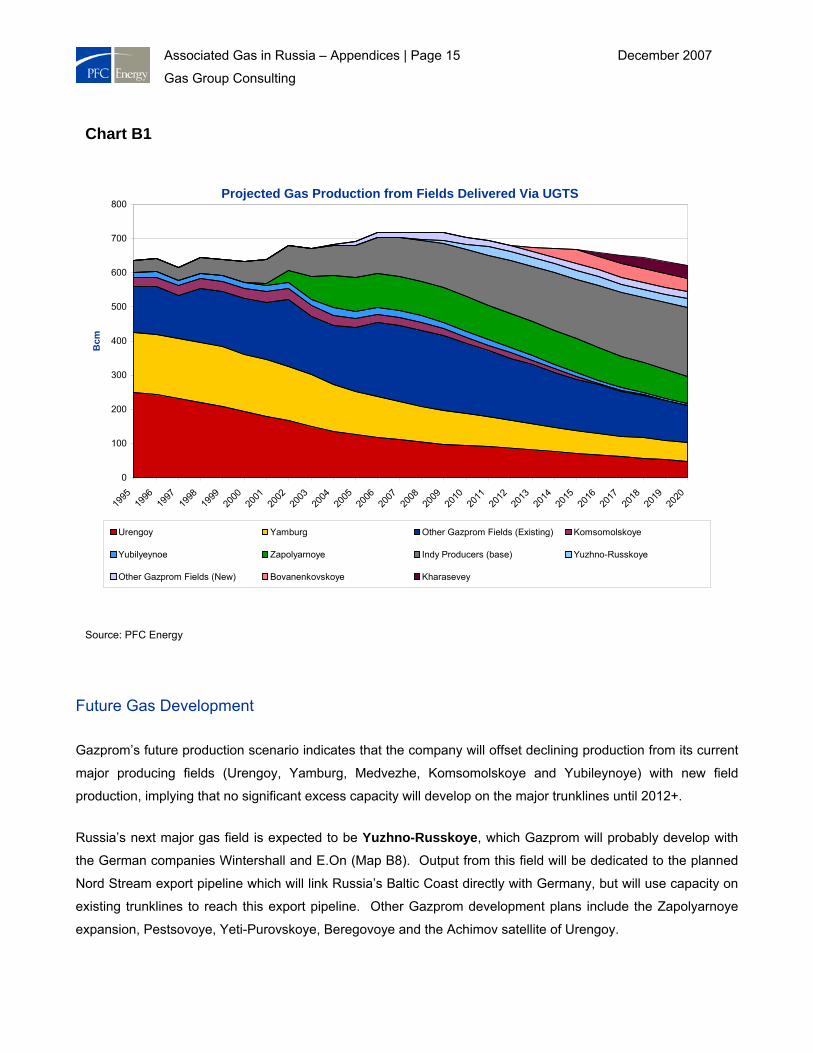
None of Gazprom’s more recently opened fields has production potential on a scale comparable to Yamburg,
Urengoy, and Zapolyarnoe (Chart B1). Indeed, without steady investment production from Urengoy may decline
faster than shown. Gazprom’s production from Western Siberia is therefore projected to decline significantly
from current levels.
Gazprom plans to offset this decline through a combination of new developments in Western Siberia and
purchases from independent gas producers . While independent producers can theoretically market gas at
unregulated prices to end consumers (mainly industrial users), they are often hindered by lack of access to
infrastructure. Since in practice most have few alternative commercialization options, PFC Energy expects they
will provide an increasing share of Gazprom’s future needs.
Associated Gas in Russia – Appendices | Page 15 December 2007
Gas Group Consulting
Future Gas Development
Gazprom’s future production scenario indicates that the company will offset declining production from its current
major producing fields (Urengoy, Yamburg, Medvezhe, Komsomolskoye and Yubileynoye) with new field
production, implying that no significant excess capacity will develop on the major trunklines until 2012+.
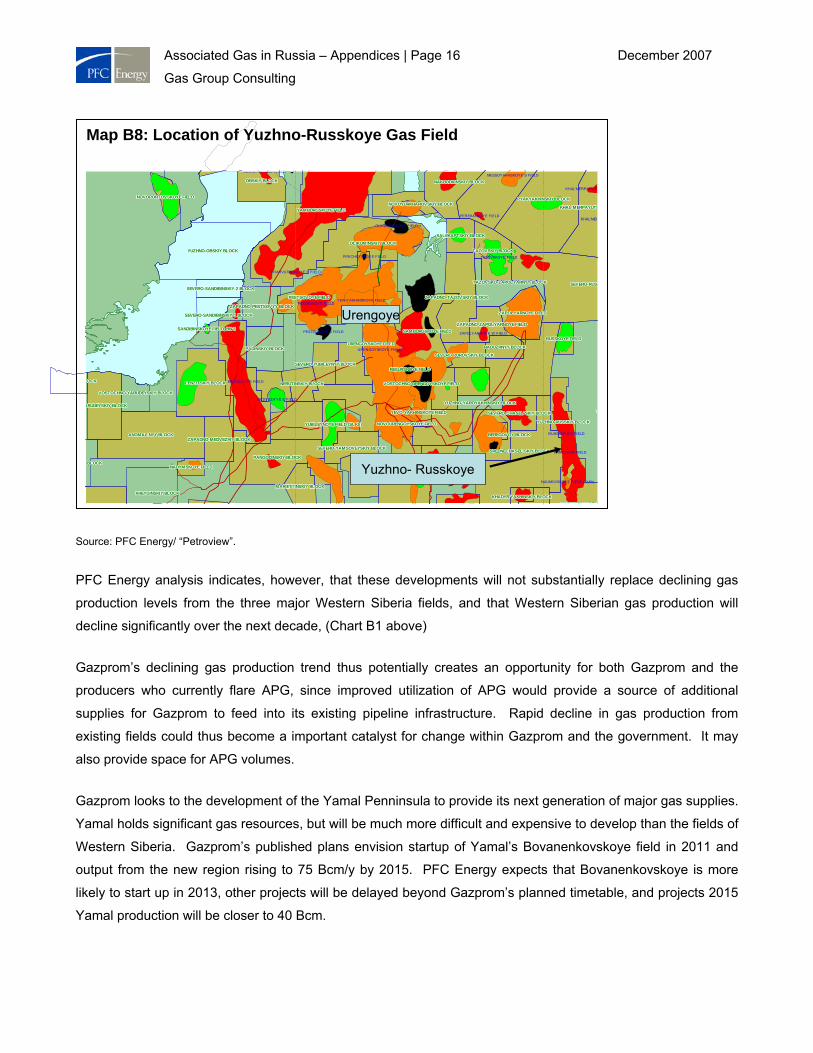
Russia’s next major gas field is expected to be Yuzhno-Russkoye, which Gazprom will probably develop with
the German companies Wintershall and E.On (Map B8). Output from this field will be dedicated to the planned
Nord Stream export pipeline which will link Russia’s Baltic Coast directly with Germany, but will use capacity on
existing trunklines to reach this export pipeline. Other Gazprom development plans include the Zapolyarnoye
expansion, Pestsovoye, Yeti-Purovskoye, Beregovoye and the Achimov satellite of Urengoy.
Chart B1
Projected Gas Production from Fields Delivered Via UGTS
0
100
200
300
400
500
600
700
800
1995
1996
1997
1998
1999
2000
2001
2002
2003
2004
2005
2006
2007
2008
2009
2010
2011
2012
2013
2014
2015
2016
2017
2018
2019
2020
Bcm
Urengoy Yamburg Other Gazprom Fields (Existing) Komsomolskoye
Yubilyeynoe Zapolyarnoye Indy Producers (base) Yuzhno-Russkoye
Other Gazprom Fields (New) Bovanenkovskoye Kharasevey
Source: PFC Energy
Associated Gas in Russia – Appendices | Page 16 December 2007
Gas Group Consulting
Source: PFC Energy/ “Petroview”.
PFC Energy analysis indicates, however, that these developments will not substantially replace declining gas
production levels from the three major Western Siberia fields, and that Western Siberian gas production will
decline significantly over the next decade, (Chart B1 above)
Gazprom’s declining gas production trend thus potentially creates an opportunity for both Gazprom and the
producers who currently flare APG, since improved utilization of APG would provide a source of additional
supplies for Gazprom to feed into its existing pipeline infrastructure. Rapid decline in gas production from
existing fields could thus become a important catalyst for change within Gazprom and the government. It may
also provide space for APG volumes.
Gazprom looks to the development of the Yamal Penninsula to provide its next generation of major gas supplies.
Yamal holds significant gas resources, but will be much more difficult and expensive to develop than the fields of
Western Siberia. Gazprom’s published plans envision startup of Yamal’s Bovanenkovskoye field in 2011 and
output from the new region rising to 75 Bcm/y by 2015. PFC Energy expects that Bovanenkovskoye is more
likely to start up in 2013, other projects will be delayed beyond Gazprom’s planned timetable, and projects 2015
Yamal production will be closer to 40 Bcm.
Map B8: Location of Yuzhno-Russkoye Gas Field
ANOMAL'NYY BLOCKANOMAL'NYY BLOCKANOMAL'NYY BLOCKANOMAL'NYY BLOCKANOMAL'NYY BLOCKANOMAL'NYY BLOCKANOMAL'NYY BLOCKANOMAL'NYY BLOCKANOMAL'NYY BLOCK BEREGOVOY BLOCKBEREGOVOY BLOCKBEREGOVOY BLOCKBEREGOVOY BLOCKBEREGOVOY BLOCKBEREGOVOY BLOCKBEREGOVOY BLOCKBEREGOVOY BLOCKBEREGOVOY BLOCK
KHADYR'YAKHINSKIY BLOCKKHADYR'YAKHINSKIY BLOCKKHADYR'YAKHINSKIY BLOCKKHADYR'YAKHINSKIY BLOCKKHADYR'YAKHINSKIY BLOCKKHADYR'YAKHINSKIY BLOCKKHADYR'YAKHINSKIY BLOCKKHADYR'YAKHINSKIY BLOCKKHADYR'YAKHINSKIY BLOCK
KHAL'MERPAYUTIKHAL'MERPAYUTIKHAL'MERPAYUTIKHAL'MERPAYUTIKHAL'MERPAYUTIKHAL'MERPAYUTIKHAL'MERPAYUTIKHAL'MERPAYUTIKHAL'MERPAYUTI
KHEYGINSKIY BLOCKKHEYGINSKIY BLOCKKHEYGINSKIY BLOCKKHEYGINSKIY BLOCKKHEYGINSKIY BLOCKKHEYGINSKIY BLOCKKHEYGINSKIY BLOCKKHEYGINSKIY BLOCKKHEYGINSKIY BLOCK
OCKOCKOCKLOCKLOCKLOCKLOCKLOCKLOCK
KYNSKO CHASEL'KYNSKO CHASEL'KYNSKO CHASEL'KYNSKO CHASEL'KYNSKO CHASEL'KYNSKO CHASELKYNSKO CHASELKYNSKO CHASELKYNSKO CHASEL'
LENZITSKIY BLOCKLENZITSKIY BLOCKLENZITSKIY BLOCKLENZITSKIY BLOCKLENZITSKIY BLOCKLENZITSKIY BLOCKLENZITSKIY BLOCKLENZITSKIY BLOCKLENZITSKIY BLOCK
MARIETTINSKIY BLOCKMARIETTINSKIY BLOCKMARIETTINSKIY BLOCKMARIETTINSKIY BLOCKMARIETTINSKIY BLOCKMARIETTINSKIY BLOCKMARIETTINSKIY BLOCKMARIETTINSKIY BLOCKMARIETTINSKIY BLOCK
NADYMSKOYE FIELDNADYMSKOYE FIELDNADYMSKOYE FIELDNADYMSKOYE FIELDNADYMSKOYE FIELDNADYMSKOYE FIELDNADYMSKOYE FIELDNADYMSKOYE FIELDNADYMSKOYE FIELD
NAKHODKINSKIY BLOCKNAKHODKINSKIY BLOCKNAKHODKINSKIY BLOCKNAKHODKINSKIY BLOCKNAKHODKINSKIY BLOCKNAKHODKINSKIY BLOCKNAKHODKINSKIY BLOCKNAKHODKINSKIY BLOCKNAKHODKINSKIY BLOCK
NERUTINSKIY BLOCKNERUTINSKIY BLOCKNERUTINSKIY BLOCKNERUTINSKIY BLOCKNERUTINSKIY BLOCKNERUTINSKIY BLOCKNERUTINSKIY BLOCKNERUTINSKIY BLOCKNERUTINSKIY BLOCK
NOVOPORTOVSKOYE FIELDNOVOPORTOVSKOYE FIELDNOVOPORTOVSKOYE FIELDNOVOPORTOVSKOYE FIELDNOVOPORTOVSKOYE FIELDNOVOPORTOVSKOYE FIELDNOVOPORTOVSKOYE FIELDNOVOPORTOVSKOYE FIELDNOVOPORTOVSKOYE FIELD
NOVOURENGOYSKOYE FIELDNOVOURENGOYSKOYE FIELDNOVOURENGOYSKOYE FIELDNOVOURENGOYSKOYE FIELDNOVOURENGOYSKOYE FIELDNOVOURENGOYSKOYE FIELDNOVOURENGOYSKOYE FIELDNOVOURENGOYSKOYE FIELDNOVOURENGOYSKOYE FIELD
NOVOYURKHAROVSKIY BLOCKNOVOYURKHAROVSKIY BLOCKNOVOYURKHAROVSKIY BLOCKNOVOYURKHAROVSKIY BLOCKNOVOYURKHAROVSKIY BLOCKNOVOYURKHAROVSKIY BLOCKNOVOYURKHAROVSKIY BLOCKNOVOYURKHAROVSKIY BLOCKNOVOYURKHAROVSKIY BLOCK
OBSKIY BLOCKOBSKIY BLOCKOBSKIY BLOCKOBSKIY BLOCKOBSKIY BLOCKOBSKIY BLOCKOBSKIY BLOCKOBSKIY BLOCKOBSKIY BLOCK
OLIKUMINSKIY BLOCKOLIKUMINSKIY BLOCKOLIKUMINSKIY BLOCKOLIKUMINSKIY BLOCKOLIKUMINSKIY BLOCKOLIKUMINSKIY BLOCKOLIKUMINSKIY BLOCKOLIKUMINSKIY BLOCKOLIKUMINSKIY BLOCK
OLIMPIYSKIY BLOCK (SLKh)OLIMPIYSKIY BLOCK (SLKh)OLIMPIYSKIY BLOCK (SLKh)OLIMPIYSKIY BLOCK (SLKh)OLIMPIYSKIY BLOCK (SLKh)OLIMPIYSKIY BLOCK (SLKh)OLIMPIYSKIY BLOCK (SLKh)OLIMPIYSKIY BLOCK (SLKh)OLIMPIYSKIY BLOCK (SLKh)
PADINSKIY BLOCKPADINSKIY BLOCKPADINSKIY BLOCKPADINSKIY BLOCKPADINSKIY BLOCKPADINSKIY BLOCKPADINSKIY BLOCKPADINSKIY BLOCKPADINSKIY BLOCK
PANGODINSKIY BLOCKPANGODINSKIY BLOCKPANGODINSKIY BLOCKPANGODINSKIY BLOCKPANGODINSKIY BLOCKPANGODINSKIY BLOCKPANGODINSKIY BLOCKPANGODINSKIY BLOCKPANGODINSKIY BLOCK
PESTSOVOYE FIELDPESTSOVOYE FIELDPESTSOVOYE FIELDPESTSOVOYE FIELDPESTSOVOYE FIELDPESTSOVOYE FIELDPESTSOVOYE FIELDPESTSOVOYE FIELDPESTSOVOYE FIELD
PYAKYAKHINSKIY BLOCKPYAKYAKHINSKIY BLOCKPYAKYAKHINSKIY BLOCKPYAKYAKHINSKIY BLOCKPYAKYAKHINSKIY BLOCKPYAKYAKHINSKIY BLOCKPYAKYAKHINSKIY BLOCKPYAKYAKHINSKIY BLOCKPYAKYAKHINSKIY BLOCK
PYREYNOYE FIELDPYREYNOYE FIELDPYREYNOYE FIELDPYREYNOYE FIELDPYREYNOYE FIELDPYREYNOYE FIELDPYREYNOYE FIELDPYREYNOYE FIELDPYREYNOYE FIELD
RADUZHNYY BLOCKRADUZHNYY BLOCKRADUZHNYY BLOCKRADUZHNYY BLOCKRADUZHNYY BLOCKRADUZHNYY BLOCKRADUZHNYY BLOCKRADUZHNYY BLOCKRADUZHNYY BLOCK
RESURSNOYE FIELDRESURSNOYE FIELDRESURSNOYE FIELDRESURSNOYE FIELDRESURSNOYE FIELDRESURSNOYE FIELDRESURSNOYE FIELDRESURSNOYE FIELDRESURSNOYE FIELD
RUSSKOYE FIELDRUSSKOYE FIELDRUSSKOYE FIELDRUSSKOYE FIELDRUSSKOYE FIELDRUSSKOYE FIELDRUSSKOYE FIELDRUSSKOYE FIELDRUSSKOYE FIELD
SALEKAPTSKIY BLOCKSALEKAPTSKIY BLOCKSALEKAPTSKIY BLOCKSALEKAPTSKIY BLOCKSALEKAPTSKIY BLOCKSALEKAPTSKIY BLOCKSALEKAPTSKIY BLOCKSALEKAPTSKIY BLOCKSALEKAPTSKIY BLOCK
SAMBURGSKOYE FIELDSAMBURGSKOYE FIELDSAMBURGSKOYE FIELDSAMBURGSKOYE FIELDSAMBURGSKOYE FIELDSAMBURGSKOYE FIELDSAMBURGSKOYE FIELDSAMBURGSKOYE FIELDSAMBURGSKOYE FIELDSANDIBINSKOYE FIELD; BN-6SANDIBINSKOYE FIELD; BN-6SANDIBINSKOYE FIELD; BN-6SANDIBINSKOYE FIELD; BN-6SANDIBINSKOYE FIELD; BN-6SANDIBINSKOYE FIELD; BN-6SANDIBINSKOYE FIELD; BN-6SANDIBINSKOYE FIELD; BN-6SANDIBINSKOYE FIELD; BN-6
SEVERO-CHASEL'SKIY BLOCKSEVERO-CHASEL'SKIY BLOCKSEVERO-CHASEL'SKIY BLOCKSEVERO-CHASEL'SKIY BLOCKSEVERO-CHASEL'SKIY BLOCKSEVERO-CHASEL'SKIY BLOCKSEVERO-CHASEL'SKIY BLOCKSEVERO-CHASEL'SKIY BLOCKSEVERO-CHASEL'SKIY BLOCK
SEVERO-PUROVSKIY BLOCKSEVERO-PUROVSKIY BLOCKSEVERO-PUROVSKIY BLOCKSEVERO-PUROVSKIY BLOCKSEVERO-PUROVSKIY BLOCKSEVERO-PUROVSKIY BLOCKSEVERO-PUROVSKIY BLOCKSEVERO-PUROVSKIY BLOCKSEVERO-PUROVSKIY BLOCK
SEVERO-RUSSSEVERO-RUSSSEVERO-RUSSSEVERO-RUSSEVERO-RUSSEVERO-RUSSEVERO-RUSSEVERO-RUSSEVERO-RUS
SEVERO-SANDIBINSKIY-1 BLOCKSEVERO-SANDIBINSKIY-1 BLOCKSEVERO-SANDIBINSKIY-1 BLOCKSEVERO-SANDIBINSKIY-1 BLOCKSEVERO-SANDIBINSKIY-1 BLOCKSEVERO-SANDIBINSKIY-1 BLOCKSEVERO-SANDIBINSKIY-1 BLOCKSEVERO-SANDIBINSKIY-1 BLOCKSEVERO-SANDIBINSKIY-1 BLOCK
SEVERO-SANDIBINSKIY-2 BLOCKSEVERO-SANDIBINSKIY-2 BLOCKSEVERO-SANDIBINSKIY-2 BLOCKSEVERO-SANDIBINSKIY-2 BLOCKSEVERO-SANDIBINSKIY-2 BLOCKSEVERO-SANDIBINSKIY-2 BLOCKSEVERO-SANDIBINSKIY-2 BLOCKSEVERO-SANDIBINSKIY-2 BLOCKSEVERO-SANDIBINSKIY-2 BLOCK
SEVERO-YAMSOVEYSKIY BLOCKSEVERO-YAMSOVEYSKIY BLOCKSEVERO-YAMSOVEYSKIY BLOCKSEVERO-YAMSOVEYSKIY BLOCKSEVERO-YAMSOVEYSKIY BLOCKSEVERO-YAMSOVEYSKIY BLOCKSEVERO-YAMSOVEYSKIY BLOCKSEVERO-YAMSOVEYSKIY BLOCKSEVERO-YAMSOVEYSKIY BLOCK
SEVERO-YUBILEYNYY BLOCKSEVERO-YUBILEYNYY BLOCKSEVERO-YUBILEYNYY BLOCKSEVERO-YUBILEYNYY BLOCKSEVERO-YUBILEYNYY BLOCKSEVERO-YUBILEYNYY BLOCKSEVERO-YUBILEYNYY BLOCKSEVERO-YUBILEYNYY BLOCKSEVERO-YUBILEYNYY BLOCK
SREDNECHASEL'SKIY BLOCKSREDNECHASEL'SKIY BLOCKSREDNECHASEL'SKIY BLOCKSREDNECHASEL'SKIY BLOCKSREDNECHASEL'SKIY BLOCKSREDNECHASEL'SKIY BLOCKSREDNECHASEL'SKIY BLOCKSREDNECHASEL'SKIY BLOCKSREDNECHASEL'SKIY BLOCK
TAZOVSKIY BLOCKTAZOVSKIY BLOCKTAZOVSKIY BLOCKTAZOVSKIY BLOCKTAZOVSKIY BLOCKTAZOVSKIY BLOCKTAZOVSKIY BLOCKTAZOVSKIY BLOCKTAZOVSKIY BLOCK
TAZOVSKO-ZAPOLYARNYY BLOCKTAZOVSKO-ZAPOLYARNYY BLOCKTAZOVSKO-ZAPOLYARNYY BLOCKTAZOVSKO-ZAPOLYARNYY BLOCKTAZOVSKO-ZAPOLYARNYY BLOCKTAZOVSKO-ZAPOLYARNYY BLOCKTAZOVSKO-ZAPOLYARNYY BLOCKTAZOVSKO-ZAPOLYARNYY BLOCKTAZOVSKO-ZAPOLYARNYY BLOCK
TTTTTTTTT
URENGOYSKOYE FIELDURENGOYSKOYE FIELDURENGOYSKOYE FIELDURENGOYSKOYE FIELDURENGOYSKOYE FIELDURENGOYSKOYE FIELDURENGOYSKOYE FIELDURENGOYSKOYE FIELDURENGOYSKOYE FIELD
BLOCKBLOCKBLOCKBLOCKBLOCKBLOCKBLOCKBLOCKBLOCK
VOSTOCHNO-URENGOYSKOYE FIELDVOSTOCHNO-URENGOYSKOYE FIELDVOSTOCHNO-URENGOYSKOYE FIELDVOSTOCHNO-URENGOYSKOYE FIELDVOSTOCHNO-URENGOYSKOYE FIELDVOSTOCHNO-URENGOYSKOYE FIELDVOSTOCHNO-URENGOYSKOYE FIELDVOSTOCHNO-URENGOYSKOYE FIELDVOSTOCHNO-URENGOYSKOYE FIELD
VOSTOCHNO-YARUDEYSKIY BLOCKVOSTOCHNO-YARUDEYSKIY BLOCKVOSTOCHNO-YARUDEYSKIY BLOCKVOSTOCHNO-YARUDEYSKIY BLOCKVOSTOCHNO-YARUDEYSKIY BLOCKVOSTOCHNO-YARUDEYSKIY BLOCKVOSTOCHNO-YARUDEYSKIY BLOCKVOSTOCHNO-YARUDEYSKIY BLOCKVOSTOCHNO-YARUDEYSKIY BLOCK
YAMBURGSKOYE FIELDYAMBURGSKOYE FIELDYAMBURGSKOYE FIELDYAMBURGSKOYE FIELDYAMBURGSKOYE FIELDYAMBURGSKOYE FIELDYAMBURGSKOYE FIELDYAMBURGSKOYE FIELDYAMBURGSKOYE FIELD
ARUDEYSKIY BLOCKARUDEYSKIY BLOCKARUDEYSKIY BLOCKARUDEYSKIY BLOCKARUDEYSKIY BLOCKARUDEYSKIY BLOCKARUDEYSKIY BLOCKARUDEYSKIY BLOCKARUDEYSKIY BLOCKYEVO-YAKHINSKOYE FIELDYEVO-YAKHINSKOYE FIELDYEVO-YAKHINSKOYE FIELDYEVO-YAKHINSKOYE FIELDYEVO-YAKHINSKOYE FIELDYEVO-YAKHINSKOYE FIELDYEVO-YAKHINSKOYE FIELDYEVO-YAKHINSKOYE FIELDYEVO-YAKHINSKOYE FIELD
YUBILEYNOYE FIELD (SLKh)YUBILEYNOYE FIELD (SLKh)YUBILEYNOYE FIELD (SLKh)YUBILEYNOYE FIELD (SLKh)YUBILEYNOYE FIELD (SLKh)YUBILEYNOYE FIELD (SLKh)YUBILEYNOYE FIELD (SLKh)YUBILEYNOYE FIELD (SLKh)YUBILEYNOYE FIELD (SLKh)
YUZHNO-OBSKIY BLOCKYUZHNO-OBSKIY BLOCKYUZHNO-OBSKIY BLOCKYUZHNO-OBSKIY BLOCKYUZHNO-OBSKIY BLOCKYUZHNO-OBSKIY BLOCKYUZHNO-OBSKIY BLOCKYUZHNO-OBSKIY BLOCKYUZHNO-OBSKIY BLOCK
YUZHNO-RUSSKIY BLOCKYUZHNO-RUSSKIY BLOCKYUZHNO-RUSSKIY BLOCKYUZHNO-RUSSKIY BLOCKYUZHNO-RUSSKIY BLOCKYUZHNO-RUSSKIY BLOCKYUZHNO-RUSSKIY BLOCKYUZHNO-RUSSKIY BLOCKYUZHNO-RUSSKIY BLOCK
YUZHNO-YAROYAKHINSKIY BLOCKYUZHNO-YAROYAKHINSKIY BLOCKYUZHNO-YAROYAKHINSKIY BLOCKYUZHNO-YAROYAKHINSKIY BLOCKYUZHNO-YAROYAKHINSKIY BLOCKYUZHNO-YAROYAKHINSKIY BLOCKYUZHNO-YAROYAKHINSKIY BLOCKYUZHNO-YAROYAKHINSKIY BLOCKYUZHNO-YAROYAKHINSKIY BLOCK
ZAPADNO-MEDVEZHIY BLOCKZAPADNO-MEDVEZHIY BLOCKZAPADNO-MEDVEZHIY BLOCKZAPADNO-MEDVEZHIY BLOCKZAPADNO-MEDVEZHIY BLOCKZAPADNO-MEDVEZHIY BLOCKZAPADNO-MEDVEZHIY BLOCKZAPADNO-MEDVEZHIY BLOCKZAPADNO-MEDVEZHIY BLOCK
ZAPADNO-PESTSOVYY BLOCKZAPADNO-PESTSOVYY BLOCKZAPADNO-PESTSOVYY BLOCKZAPADNO-PESTSOVYY BLOCKZAPADNO-PESTSOVYY BLOCKZAPADNO-PESTSOVYY BLOCKZAPADNO-PESTSOVYY BLOCKZAPADNO-PESTSOVYY BLOCKZAPADNO-PESTSOVYY BLOCK
ZAPADNO-TAZOVSKIY BLOCKZAPADNO-TAZOVSKIY BLOCKZAPADNO-TAZOVSKIY BLOCKZAPADNO-TAZOVSKIY BLOCKZAPADNO-TAZOVSKIY BLOCKZAPADNO-TAZOVSKIY BLOCKZAPADNO-TAZOVSKIY BLOCKZAPADNO-TAZOVSKIY BLOCKZAPADNO-TAZOVSKIY BLOCK
ZAPADNO-ZAPOLYARNOYE FIELDZAPADNO-ZAPOLYARNOYE FIELDZAPADNO-ZAPOLYARNOYE FIELDZAPADNO-ZAPOLYARNOYE FIELDZAPADNO-ZAPOLYARNOYE FIELDZAPADNO-ZAPOLYARNOYE FIELDZAPADNO-ZAPOLYARNOYE FIELDZAPADNO-ZAPOLYARNOYE FIELDZAPADNO-ZAPOLYARNOYE FIELD
ZAPOLYARNOYE FIELDZAPOLYARNOYE FIELDZAPOLYARNOYE FIELDZAPOLYARNOYE FIELDZAPOLYARNOYE FIELDZAPOLYARNOYE FIELDZAPOLYARNOYE FIELDZAPOLYARNOYE FIELDZAPOLYARNOYE FIELD
DOBROVOL'SKOYE FIELD (SLKh)
KHAL'MERPAYUTI
KHAL'MER
KHARVUTINSKOYE E FIELD
MEDVEZH'YE FIELD
MEDVEZH'YE E FIELD
MESSOYAKHSKOYE S FIELD
NAUMOVSKOYE FIELD (SLKh)
OBSKOYE FIELD (ShKM)
OLIKUMINSKOYE FIELD
PEREKATNOYE FIELD
PESTSOVOYE FIELD
PESTSOVOYE S FIELD
PIRICHEYSKOYE FIELD
PYREYNOYE S FIELD
RUSSKOYE S FIELD
TAZOVSKOYE FIELD
URENGOYSKOYE FIELD
YAROVOYE FIELD
YEN-YAKHINSKOYE FIELD
ZAPOLYARNOYE W FIELD
Yuzhno- Russkoye
Urengoye
Associated Gas in Russia – Appendices | Page 17 December 2007
Gas Group Consulting
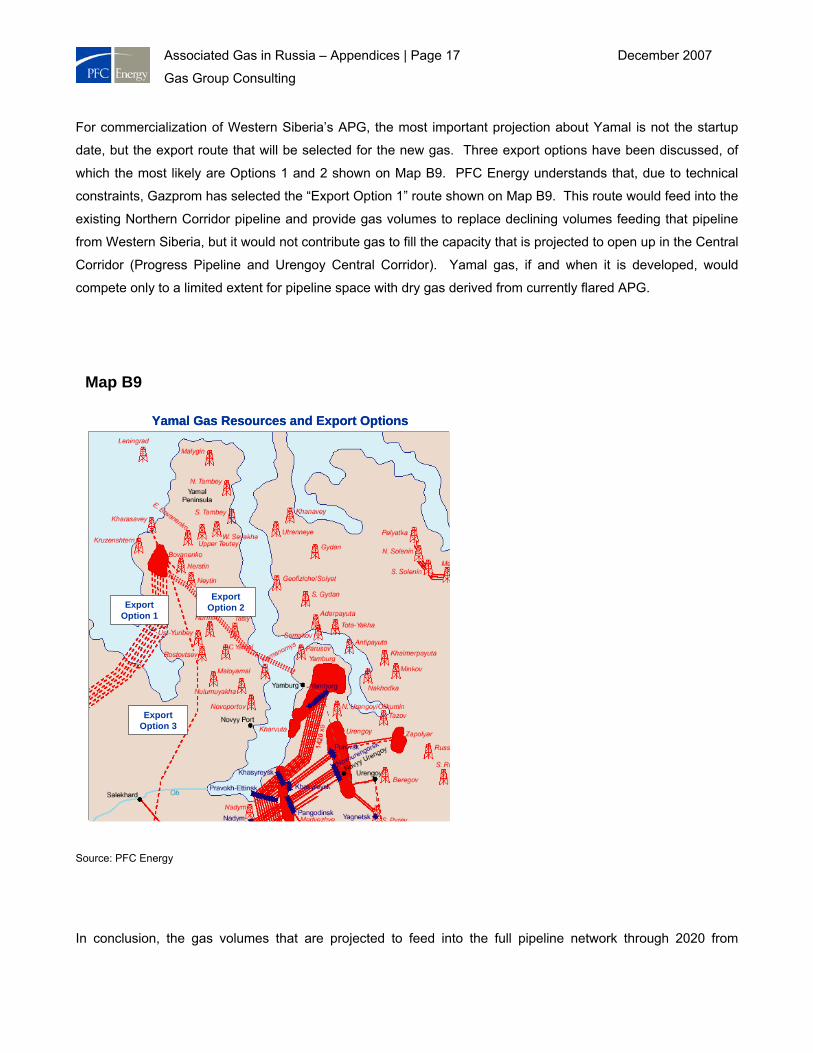
For commercialization of Western Siberia’s APG, the most important projection about Yamal is not the startup
date, but the export route that will be selected for the new gas. Three export options have been discussed, of
which the most likely are Options 1 and 2 shown on Map B9. PFC Energy understands that, due to technical
constraints, Gazprom has selected the “Export Option 1” route shown on Map B9. This route would feed into the
existing Northern Corridor pipeline and provide gas volumes to replace declining volumes feeding that pipeline
from Western Siberia, but it would not contribute gas to fill the capacity that is projected to open up in the Central
Corridor (Progress Pipeline and Urengoy Central Corridor). Yamal gas, if and when it is developed, would
compete only to a limited extent for pipeline space with dry gas derived from currently flared APG.
Source: PFC Energy
In conclusion, the gas volumes that are projected to feed into the full pipeline network through 2020 from
Map B9
Export Option 1
Export Option 2
Export Option 3
Yamal Gas Resources and Export Options
Export Option 1
Export Option 2
Export Option 3
Yamal Gas Resources and Export Options
Associated Gas in Russia – Appendices | Page 18 December 2007
Gas Group Consulting
different fields in Western Siberia and the Yamal Peninsula are projected to decline gradually, beginning in about
2010, and with cumulative declines of some 100 Bcm/y projected from current levels by 2020. The only option
with the potential to reverse this trend would be much more aggressive Yamal Peninsula gas exploitation, which
seems unlikely, given the many other development opportunities available to Gazprom. Pipeline capacity to
transport processed APG could be made available sooner if Gazprom were to modify its current drilling and
development plans. The Russian government has suggested giving priority access to processed APG in the
pipeline system, which would, in effect, force this kind of reprioritization.
Regional Pipeline Infrastructure
Even if (or when) capacity is available in Russia’s major gas transportation corridors to carry dry gas from APG
to consuming markets, regional infrastructure will need to be reconfigured to connect GPPs with the trunklines.
This section discusses these infrastructure needs and options.
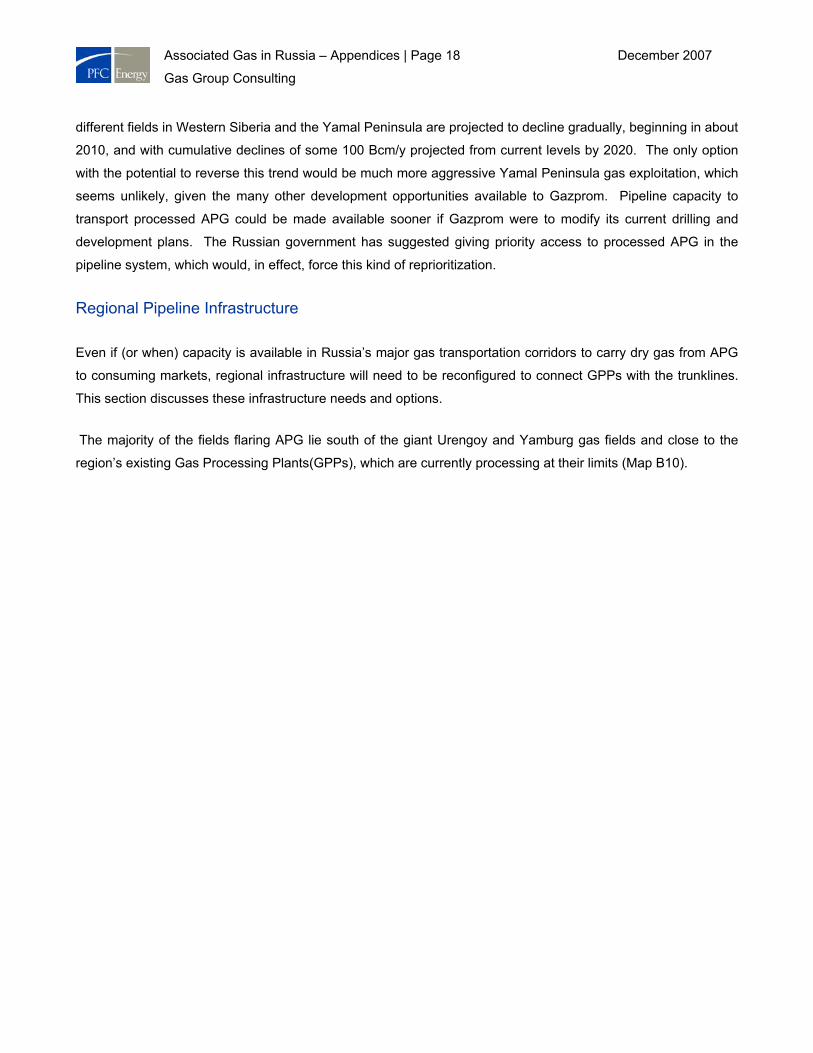
The majority of the fields flaring APG lie south of the giant Urengoy and Yamburg gas fields and close to the
region’s existing Gas Processing Plants(GPPs), which are currently processing at their limits (Map B10).
Associated Gas in Russia – Appendices | Page 19 December 2007
Gas Group Consulting
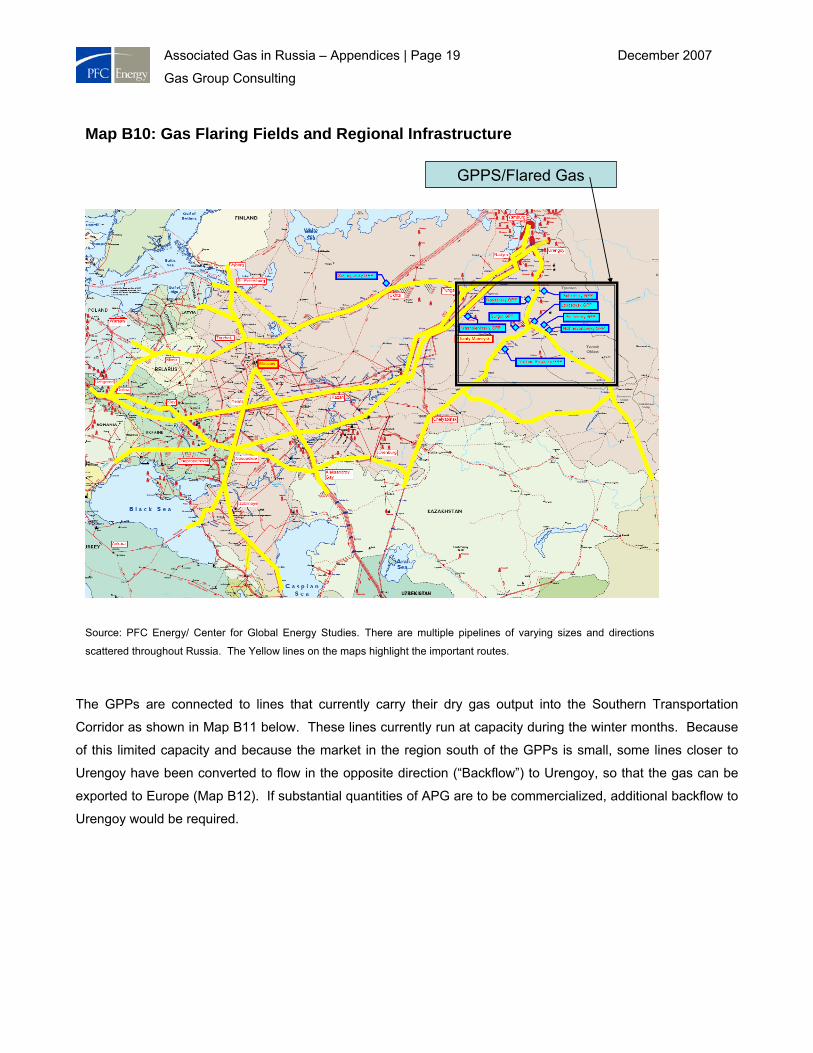
The GPPs are connected to lines that currently carry their dry gas output into the Southern Transportation
Corridor as shown in Map B11 below. These lines currently run at capacity during the winter months. Because
of this limited capacity and because the market in the region south of the GPPs is small, some lines closer to
Urengoy have been converted to flow in the opposite direction (“Backflow”) to Urengoy, so that the gas can be
exported to Europe (Map B12). If substantial quantities of APG are to be commercialized, additional backflow to
Urengoy would be required.
Map B10: Gas Flaring Fields and Regional Infrastructure
GPPS/Flared Gas
Source: PFC Energy/ Center for Global Energy Studies. There are multiple pipelines of varying sizes and directions
scattered throughout Russia. The Yellow lines on the maps highlight the important routes.
Associated Gas in Russia – Appendices | Page 20 December 2007
Gas Group Consulting
Map B11: Infrastructure to Transport Dry Gas from GPPs
Flared gas would naturally use this this
export route. Less lines and full
Backflow?
Source: PFC Energy/ Center for Global Energy Studies. There are multiple pipelines of varying sizes and directions
scattered throughout Russia. The Yellow lines on the maps highlight the important routes.
Associated Gas in Russia – Appendices | Page 21 December 2007
Gas Group Consulting
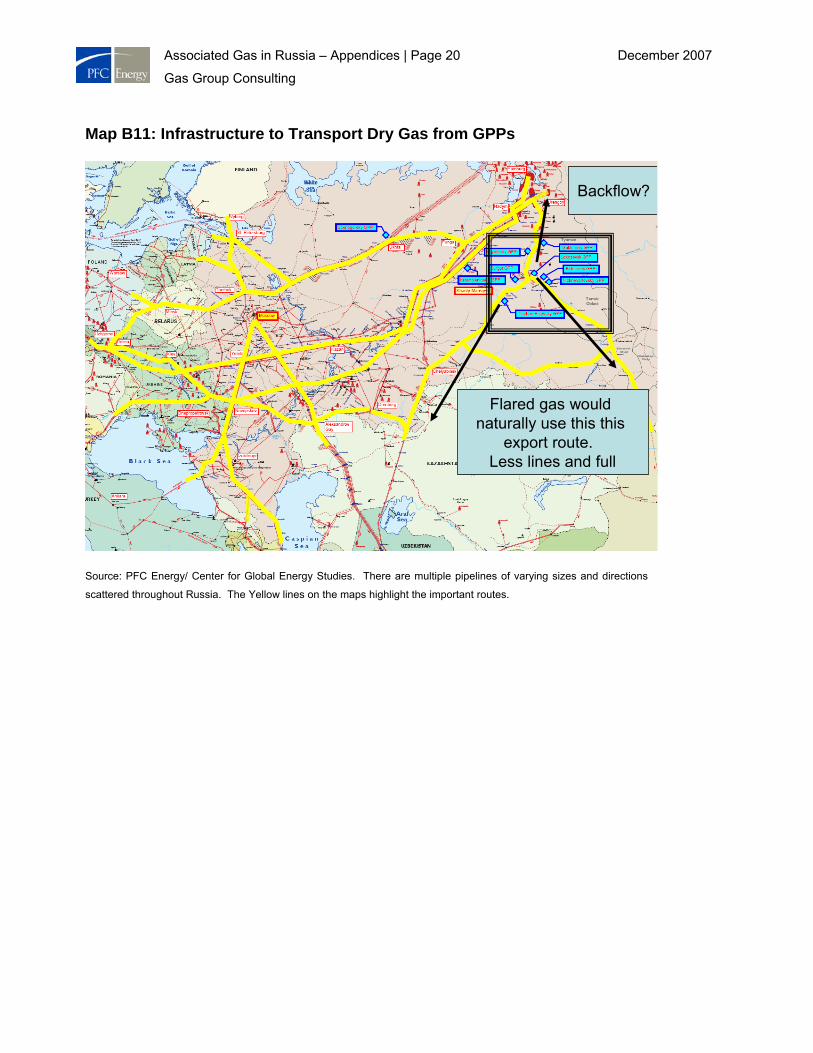
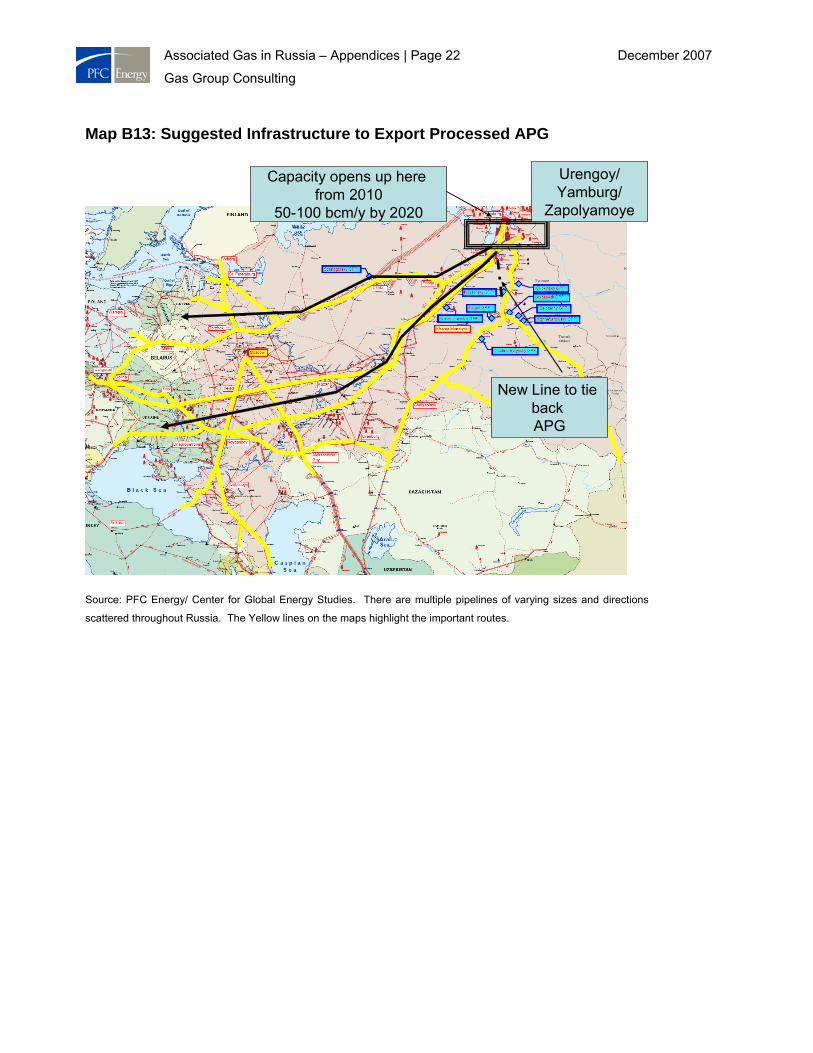
The best way to utilize existing infrastructure may be to build new north-flowing pipelines that tie existing and
new GPPs into the existing Urengoy/Yamburg pipelines (dotted line on Map B13).
Map B12: Export Routes for Gas from Major Gas Fields
Flows can be swapped between
Central and Northern Export routes
Urengoy/Yamburg/
Zapolyamoye
Central export routes
Northern export routes
Source: PFC Energy/ Center for Global Energy Studies. There are multiple pipelines of varying sizes and directions
scattered throughout Russia. The Yellow lines on the maps highlight the important routes.
Associated Gas in Russia – Appendices | Page 22 December 2007
Gas Group Consulting
Map B13: Suggested Infrastructure to Export Processed APG
Urengoy/Yamburg/
Zapolyamoye
Capacity opens up here from 2010
50-100 bcm/y by 2020
New Line to tie back APG
Source: PFC Energy/ Center for Global Energy Studies. There are multiple pipelines of varying sizes and directions
scattered throughout Russia. The Yellow lines on the maps highlight the important routes.
Associated Gas in Russia – Appendices | Page 23 December 2007
Gas Group Consulting
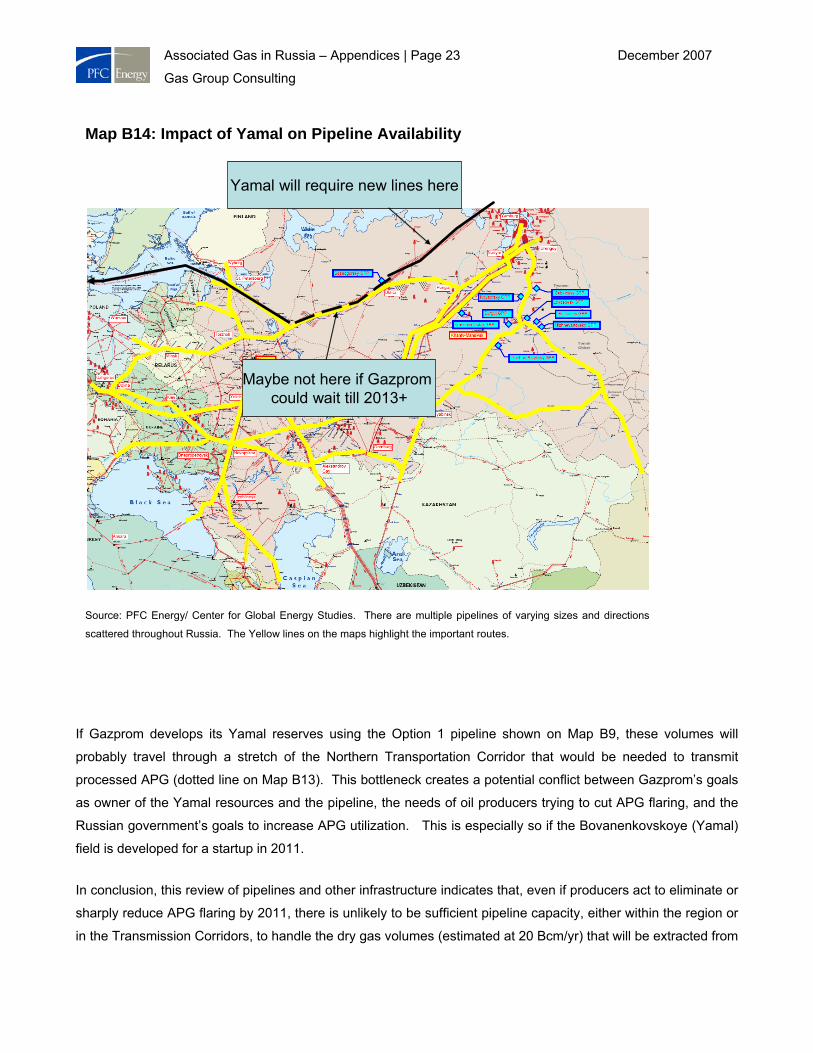
If Gazprom develops its Yamal reserves using the Option 1 pipeline shown on Map B9, these volumes will
probably travel through a stretch of the Northern Transportation Corridor that would be needed to transmit
processed APG (dotted line on Map B13). This bottleneck creates a potential conflict between Gazprom’s goals
as owner of the Yamal resources and the pipeline, the needs of oil producers trying to cut APG flaring, and the
Russian government’s goals to increase APG utilization. This is especially so if the Bovanenkovskoye (Yamal)
field is developed for a startup in 2011.
In conclusion, this review of pipelines and other infrastructure indicates that, even if producers act to eliminate or
sharply reduce APG flaring by 2011, there is unlikely to be sufficient pipeline capacity, either within the region or
in the Transmission Corridors, to handle the dry gas volumes (estimated at 20 Bcm/yr) that will be extracted from
Map B14: Impact of Yamal on Pipeline Availability
Maybe not here if Gazprom could wait till 2013+
Yamal will require new lines here
Source: PFC Energy/ Center for Global Energy Studies. There are multiple pipelines of varying sizes and directions
scattered throughout Russia. The Yellow lines on the maps highlight the important routes.

Associated Gas in Russia – Appendices | Page 24 December 2007
Gas Group Consulting
that APG. Without new investment in infrastructure, increasing utilization of APG might require producers to shut
down valuable oil fields, delay planned new developments, or both. A delay in the development of Yamal post
2013 would mean that sufficient capacity could be available for APG by around 2013.
Associated Gas in Russia – Appendices | Page 25 December 2007
Gas Group Consulting
Appendix C
Economic Analysis of Options for Utilizing Associated Gas
PFC Energy’s economic analysis considered the following gas utilization options, first separately and then in
combination.
1. Gas processing and sale of dry gas through the Gazprom pipeline system
2. Using gas to provide local power vs. purchasing power from the grid or generating power from diesel
3. Using gas in a regional power plant
4. Re-injecting gas for Enhanced Oil Recovery (EOR)
5. Using gas to supply a Gas-To-Liquids (GTL) plant
Each option assumes a new-build facility is required to use the APG.
Because the economics of the different options are driven by different parameters, with significant variation in
the levels of investment, they cannot be compared on the basis of their IRRs. To allow comparisons between the
options, as well as provide a key indicator of the economic margin available in each case, PFC Energy used the
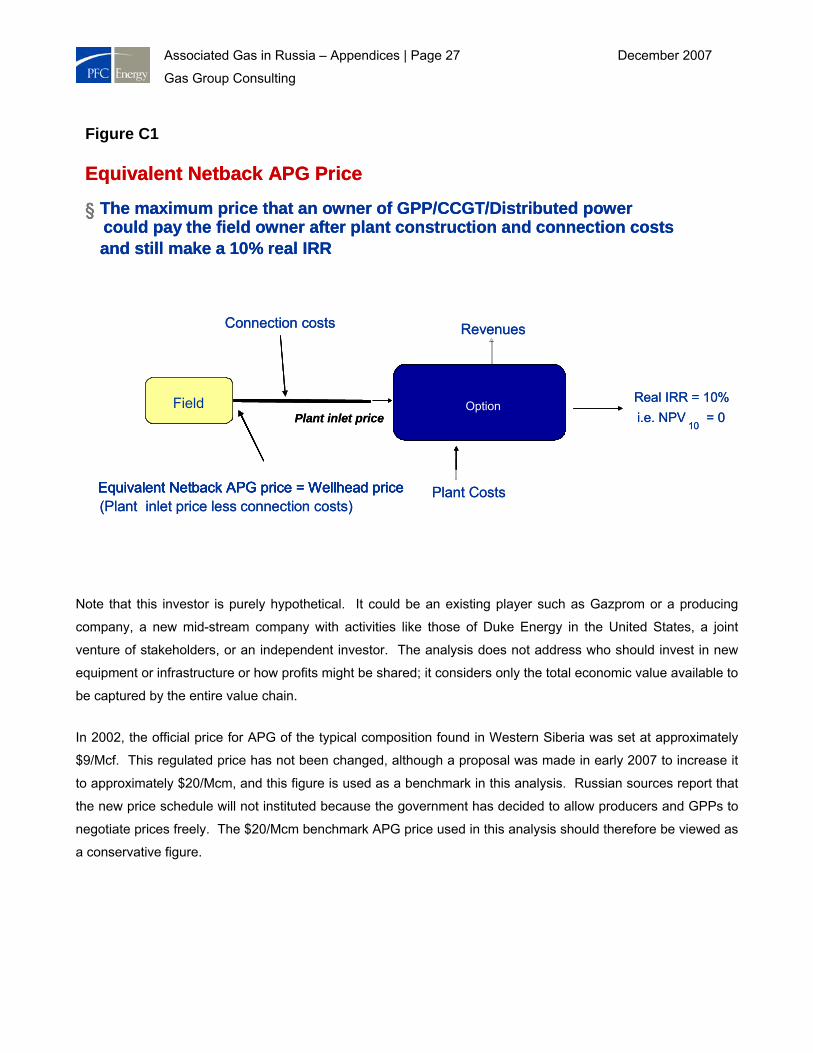
concept of an “equivalent netback APG price.” This price represents the maximum price an investor building a
new facility (GPP, power plant, GTL plant, EOR system) plus the infrastructure needed to bring the APG to the
facility would be prepared to pay a producer to purchase APG at the wellhead, while earning a 10% real return
on his investment.
For example, for a new Gas Processing Plant, the annual pre-tax cash-flows would be:
GPP Investor cash-flow = Revenue - Capex - Opex - Equivalent netback APG price x APG gas volume
where Capex = Plant cost + connection cost, Opex = Plant operating cost
APG seller cash-flow = Equivalent netback APG price x APG gas volume
assuming no significant cost to deliver the gas at the field boundary
The overall pre-tax value of the project - the value to the 'system' - is the sum of the cumulative cash-flows of the
GPP investor and the APG seller. Since the GPP investor is to earn a 10% real return, his cumulative cash-
surplus at a 10% discount rate is zero. The overall "system" net present value at a 10% discount rate is therefore
just the APG seller's cumulative cash-flow discounted at 10% which is the Equivalent netback APG price x Raw
gas volume discounted at 10%.
Associated Gas in Russia – Appendices | Page 26 December 2007
Gas Group Consulting
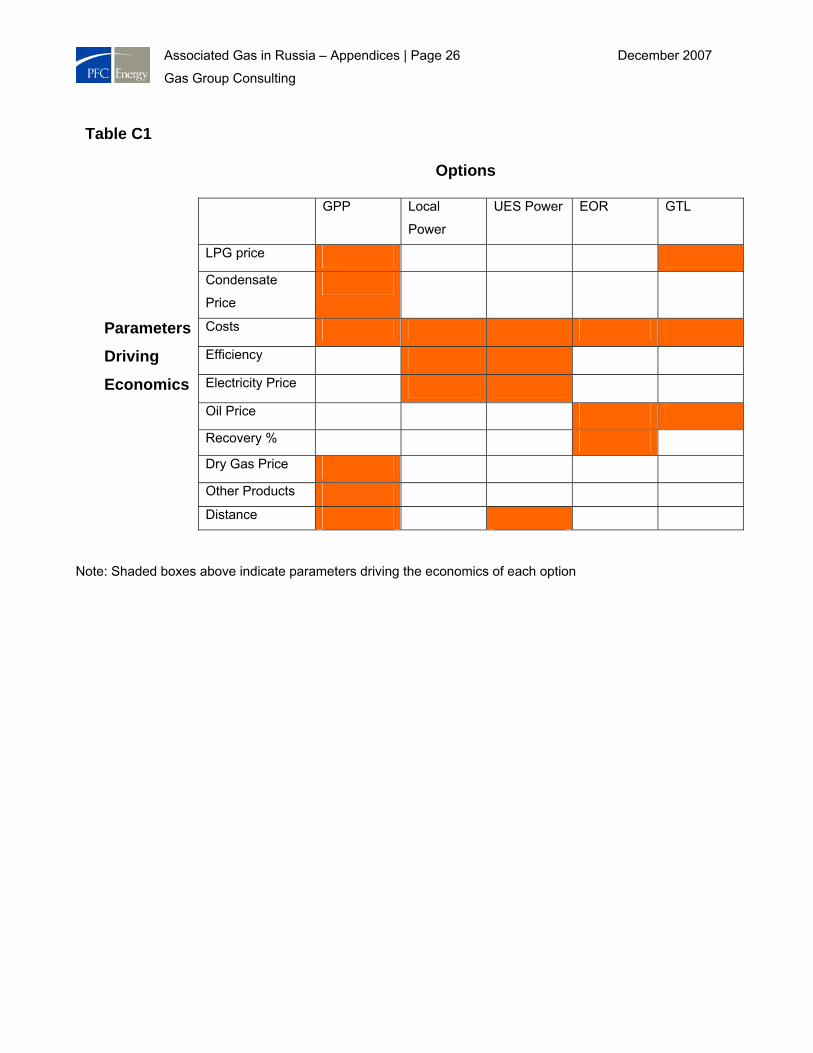
Note: Shaded boxes above indicate parameters driving the economics of each option
Table C1 Options
GPP Local
Power
UES Power EOR GTL
LPG price
Condensate
Price
Parameters Costs
Driving Efficiency
Economics Electricity Price
Oil Price
Recovery %
Dry Gas Price
Other Products
Distance
Associated Gas in Russia – Appendices | Page 27 December 2007
Gas Group Consulting
Note that this investor is purely hypothetical. It could be an existing player such as Gazprom or a producing
company, a new mid-stream company with activities like those of Duke Energy in the United States, a joint
venture of stakeholders, or an independent investor. The analysis does not address who should invest in new
equipment or infrastructure or how profits might be shared; it considers only the total economic value available to
be captured by the entire value chain.
In 2002, the official price for APG of the typical composition found in Western Siberia was set at approximately
$9/Mcf. This regulated price has not been changed, although a proposal was made in early 2007 to increase it
to approximately $20/Mcm, and this figure is used as a benchmark in this analysis. Russian sources report that
the new price schedule will not instituted because the government has decided to allow producers and GPPs to
negotiate prices freely. The $20/Mcm benchmark APG price used in this analysis should therefore be viewed as
a conservative figure.
Figure C1
Equivalent Netback APG Price
§ The maximum price that an owner of GPP/CCGT/Distributed power
and still make a 10% real IRR
Connection costs
(Plant inlet price less connection costs)
Fieldi.e. NPV
10= 0Plant inlet price
Option
Equivalent Netback APG price = Wellhead price
§could pay the field owner after plant construction and connection costs
Field Real IRR = 10%
Revenues
Plant Costs
Option
Equivalent Netback APG price = Wellhead price
Associated Gas in Russia – Appendices | Page 28 December 2007
Gas Group Consulting
Option 1: Gas Processing and sale of dry gas through the Gazprom system
The economics of utilizing APG in Gas Processing Plants (GPPs) depend on several factors: the capital cost of
constructing GPPs, APG and dry gas prices, and the extent to which GPPs are integrated into the
petrochemicals value chain. This sections analyzes the economics of these factors.
Gas Processing Plant Capital Costs
The capital costs of a GPP are typically a function of five factors, some of which are individually discussed
below:
Throughput (Bcm/y);
Composition of the APG: determines the amount of processing required;
Fractionation/Condensate Splitting: number of fractionation towers determines final product mix;
Location;
Type of build (new-build or expansion). Although there is potential to expand existing GPPs and
some expansion plans are underway, the analysis assumes conservatively that GPPs will need to
be built in new locations.
Throughput
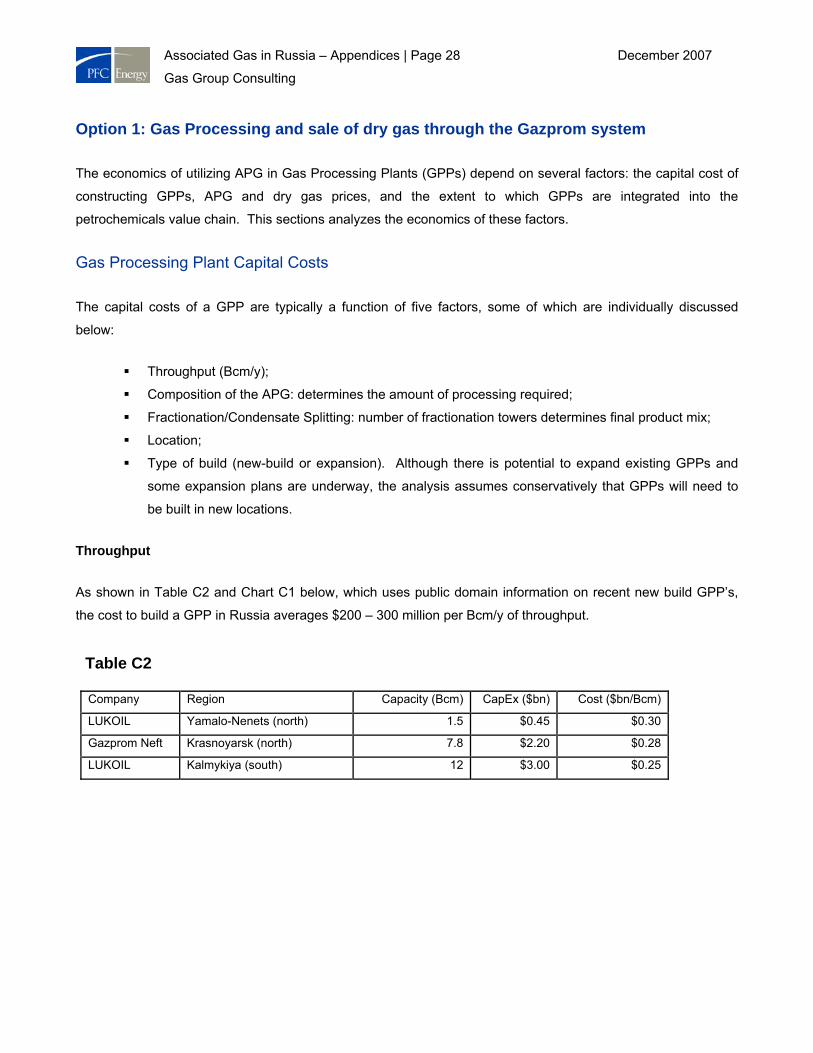
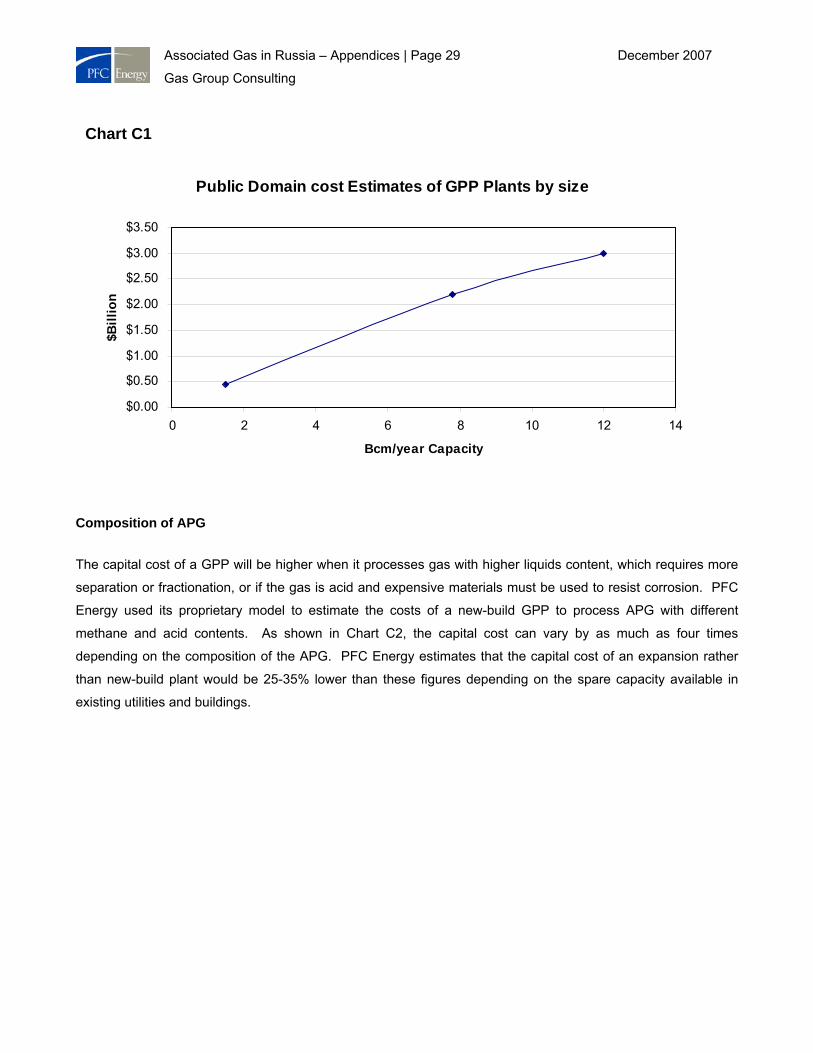
As shown in Table C2 and Chart C1 below, which uses public domain information on recent new build GPP’s,
the cost to build a GPP in Russia averages $200 – 300 million per Bcm/y of throughput.
Table C2
Company Region Capacity (Bcm) CapEx ($bn) Cost ($bn/Bcm)
LUKOIL Yamalo-Nenets (north) 1.5 $0.45 $0.30
Gazprom Neft Krasnoyarsk (north) 7.8 $2.20 $0.28
LUKOIL Kalmykiya (south) 12 $3.00 $0.25
Associated Gas in Russia – Appendices | Page 29 December 2007
Gas Group Consulting
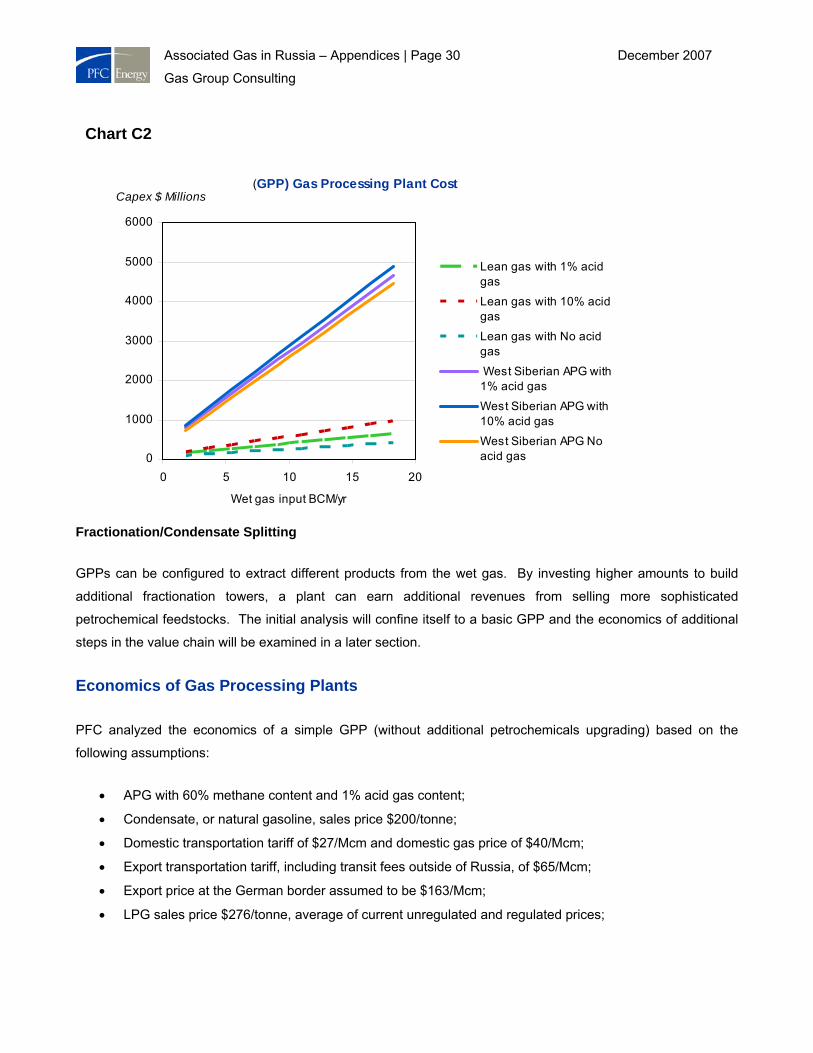
Composition of APG
The capital cost of a GPP will be higher when it processes gas with higher liquids content, which requires more
separation or fractionation, or if the gas is acid and expensive materials must be used to resist corrosion. PFC
Energy used its proprietary model to estimate the costs of a new-build GPP to process APG with different
methane and acid contents. As shown in Chart C2, the capital cost can vary by as much as four times
depending on the composition of the APG. PFC Energy estimates that the capital cost of an expansion rather
than new-build plant would be 25-35% lower than these figures depending on the spare capacity available in
existing utilities and buildings.
Chart C1
Public Domain cost Estimates of GPP Plants by size
$0.00
$0.50
$1.00
$1.50
$2.00
$2.50
$3.00
$3.50
0 2 4 6 8 10 12 14
Bcm/year Capacity
$Bill
ion
Associated Gas in Russia – Appendices | Page 30 December 2007
Gas Group Consulting
Fractionation/Condensate Splitting
GPPs can be configured to extract different products from the wet gas. By investing higher amounts to build
additional fractionation towers, a plant can earn additional revenues from selling more sophisticated
petrochemical feedstocks. The initial analysis will confine itself to a basic GPP and the economics of additional
steps in the value chain will be examined in a later section.
Economics of Gas Processing Plants
PFC analyzed the economics of a simple GPP (without additional petrochemicals upgrading) based on the
following assumptions:
• APG with 60% methane content and 1% acid gas content;
• Condensate, or natural gasoline, sales price $200/tonne;
• Domestic transportation tariff of $27/Mcm and domestic gas price of $40/Mcm;
• Export transportation tariff, including transit fees outside of Russia, of $65/Mcm;
• Export price at the German border assumed to be $163/Mcm;
• LPG sales price $276/tonne, average of current unregulated and regulated prices;
Chart C2
(GPP) Gas Processing Plant Cost
0
1000
2000
3000
4000
5000
6000
0 5 10 15 20
Wet gas input BCM/yr
Capex $ Millions
Lean gas with 1% acidgas
Lean gas with 10% acidgas
Lean gas with No acidgas
West Siberian APG with1% acid gas
West Siberian APG with10% acid gas
West Siberian APG Noacid gas
Associated Gas in Russia – Appendices | Page 31 December 2007
Gas Group Consulting
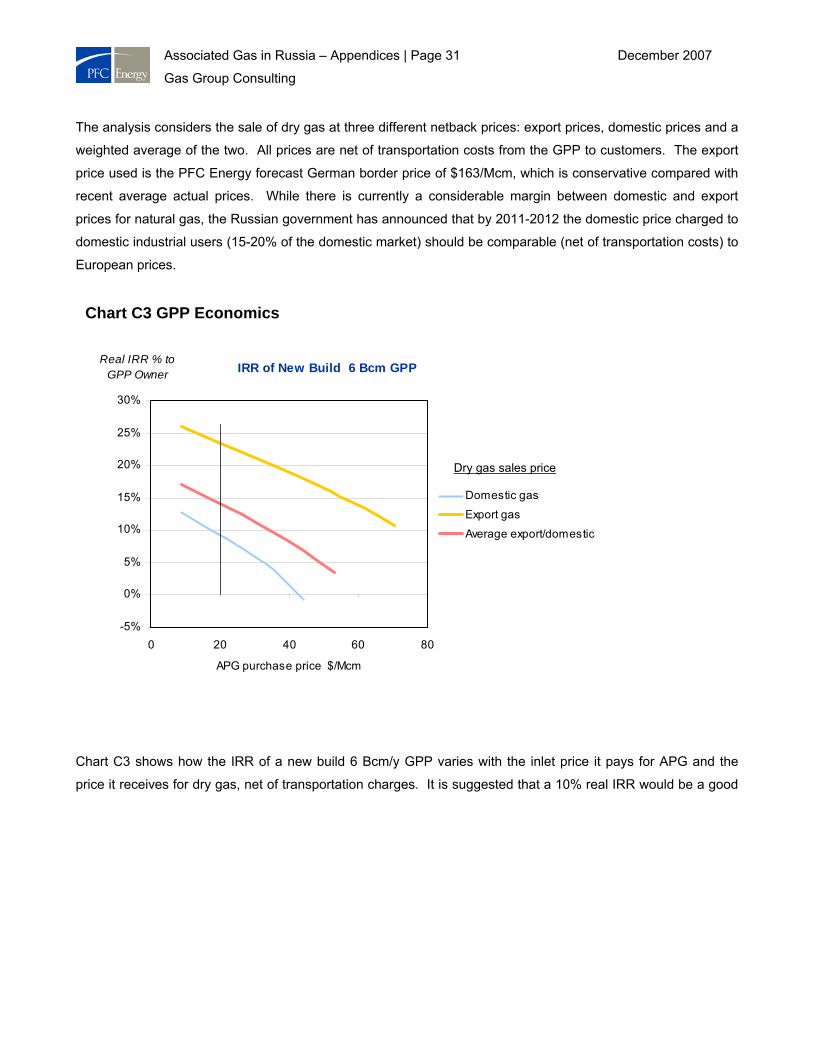
The analysis considers the sale of dry gas at three different netback prices: export prices, domestic prices and a
weighted average of the two. All prices are net of transportation costs from the GPP to customers. The export
price used is the PFC Energy forecast German border price of $163/Mcm, which is conservative compared with
recent average actual prices. While there is currently a considerable margin between domestic and export
prices for natural gas, the Russian government has announced that by 2011-2012 the domestic price charged to
domestic industrial users (15-20% of the domestic market) should be comparable (net of transportation costs) to
European prices.
Chart C3 shows how the IRR of a new build 6 Bcm/y GPP varies with the inlet price it pays for APG and the
price it receives for dry gas, net of transportation charges. It is suggested that a 10% real IRR would be a good
Chart C3 GPP Economics
IRR of New Build 6 Bcm GPP
-5%
0%
5%
10%
15%
20%
25%
30%
0 20 40 60 80
APG purchase price $/Mcm
Real IRR % to GPP Owner
Domestic gas
Export gas
Average export/domestic
Dry gas sales price
Associated Gas in Russia – Appendices | Page 32 December 2007
Gas Group Consulting
return for an owner of a new build GPP plant2. At the benchmark $20/Mcm APG purchase price the plant can
earn an acceptable return if it receives an average dry gas price that slightly exceeds the current domestic price.
At export-equivalent netback gas prices, which may be achieved by 2011-2012, the 6 Bcm/y GPP could afford to
pay up to $80/Mcm, four times the $20/Mcm benchmark price, and still achieve the 10% IRR.
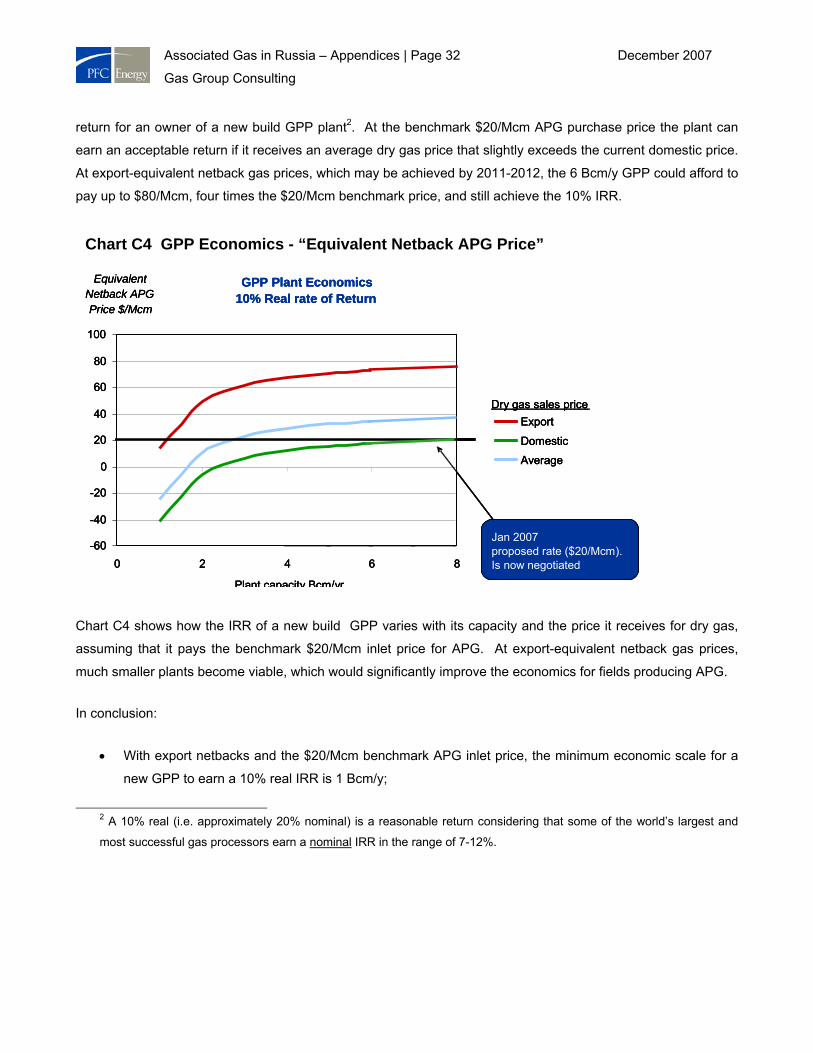
Chart C4 shows how the IRR of a new build GPP varies with its capacity and the price it receives for dry gas,
assuming that it pays the benchmark $20/Mcm inlet price for APG. At export-equivalent netback gas prices,
much smaller plants become viable, which would significantly improve the economics for fields producing APG.
In conclusion:
• With export netbacks and the $20/Mcm benchmark APG inlet price, the minimum economic scale for a
new GPP to earn a 10% real IRR is 1 Bcm/y;
2 A 10% real (i.e. approximately 20% nominal) is a reasonable return considering that some of the world’s largest and
most successful gas processors earn a nominal IRR in the range of 7-12%.
Chart C4 GPP Economics - “Equivalent Netback APG Price”
GPP Plant Economics 10% Real rate of Return
-60
-40
-20
0
20
40
60
80
100
0 2 4 6 8
Plant capacity Bcm/yr
Equivalent Netback APG Price $/Mcm
Export
Domestic
Average
Dry gas sales price
Jan 2007 proposed rate ($20/Mcm). Is now negotiated
GPP Plant Economics 10% Real rate of Return
-60
-40
-20
0
20
40
60
80
100
0 2 4 6 8
Plant capacity Bcm/yr
Equivalent Netback APG Price $/Mcm
Export
Domestic
Average
Dry gas sales price
Jan 2007 proposed rate ($20/Mcm). Is now negotiated
GPP Plant Economics 10% Real rate of Return
-60
-40
-20
0
20
40
60
80
100
0 2 4 6 8
Plant capacity Bcm/yr
Equivalent Netback APG Price $/Mcm
Export
Domestic
Average
Dry gas sales price
Jan 2007 proposed rate ($20/Mcm). Is now negotiated
Associated Gas in Russia – Appendices | Page 33 December 2007
Gas Group Consulting
• At current Russian domestic gas prices and the $20/Mcm benchmark APG purchase price, the minimum
economic scale for a new build GPP to earn a 10% real IRR increases to 6 Bcm/y;
• A 2 Bcm/y expansion of an existing plant, costing 25-35% less than a new build, could generate an
acceptable return based on the benchmark $20/Mcm APG and domestic dry gas prices.
The Petrochemicals Value Chain
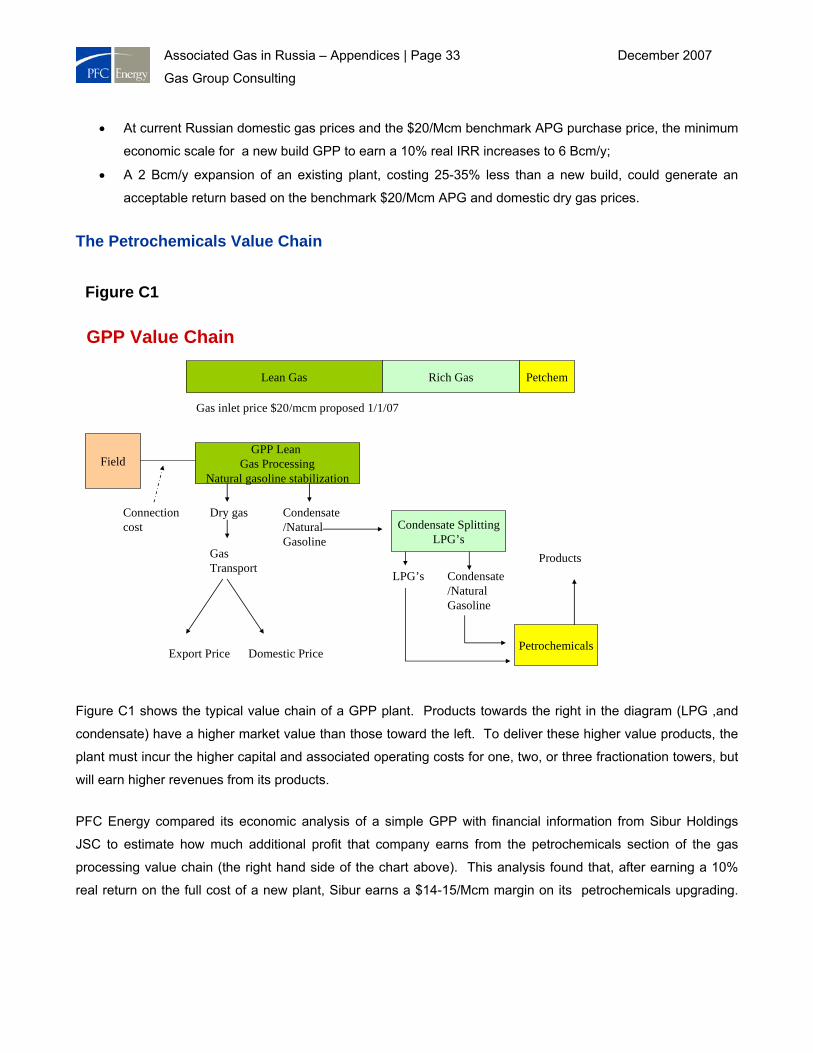
Figure C1 shows the typical value chain of a GPP plant. Products towards the right in the diagram (LPG ,and
condensate) have a higher market value than those toward the left. To deliver these higher value products, the
plant must incur the higher capital and associated operating costs for one, two, or three fractionation towers, but
will earn higher revenues from its products.
PFC Energy compared its economic analysis of a simple GPP with financial information from Sibur Holdings
JSC to estimate how much additional profit that company earns from the petrochemicals section of the gas
processing value chain (the right hand side of the chart above). This analysis found that, after earning a 10%
real return on the full cost of a new plant, Sibur earns a $14-15/Mcm margin on its petrochemicals upgrading.
Figure C1
GPP Value Chain
FieldGPP Lean
Gas ProcessingNatural gasoline stabilization
Connection cost
Gas inlet price $20/mcm proposed 1/1/07
Dry gasCondensate Splitting
LPG’s
Petrochemicals
Condensate/Natural Gasoline
LPG’s Condensate/Natural Gasoline
Gas Transport
Export Price Domestic Price
Products
Lean Gas Rich Gas Petchem
Associated Gas in Russia – Appendices | Page 34 December 2007
Gas Group Consulting
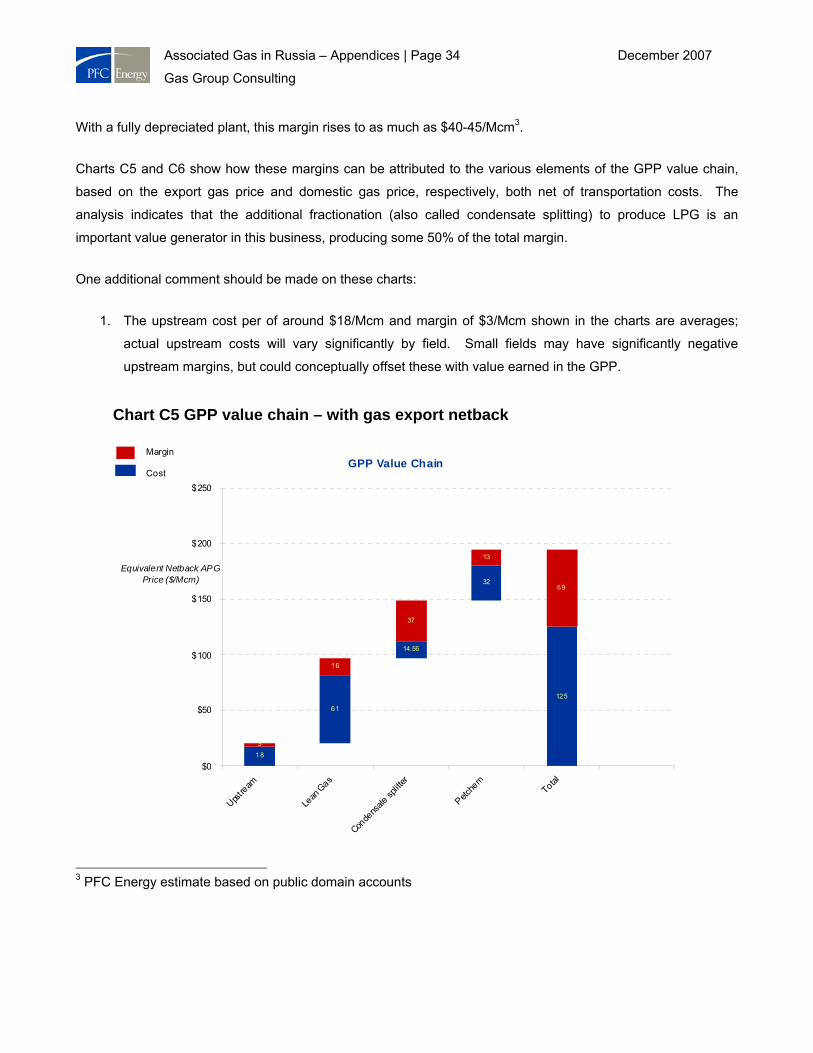
With a fully depreciated plant, this margin rises to as much as $40-45/Mcm3.
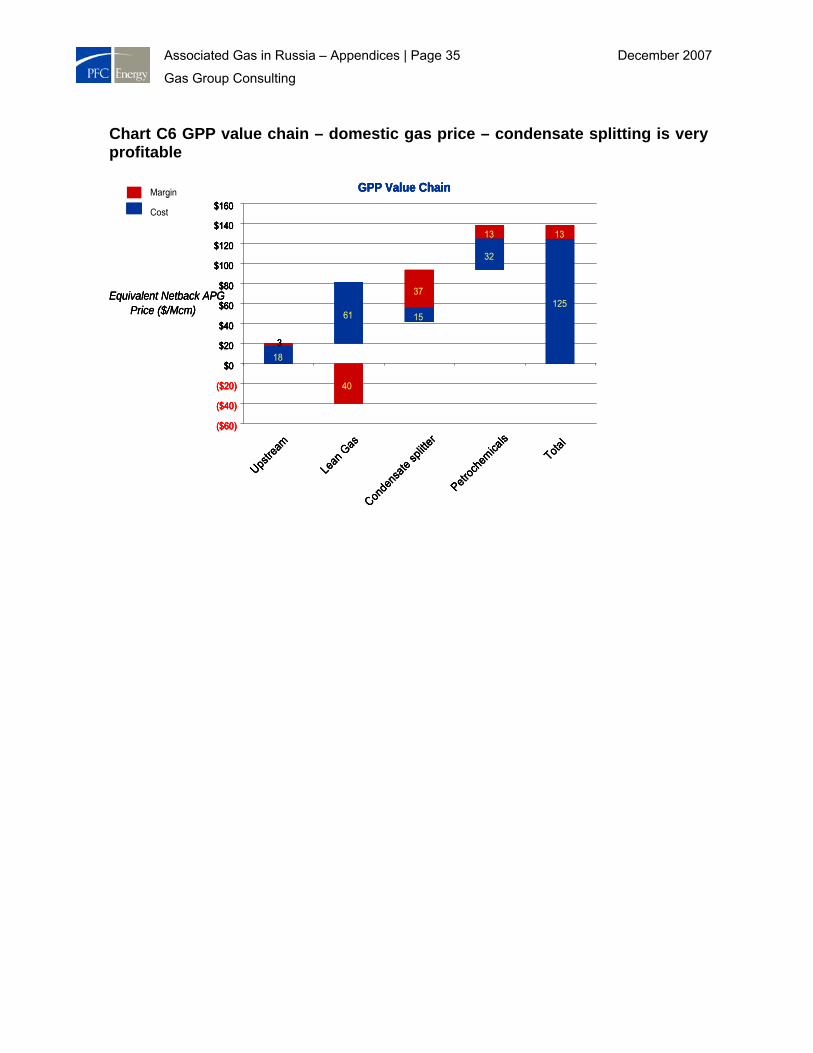
Charts C5 and C6 show how these margins can be attributed to the various elements of the GPP value chain,
based on the export gas price and domestic gas price, respectively, both net of transportation costs. The
analysis indicates that the additional fractionation (also called condensate splitting) to produce LPG is an
important value generator in this business, producing some 50% of the total margin.
One additional comment should be made on these charts:
1. The upstream cost per of around $18/Mcm and margin of $3/Mcm shown in the charts are averages;
actual upstream costs will vary significantly by field. Small fields may have significantly negative
upstream margins, but could conceptually offset these with value earned in the GPP.
3 PFC Energy estimate based on public domain accounts
Chart C5 GPP value chain – with gas export netback
GPP Value Chain
14.56
37
18
61
32
125
16
13
69
3
$0
$50
$100
$150
$200
$250
Upstream
Lean
Gas
Conde
nsate
splitt
er
Petche
mTotal
Equivalent Netback APG Price ($/Mcm)
Margin
Cost
Associated Gas in Russia – Appendices | Page 35 December 2007
Gas Group Consulting
Chart C6 GPP value chain – domestic gas price – condensate splitting is very profitable
GPP Value Chain
15
37
18
61
32
125
40
13
3
13
($60)
($40)
($20)
$0
$20
$40
$60
$80
$100
$120
$140
$160
Upstre
am
Lean
Gas
Conde
nsate
splitt
er
Petroc
hemica
lsTota
l
Equivalent Netback APG Price ($/Mcm)
Margin
Cost
GPP Value Chain
15
37
18
61
32
125
40
13
3
13
($60)
($40)
($20)
$0
$20
$40
$60
$80
$100
$120
$140
$160
Upstre
am
Lean
Gas
Conde
nsate
splitt
er
Petroc
hemica
lsTota
l
Equivalent Netback APG Price ($/Mcm)
Margin
Cost
GPP Value Chain
15
37
18
61
32
125
40
13
3
13
($60)
($40)
($20)
$0
$20
$40
$60
$80
$100
$120
$140
$160
GPP Value Chain
15
37
18
61
32
125
40
13
3
13
($60)
($40)
($20)
$0
$20
$40
$60
$80
$100
$120
$140
$160
Upstre
am
Lean
Gas
Conde
nsate
splitt
er
Petroc
hemica
lsTota
l
Equivalent Netback APG Price ($/Mcm)
Margin
Cost
Associated Gas in Russia – Appendices | Page 36 December 2007
Gas Group Consulting
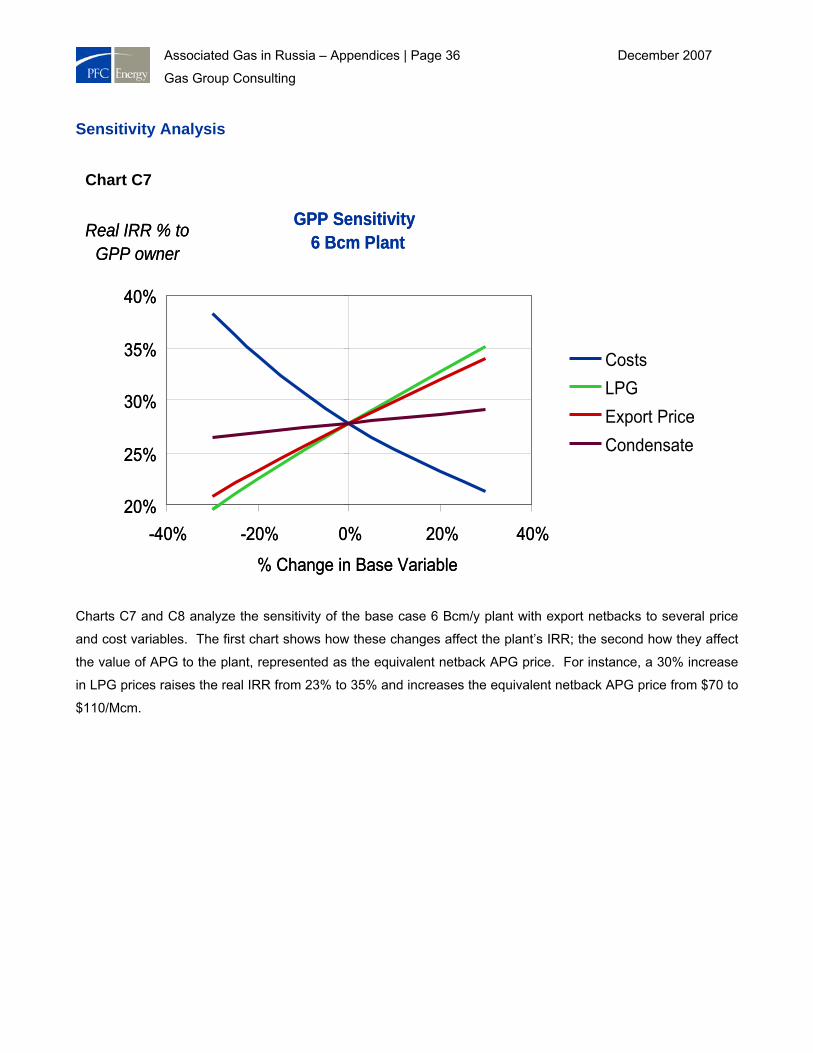
Sensitivity Analysis
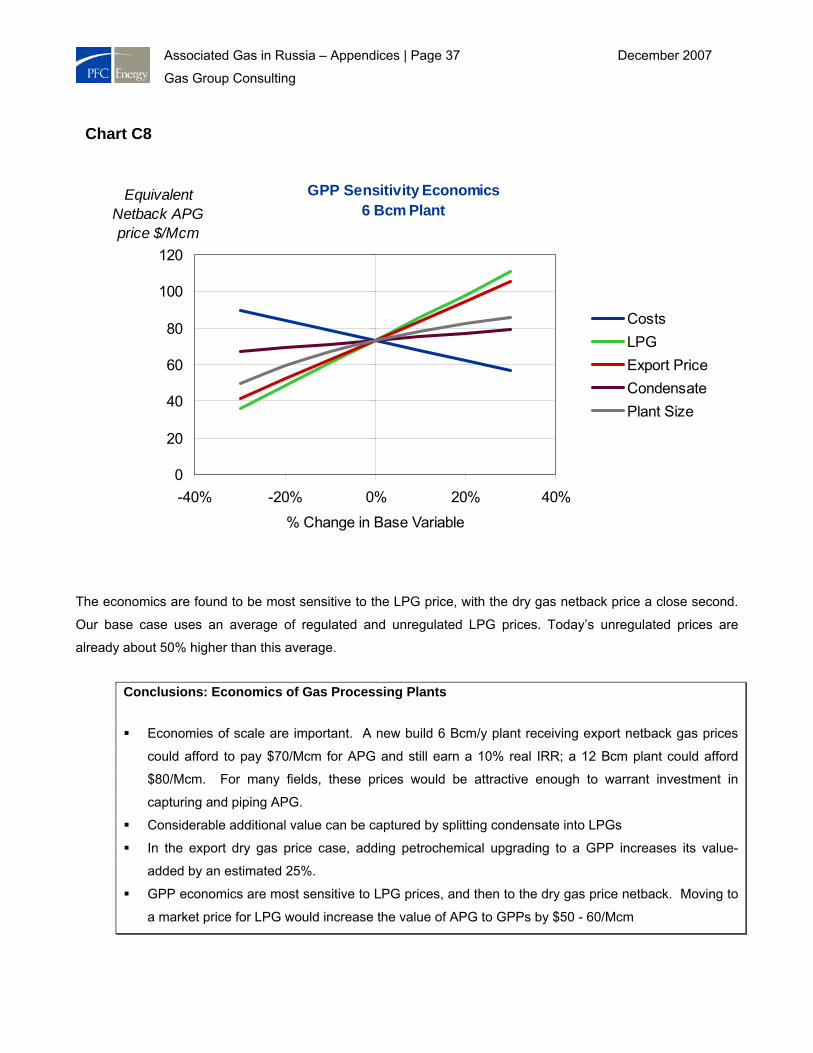
Charts C7 and C8 analyze the sensitivity of the base case 6 Bcm/y plant with export netbacks to several price
and cost variables. The first chart shows how these changes affect the plant’s IRR; the second how they affect
the value of APG to the plant, represented as the equivalent netback APG price. For instance, a 30% increase
in LPG prices raises the real IRR from 23% to 35% and increases the equivalent netback APG price from $70 to
$110/Mcm.
Chart C7
GPP Sensitivity6 Bcm Plant
20%
25%
30%
35%
40%
-40% -20% 0% 20% 40%
% Change in Base Variable
Real IRR % to GPP owner
CostsLPGExport PriceCondensate
GPP Sensitivity6 Bcm Plant
20%
25%
30%
35%
40%
-40% -20% 0% 20% 40%
% Change in Base Variable
Real IRR % to GPP owner
CostsLPGExport PriceCondensate
Associated Gas in Russia – Appendices | Page 37 December 2007
Gas Group Consulting
The economics are found to be most sensitive to the LPG price, with the dry gas netback price a close second.
Our base case uses an average of regulated and unregulated LPG prices. Today’s unregulated prices are
already about 50% higher than this average.
Conclusions: Economics of Gas Processing Plants
Economies of scale are important. A new build 6 Bcm/y plant receiving export netback gas prices
could afford to pay $70/Mcm for APG and still earn a 10% real IRR; a 12 Bcm plant could afford
$80/Mcm. For many fields, these prices would be attractive enough to warrant investment in
capturing and piping APG.
Considerable additional value can be captured by splitting condensate into LPGs
In the export dry gas price case, adding petrochemical upgrading to a GPP increases its value-
added by an estimated 25%.
GPP economics are most sensitive to LPG prices, and then to the dry gas price netback. Moving to
a market price for LPG would increase the value of APG to GPPs by $50 - 60/Mcm
Chart C8
GPP Sensitivity Economics6 Bcm Plant
0
20
40
60
80
100
120
-40% -20% 0% 20% 40%
% Change in Base Variable
Equivalent Netback APG price $/Mcm
CostsLPGExport PriceCondensatePlant Size
Associated Gas in Russia – Appendices | Page 38 December 2007
Gas Group Consulting
Option 2: Using gas to generate local power vs. purchasing power from the grid or generating local power from diesel
Oil production is highly energy-intensive and the oil industry’s electricity demand accounts for a large share of
total electric demand in producing regions—40% in Khanty-Mansiysk, for instance. Electric power generation is
already one of the modes for utilization of APG in this region. The Russian oil industry’s electricity consumption
is also increasing as increasingly mature producing fields require more powerful electric submersible pumps
(ESPs) and other energy-intensive equipment. Russia’s electric power consumption per tonne of extracted
crude was estimated to be 104.3 kWh/t in 2004-2005, and is growing at an estimated 10% annually. Applying
this ratio to total annual Russian oil production of 480 million tonnes suggests that the industry uses some 50
TWh annually, or the equivalent of 7.5 GW of generating capacity operating at 80%.
Utilizing flared APG to generate power could provide three benefits. It would increase APG utilization, reduce
power demand from the grid and augment the output of an electric power system that is stretched to meet the
demands of the growing Russian economy. At an average oilfield, approximately one third of the APG output
would generate sufficient electricity to meet all the field’s power needs.
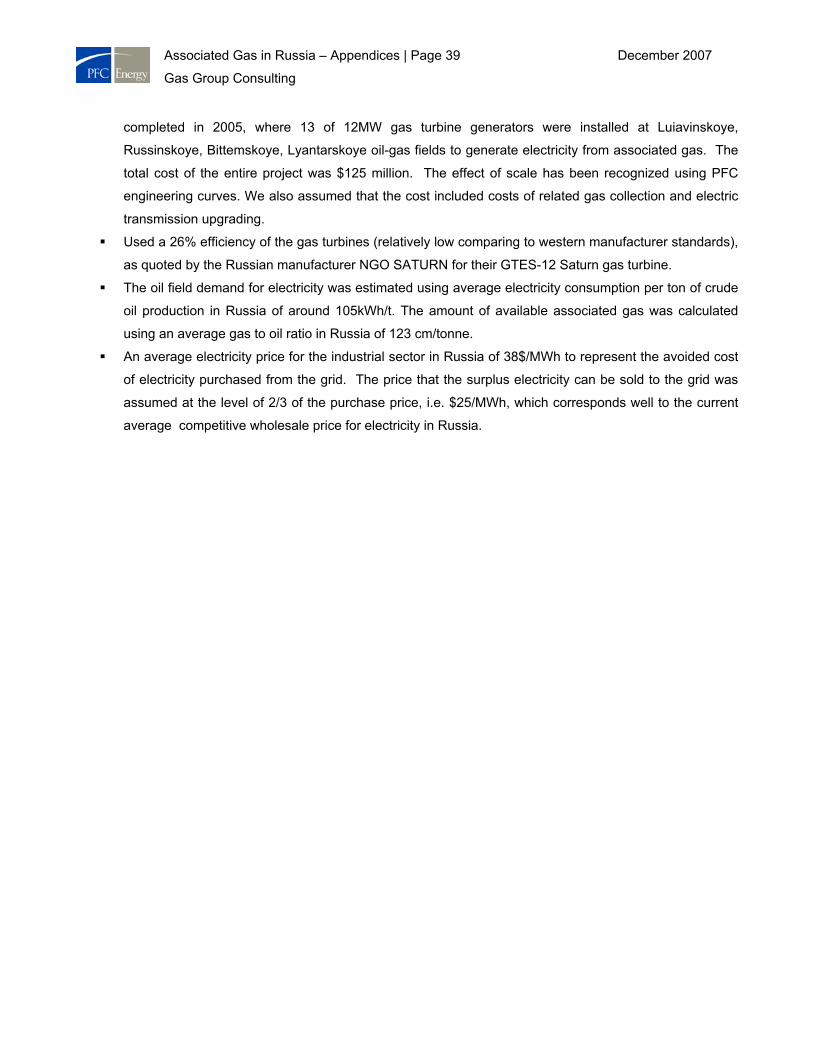
For distributed power generation at the field, PFC Energy estimated the economics of generating electricity
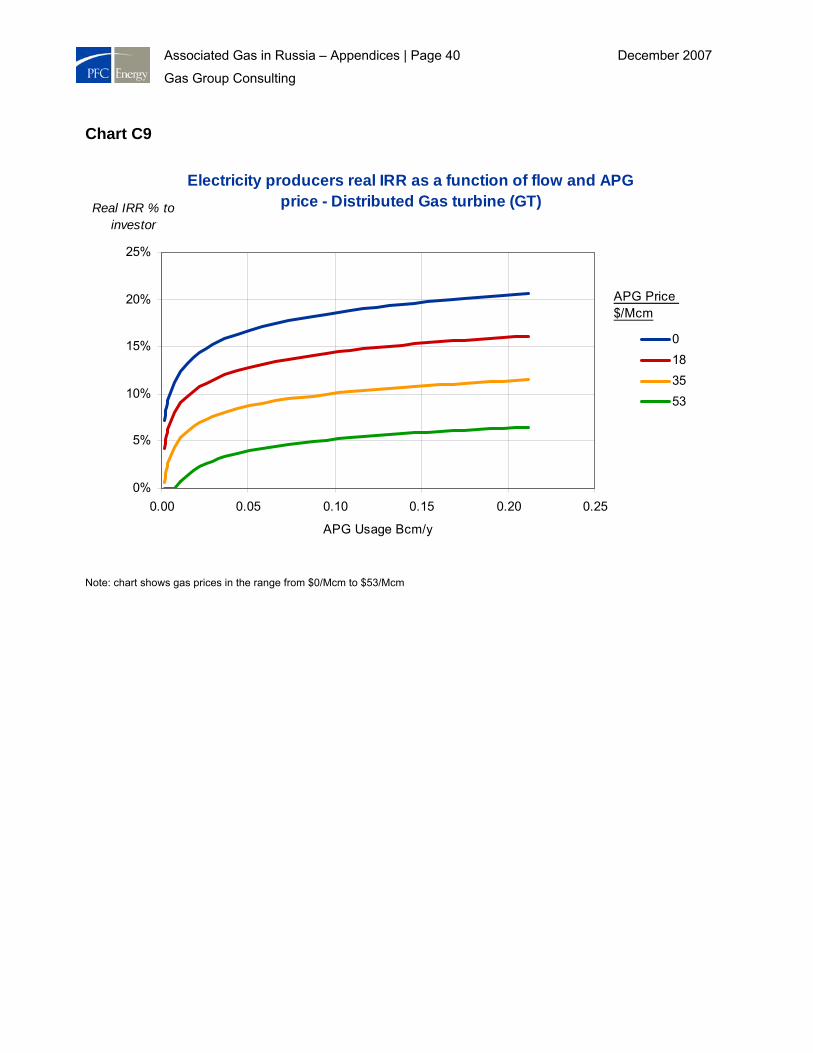
using gas turbine power plants. For fields that currently purchase power from the grid, Charts C9 and C10
summarize these economics in terms of real IRR and equivalent netback APG prices, assuming that 30% of the
power is used at the field and the rest is exported to the grid. In practice, fields with a low GOR might have no
surplus power.
Two potential options for distributed (local) electric power generation were evaluated:
1) Installation of a gas turbine distributed generator at an oil field connected to the power grid to replace
electricity purchased from the grid. Power is assumed to be used for oilfield operations. Any surplus
power is assumed to be sold back to the grid
2) Installation of a gas turbine distributed generator at a remote oil field that cannot be connected to the
power grid and obtains its electricity from a diesel generator. This would result in a reduction in the use
and cost of diesel fuel.
Option 2.1 : Gas Turbine distributed (local) generator at an oil field connected to the grid
In our estimates we assumed the following:
Costs based on the investment cost per unit of generating capacity as in the Surgutneftgas project
Associated Gas in Russia – Appendices | Page 39 December 2007
Gas Group Consulting
completed in 2005, where 13 of 12MW gas turbine generators were installed at Luiavinskoye,
Russinskoye, Bittemskoye, Lyantarskoye oil-gas fields to generate electricity from associated gas. The
total cost of the entire project was $125 million. The effect of scale has been recognized using PFC
engineering curves. We also assumed that the cost included costs of related gas collection and electric
transmission upgrading.
Used a 26% efficiency of the gas turbines (relatively low comparing to western manufacturer standards),
as quoted by the Russian manufacturer NGO SATURN for their GTES-12 Saturn gas turbine.
The oil field demand for electricity was estimated using average electricity consumption per ton of crude
oil production in Russia of around 105kWh/t. The amount of available associated gas was calculated
using an average gas to oil ratio in Russia of 123 cm/tonne.
An average electricity price for the industrial sector in Russia of 38$/MWh to represent the avoided cost
of electricity purchased from the grid. The price that the surplus electricity can be sold to the grid was
assumed at the level of 2/3 of the purchase price, i.e. $25/MWh, which corresponds well to the current
average competitive wholesale price for electricity in Russia.
Associated Gas in Russia – Appendices | Page 40 December 2007
Gas Group Consulting
Chart C9
Electricity producers real IRR as a function of flow and APG price - Distributed Gas turbine (GT)
0%
5%
10%
15%
20%
25%
0.00 0.05 0.10 0.15 0.20 0.25
APG Usage Bcm/y
Real IRR % to investor
0183553
APG Price $/Mcm
Note: chart shows gas prices in the range from $0/Mcm to $53/Mcm
Associated Gas in Russia – Appendices | Page 41 December 2007
Gas Group Consulting
Option 2.2: Gas Turbine distributed (local) generator at an oil field not connected to the grid
This option differs from option 2.1 in that the generating unit was sized to meet only the oil field electric demand.
The avoided diesel generation cost was estimated assuming diesel price of $0.25/liter and 30% efficiency of the
diesel generator.
The other assumptions remained unchanged. It should be noted that in this option significant amounts of
associated gas will still be flared, as the entire oil field demand for electricity can be met by a fraction of APG
produced at a typical oil field.
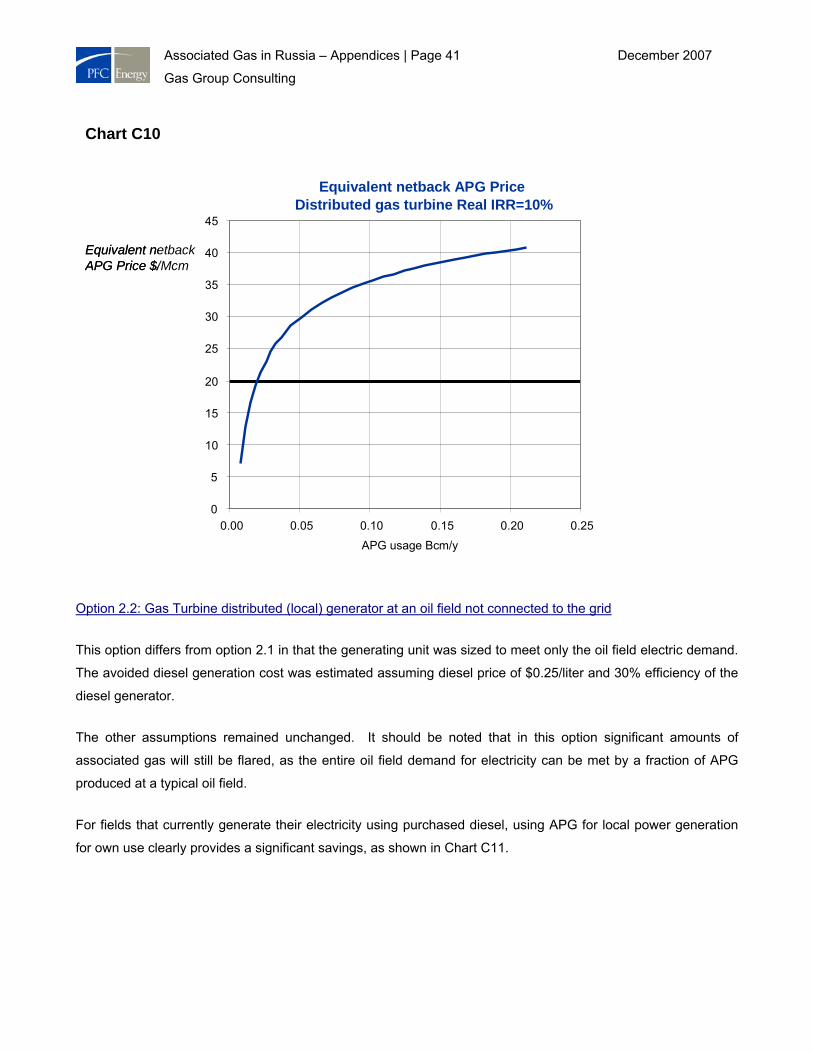
For fields that currently generate their electricity using purchased diesel, using APG for local power generation
for own use clearly provides a significant savings, as shown in Chart C11.
Chart C10
Equivalent netback APG PriceDistributed gas turbine Real IRR=10%
0
5
10
15
20
25
30
35
40
45
0.00 0.05 0.10 0.15 0.20 0.25
APG usage Bcm/y
Equivalent netbackAPG Price $/Mcm
Equivalent netback APG PriceDistributed gas turbine Real IRR=10%
0
5
10
15
20
25
30
35
40
45
0.00 0.05 0.10 0.15 0.20 0.25
APG usage Bcm/y
Equivalent netbackAPG Price $/Mcm
Associated Gas in Russia – Appendices | Page 42 December 2007
Gas Group Consulting
A key factor determining the economics of distributed (local) power generation projects is the assumed price for
avoided electricity purchases from the grid as well as the price for sales of surplus generation to the grid. We
used for our estimates the current average electricity price for the industrial sector in Russia.
A second important factor is the capital cost of the project.
To evaluate impacts on the option economics of these two key input parameters, we performed sensitivity
analysis, testing a range of change from -20% to +20% for both parameters i.e. Electricity and capital costs.
Chart C11
Electricity producers real IRR as a function of Flow and APG Price - Gas Turbine Replacing Diesel Generation
0%
10%
20%
30%
40%
50%
60%
70%
0.00 0.05 0.10 0.15 0.20 0.25
APG use Bcm/yr
Real IRR %
$0$35$71$106$141
APG Purchase Price $/Mcm
Associated Gas in Russia – Appendices | Page 43 December 2007
Gas Group Consulting
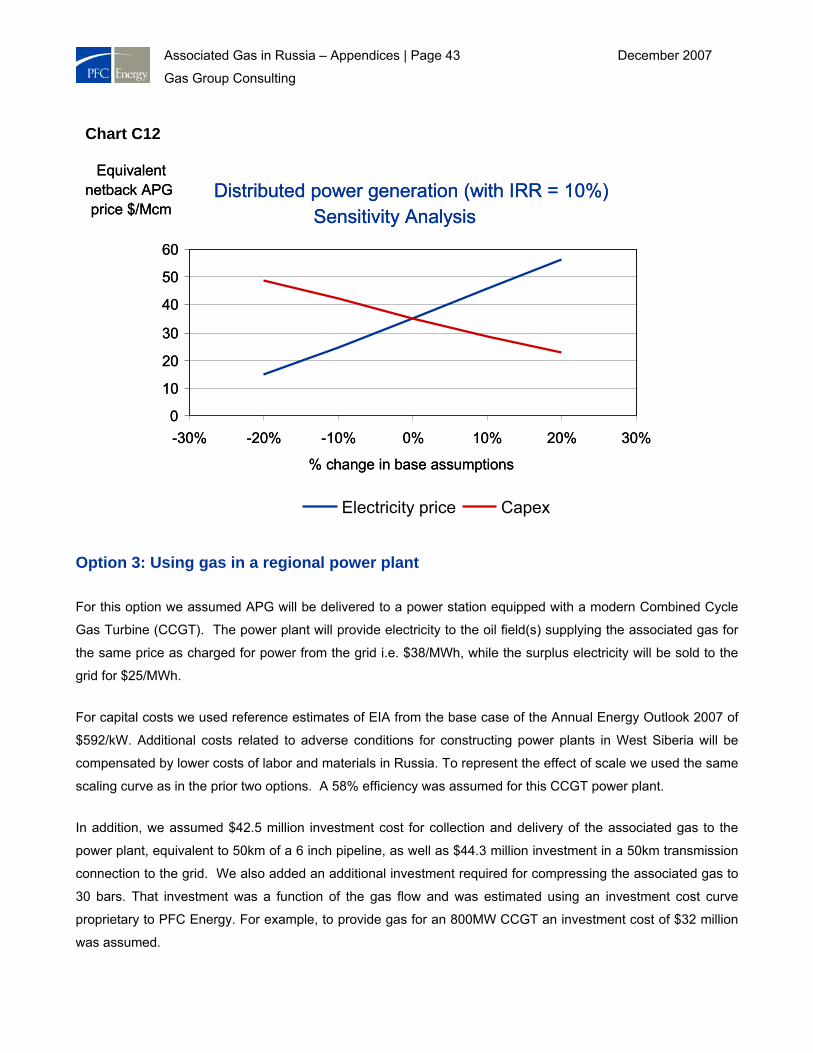
Option 3: Using gas in a regional power plant
For this option we assumed APG will be delivered to a power station equipped with a modern Combined Cycle
Gas Turbine (CCGT). The power plant will provide electricity to the oil field(s) supplying the associated gas for
the same price as charged for power from the grid i.e. $38/MWh, while the surplus electricity will be sold to the
grid for $25/MWh.
For capital costs we used reference estimates of EIA from the base case of the Annual Energy Outlook 2007 of
$592/kW. Additional costs related to adverse conditions for constructing power plants in West Siberia will be
compensated by lower costs of labor and materials in Russia. To represent the effect of scale we used the same
scaling curve as in the prior two options. A 58% efficiency was assumed for this CCGT power plant.
In addition, we assumed $42.5 million investment cost for collection and delivery of the associated gas to the
power plant, equivalent to 50km of a 6 inch pipeline, as well as $44.3 million investment in a 50km transmission
connection to the grid. We also added an additional investment required for compressing the associated gas to
30 bars. That investment was a function of the gas flow and was estimated using an investment cost curve
proprietary to PFC Energy. For example, to provide gas for an 800MW CCGT an investment cost of $32 million
was assumed.
Chart C12
Sensitivity AnalysisDistributed power generation (with IRR = 10%)
0
10
20
30
40
50
60
-30% -20% -10% 0% 10% 20% 30%
% change in base assumptions
Equivalent netback APG price $/Mcm
Electricity price Capex
Sensitivity AnalysisDistributed power generation (with IRR = 10%)
0
10
20
30
40
50
60
-30% -20% -10% 0% 10% 20% 30%
% change in base assumptions
Equivalent netback APG price $/Mcm
Electricity price Capex
Associated Gas in Russia – Appendices | Page 44 December 2007
Gas Group Consulting
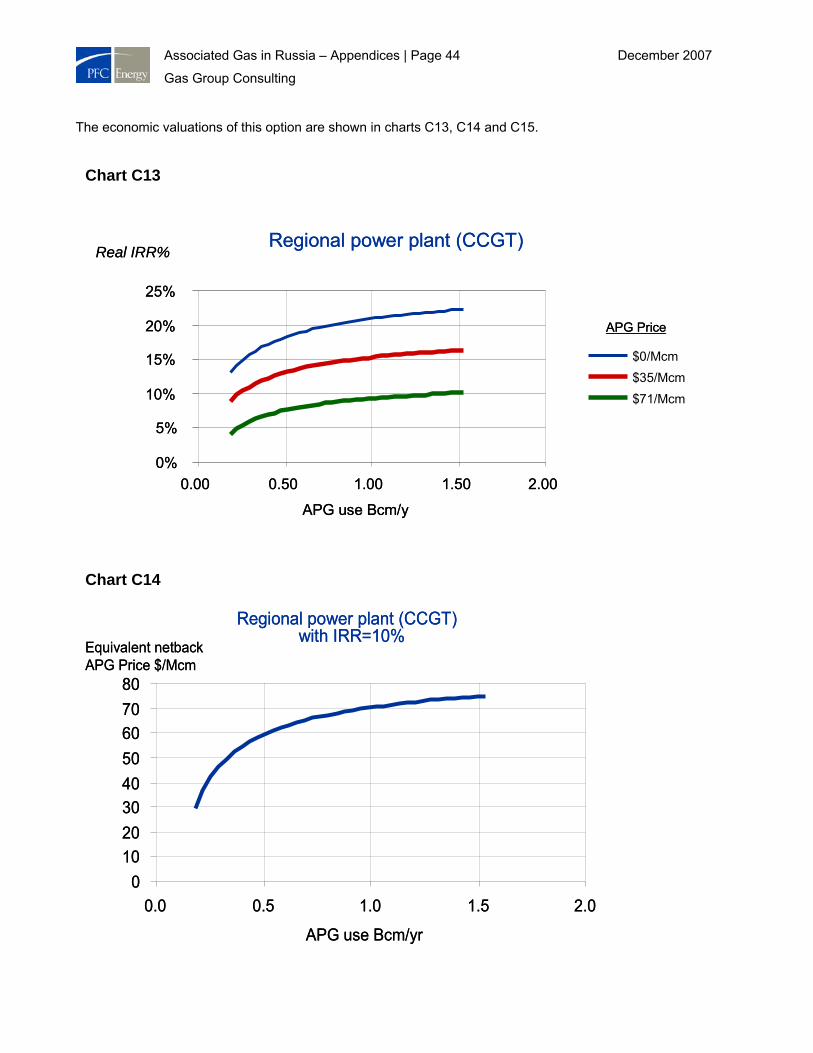
The economic valuations of this option are shown in charts C13, C14 and C15.
Chart C14
Regional power plant (CCGT) with IRR=10%
01020304050607080
0.0 0.5 1.0 1.5 2.0
APG use Bcm/yr
Equivalent netbackAPG Price $/Mcm
Regional power plant (CCGT) with IRR=10%
01020304050607080
0.0 0.5 1.0 1.5 2.0
APG use Bcm/yr
Equivalent netbackAPG Price $/Mcm
Chart C13
0%
5%
10%
15%
20%
25%
0.00 0.50 1.00 1.50 2.00
APG use Bcm/y
Real IRR%
$0/Mcm$35/Mcm$71/Mcm
APG Price
Regional power plant (CCGT)
0%
5%
10%
15%
20%
25%
0.00 0.50 1.00 1.50 2.00
APG use Bcm/y
Real IRR%
$0/Mcm$35/Mcm$71/Mcm
APG Price
Regional power plant (CCGT)
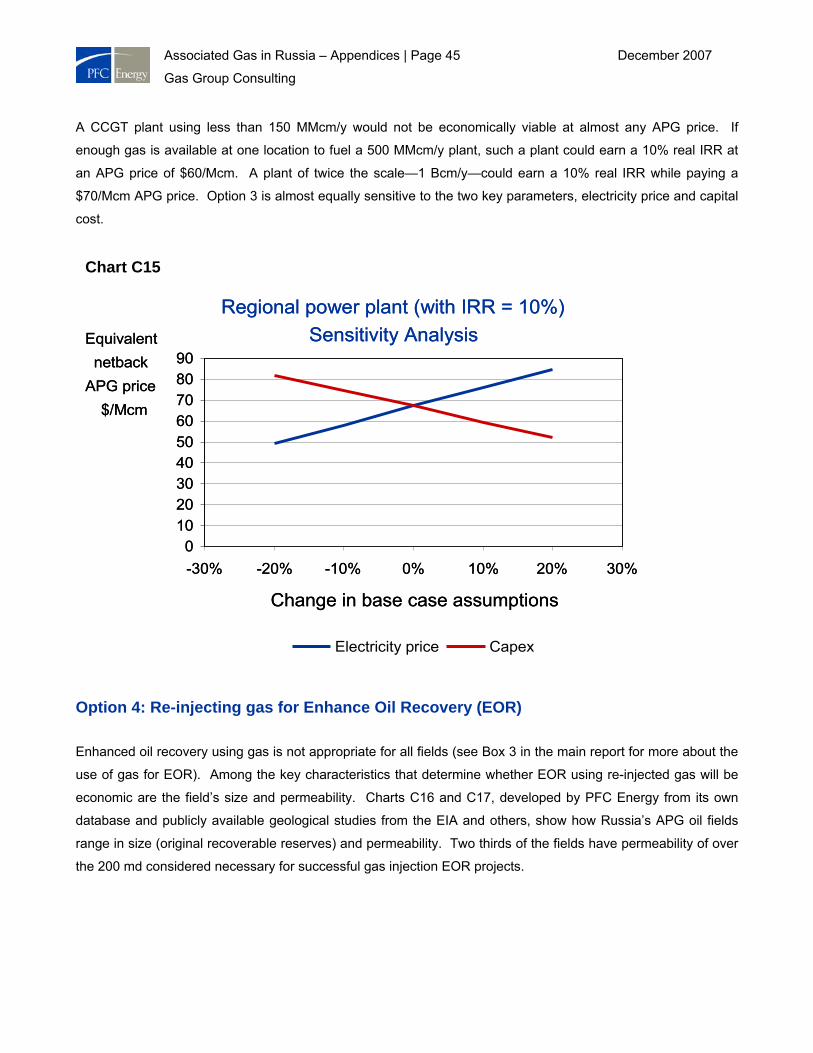
Associated Gas in Russia – Appendices | Page 45 December 2007
Gas Group Consulting
A CCGT plant using less than 150 MMcm/y would not be economically viable at almost any APG price. If
enough gas is available at one location to fuel a 500 MMcm/y plant, such a plant could earn a 10% real IRR at
an APG price of $60/Mcm. A plant of twice the scale—1 Bcm/y—could earn a 10% real IRR while paying a
$70/Mcm APG price. Option 3 is almost equally sensitive to the two key parameters, electricity price and capital
cost.
Option 4: Re-injecting gas for Enhance Oil Recovery (EOR)
Enhanced oil recovery using gas is not appropriate for all fields (see Box 3 in the main report for more about the
use of gas for EOR). Among the key characteristics that determine whether EOR using re-injected gas will be
economic are the field’s size and permeability. Charts C16 and C17, developed by PFC Energy from its own
database and publicly available geological studies from the EIA and others, show how Russia’s APG oil fields
range in size (original recoverable reserves) and permeability. Two thirds of the fields have permeability of over
the 200 md considered necessary for successful gas injection EOR projects.
Chart C15
Sensitivity AnalysisRegional power plant (with IRR = 10%)
0102030405060708090
-30% -20% -10% 0% 10% 20% 30%
Change in base case assumptions
Equivalent netback
APG price $/Mcm
Electricity price Capex
Sensitivity AnalysisRegional power plant (with IRR = 10%)
0102030405060708090
-30% -20% -10% 0% 10% 20% 30%
Change in base case assumptions
Equivalent netback
APG price $/Mcm
Electricity price Capex
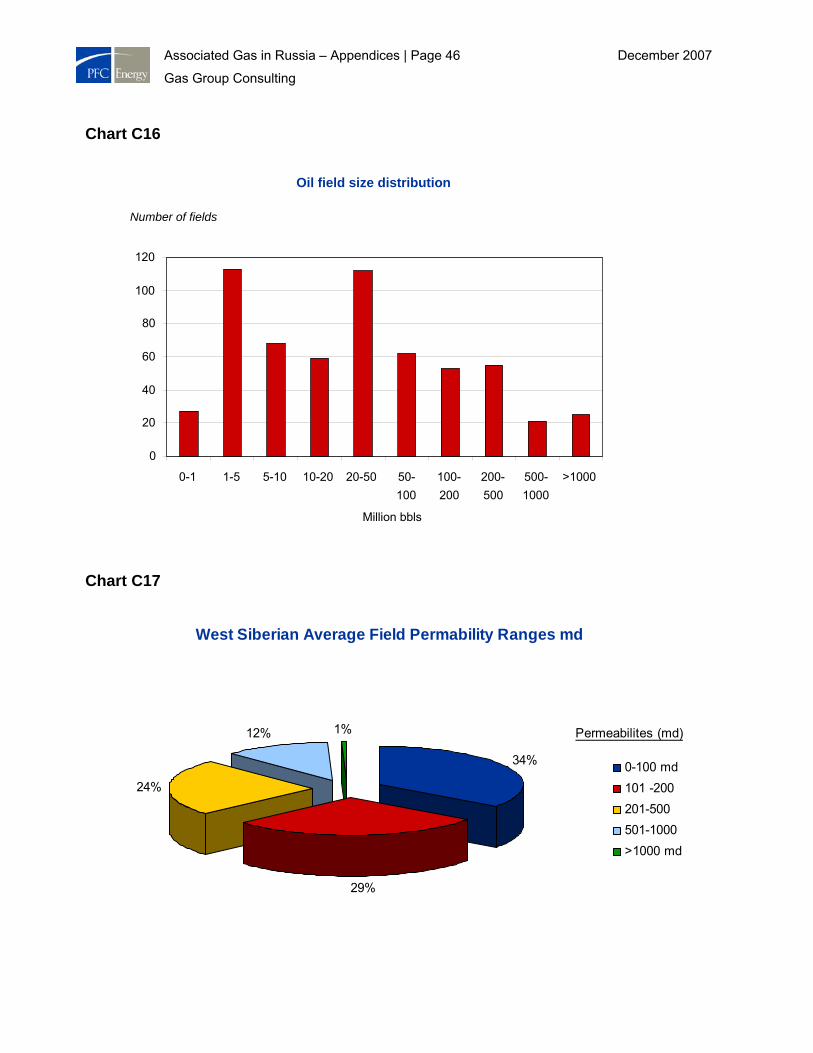
Associated Gas in Russia – Appendices | Page 46 December 2007
Gas Group Consulting
Chart C16
Chart C17
West Siberian Average Field Permability Ranges md
34%
29%
24%
12% 1%
0-100 md101 -200201-500501-1000>1000 md
Permeabilites (md)
Oil field size distribution
0 20 40 60 80
100 120
0-1 1-5 5-10 10-20 20-50 50-100
100-200
200-500
500-1000
>1000
Million bbls
Number of fields
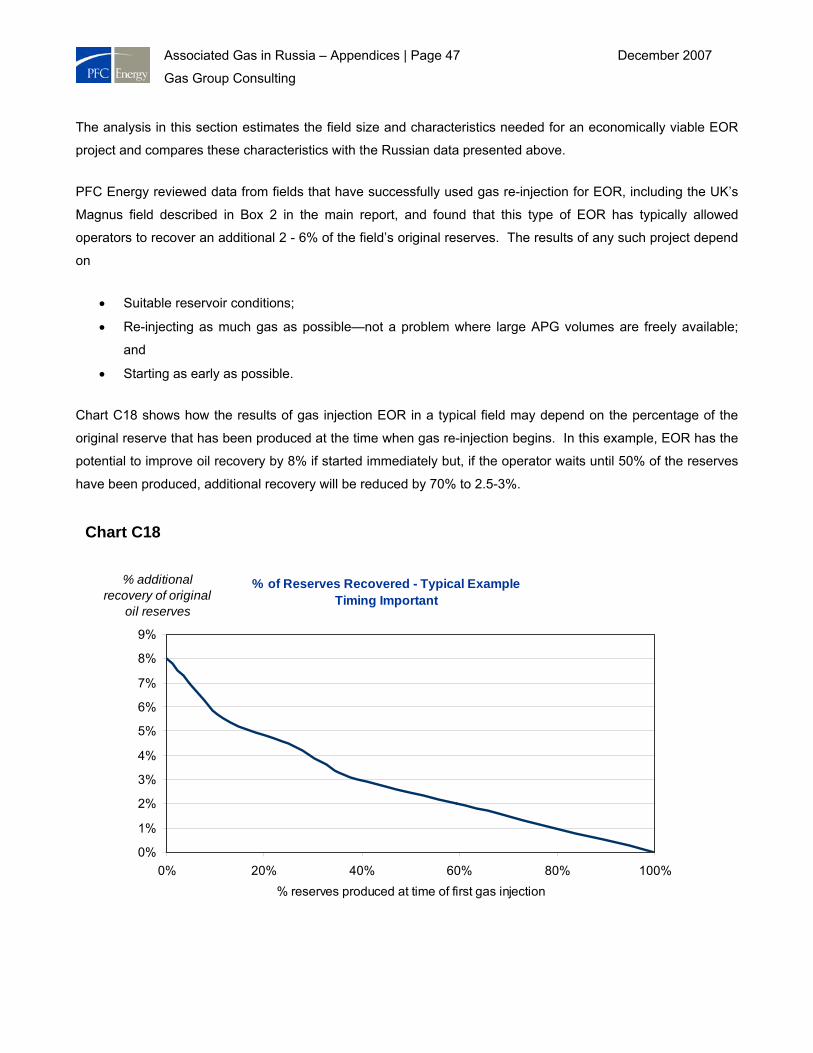
Associated Gas in Russia – Appendices | Page 47 December 2007
Gas Group Consulting
The analysis in this section estimates the field size and characteristics needed for an economically viable EOR
project and compares these characteristics with the Russian data presented above.
PFC Energy reviewed data from fields that have successfully used gas re-injection for EOR, including the UK’s
Magnus field described in Box 2 in the main report, and found that this type of EOR has typically allowed
operators to recover an additional 2 - 6% of the field’s original reserves. The results of any such project depend
on
• Suitable reservoir conditions;
• Re-injecting as much gas as possible—not a problem where large APG volumes are freely available;
and
• Starting as early as possible.
Chart C18 shows how the results of gas injection EOR in a typical field may depend on the percentage of the
original reserve that has been produced at the time when gas re-injection begins. In this example, EOR has the
potential to improve oil recovery by 8% if started immediately but, if the operator waits until 50% of the reserves
have been produced, additional recovery will be reduced by 70% to 2.5-3%.
Chart C18
% of Reserves Recovered - Typical ExampleTiming Important
0%
1%
2%
3%
4%
5%
6%
7%
8%
9%
0% 20% 40% 60% 80% 100%% reserves produced at time of first gas injection
% additional recovery of original
oil reserves
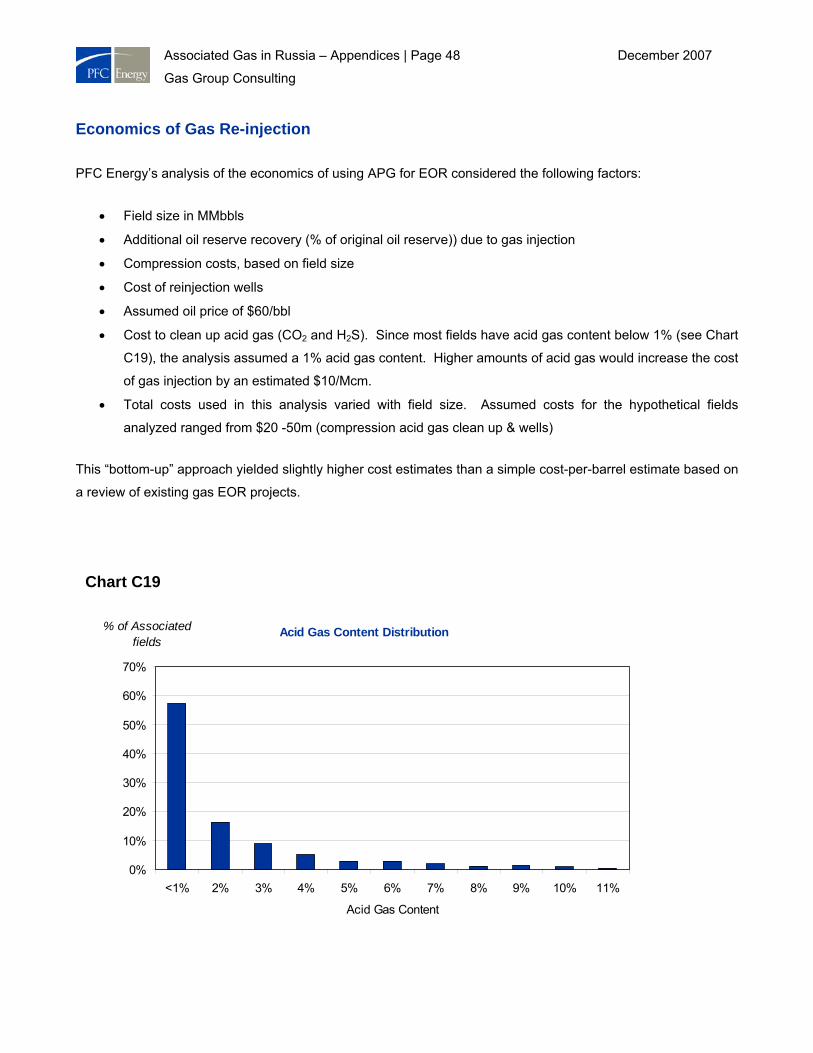
Associated Gas in Russia – Appendices | Page 48 December 2007
Gas Group Consulting
Economics of Gas Re-injection
PFC Energy’s analysis of the economics of using APG for EOR considered the following factors:
• Field size in MMbbls
• Additional oil reserve recovery (% of original oil reserve)) due to gas injection
• Compression costs, based on field size
• Cost of reinjection wells
• Assumed oil price of $60/bbl
• Cost to clean up acid gas (CO2 and H2S). Since most fields have acid gas content below 1% (see Chart
C19), the analysis assumed a 1% acid gas content. Higher amounts of acid gas would increase the cost
of gas injection by an estimated $10/Mcm.
• Total costs used in this analysis varied with field size. Assumed costs for the hypothetical fields
analyzed ranged from $20 -50m (compression acid gas clean up & wells)
This “bottom-up” approach yielded slightly higher cost estimates than a simple cost-per-barrel estimate based on
a review of existing gas EOR projects.
Chart C19
Acid Gas Content Distribution
0%
10%
20%
30%
40%
50%
60%
70%
<1% 2% 3% 4% 5% 6% 7% 8% 9% 10% 11%
Acid Gas Content
% of Associated fields
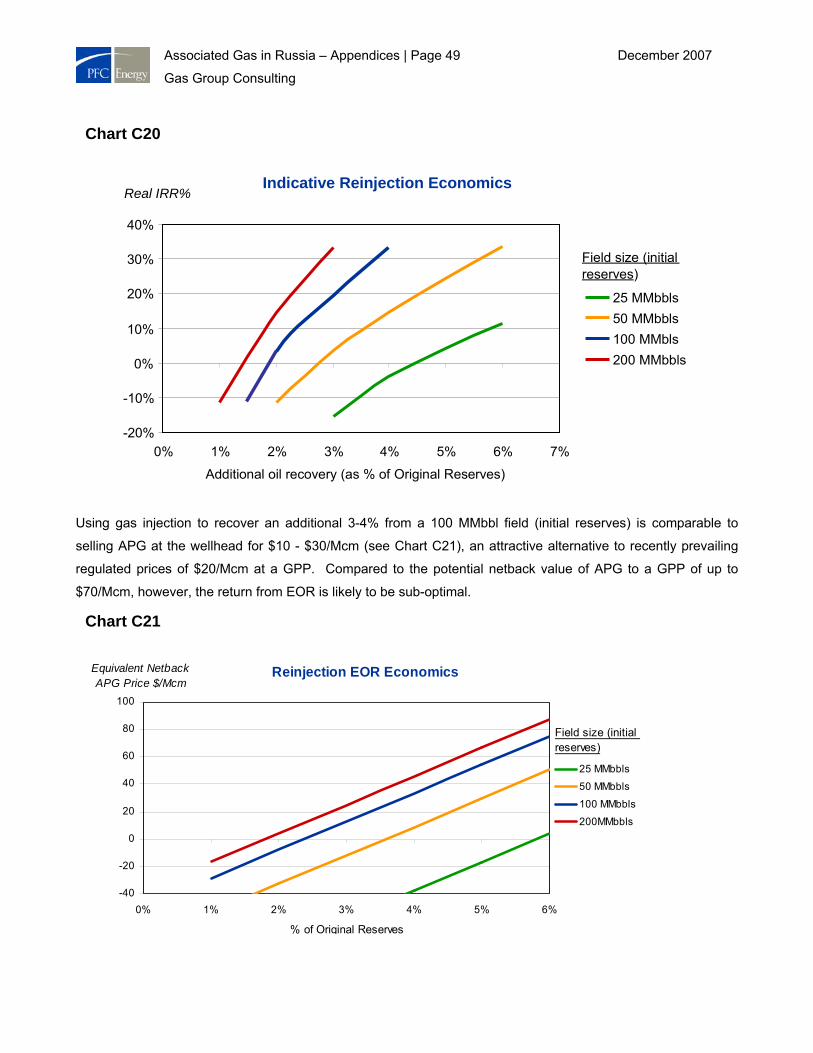
Associated Gas in Russia – Appendices | Page 49 December 2007
Gas Group Consulting
Using gas injection to recover an additional 3-4% from a 100 MMbbl field (initial reserves) is comparable to
selling APG at the wellhead for $10 - $30/Mcm (see Chart C21), an attractive alternative to recently prevailing
regulated prices of $20/Mcm at a GPP. Compared to the potential netback value of APG to a GPP of up to
$70/Mcm, however, the return from EOR is likely to be sub-optimal.
Chart C20
Indicative Reinjection Economics
-20%
-10%
0%
10%
20%
30%
40%
0% 1% 2% 3% 4% 5% 6% 7%
Additional oil recovery (as % of Original Reserves)
Real IRR%
25 MMbbls50 MMbbls100 MMbls200 MMbbls
Field size (initial reserves)
Indicative Reinjection Economics
-20%
-10%
0%
10%
20%
30%
40%
0% 1% 2% 3% 4% 5% 6% 7%
Additional oil recovery (as % of Original Reserves)
Real IRR%
25 MMbbls50 MMbbls100 MMbls200 MMbbls
Field size (initial reserves)
Chart C21
Reinjection EOR Economics
-40
-20
0
20
40
60
80
100
0% 1% 2% 3% 4% 5% 6%
% of Original Reserves
Equivalent Netback APG Price $/Mcm
25 MMbbls50 MMbbls
100 MMbbls200MMbbls
Field size (initial reserves)
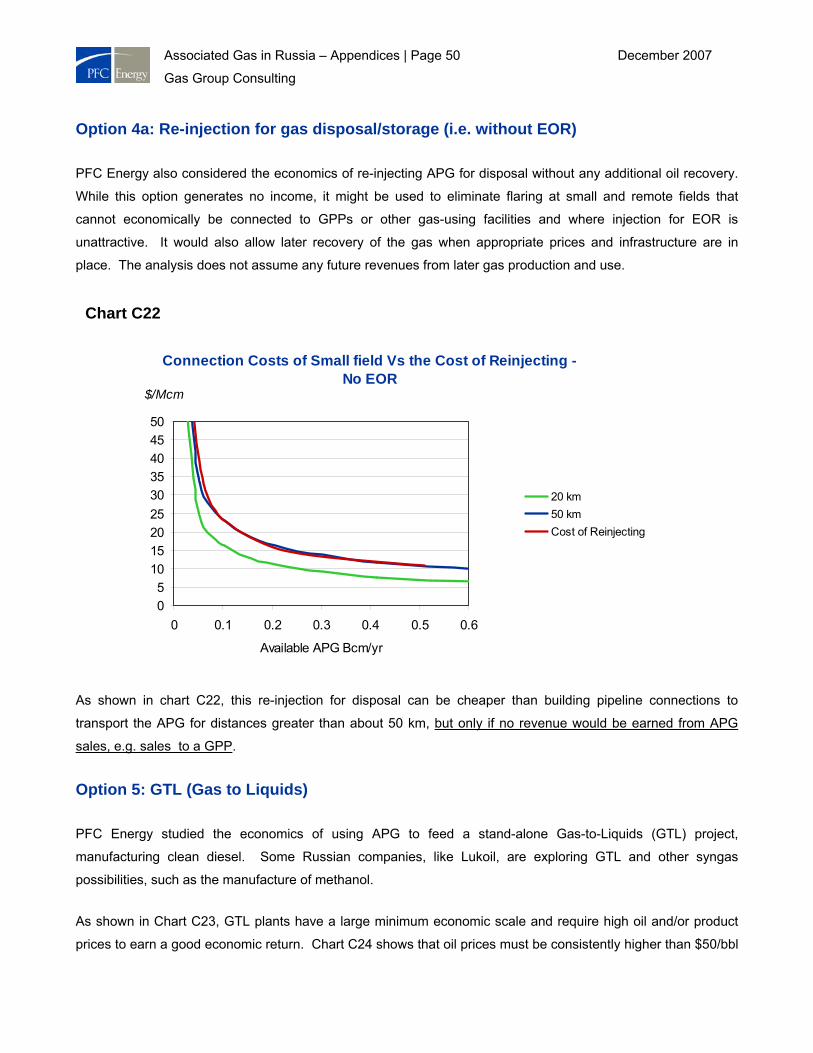
Associated Gas in Russia – Appendices | Page 50 December 2007
Gas Group Consulting
Option 4a: Re-injection for gas disposal/storage (i.e. without EOR)
PFC Energy also considered the economics of re-injecting APG for disposal without any additional oil recovery.
While this option generates no income, it might be used to eliminate flaring at small and remote fields that
cannot economically be connected to GPPs or other gas-using facilities and where injection for EOR is
unattractive. It would also allow later recovery of the gas when appropriate prices and infrastructure are in
place. The analysis does not assume any future revenues from later gas production and use.
As shown in chart C22, this re-injection for disposal can be cheaper than building pipeline connections to
transport the APG for distances greater than about 50 km, but only if no revenue would be earned from APG
sales, e.g. sales to a GPP.
Option 5: GTL (Gas to Liquids)
PFC Energy studied the economics of using APG to feed a stand-alone Gas-to-Liquids (GTL) project,
manufacturing clean diesel. Some Russian companies, like Lukoil, are exploring GTL and other syngas
possibilities, such as the manufacture of methanol.
As shown in Chart C23, GTL plants have a large minimum economic scale and require high oil and/or product
prices to earn a good economic return. Chart C24 shows that oil prices must be consistently higher than $50/bbl
Chart C22
Connection Costs of Small field Vs the Cost of Reinjecting - No EOR
05
101520253035404550
0 0.1 0.2 0.3 0.4 0.5 0.6
Available APG Bcm/yr
$/Mcm
20 km50 kmCost of Reinjecting
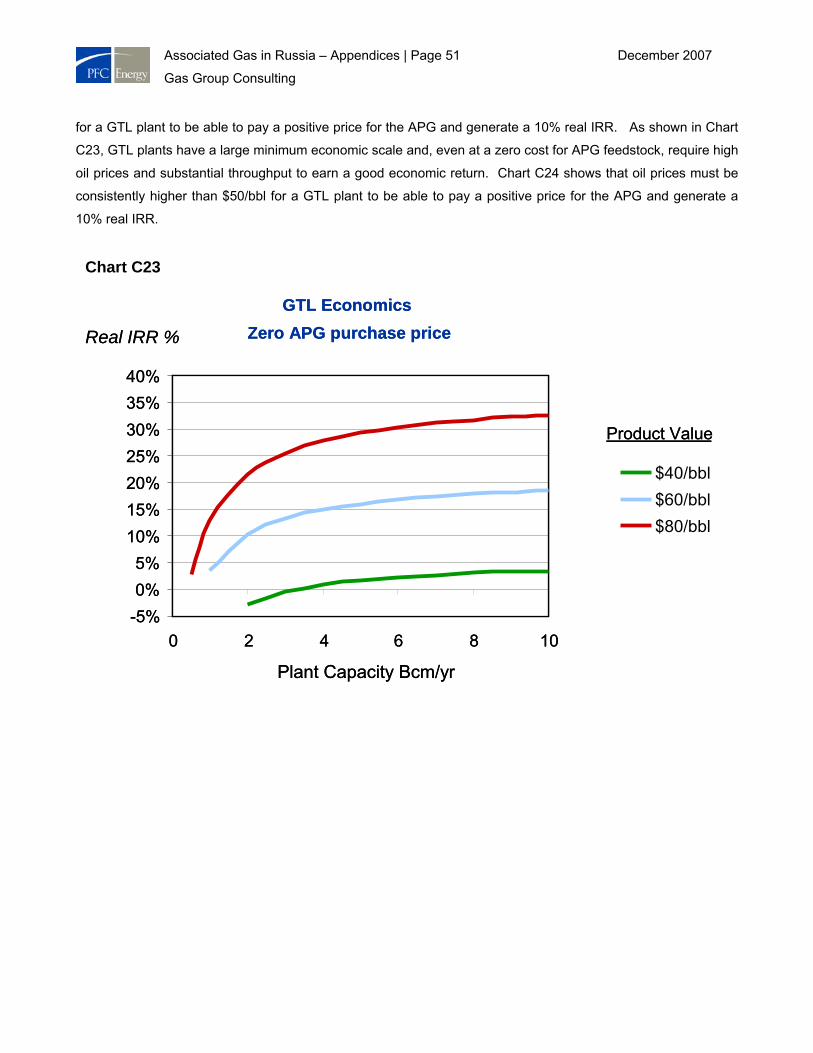
Associated Gas in Russia – Appendices | Page 51 December 2007
Gas Group Consulting
for a GTL plant to be able to pay a positive price for the APG and generate a 10% real IRR. As shown in Chart
C23, GTL plants have a large minimum economic scale and, even at a zero cost for APG feedstock, require high
oil prices and substantial throughput to earn a good economic return. Chart C24 shows that oil prices must be
consistently higher than $50/bbl for a GTL plant to be able to pay a positive price for the APG and generate a
10% real IRR.
Chart C23
GTL EconomicsZero APG purchase price
-5%0%5%
10%15%20%25%30%35%40%
0 2 4 6 8 10
Plant Capacity Bcm/yr
Real IRR %
$40/bbl$60/bbl$80/bbl
Product Value
GTL EconomicsZero APG purchase price
-5%0%5%
10%15%20%25%30%35%40%
0 2 4 6 8 10
Plant Capacity Bcm/yr
Real IRR %
$40/bbl$60/bbl$80/bbl
Product Value
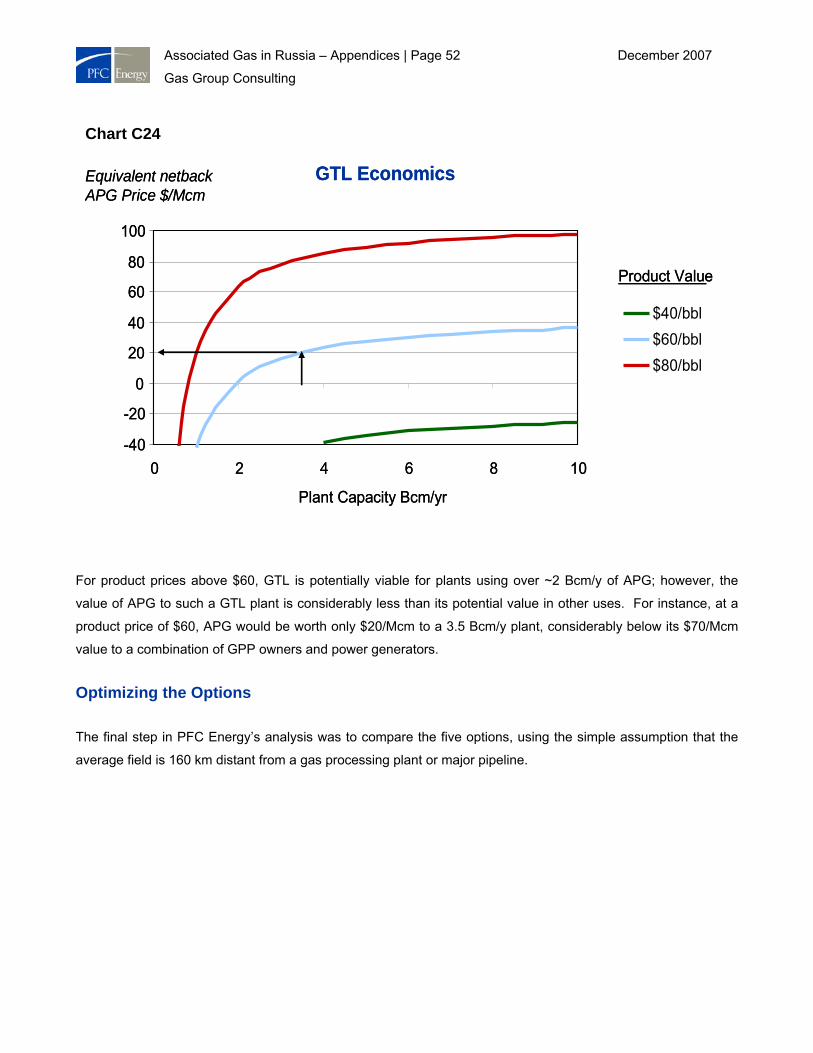
Associated Gas in Russia – Appendices | Page 52 December 2007
Gas Group Consulting
For product prices above $60, GTL is potentially viable for plants using over ~2 Bcm/y of APG; however, the
value of APG to such a GTL plant is considerably less than its potential value in other uses. For instance, at a
product price of $60, APG would be worth only $20/Mcm to a 3.5 Bcm/y plant, considerably below its $70/Mcm
value to a combination of GPP owners and power generators.
Optimizing the Options
The final step in PFC Energy’s analysis was to compare the five options, using the simple assumption that the
average field is 160 km distant from a gas processing plant or major pipeline.
Chart C24
GTL Economics
-40
-20
0
20
40
60
80
100
0 2 4 6 8 10
Plant Capacity Bcm/yr
Equivalent netbackAPG Price $/Mcm
$40/bbl$60/bbl$80/bbl
Product Value
GTL Economics
-40
-20
0
20
40
60
80
100
0 2 4 6 8 10
Plant Capacity Bcm/yr
Equivalent netbackAPG Price $/Mcm
$40/bbl$60/bbl$80/bbl
Product Value
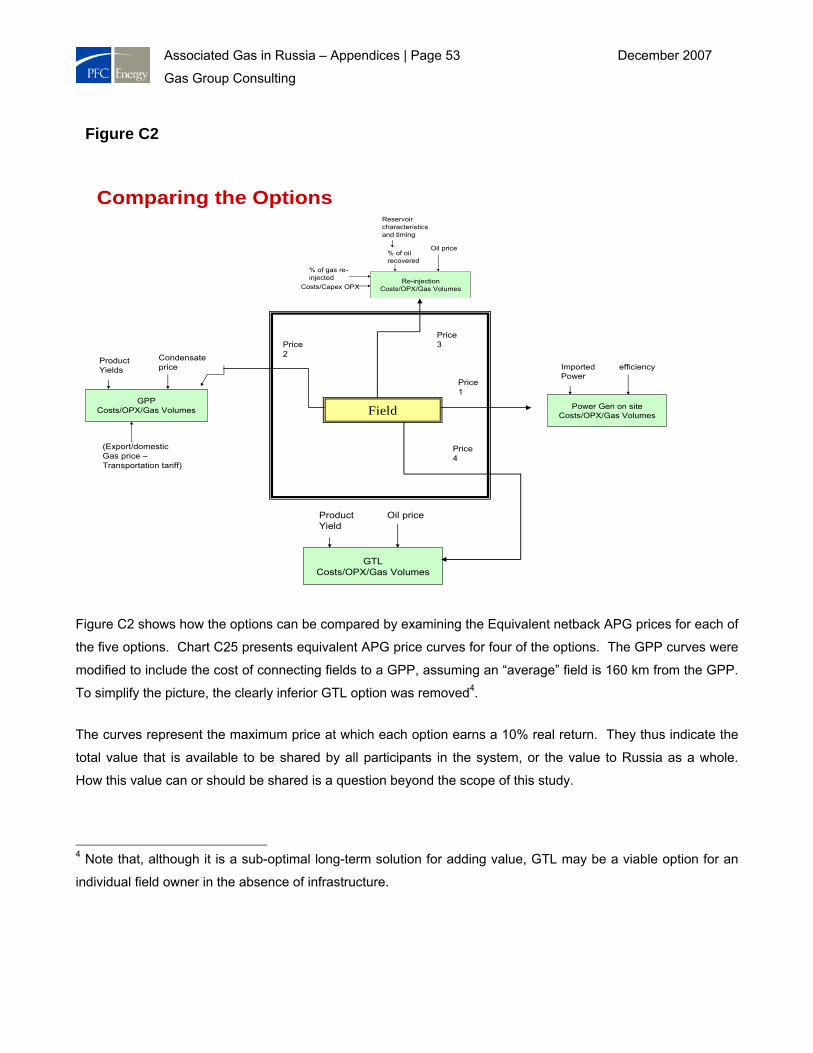
Associated Gas in Russia – Appendices | Page 53 December 2007
Gas Group Consulting
Figure C2 shows how the options can be compared by examining the Equivalent netback APG prices for each of
the five options. Chart C25 presents equivalent APG price curves for four of the options. The GPP curves were
modified to include the cost of connecting fields to a GPP, assuming an “average” field is 160 km from the GPP.
To simplify the picture, the clearly inferior GTL option was removed4.
The curves represent the maximum price at which each option earns a 10% real return. They thus indicate the
total value that is available to be shared by all participants in the system, or the value to Russia as a whole.
How this value can or should be shared is a question beyond the scope of this study.
4 Note that, although it is a sub-optimal long-term solution for adding value, GTL may be a viable option for an
individual field owner in the absence of infrastructure.
Figure C2
Comparing the Options
Field Power Gen on siteCosts/OPX/Gas Volumes
efficiencyImported Power
Price1
(Export/domestic Gas price –Transportation tariff)
GPPCosts/OPX/Gas Volumes
Condensate price
Product Yields
Price2
GTLCosts/OPX/Gas Volumes
Oil priceProduct Yield
Price4
Re-injectionCosts/OPX/Gas Volumes
Oil price
% of gas re-injected
Costs/Capex OPX
% of oil recovered
Reservoir characteristics and timing
Price3
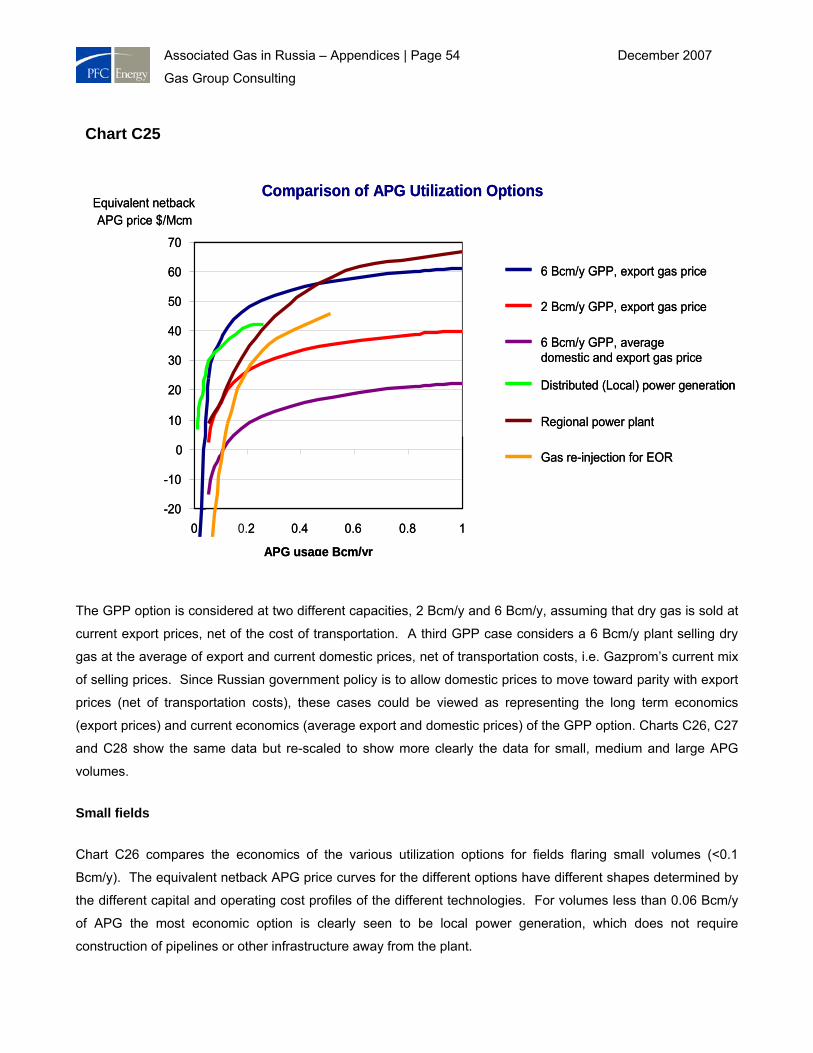
Associated Gas in Russia – Appendices | Page 54 December 2007
Gas Group Consulting
The GPP option is considered at two different capacities, 2 Bcm/y and 6 Bcm/y, assuming that dry gas is sold at
current export prices, net of the cost of transportation. A third GPP case considers a 6 Bcm/y plant selling dry
gas at the average of export and current domestic prices, net of transportation costs, i.e. Gazprom’s current mix
of selling prices. Since Russian government policy is to allow domestic prices to move toward parity with export
prices (net of transportation costs), these cases could be viewed as representing the long term economics
(export prices) and current economics (average export and domestic prices) of the GPP option. Charts C26, C27
and C28 show the same data but re-scaled to show more clearly the data for small, medium and large APG
volumes.
Small fields
Chart C26 compares the economics of the various utilization options for fields flaring small volumes (<0.1
Bcm/y). The equivalent netback APG price curves for the different options have different shapes determined by
the different capital and operating cost profiles of the different technologies. For volumes less than 0.06 Bcm/y
of APG the most economic option is clearly seen to be local power generation, which does not require
construction of pipelines or other infrastructure away from the plant.
Chart C25
Comparison of APG Utilization Options
-20
-10
0
10
20
30
40
50
60
70
0 0.2 0.4 0.6 0.8 1
APG usage Bcm/yr
Equivalent netback APG price $/Mcm
6 Bcm/y GPP, export gas price
2 Bcm/y GPP, export gas price
6 Bcm/y GPP, averagedomestic and export gas price
Distributed (Local) power generation
Regional power plant
Gas re-injection for EOR
6 Bcm/y GPP, export gas price
2 Bcm/y GPP, export gas price
6 Bcm/y GPP, averagedomestic and export gas price
Distributed (Local) power generation
Regional power plant
Gas re-injection for EOR
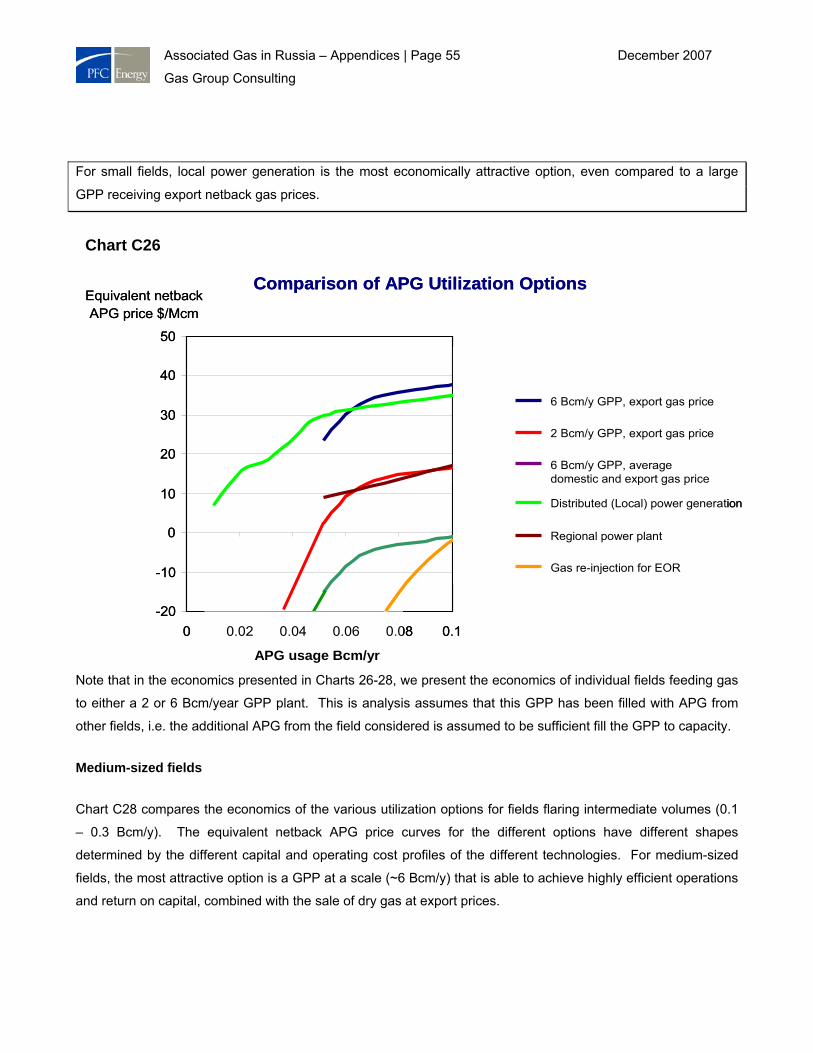
Associated Gas in Russia – Appendices | Page 55 December 2007
Gas Group Consulting
For small fields, local power generation is the most economically attractive option, even compared to a large
GPP receiving export netback gas prices.
Note that in the economics presented in Charts 26-28, we present the economics of individual fields feeding gas
to either a 2 or 6 Bcm/year GPP plant. This is analysis assumes that this GPP has been filled with APG from
other fields, i.e. the additional APG from the field considered is assumed to be sufficient fill the GPP to capacity.
Medium-sized fields
Chart C28 compares the economics of the various utilization options for fields flaring intermediate volumes (0.1
– 0.3 Bcm/y). The equivalent netback APG price curves for the different options have different shapes
determined by the different capital and operating cost profiles of the different technologies. For medium-sized
fields, the most attractive option is a GPP at a scale (~6 Bcm/y) that is able to achieve highly efficient operations
and return on capital, combined with the sale of dry gas at export prices.
Chart C26
Comparison of APG Utilization Options
-20
-10
0
10
20
30
40
50
0 0.1
Equivalent netback APG price $/Mcm
APG usage Bcm/yr
0.02 0.04 0.06 0.08
6 Bcm/y GPP, export gas price
2 Bcm/y GPP, export gas price
6 Bcm/y GPP, averagedomestic and export gas price
Distributed (Local) power generation
Regional power plant
Gas re-injection for EOR
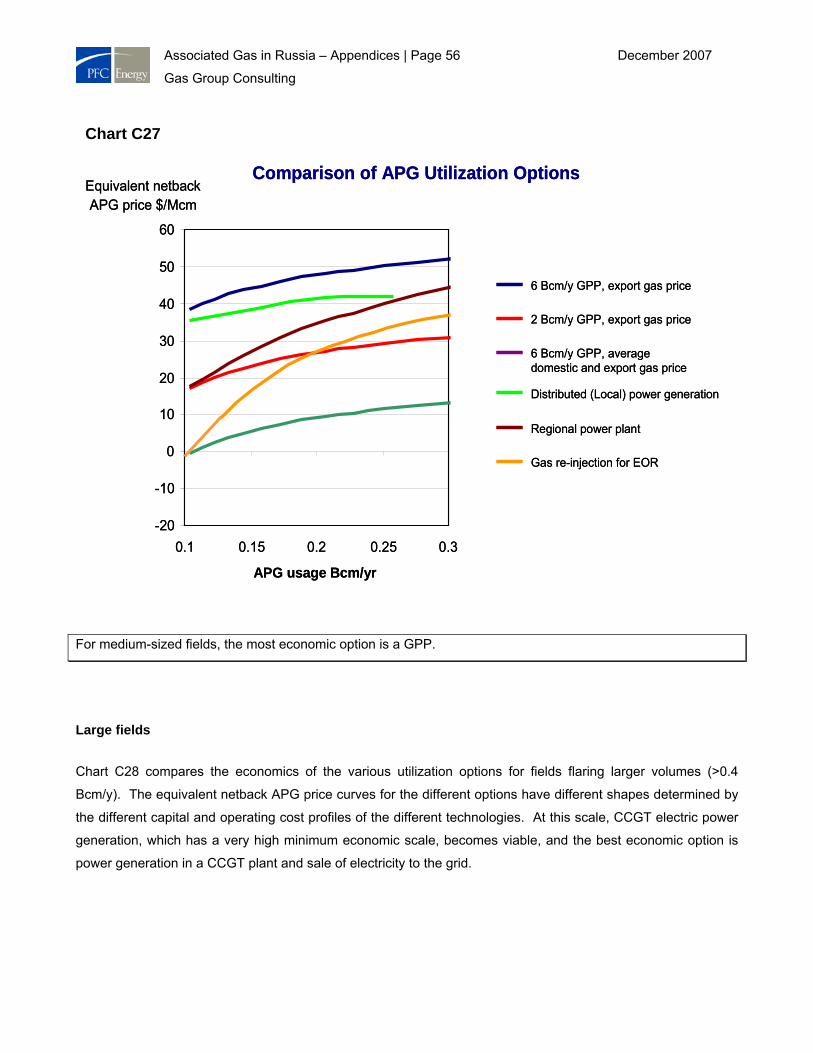
Associated Gas in Russia – Appendices | Page 56 December 2007
Gas Group Consulting
For medium-sized fields, the most economic option is a GPP.
Large fields
Chart C28 compares the economics of the various utilization options for fields flaring larger volumes (>0.4
Bcm/y). The equivalent netback APG price curves for the different options have different shapes determined by
the different capital and operating cost profiles of the different technologies. At this scale, CCGT electric power
generation, which has a very high minimum economic scale, becomes viable, and the best economic option is
power generation in a CCGT plant and sale of electricity to the grid.
Chart C27
Comparison of APG Utilization Options
-20
-10
0
10
20
30
40
50
60
0.1 0.15 0.2 0.25 0.3
APG usage Bcm/yr
Equivalent netback APG price $/Mcm
6 Bcm/y GPP, export gas price
2 Bcm/y GPP, export gas price
6 Bcm/y GPP, averagedomestic and export gas price
Distributed (Local) power generation
Regional power plant
Gas re-injection for EOR
6 Bcm/y GPP, export gas price
2 Bcm/y GPP, export gas price
6 Bcm/y GPP, averagedomestic and export gas price
Distributed (Local) power generation
Regional power plant
Gas re-injection for EOR
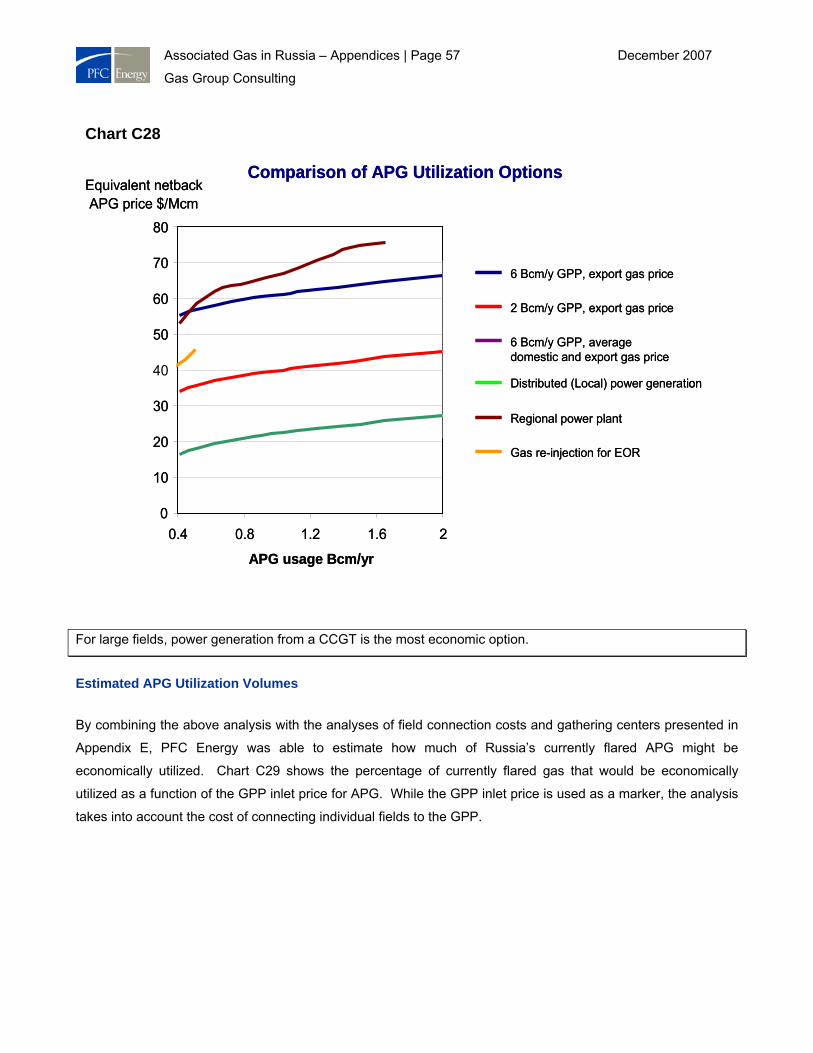
Associated Gas in Russia – Appendices | Page 57 December 2007
Gas Group Consulting
For large fields, power generation from a CCGT is the most economic option.
Estimated APG Utilization Volumes
By combining the above analysis with the analyses of field connection costs and gathering centers presented in
Appendix E, PFC Energy was able to estimate how much of Russia’s currently flared APG might be
economically utilized. Chart C29 shows the percentage of currently flared gas that would be economically
utilized as a function of the GPP inlet price for APG. While the GPP inlet price is used as a marker, the analysis
takes into account the cost of connecting individual fields to the GPP.
Chart C28
Comparison of APG Utilization Options
0
10
20
30
50
60
70
80
0.4 0.8 1.2 1.6 2
APG usage Bcm/yr
Equivalent netback APG price $/Mcm
6 Bcm/y GPP, export gas price
2 Bcm/y GPP, export gas price
6 Bcm/y GPP, averagedomestic and export gas price
Distributed (Local) power generation
Regional power plant
Gas re-injection for EOR
40
Comparison of APG Utilization Options
0
10
20
30
50
60
70
80
0.4 0.8 1.2 1.6 2
APG usage Bcm/yr
Equivalent netback APG price $/Mcm
6 Bcm/y GPP, export gas price
2 Bcm/y GPP, export gas price
6 Bcm/y GPP, averagedomestic and export gas price
Distributed (Local) power generation
Regional power plant
Gas re-injection for EOR
6 Bcm/y GPP, export gas price
2 Bcm/y GPP, export gas price
6 Bcm/y GPP, averagedomestic and export gas price
Distributed (Local) power generation
Regional power plant
Gas re-injection for EOR
40
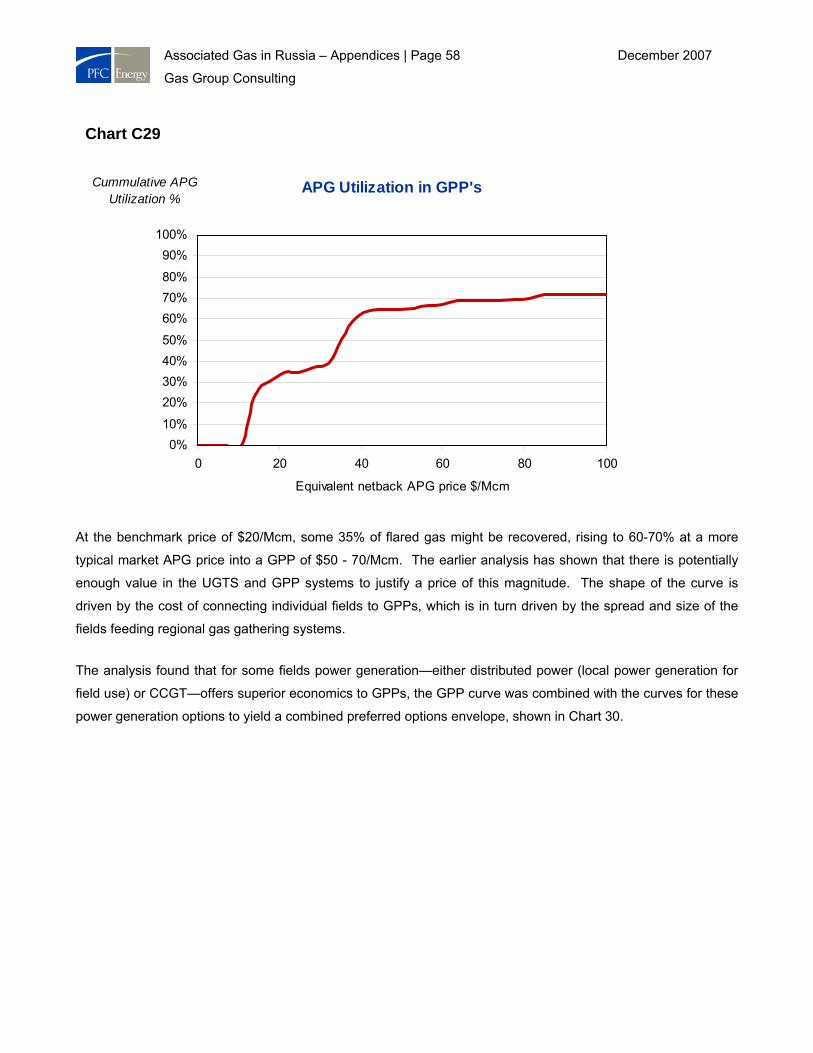
Associated Gas in Russia – Appendices | Page 58 December 2007
Gas Group Consulting
At the benchmark price of $20/Mcm, some 35% of flared gas might be recovered, rising to 60-70% at a more
typical market APG price into a GPP of $50 - 70/Mcm. The earlier analysis has shown that there is potentially
enough value in the UGTS and GPP systems to justify a price of this magnitude. The shape of the curve is
driven by the cost of connecting individual fields to GPPs, which is in turn driven by the spread and size of the
fields feeding regional gas gathering systems.
The analysis found that for some fields power generation—either distributed power (local power generation for
field use) or CCGT—offers superior economics to GPPs, the GPP curve was combined with the curves for these
power generation options to yield a combined preferred options envelope, shown in Chart 30.
Chart C29
APG Utilization in GPP's
0%10%
20%30%40%50%
60%70%80%
90%100%
0 20 40 60 80 100
Equivalent netback APG price $/Mcm
Cummulative APG Utilization %
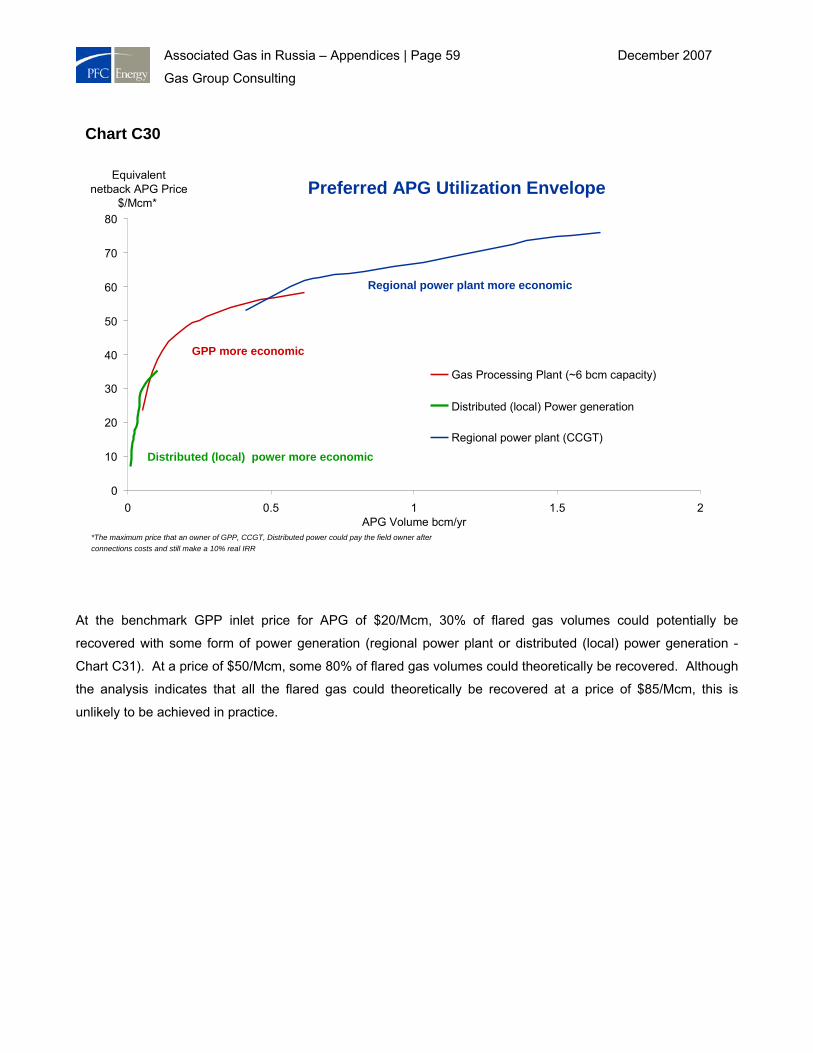
Associated Gas in Russia – Appendices | Page 59 December 2007
Gas Group Consulting
At the benchmark GPP inlet price for APG of $20/Mcm, 30% of flared gas volumes could potentially be
recovered with some form of power generation (regional power plant or distributed (local) power generation -
Chart C31). At a price of $50/Mcm, some 80% of flared gas volumes could theoretically be recovered. Although
the analysis indicates that all the flared gas could theoretically be recovered at a price of $85/Mcm, this is
unlikely to be achieved in practice.
Chart C30
Preferred APG Utilization Envelope
0
10
20
30
40
50
60
70
80
0 0.5 1 1.5 2APG Volume bcm/yr
Equivalent netback APG Price
$/Mcm*
Gas Processing Plant (~6 bcm capacity)
Distributed (local) Power generation
Regional power plant (CCGT)
Distributed (local) power more economic
Regional power plant more economic
GPP more economic
*The maximum price that an owner of GPP, CCGT, Distributed power could pay the field owner after connections costs and still make a 10% real IRR
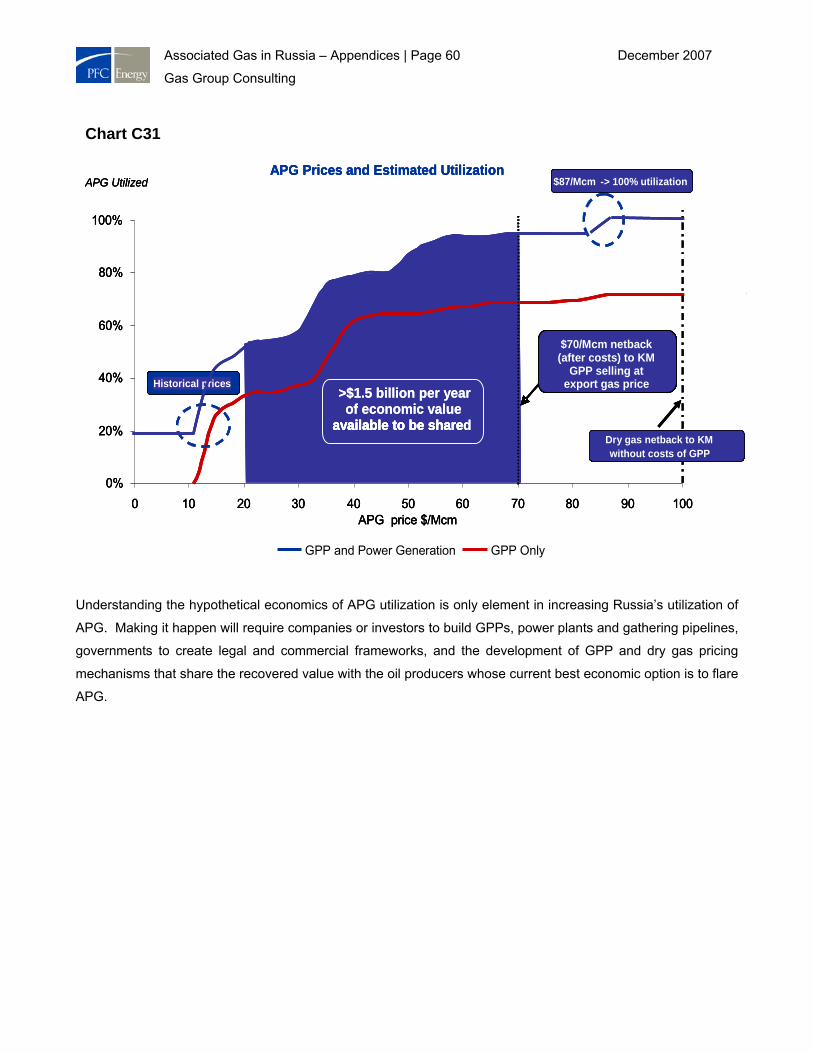
Associated Gas in Russia – Appendices | Page 60 December 2007
Gas Group Consulting
Understanding the hypothetical economics of APG utilization is only element in increasing Russia’s utilization of
APG. Making it happen will require companies or investors to build GPPs, power plants and gathering pipelines,
governments to create legal and commercial frameworks, and the development of GPP and dry gas pricing
mechanisms that share the recovered value with the oil producers whose current best economic option is to flare
APG.
Chart C31
APG Prices and Estimated Utilization
0%
20%
40%
60%
80%
100%
0 10 20 30 40 50 60 70 80 90 100APG price $/Mcm
APG Utilized
GPP and Power Generation GPP Only
Historical prices
$87/Mcm -> 100% utilization
Dry gas netback to KM without costs of GPP
$70/Mcm netback (after costs) to KM
GPP selling at export gas price
$70/Mcm netback (after costs) to KM
GPP selling at export gas price
>$1.5 billion per yearof economic value
available to be sharedavailable to be share
>$1.5 billion per yearof economic value
available to be sharedavailable to be share
Associated Gas in Russia – Appendices | Page 61 December 2007
Gas Group Consulting
Appendix D
International Review of Policies Designed to Limit Gas Flaring
Norway
In 1971, when Norway brought its first oil field on line and before the full potential of its oil industry was
understood, the country established policies that included a restriction on gas flaring, except for production
testing. Producers were required to utilize any natural gas that could be produced for consumption from the
Norwegian Continental Shelf (NCS). This policy became widely accepted by the main political parties and the
prevailing consensus in Norway.
Under Norway’s Petroleum Act, the Ministry of Petroleum and Energy (MPE) must approve a “plan for
development and operation” (PDO) and a “plan for installation and operation facility for transport” (PIO) before
any field development occurs. The operator must also submit an Environmental Impact Assessment (EIA),
which includes a description of any flaring or venting. This EIA is subject to public consultation.
The two principal authorities supervising air emissions and petroleum activities under the Petroleum Act are the
Norwegian Petroleum Directorate (NPD), part of MPE, and the Norwegian Pollution Control Authority (SFT).
The NPD oversees energy efficiency, safety, gas flaring and venting, and enforcement of CO2 tax legislation.
The SFT has general responsibility for emissions into the sea. The industry and Norwegian authorities also
formed a cooperative body, the Miljǿsok, in1995, to develop joint recommendations that are now being followed
up by the Environment Forum.
The introduction of Norway’s CO2 tax in 1991 created an additional incentive to reduce gas flaring. The country
is moving toward a CO2 tax aligned with EU and global emission trading schemes. This tax may eventually be
replaced by tradable emissions quotas.
Over the past few decades, while oil production has steeply increased, gas flaring volumes have remained
stable or decreased and flared gas volumes have significantly declined as a percentage of oil production as
industry first sought to avoid wasting energy, and later also to reduce pollution. In 2004, only 0.16% of Norway’s
total annual gas production was flared and the MPE approve no PDOs that did not include gas injection or gas
export solutions.
As a rich country, with high GNP, high employment levels, energy independence, advanced technology and
strong government involvement in the oil industry, Norway had the luxury of postponing production from oil fields
with APG while it developed gas transportation or storage solutions.
Associated Gas in Russia – Appendices | Page 62 December 2007
Gas Group Consulting
At the first producing field on the NCS, Ekofisk, the Norwegian government demanded a reduction in oil
production until a gas transportation solution was available. Because of flaring restrictions, wells with high gas-
oil ratios (GOR) could not move forward until 1977 when a system of gas compressors and pipelines became
available to handle the APG. The Norwegian government also rejected some field development plans that did
not include plans to utilize APG. Measures used by operators to avoid flaring included reinjecting gas into
reservoirs to improve oil recovery, costly operations to inject gas into water reservoirs (Draugen), and
transporting gas to shore for use in methanol production (Heidrun). It is estimated that through 2005
approximately 413 Bcm has been re-injected into 27 fields in the NCS, leading to improved oil recovery of 1.6 –
1.9 billion bbls of oil.
At the Stratfjord field, the government permitted gas flaring from 1979 to 1983 because at the time oil production
was considered a priority and no gas pipelines were yet in available.
The current Norwegian gas transport infrastructure can be attributed, in part, to the gas flaring restriction. Flared
gas volumes as a percentage of oil production declined significantly in the 1980s and 1990s as the North Sea’s
gas transport infrastructure was expanded.
The CO2 tax has created financial incentives to develop new technology for APG utilization, including the now
widely used “closed flare system” that captures APG, compresses it, and feeds it into the export system.
UK
UK gas flaring and venting policy is designed to maximize economic recovery of the country’s oil and gas
reserves and reduce greenhouse gas emissions. The Energy Act of 1976 requires the Secretary of State for
Trade and Industry to consent to any natural gas disposal, either via flaring or venting, whether onshore or
offshore. Ultimate responsibility for flaring and venting lies with the Department of Trade and Industry (DTI),
which under the Petroleum Act regulates upstream oil and gas. The DTI regulates all onshore and offshore gas
production and exploration and controls the volume of gas that is flared and vented each year through its
Licensing and Consents Unit.
Before any new field is developed, the operator must submit to DTI a Field Development Plan (FDP) that
includes a summary description of the planned field development, the facility’s design, gas re-injection potential,
and all the steps used to reduce the need for flaring. The DTI’s Common Reporting Format (CRF) for assessing
new field developments requires the operator to provide gas flaring and venting projections along with other
detailed information. Whenever the value of the gas produced is greater than the costs of bringing it to market,
the operator will be required to bring the gas to shore and process it. When it is not economic to bring gas to
market, DTI requires operators to consider various options, including using it as fuel, for enhanced oil recovery,
Associated Gas in Russia – Appendices | Page 63 December 2007
Gas Group Consulting
or converting it to other fuels. If DTI approves the FDP, it issues a Production and Development consent, which
requires the licensee to keep flaring to a minimum and technically and economically justify any flaring. For fields
whose oil production is expected to exceed 3,750 bbl/d, an Environmental Impact Assessment (EIA) is also
required. A new field is authorized only when it has been determined that the FDP and the EIA meet the
government’s policy and objectives. DTI encourages operators to stay in contact during all stages of design and
construction and to show that all reasonable steps have been taken to maintain flaring and venting at a minimum
level.
DTI provides a consultation paper outlining performance indicators to measure production efficiency of offshore
oil and gas fields. This process enables fields to be measured against a common and consistent set of
performance indicators. Once the field is in operation, daily production and flaring data must be recorded and
gas use efficiency and flare ratio percentages must be tracked. The operator is required to submit Annual Field
Reports (AFR), including details of production and flaring rates, to ensure continuing compliance with the FDP.
There are no financial penalties for breaching a consent, but such a breach is considered grounds for revoking
an operator’s license.
UK government policies in upstream and downstream gas markets have improved the economics of gas
utilization. The downstream gas market was restructured and unbundled, creating third-party access to the
upstream gas pipeline network, and competition in gas and electricity markets.
The UK framework has achieved substantial reductions in gas flaring and venting . To sustain these
improvements, the government has developed the Flare Transfer Pilot Trading Scheme (FTPTS), a voluntary
industry-government scheme that includes approximately 50% of commissioned fields in the UK Continental
Shelf (UKCS). The FTPTS, which is aligned with the UK Emission Trading Scheme (UKETS), and eventually
aims to be integrated with other domestic and international emission trading schemes, provides incentives for
further gas flaring reductions. Operators can make voluntary agreements to either “transfer flare by assets
operating within flare gas volume consents” or “transfer flare gas volume by revision of flare consensus”.
The UK’s emissions reductions targets create additional incentives to reduce gas flaring. The UK Offshore
Operators Association (UKOOA) estimated using 2001 data that total CO2 emissions from oil and gas operators
represent 4.5% of the UK’s total emissions. Under the Kyoto Protocol, the UK has a legally binding target of
reducing six greenhouse gases to 87.5% of their 1990 levels between 2008 and 2012. The UK has set an
additional goal of reducing CO2 emissions to 80% of their 1990 levels by 2010.
Alberta, Canada
In Canada, gas flaring and venting is considered a matter for provincial jurisdiction. In Alberta, the country’s
Associated Gas in Russia – Appendices | Page 64 December 2007
Gas Group Consulting
largest oil-producing region, the Environmental Protection and Enhancement Act (EPEA) establishes air quality
objectives and guidelines. Alberta Environment, a provincial government body, regulates air emissions and sets
emissions and air quality standards. These are applied by the Alberta Energy and Utilities Board (EUB), which
has made it a priority to reduce gas flaring and venting.
Alberta’s flaring and venting management framework is summarized in Directive 060: Upstream Petroleum
Industry Flaring, Incineration, and Venting (January 2007), the successor publication to its 1999 EUB Guide 60:
Upstream Petroleum Industry Flaring Guide. EUB developed the practices in its directive through participation in
the Flaring and Venting Project Team of the Clean Air Strategic Alliance (CASA), a multi-stakeholder entity
without legislative authority, which developed flaring and venting baselines, flaring reduction targets, and
upstream oil and gas industry operating practices.
EUB requires operators to (a) assess alternatives that would eliminate flaring and venting, (b) assess
alternatives that would reduce flaring and venting if the activity cannot feasibly be eliminated, and (c) execute
any residual flaring and venting according to specific performance requirements. The EUB requires companies
to consider connecting directly to an existing gas collecting system or laying a temporary surface pipeline to
connect to a remote gas gathering system. Operators are required to calculate incremental net present values
before tax, using costs, gas prices, and interest rates defined in Directive 060. If an operator concludes that a
project’s economics are such that APG utilization is not required, it must make its entire decision-tree analysis
and economic evaluation available for audit by the EUB. If it EUB approves the decision, the operator must
follow Directive 060’s performance requirements for flaring and venting. EUB historically required that gas be
conserved only when economically feasible, but the latest Directive 60 requires that it be conserved if the cost of
utilizing gas is less than $50,000. In effect, Alberta oil producers can now be required to spend some oil
revenues to conserve APG.
EUB requires operators to submit accurate reports on flared and vented volumes, which are used to assess
compliance and compiled in an annual public report that ranks operators according to their flared and vented
volumes and suggests ways to encourage further gas conservation. The EUB periodically inspects and audits
wells and production facilities, selecting inspection sites based on operator performance and non-compliance
history, inherent field operation risk, and public and environmental sensitivity of the area.
The EUB has established an “enforcement ladder system” that establishes appropriate responses based on the
seriousness of non-compliance and escalating consequences for repeat non-compliance or unsatisfactory
remedial actions. In 2002 out of 8,255 inspections, 324 resulted in serious non-compliance assessments,
leading to 128 shutdowns. One of the most common reasons for closure was H2S emissions associated with
sour gas venting and equipment leaks.
Associated Gas in Russia – Appendices | Page 65 December 2007
Gas Group Consulting
Alberta’s fully liberalized gas and electricity markets provide open access to the upstream and downstream gas
pipeline network and wholesale and retail gas price competition. These characteristics have assisted in
decreasing producers’ gas utilization costs. Additionally, in 1998 the Minister of Energy announced a royalty
waiver program to encourage further reduction in gas flaring.
EUB reports that in 2006 flared gas volumes were 71.5% lower than in the 1996 flaring baseline year and vented
volumes were 56.4 % below the 2000 venting baseline year.
US
Offshore oil operations in the US are overseen by the federal Minerals Management Service (MMS), which
requires that gas be marketed to a pipeline company, transported to shore for sale, used in power generation or
re-injected for enhanced oil recovery. MMS permits gas flaring related to equipment failures or other
unfavorable conditions provided this does not exceed 48 hours, or 144 hours in a calendar month. During well-
testing or well-cleaning operations, gas may be flared for up to 48 hours.
If an operator is installing equipment to eliminate flaring, MMS may approve flaring for an extended period of up
to one year, provided detailed records are kept, and subject to inspection.
All offshore operators must report flared gas volumes to MMS as a part of their monthly production statements
and have a duty to record this properly. In 2003 the Shell Oil Company agreed to pay $49 million to settle claims
under the False Claims Act and various administrative provisions relating to its unauthorized venting and flaring
of gas in the Gulf of Mexico, The settlement resolves a lawsuit alleging that Shell improperly vented and flared
gas from various offshore federal leases. The suit also alleged that the energy company failed to properly report,
or pay royalties on, the vented and flared gas. The government alleged that Shell's conduct violated the False
Claims Act, as well as other administrative requirements. As part of the agreement settling the lawsuit, Shell
acknowledged that it improperly vented and flared gas from its offshore leases, and failed to properly report or
pay royalties on that gas.
Since methane is not regulated as a pollutant in the United States, the US Environmental Protection Agency
(EPA) does not require companies to report methane emissions from oil and gas production. Other components
of APG, such as volatile organic compounds (VOCs) and hazardous air pollutants (HAPs) including H2S, are
regulated by the EPA and releases that exceed pre-determined thresholds trigger mandatory reporting and
control.
The U.S. government’s Bureau of Land Management (BLM) sets regulatory reporting requirements for gas
flaring and venting from operations on BLM land (onshore).

Associated Gas in Russia – Appendices | Page 66 December 2007
Gas Group Consulting
Individual oil and gas producing states also have rules and regulations governing APG flaring and venting.
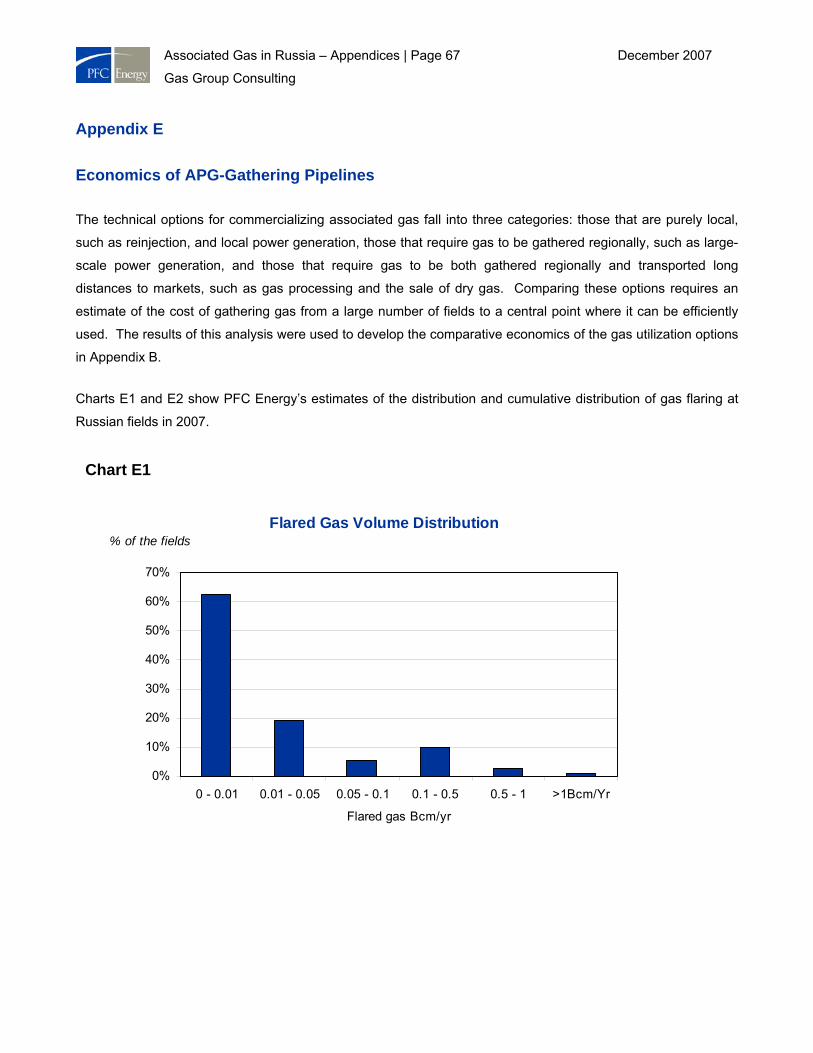
Associated Gas in Russia – Appendices | Page 67 December 2007
Gas Group Consulting
Appendix E
Economics of APG-Gathering Pipelines
The technical options for commercializing associated gas fall into three categories: those that are purely local,
such as reinjection, and local power generation, those that require gas to be gathered regionally, such as large-
scale power generation, and those that require gas to be both gathered regionally and transported long
distances to markets, such as gas processing and the sale of dry gas. Comparing these options requires an
estimate of the cost of gathering gas from a large number of fields to a central point where it can be efficiently
used. The results of this analysis were used to develop the comparative economics of the gas utilization options
in Appendix B.
Charts E1 and E2 show PFC Energy’s estimates of the distribution and cumulative distribution of gas flaring at
Russian fields in 2007.
Chart E1
Flared Gas Volume Distribution
0%
10%
20%
30%
40%
50%
60%
70%
0 - 0.01 0.01 - 0.05 0.05 - 0.1 0.1 - 0.5 0.5 - 1 >1Bcm/Yr
Flared gas Bcm/yr
% of the fields
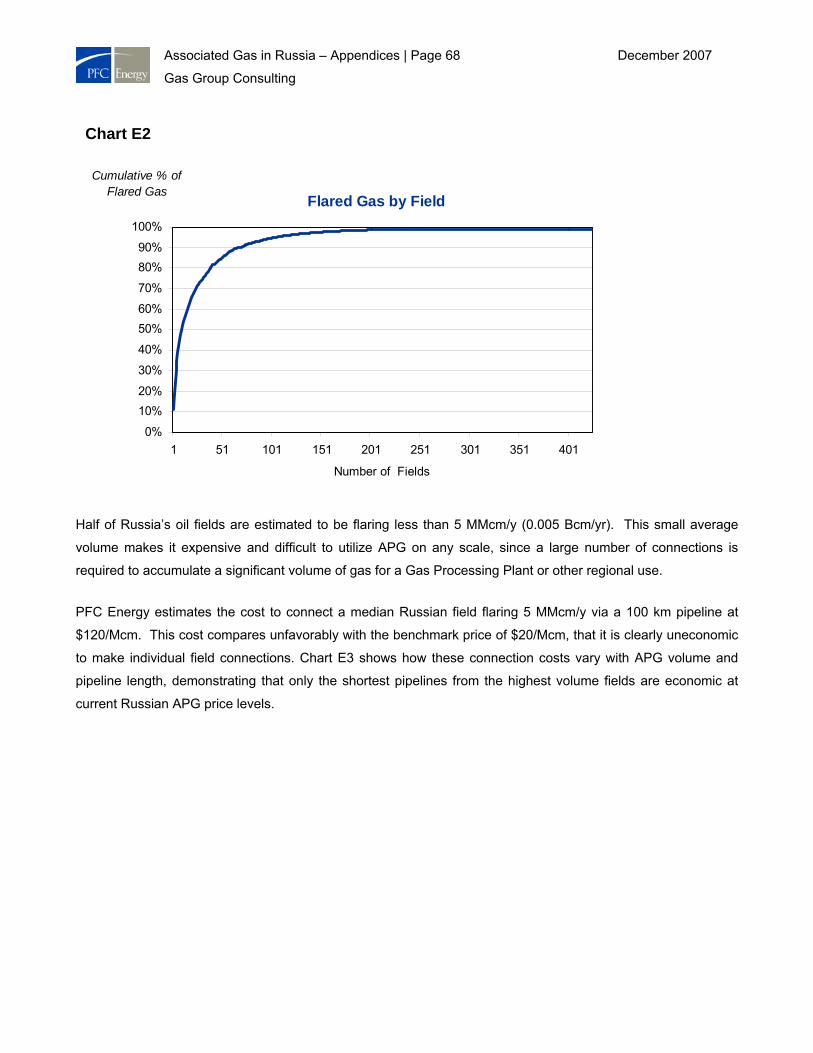
Associated Gas in Russia – Appendices | Page 68 December 2007
Gas Group Consulting
Half of Russia’s oil fields are estimated to be flaring less than 5 MMcm/y (0.005 Bcm/yr). This small average
volume makes it expensive and difficult to utilize APG on any scale, since a large number of connections is
required to accumulate a significant volume of gas for a Gas Processing Plant or other regional use.
PFC Energy estimates the cost to connect a median Russian field flaring 5 MMcm/y via a 100 km pipeline at
$120/Mcm. This cost compares unfavorably with the benchmark price of $20/Mcm, that it is clearly uneconomic
to make individual field connections. Chart E3 shows how these connection costs vary with APG volume and
pipeline length, demonstrating that only the shortest pipelines from the highest volume fields are economic at
current Russian APG price levels.
Chart E2
Flared Gas by Field
0%
10%20%
30%
40%
50%60%
70%
80%90%
100%
1 51 101 151 201 251 301 351 401
Number of Fields
Cumulative % of Flared Gas
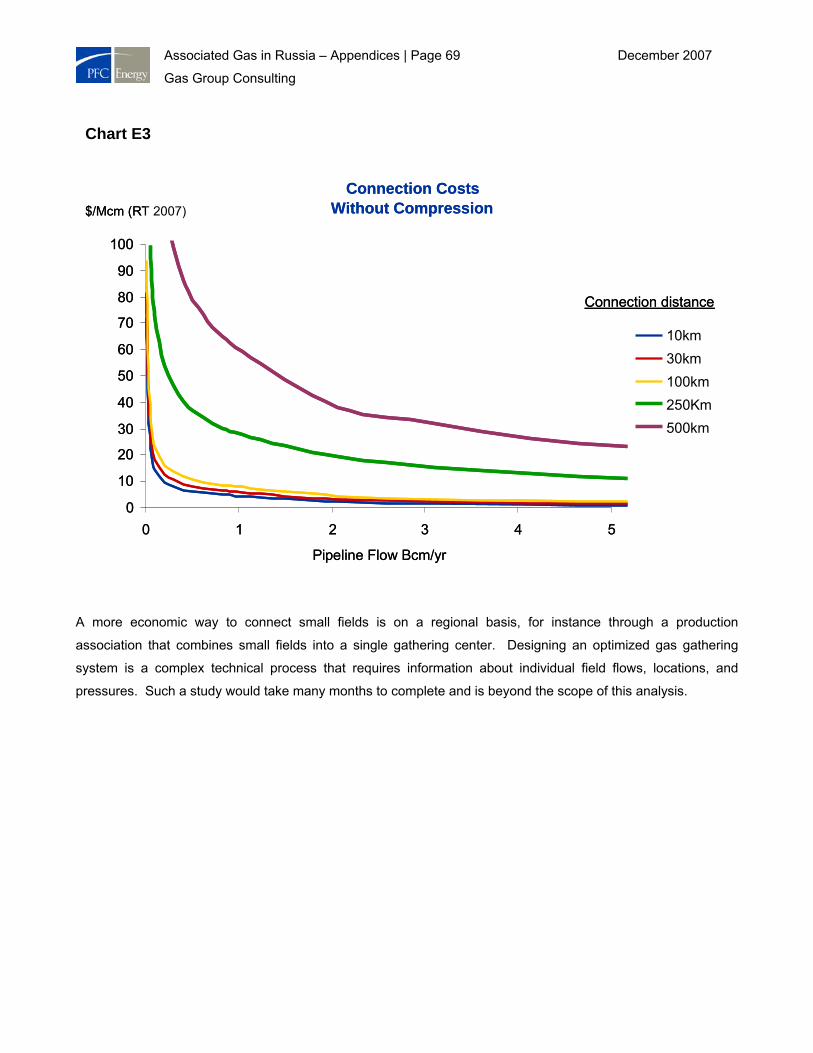
Associated Gas in Russia – Appendices | Page 69 December 2007
Gas Group Consulting
A more economic way to connect small fields is on a regional basis, for instance through a production
association that combines small fields into a single gathering center. Designing an optimized gas gathering
system is a complex technical process that requires information about individual field flows, locations, and
pressures. Such a study would take many months to complete and is beyond the scope of this analysis.
Chart E3
Connection CostsWithout Compression
0
10
20
30
40
50
60
70
80
90
100
0 1 2 3 4 5
Pipeline Flow Bcm/yr
10km30km100km250Km500km
Connection distance
$/Mcm (RT 2007)
Connection CostsWithout Compression
0
10
20
30
40
50
60
70
80
90
100
0 1 2 3 4 5
Pipeline Flow Bcm/yr
10km30km100km250Km500km
Connection distance
$/Mcm (RT 2007)
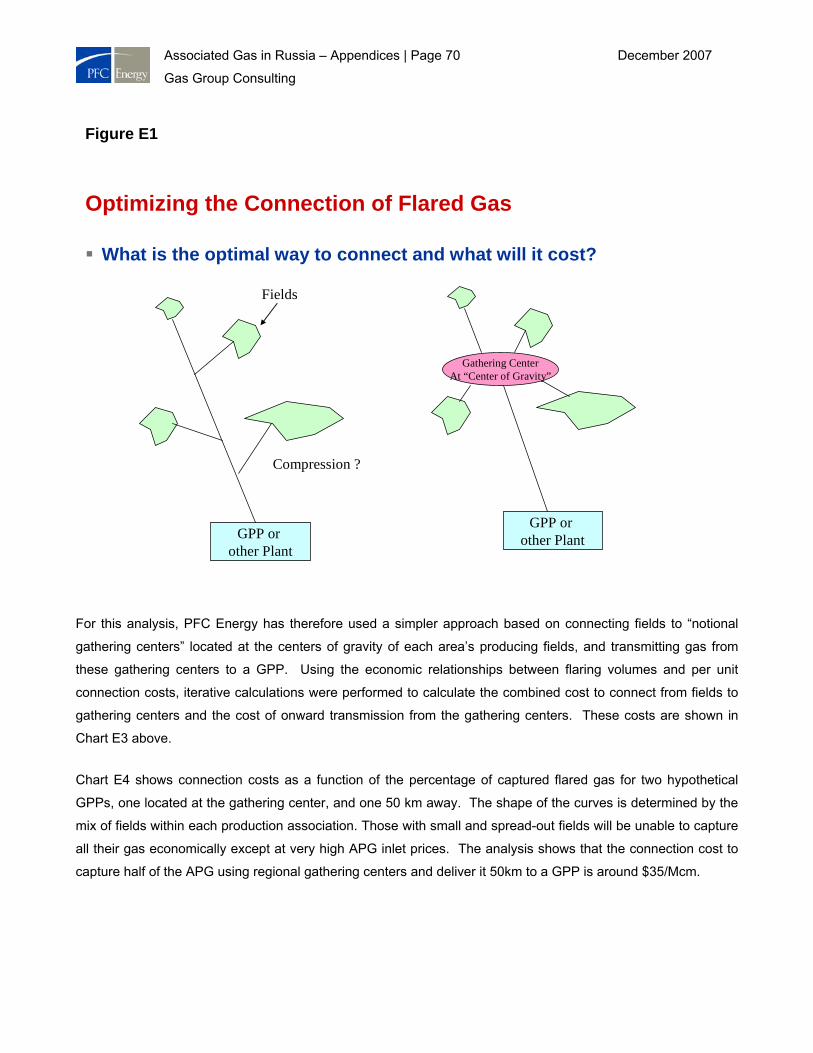
Associated Gas in Russia – Appendices | Page 70 December 2007
Gas Group Consulting
For this analysis, PFC Energy has therefore used a simpler approach based on connecting fields to “notional
gathering centers” located at the centers of gravity of each area’s producing fields, and transmitting gas from
these gathering centers to a GPP. Using the economic relationships between flaring volumes and per unit
connection costs, iterative calculations were performed to calculate the combined cost to connect from fields to
gathering centers and the cost of onward transmission from the gathering centers. These costs are shown in
Chart E3 above.
Chart E4 shows connection costs as a function of the percentage of captured flared gas for two hypothetical
GPPs, one located at the gathering center, and one 50 km away. The shape of the curves is determined by the
mix of fields within each production association. Those with small and spread-out fields will be unable to capture
all their gas economically except at very high APG inlet prices. The analysis shows that the connection cost to
capture half of the APG using regional gathering centers and deliver it 50km to a GPP is around $35/Mcm.
Figure E1
Optimizing the Connection of Flared Gas
What is the optimal way to connect and what will it cost?
GPP or other Plant
Compression ?
GPP or other Plant
Gathering CenterAt “Center of Gravity”
Fields
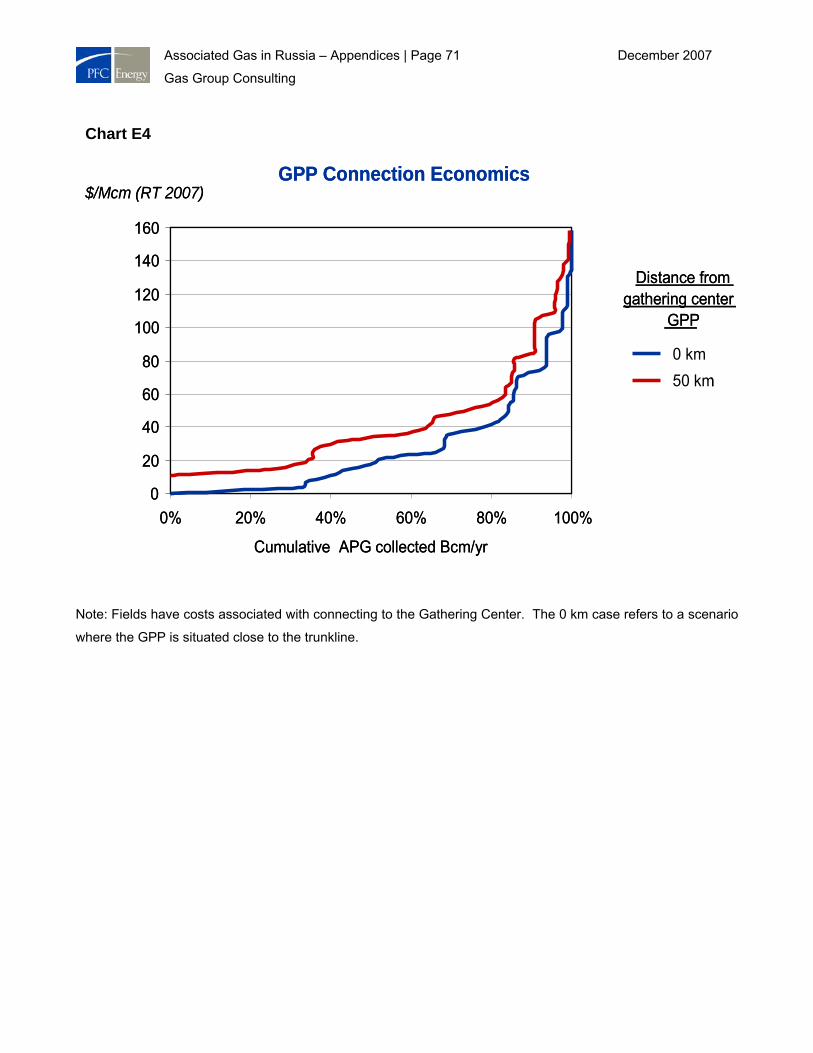
Associated Gas in Russia – Appendices | Page 71 December 2007
Gas Group Consulting
Note: Fields have costs associated with connecting to the Gathering Center. The 0 km case refers to a scenario
where the GPP is situated close to the trunkline.
Chart E4
GPP Connection Economics
0
20
40
60
80
100
120
140
160
0% 20% 40% 60% 80% 100%
Cumulative APG collected Bcm/yr
$/Mcm (RT 2007)
0 km50 km
Distance from gathering center
GPP
GPP Connection Economics
0
20
40
60
80
100
120
140
160
0% 20% 40% 60% 80% 100%
Cumulative APG collected Bcm/yr
$/Mcm (RT 2007)
0 km50 km
Distance from gathering center
GPP
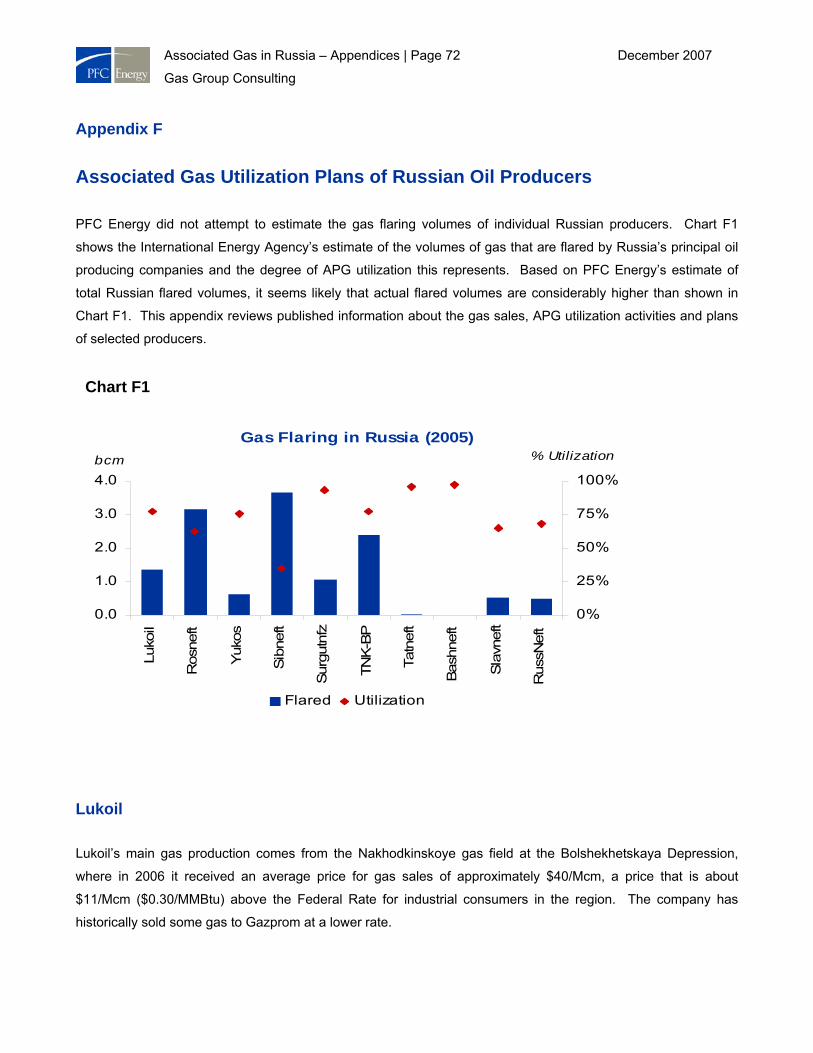
Associated Gas in Russia – Appendices | Page 72 December 2007
Gas Group Consulting
Appendix F
Associated Gas Utilization Plans of Russian Oil Producers
PFC Energy did not attempt to estimate the gas flaring volumes of individual Russian producers. Chart F1
shows the International Energy Agency’s estimate of the volumes of gas that are flared by Russia’s principal oil
producing companies and the degree of APG utilization this represents. Based on PFC Energy’s estimate of
total Russian flared volumes, it seems likely that actual flared volumes are considerably higher than shown in
Chart F1. This appendix reviews published information about the gas sales, APG utilization activities and plans
of selected producers.
Lukoil
Lukoil’s main gas production comes from the Nakhodkinskoye gas field at the Bolshekhetskaya Depression,
where in 2006 it received an average price for gas sales of approximately $40/Mcm, a price that is about
$11/Mcm ($0.30/MMBtu) above the Federal Rate for industrial consumers in the region. The company has
historically sold some gas to Gazprom at a lower rate.
Chart F1
Gas Flaring in Russia (2005)
0.0
1.0
2.0
3.0
4.0
Luko
il
Ros
neft
Yuk
os
Sib
neft
Sur
gutn
fz
TNK
-BP
Tatn
eft
Bas
hnef
t
Sla
vnef
t
Rus
sNef
t
bcm
0%
25%
50%
75%
100%
% Utilization
Flared Utilization
Associated Gas in Russia – Appendices | Page 73 December 2007
Gas Group Consulting
Lukoil is investigating gas processing and Gas-To-Liquids (GTL) as possible routes to commercialize its APG. In
2003, LUKOIL Overseas Holding Ltd. signed a letter of intent with Syntroleum International Corporation (SIC) to
collaborate on the utilization of APG from fields in Russia, Kazakhstan and other countries. LUKOIL Overseas
and a newly formed business unit of SIC, Advanced Gas Technology Partners (AGTP), are to conduct a
feasibility study for gathering and processing APG from several fields with a view to establishing joint venture
gas processing plants at Verkhnekamye in the Perm Region of the Urals and in oil fields at Pechora, Komi
Republic, both of which are operated by Lukoil-Perm, the operator for LUKOIL Overseas’ Russian projects. It is
understood that the companies plan to build a pilot plant to convert 0.25 Bcm/y of APG into up to 5,000 bbl/y of
liquid fuels.
Rosneft
In 2006, Rosneft’s largest gas customer was Gazprom, to which it sold 4.3 Bcm. Total 2006 gas marketing was:
• Western Siberia: 3.3 Bcm sold directly to Gazprom, 0.9 Bcm to independent gas traders, 0.2 Bcm to an
independent company for further refining, and 0.9 Bcm to end consumers;
• Southern Russia: 1.4 Bcm sold to end consumers, 1.2 Bcm to independent gas traders, 1 Bcm to
Gazprom;
• Russian Far East: 0.7 Bcm sold to end consumers.
Rosneft achieved average gas sales prices of $16.16/Mcm in 2004, $18.82/Mcm in 2005 and $20.58/Mcm in
2006.
Rosneft began implementing an Integrated Gas Program in 2006 and has stated that it will invest RUB 16.6
billion to achieve 95% APG utilization by 2010. This figure would meet all of the company’s current license
requirements.
On 25 June 2007, Rosneft and SIBUR signed a Memorandum of Understanding (MoU) concerning the
processing, marketing and sale of APG. The MoU provides for the establishment of a joint venture at the
Yuzhno-Balyksk GPP, a SIBUR-owned plant in Khanty-Mansiysk. Yuzhno-Balyksk was opened in 1978 and
annually processes about 1.5 Bcm of APG from the fields of Rosneft’s subsidiary Yuganskneftegaz. The parties
plan to increase APG processing to 3 Bcm/y, with additional processing being possible if gas production rises at
Rosneft’s fields.
In October 2007 SIBUR completed an expansion and reconstruction project at the Yuzhno-Balyksky GPP and is
in the process of pre commissioning. The Priobskaya compressor station owned by Rosneft is ready to deliver
Associated Gas in Russia – Appendices | Page 74 December 2007
Gas Group Consulting
more APG to the Yuzhno-Balyksky GPP. The new gas processing units are expected to come onstream in early
November, which will allow increasing the volume of APG processed from 1 to 1.7 Bcm/y. Expansion to process
up to 3 Bcm/y is scheduled for completion in 2009.
Novatek (Gazprom 19.9%)
In 2006, Novatek produced 28.7 Bcm of gas and sold 30.3 Bcm, including additional volumes purchased mainly
from Gazprom. The company sold 44% of its gas to end-users and the rest to wholesale marketers (ex-field)
and achieved average netback prices of $27.12/Mcm from end-users and $24.4/Mcm from wholesale marketers.
On 17 September 2007, Novatek announced the commissioning of a pilot methanol production unit with
throughput capacity of 12,500 tpa at its Yurkharovskoye gas condensate field. Methanol is used to prevent
condensation in wells and gas gathering systems in areas of low temperatures (the field is located within the
Arctic Circle), and Novatek states that the new methanol plant can provide the field’s current methanol
requirements. Novatek previously delivered methanol to the field in the summer months via the Ob River and
Tazov Bay and in the winter months via a seasonal winter road. On-site methanol production will reduce
production costs, ensure operational stability, and eliminate the environmental risks associated with transporting
methanol.
According to Novatek, the methanol unit’s design incorporates an advanced automated control system and the
latest technologies, enabling it to minimize natural gas and water consumption. Capital cost was minimized by
integrating the methanol production unit into the existing infrastructure of the field’s complex gas preparation
plant. The company is considering a second phase expansion to 50,000 tpa to meet increased methanol needs
related to planned production growth at Yurkharovskoye.
Surgutneftegaz
Surgutneftegas operates around 40 fields with APG and claims to utilize 10 Bcm/y of associated gas that was
previously flared, and to be the largest user of APG. Surgutneftegaz uses APG primarily in local power plants
that power its oil operations and also supplies gas to gas processing facilities for transformation into
petrochemical feedstocks. In recent years, the company has started up five 12 MW gas-turbine power plants at
the Bettimskoe, Lukyavinskoe, Russkinskoe and Lyantarskoe fields. Each plant is capable of utilizing up to 100
Mcm of APG annually and generating up to 400 million KWh of electricity. The Lukyavinskoe field gas-turbine
power plant was commissioned in summer 2004 at a total project cost of $125 million. According to the
company, operating a single gas-turbine power plant at the Konitlorskoe field decreases emissions of methane
and carbon dioxide by 120,000 tonnes annually.
Associated Gas in Russia – Appendices | Page 75 December 2007
Gas Group Consulting
TNK-BP
According to TNK-BP, which produced 8.6 Bcm of gas in 2006, the company between 66% and 73% of its APG
and has adopted a corporate gas monetization strategy to boost utilization to 95% by 2011. The company has
allocated approximately $500 million to projects in West Siberia and the Orenburg region.
TNK-BP inherited a number of oilfields where gas-flaring rates exceeded operating license targets, with the
problem being is most acute in the Nizhnevartovsk and Volga-Urals regions. In Nizhnevartovsk, TNK-BP’s East
and Samotlor business units operate over 30 oilfields dispersed across 20,000 sq. km, some of which have no
access, or only limited access, to the gas-gathering system. Currently, some APG is consumed internally and
some is sold to Sibur for processing and further sale via the gas distribution network, but the balance is flared.
Beginning in 2003, TNK-BP initiated measures to increase APG utilization and reduce APG flaring 95% by the
end of 2009. TNK-BP is considering a number of alternatives, including reinjection into the gas cap, oil zone or
aquifer, and using gas to generate heat for hot water or steam injection. Reservoir screening has identified gas
cap candidates for gas injection and several aquifer reservoirs with gas storage potential. In an in-house
publication, TNK-BP states, “Although every effort will be made to maximize gas sales, it is likely that the
solution to the problem of flaring associated gas will lie somewhere between the sell-all-gas and inject-all-gas
strategies.” As part of this process, TNK-BP is studying a possible gas gathering system to link individual fields
and reservoirs in the Samotlor area. In November 2006, TNK-BP established a joint venture with Gazprom
subsidiary Sibur Holdings JSC to process APG produced by TNK-BP and other oil producers in the
Nizhnevartovsk region. Sibur will hold 51% of the JV and TNK-BP will hold 49% and the partners will equally
share management control.
TNK-BP also has plans to monetize APG by supplying it to power plants. In September 2007, TNK-BP
announced it would pay $320 mm to create a JV with power generation company OGK-1. The JV will include
two units at the Nizhnevartovsk power station and plans for a third power plant with an estimated 830 MW
capacity that would utilize up to 1.5 Bcm/yr. The projects are expected to cost $800 million and begin operations
in 2010. TNK-BP has also begun building a 32-MW pilot power plant in the Orenburg region and plans a 20-MW
power plant in Nizhnevartovsk region.
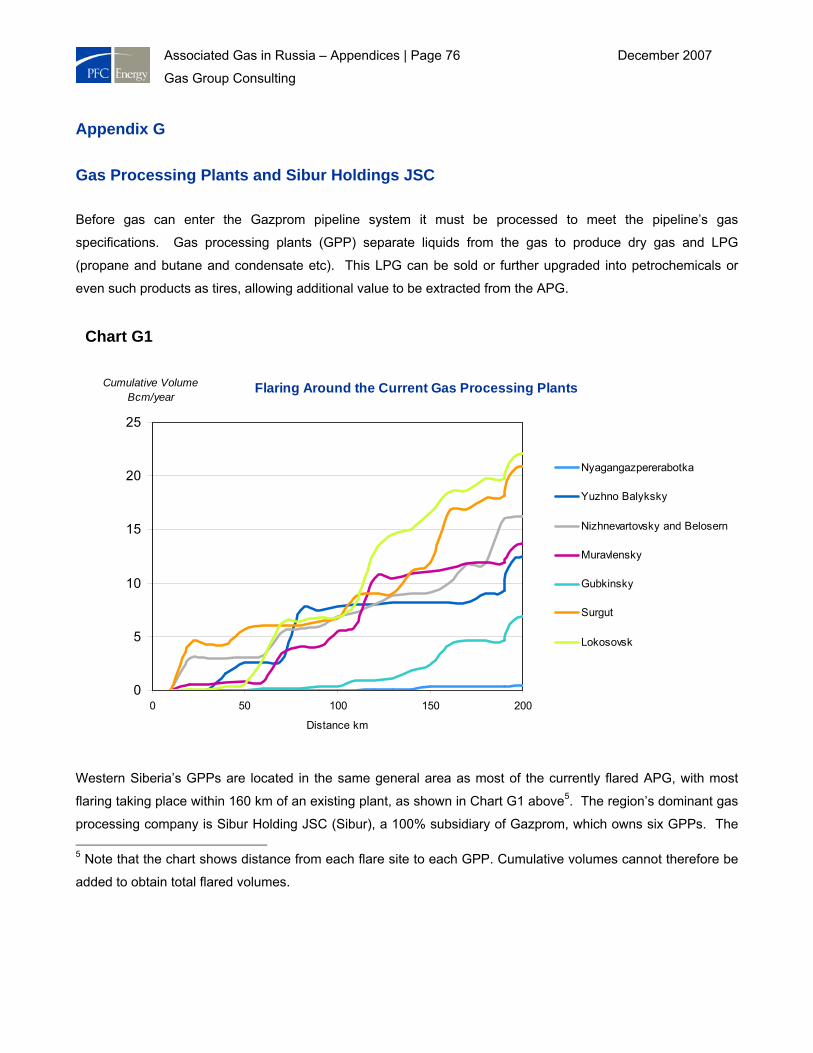
Associated Gas in Russia – Appendices | Page 76 December 2007
Gas Group Consulting
Appendix G
Gas Processing Plants and Sibur Holdings JSC
Before gas can enter the Gazprom pipeline system it must be processed to meet the pipeline’s gas
specifications. Gas processing plants (GPP) separate liquids from the gas to produce dry gas and LPG
(propane and butane and condensate etc). This LPG can be sold or further upgraded into petrochemicals or
even such products as tires, allowing additional value to be extracted from the APG.
Western Siberia’s GPPs are located in the same general area as most of the currently flared APG, with most
flaring taking place within 160 km of an existing plant, as shown in Chart G1 above5. The region’s dominant gas
processing company is Sibur Holding JSC (Sibur), a 100% subsidiary of Gazprom, which owns six GPPs. The 5 Note that the chart shows distance from each flare site to each GPP. Cumulative volumes cannot therefore be
added to obtain total flared volumes.
Chart G1
Flaring Around the Current Gas Processing Plants
0
5
10
15
20
25
0 50 100 150 200
Distance km
Cumulative Volume Bcm/year
Nyagangazpererabotka
Yuzhno Balyksky
Nizhnevartovsky and Belosern
Muravlensky
Gubkinsky
Surgut
Lokosovsk
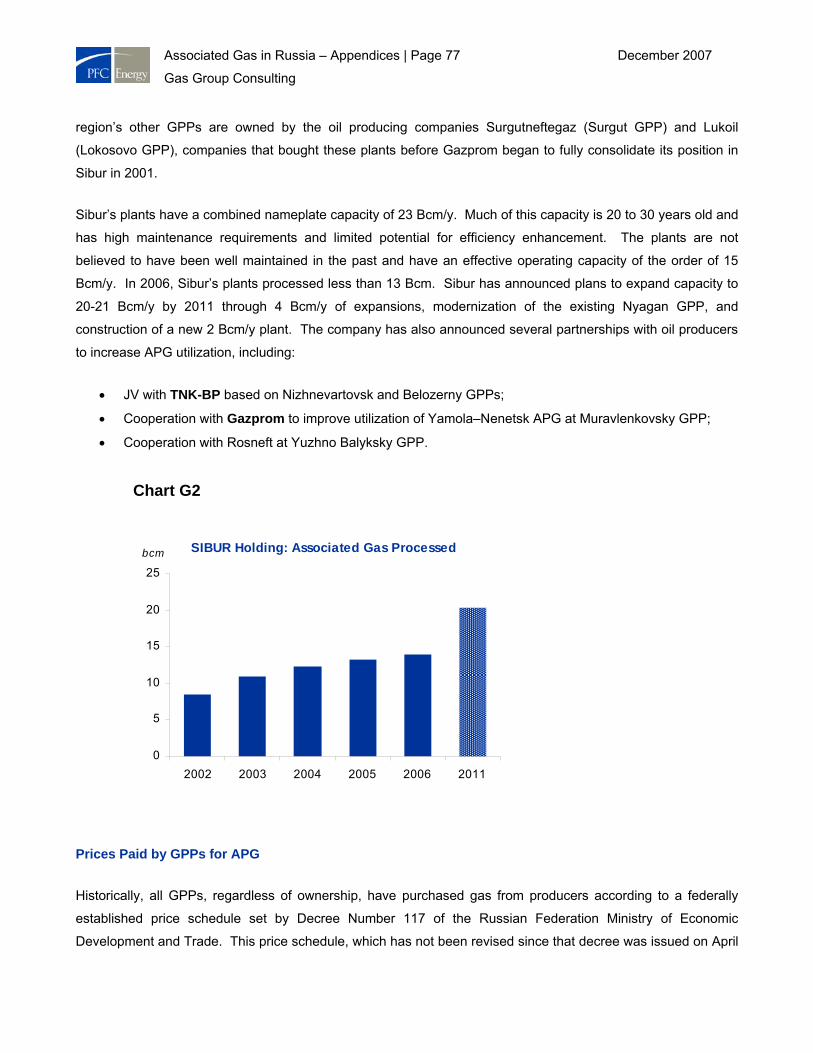
Associated Gas in Russia – Appendices | Page 77 December 2007
Gas Group Consulting
region’s other GPPs are owned by the oil producing companies Surgutneftegaz (Surgut GPP) and Lukoil
(Lokosovo GPP), companies that bought these plants before Gazprom began to fully consolidate its position in
Sibur in 2001.
Sibur’s plants have a combined nameplate capacity of 23 Bcm/y. Much of this capacity is 20 to 30 years old and
has high maintenance requirements and limited potential for efficiency enhancement. The plants are not
believed to have been well maintained in the past and have an effective operating capacity of the order of 15
Bcm/y. In 2006, Sibur’s plants processed less than 13 Bcm. Sibur has announced plans to expand capacity to
20-21 Bcm/y by 2011 through 4 Bcm/y of expansions, modernization of the existing Nyagan GPP, and
construction of a new 2 Bcm/y plant. The company has also announced several partnerships with oil producers
to increase APG utilization, including:
• JV with TNK-BP based on Nizhnevartovsk and Belozerny GPPs;
• Cooperation with Gazprom to improve utilization of Yamola–Nenetsk APG at Muravlenkovsky GPP;
• Cooperation with Rosneft at Yuzhno Balyksky GPP.
Prices Paid by GPPs for APG
Historically, all GPPs, regardless of ownership, have purchased gas from producers according to a federally
established price schedule set by Decree Number 117 of the Russian Federation Ministry of Economic
Development and Trade. This price schedule, which has not been revised since that decree was issued on April
Chart G2
SIBUR Holding: Associated Gas Processed
0
5
10
15
20
25
2002 2003 2004 2005 2006 2011
bcm
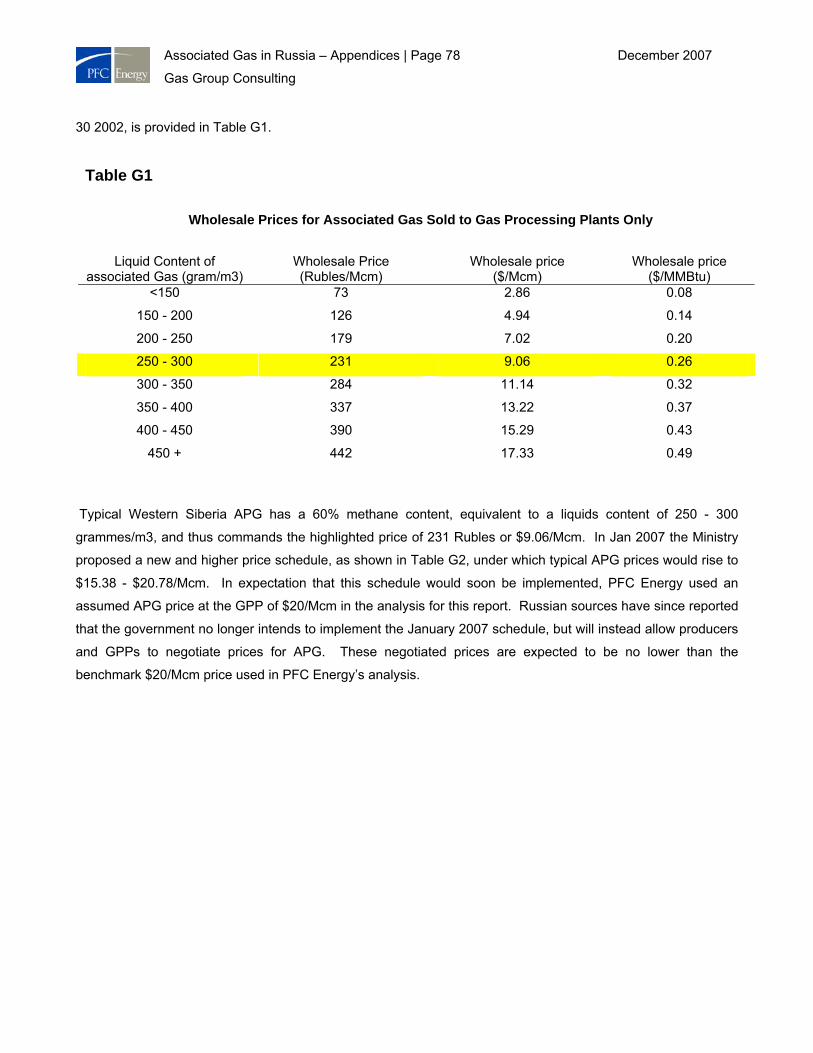
Associated Gas in Russia – Appendices | Page 78 December 2007
Gas Group Consulting
30 2002, is provided in Table G1.
Typical Western Siberia APG has a 60% methane content, equivalent to a liquids content of 250 - 300
grammes/m3, and thus commands the highlighted price of 231 Rubles or $9.06/Mcm. In Jan 2007 the Ministry
proposed a new and higher price schedule, as shown in Table G2, under which typical APG prices would rise to
$15.38 - $20.78/Mcm. In expectation that this schedule would soon be implemented, PFC Energy used an
assumed APG price at the GPP of $20/Mcm in the analysis for this report. Russian sources have since reported
that the government no longer intends to implement the January 2007 schedule, but will instead allow producers
and GPPs to negotiate prices for APG. These negotiated prices are expected to be no lower than the
benchmark $20/Mcm price used in PFC Energy’s analysis.
Table G1
Wholesale Prices for Associated Gas Sold to Gas Processing Plants Only
Liquid Content of associated Gas (gram/m3)
Wholesale Price (Rubles/Mcm)
Wholesale price ($/Mcm)
Wholesale price ($/MMBtu)
<150 73 2.86 0.08
150 - 200 126 4.94 0.14
200 - 250 179 7.02 0.20
250 - 300 231 9.06 0.26
300 - 350 284 11.14 0.32
350 - 400 337 13.22 0.37
400 - 450 390 15.29 0.43
450 + 442 17.33 0.49
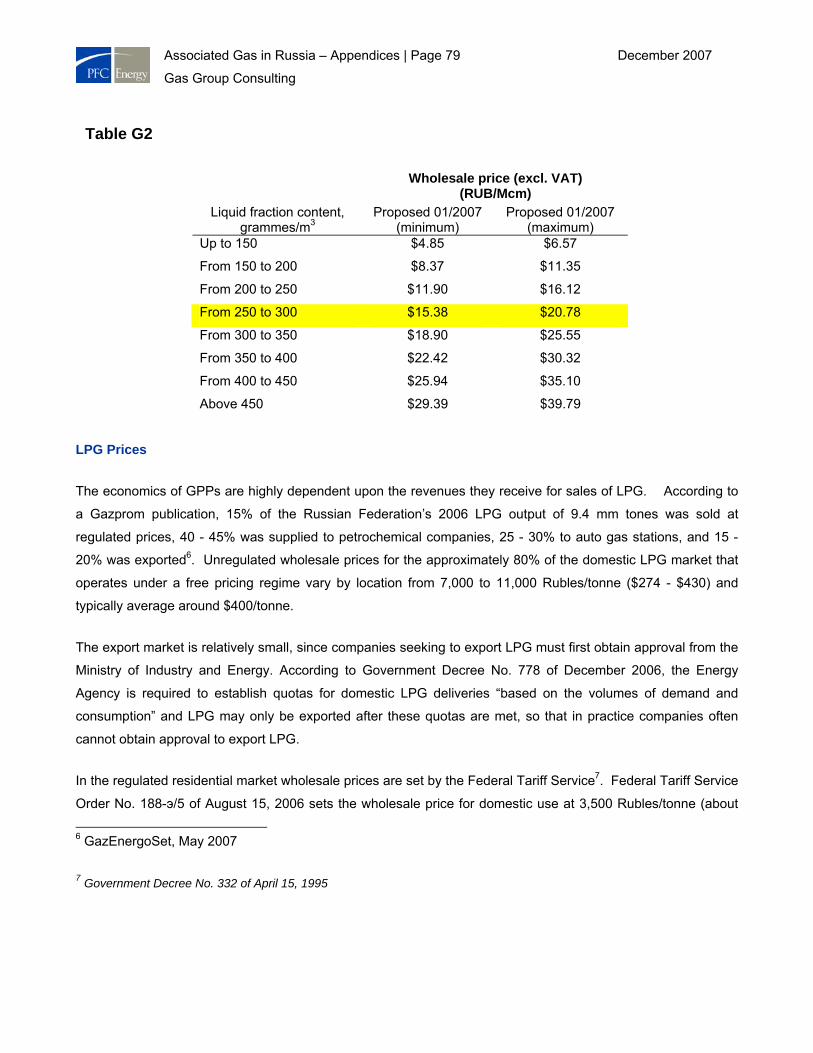
Associated Gas in Russia – Appendices | Page 79 December 2007
Gas Group Consulting
LPG Prices
The economics of GPPs are highly dependent upon the revenues they receive for sales of LPG. According to
a Gazprom publication, 15% of the Russian Federation’s 2006 LPG output of 9.4 mm tones was sold at
regulated prices, 40 - 45% was supplied to petrochemical companies, 25 - 30% to auto gas stations, and 15 -
20% was exported6. Unregulated wholesale prices for the approximately 80% of the domestic LPG market that
operates under a free pricing regime vary by location from 7,000 to 11,000 Rubles/tonne ($274 - $430) and
typically average around $400/tonne.
The export market is relatively small, since companies seeking to export LPG must first obtain approval from the
Ministry of Industry and Energy. According to Government Decree No. 778 of December 2006, the Energy
Agency is required to establish quotas for domestic LPG deliveries “based on the volumes of demand and
consumption” and LPG may only be exported after these quotas are met, so that in practice companies often
cannot obtain approval to export LPG.
In the regulated residential market wholesale prices are set by the Federal Tariff Service7. Federal Tariff Service
Order No. 188-э/5 of August 15, 2006 sets the wholesale price for domestic use at 3,500 Rubles/tonne (about
6 GazEnergoSet, May 2007
7 Government Decree No. 332 of April 15, 1995
Table G2
25.5567 Wholesale price (excl. VAT)
(RUB/Mcm) Liquid fraction content,
grammes/m3 Proposed 01/2007
(minimum) Proposed 01/2007
(maximum) Up to 150 $4.85 $6.57
From 150 to 200 $8.37 $11.35
From 200 to 250 $11.90 $16.12
From 250 to 300 $15.38 $20.78
From 300 to 350 $18.90 $25.55
From 350 to 400 $22.42 $30.32
From 400 to 450 $25.94 $35.10
Above 450 $29.39 $39.79
Associated Gas in Russia – Appendices | Page 80 December 2007
Gas Group Consulting
$137) excluding VAT from January 1, 2007; Order No. 168-э/3 increased the price to 4,500 Rubles/tonne ($176)
excluding VAT from January 1, 2008.
Retail prices for residential LPG (not including LPG used as automotive fuel) are set by local governments using
a methodology developed by the Federal Tariff Service. In 2007, the regulated retail price in various Russian
cities was:
Volgograd Oblast: 12,150 Rubles/tonne ($475)
St.-Petersburg: 11,090 Rubles/tonne ($434)
Moscow: 22,860 Rubles/tonne ($894)
Sibur Holding JSC
The gas processing business in Western Siberia is dominated by Sibur Holding JSC, which is 100% owned by
Gazprom. The following brief review of SIBUR’s strategic objectives and financial performance indicates that the
company has both the motive and the resources to increase its processing of APG.
SIBUR Holding has three business units:
• Hydrocarbon feedstocks (including GPPs) • Synthetic rubbers • Plastics and organic synthesis
Each business unit is accountable for the financial results of its operational centers and the aggregate financial
outcome across the product range. The Company owns the feedstock and end products, and pays each
business unit for its processing services. The Head Office is responsible for strategic planning, allocation of
resources between business units, development of common corporate standards, regulations and policies, and
control over plan and budget performance by the business units.
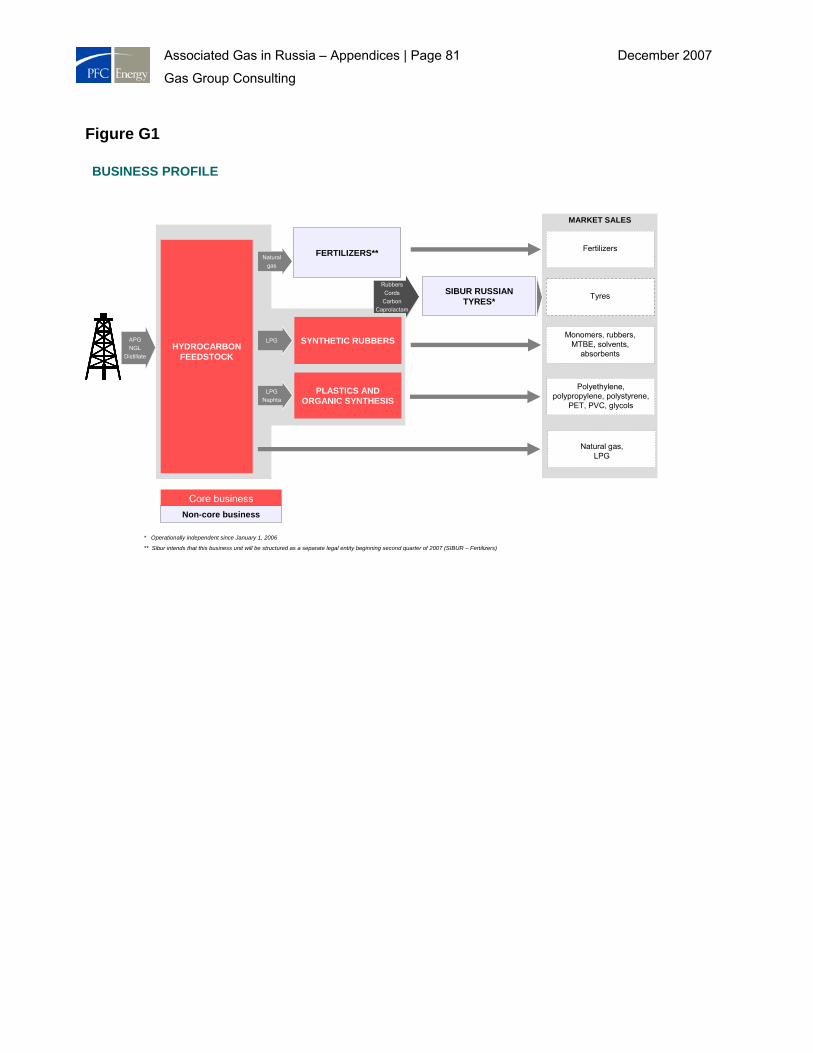
Associated Gas in Russia – Appendices | Page 81 December 2007
Gas Group Consulting
Figure G1
MARKET SALES
PLASTICS AND ORGANIC SYNTHESIS
Natural gas,LPG
SIBUR RUSSIAN TYRES*
Fertilizers
Monomers, rubbers, MTBE, solvents,
absorbents
Polyethylene, polypropylene, polystyrene,
PET, PVC, glycols
FERTILIZERS**
SYNTHETIC RUBBERS
BUSINESS PROFILE
Tyres
HYDROCARBON FEEDSTOCK
APGNGL
Distillate
* Operationally independent since January 1, 2006
** Sibur intends that this business unit will be structured as a separate legal entity beginning second quarter of 2007 (SIBUR – Fertilizers)
Naturalgas
LPG
LPGNaphta
Core businessNon-core business
RubbersCords
CarbonCaprolactam
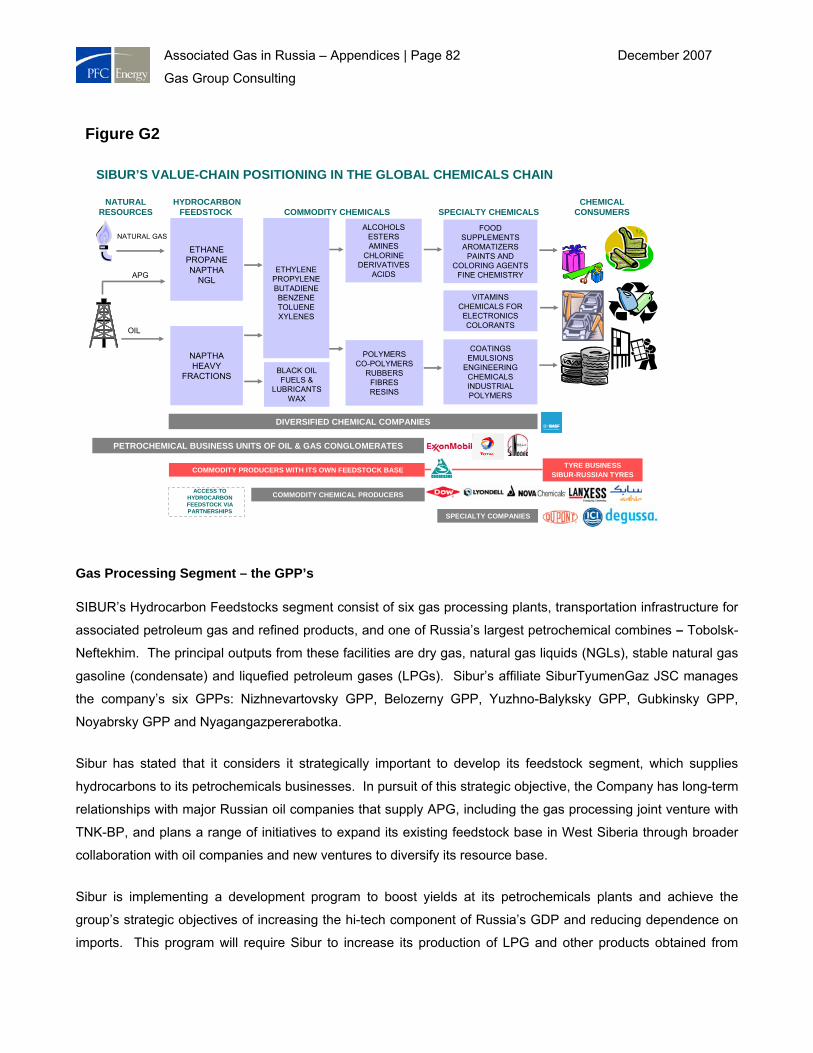
Associated Gas in Russia – Appendices | Page 82 December 2007
Gas Group Consulting
Gas Processing Segment – the GPP’s
SIBUR’s Hydrocarbon Feedstocks segment consist of six gas processing plants, transportation infrastructure for
associated petroleum gas and refined products, and one of Russia’s largest petrochemical combines – Tobolsk-
Neftekhim. The principal outputs from these facilities are dry gas, natural gas liquids (NGLs), stable natural gas
gasoline (condensate) and liquefied petroleum gases (LPGs). Sibur’s affiliate SiburTyumenGaz JSC manages
the company’s six GPPs: Nizhnevartovsky GPP, Belozerny GPP, Yuzhno-Balyksky GPP, Gubkinsky GPP,
Noyabrsky GPP and Nyagangazpererabotka.
Sibur has stated that it considers it strategically important to develop its feedstock segment, which supplies
hydrocarbons to its petrochemicals businesses. In pursuit of this strategic objective, the Company has long-term
relationships with major Russian oil companies that supply APG, including the gas processing joint venture with
TNK-BP, and plans a range of initiatives to expand its existing feedstock base in West Siberia through broader
collaboration with oil companies and new ventures to diversify its resource base.
Sibur is implementing a development program to boost yields at its petrochemicals plants and achieve the
group’s strategic objectives of increasing the hi-tech component of Russia’s GDP and reducing dependence on
imports. This program will require Sibur to increase its production of LPG and other products obtained from
Figure G2
VITAMINSCHEMICALS FOR ELECTRONICSCOLORANTS
SIBUR’S VALUE-CHAIN POSITIONING IN THE GLOBAL CHEMICALS CHAIN
OIL
BLACK OILFUELS &
LUBRICANTSWAX
COMMODITY CHEMICALS
ALCOHOLSESTERSAMINES
CHLORINE DERIVATIVES
ACIDS
POLYMERSCO-POLYMERS
RUBBERSFIBRESRESINS
FOOD SUPPLEMENTSAROMATIZERS
PAINTS ANDCOLORING AGENTS
FINE CHEMISTRY
SPECIALTY CHEMICALS
COATINGSEMULSIONS
ENGINEERING CHEMICALS INDUSTRIAL POLYMERS
CHEMICAL CONSUMERS
DIVERSIFIED CHEMICAL COMPANIES
SPECIALTY COMPANIES
APG
ETHANEPROPANENAPTHA
NGL
NAPTHAHEAVY
FRACTIONS
NATURAL GAS
HYDROCARBON FEEDSTOCK
PETROCHEMICAL BUSINESS UNITS OF OIL & GAS CONGLOMERATES
COMMODITY CHEMICAL PRODUCERS
COMMODITY PRODUCERS WITH ITS OWN FEEDSTOCK BASE
NATURAL RESOURCES
ACCESS TO HYDROCARBON FEEDSTOCK VIA PARTNERSHIPS
TYRE BUSINESSSIBUR-RUSSIAN TYRES
ETHYLENEPROPYLENEBUTADIENEBENZENETOLUENEXYLENES
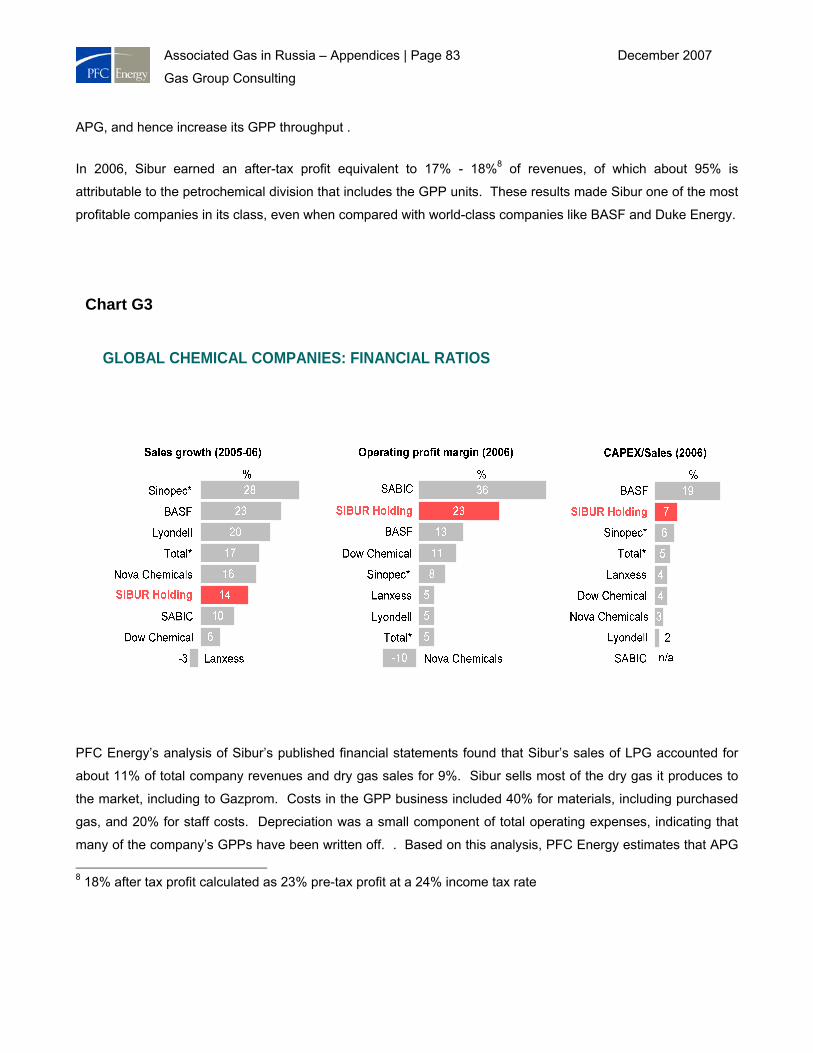
Associated Gas in Russia – Appendices | Page 83 December 2007
Gas Group Consulting
APG, and hence increase its GPP throughput .
In 2006, Sibur earned an after-tax profit equivalent to 17% - 18%8 of revenues, of which about 95% is
attributable to the petrochemical division that includes the GPP units. These results made Sibur one of the most
profitable companies in its class, even when compared with world-class companies like BASF and Duke Energy.
PFC Energy’s analysis of Sibur’s published financial statements found that Sibur’s sales of LPG accounted for
about 11% of total company revenues and dry gas sales for 9%. Sibur sells most of the dry gas it produces to
the market, including to Gazprom. Costs in the GPP business included 40% for materials, including purchased
gas, and 20% for staff costs. Depreciation was a small component of total operating expenses, indicating that
many of the company’s GPPs have been written off. . Based on this analysis, PFC Energy estimates that APG 8 18% after tax profit calculated as 23% pre-tax profit at a 24% income tax rate
Chart G3
GLOBAL CHEMICAL COMPANIES: FINANCIAL RATIOS

Associated Gas in Russia – Appendices | Page 84 December 2007
Gas Group Consulting
purchases amounted to only 10% of Sibur’s total operating costs.
PFC Energy estimates that Sibur sells only 30% to 40% of the LPG it produces, retaining the balance for
upgrading in its petrochemical plants to make higher value products. At current prices, PFC Energy estimates
that upgrading LPG adds approximately $14 - 15/Mcm to the value of APG, after all costs, including return on
investment.