Embed Size (px)
Citation preview
Using Response Rates and Other Quality Metrics to Assess the Effects of the Multi-Mode Collection for Business
Surveys: A Case Study
Katherine (Jenny) ThompsonBroderick OliverJennifer Beck
Context• Business Surveys conducted by the U.S. Census
Bureau
• Multi-mode collection• Internet (Web), Mail, Fax, Telephone• Selection of mode made by respondent
• Increase Web collection (Strategic Plan)• Contact strategies “push” towards Web• Availability of paper form decreasing
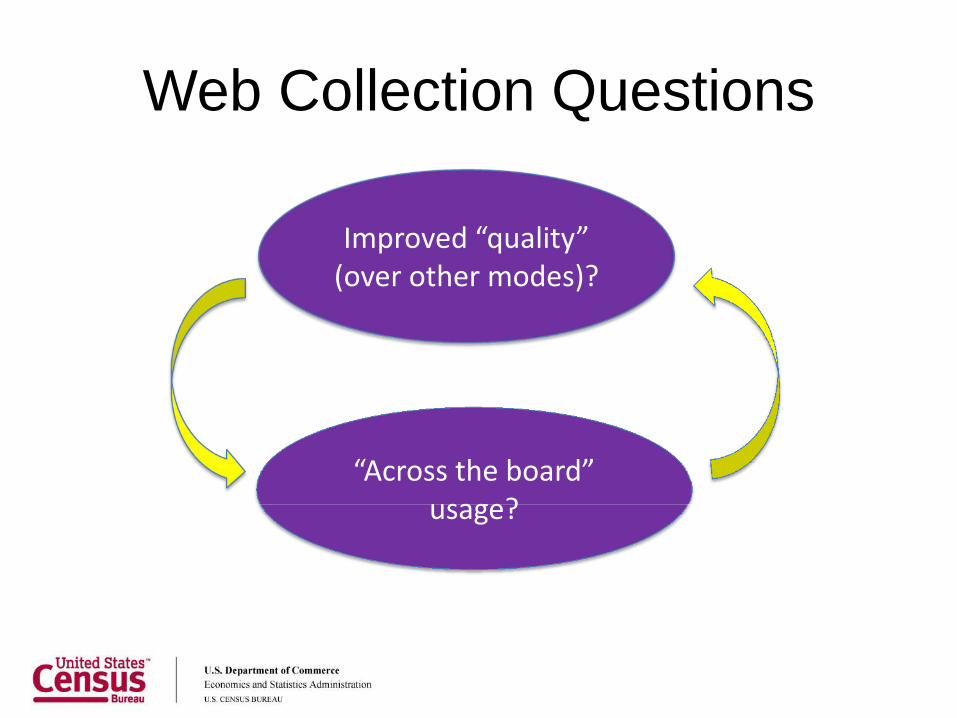
Web Collection Questions
“Across the board” usage?
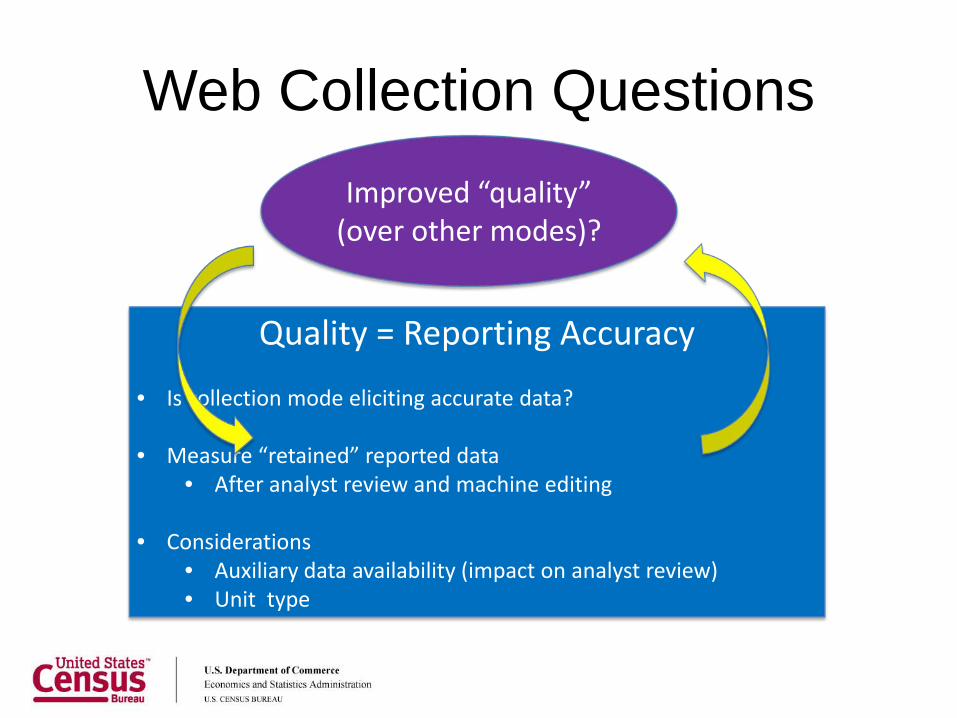
Improved “quality” (over other modes)?
Web Collection Questions
“Across the board” usage?
Improved “quality” (over other modes)?
Quality = Reporting Accuracy
• Is collection mode eliciting accurate data?
• Measure “retained” reported data• After analyst review and machine editing
• Considerations• Auxiliary data availability (impact on analyst review)• Unit type
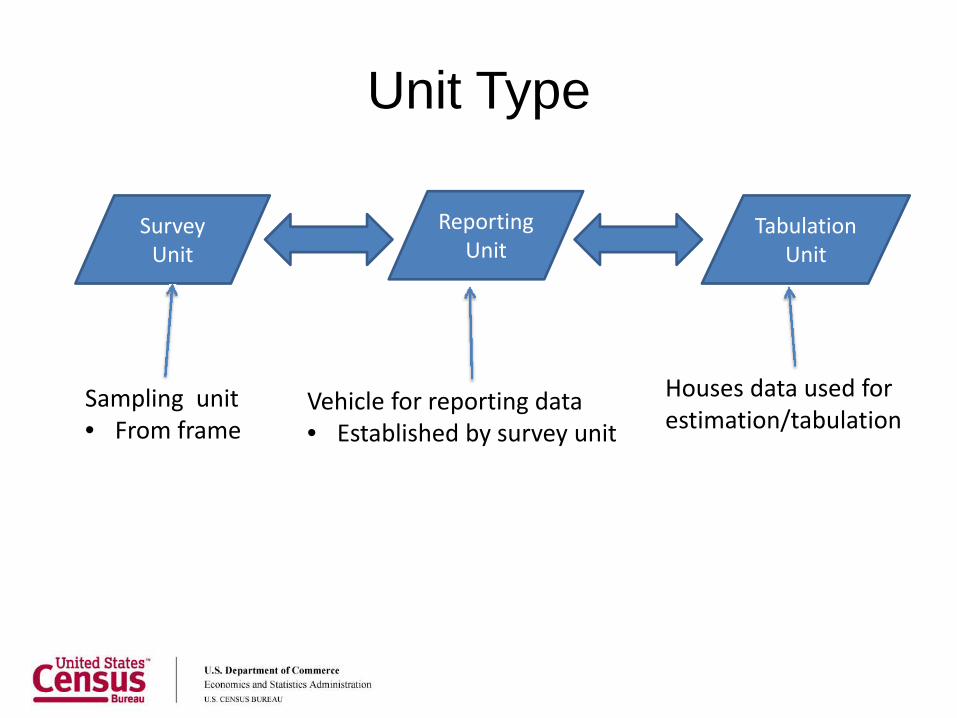
Unit Type
Reporting Unit
Survey Unit
Tabulation Unit
Sampling unit• From frame
Vehicle for reporting data• Established by survey unit
Houses data used for estimation/tabulation
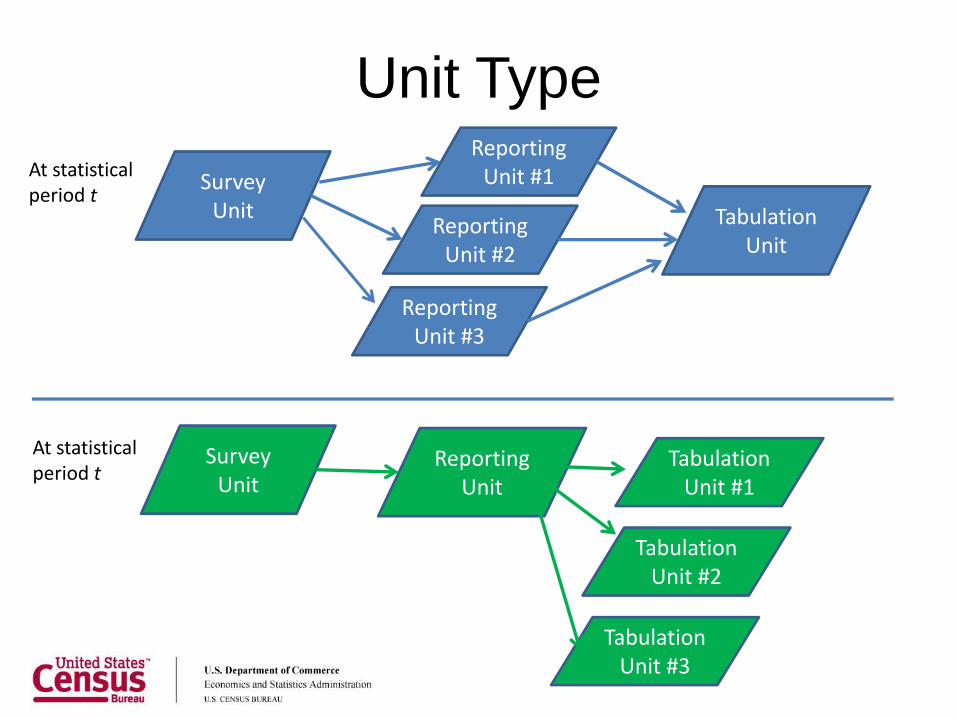
Unit TypeAt statistical period t
Reporting Unit #1Survey
Unit Tabulation Unit
Reporting Unit #2
Reporting Unit #3
At statistical period t
Survey Unit
Reporting Unit
Tabulation Unit #1
Tabulation Unit #2
Tabulation Unit #3
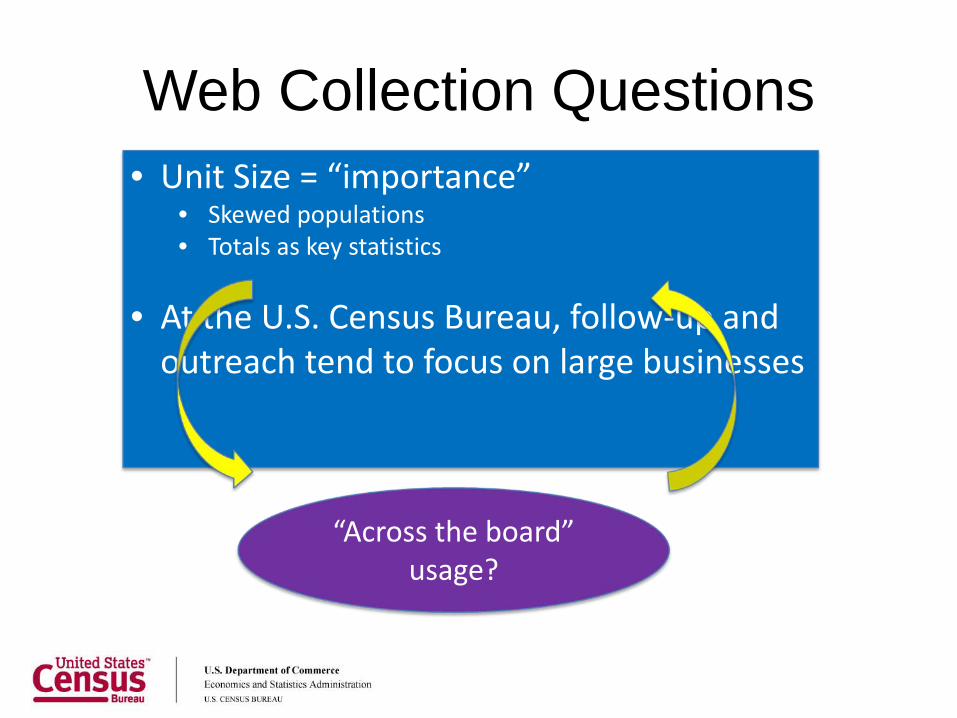
Web Collection Questions
“Across the board” usage?
Improved “quality” (over other modes)?
• Unit Size = “importance” • Skewed populations• Totals as key statistics
• At the U.S. Census Bureau, follow-up and outreach tend to focus on large businesses
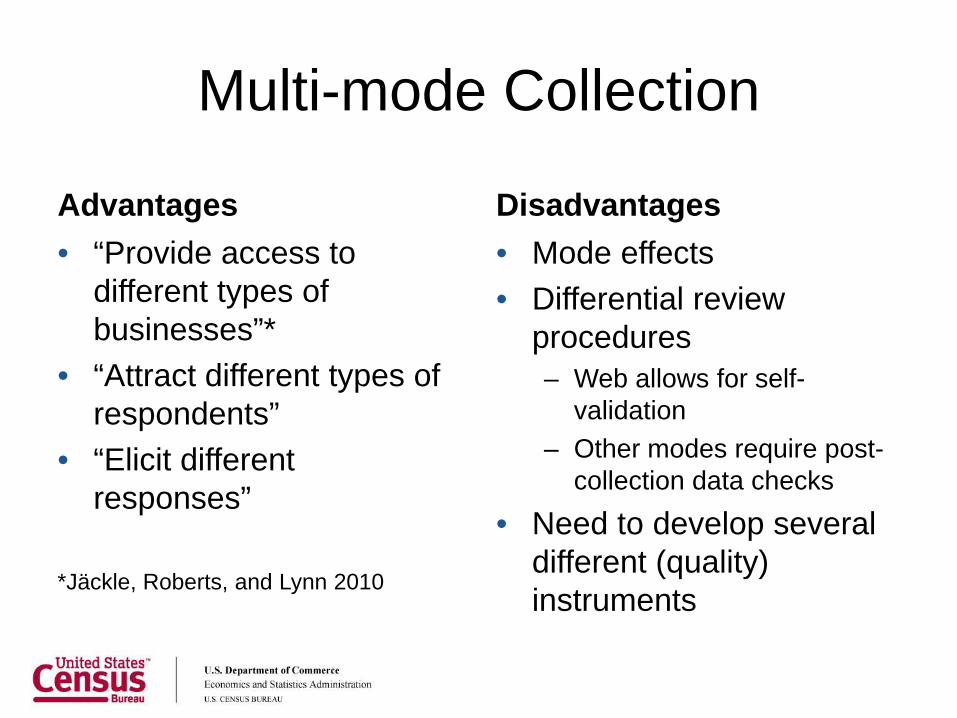
Multi-mode Collection
Advantages• “Provide access to
different types of businesses”*
• “Attract different types of respondents”
• “Elicit different responses”
*Jäckle, Roberts, and Lynn 2010
Disadvantages• Mode effects • Differential review
procedures– Web allows for self-
validation– Other modes require post-
collection data checks
• Need to develop several different (quality) instruments
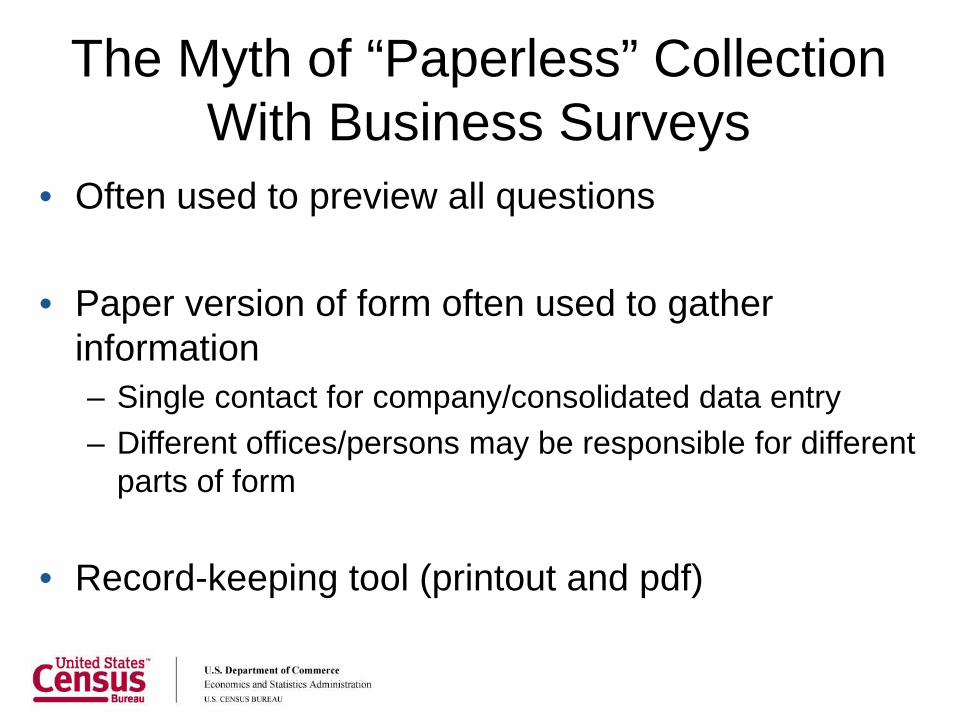
The Myth of “Paperless” Collection With Business Surveys
• Often used to preview all questions
• Paper version of form often used to gather information – Single contact for company/consolidated data entry– Different offices/persons may be responsible for different
parts of form
• Record-keeping tool (printout and pdf)
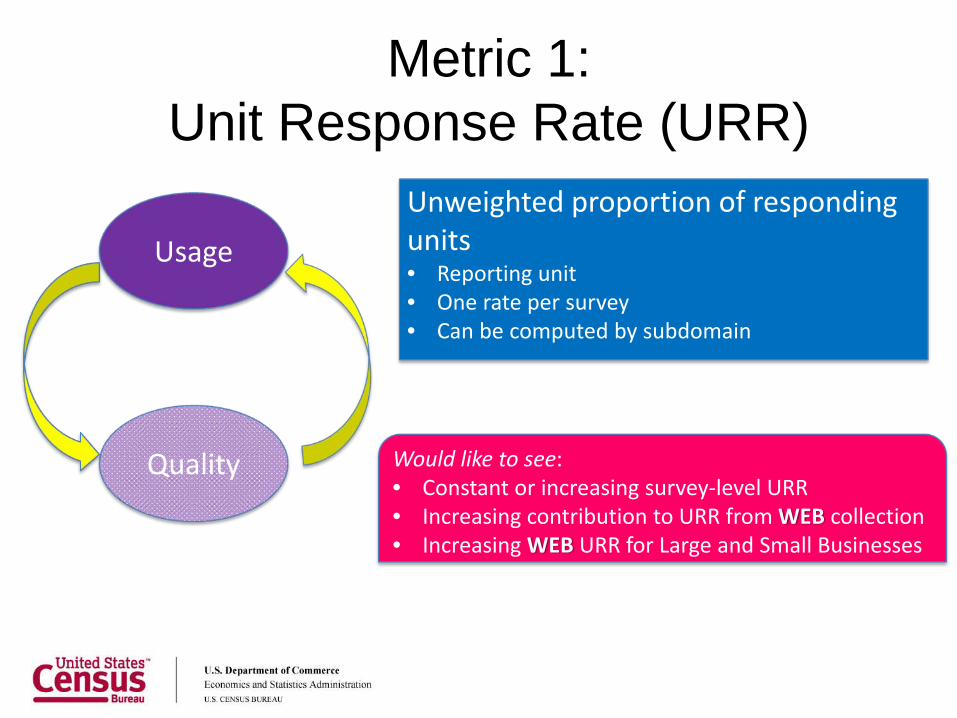
Metric 1:Unit Response Rate (URR)
Usage
Quality
Unweighted proportion of responding units• Reporting unit• One rate per survey• Can be computed by subdomain
Would like to see:• Constant or increasing survey-level URR• Increasing contribution to URR from WEB collection• Increasing WEB URR for Large and Small Businesses
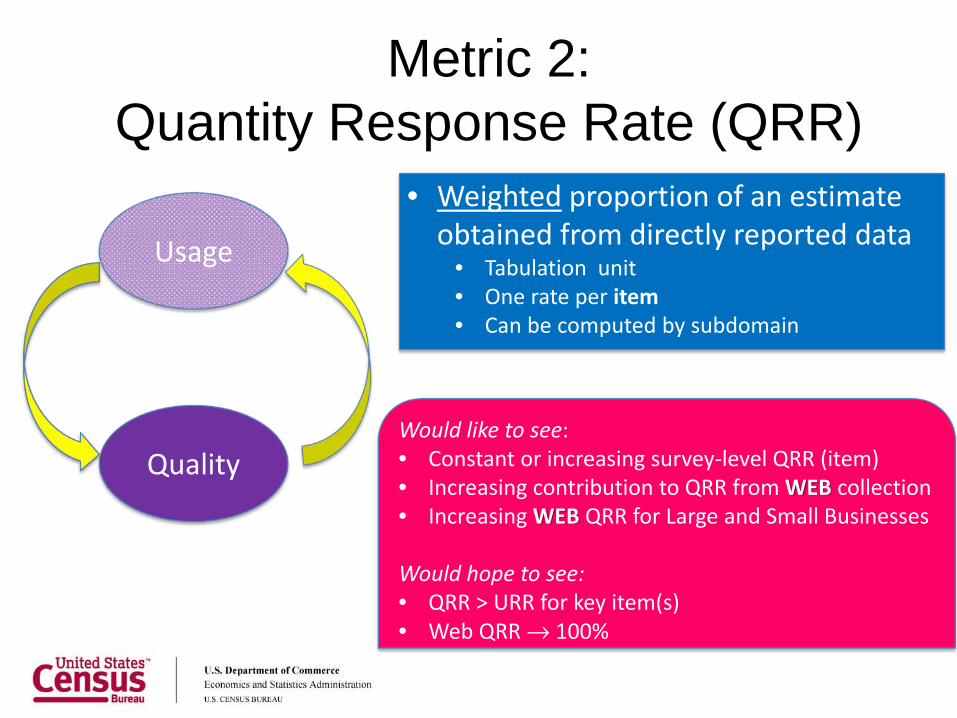
Metric 2:Quantity Response Rate (QRR)
Usage
Quality
• Weighted proportion of an estimate obtained from directly reported data
• Tabulation unit• One rate per item• Can be computed by subdomain
Would like to see:• Constant or increasing survey-level QRR (item)• Increasing contribution to QRR from WEB collection• Increasing WEB QRR for Large and Small Businesses
Would hope to see:• QRR > URR for key item(s)• Web QRR → 100%
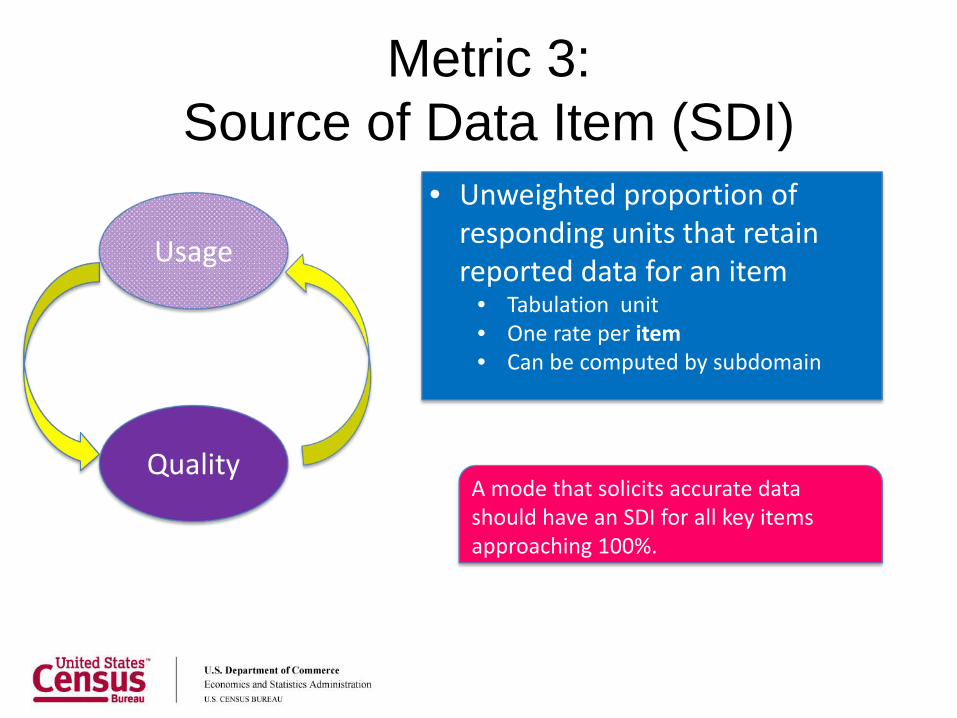
Metric 3:Source of Data Item (SDI)
Usage
Quality
• Unweighted proportion of responding units that retain reported data for an item
• Tabulation unit• One rate per item• Can be computed by subdomain
A mode that solicits accurate data should have an SDI for all key items approaching 100%.
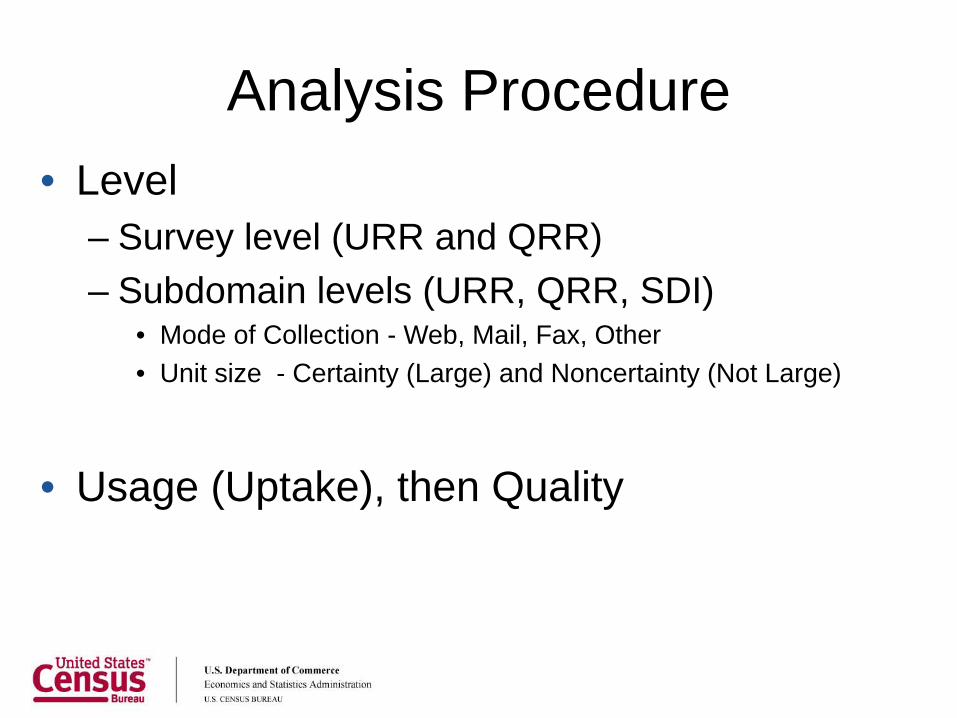
Analysis Procedure• Level
– Survey level (URR and QRR)– Subdomain levels (URR, QRR, SDI)
• Mode of Collection - Web, Mail, Fax, Other• Unit size - Certainty (Large) and Noncertainty (Not Large)
• Usage (Uptake), then Quality
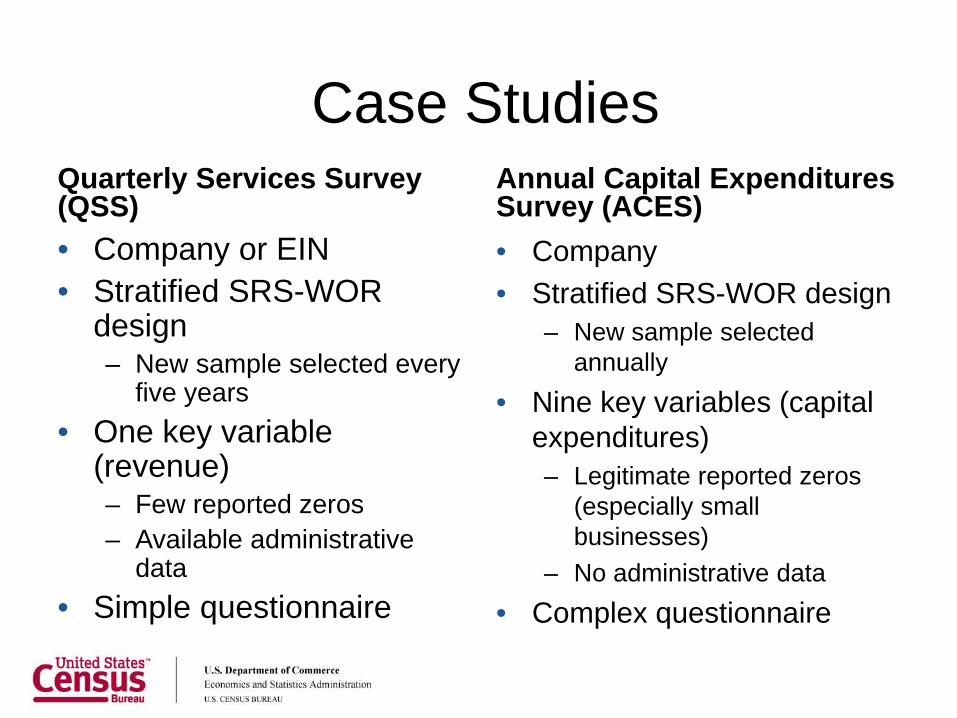
Case Studies Quarterly Services Survey (QSS)• Company or EIN• Stratified SRS-WOR
design– New sample selected every
five years• One key variable
(revenue)– Few reported zeros– Available administrative
data• Simple questionnaire
Annual Capital Expenditures Survey (ACES)• Company• Stratified SRS-WOR design
– New sample selected annually
• Nine key variables (capital expenditures)– Legitimate reported zeros
(especially small businesses)
– No administrative data• Complex questionnaire
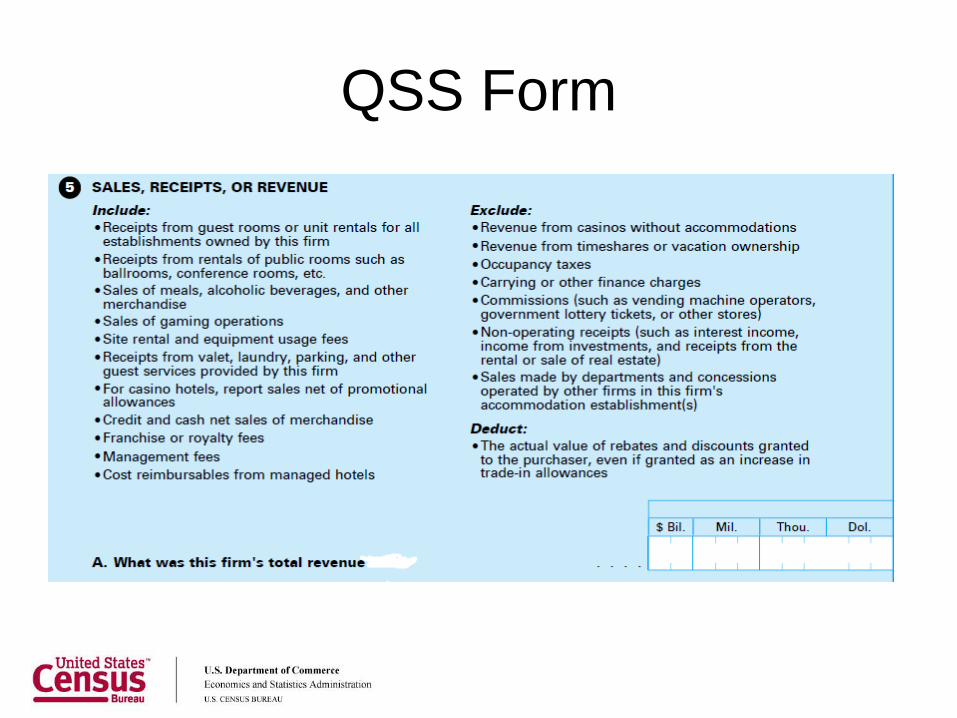
QSS Form
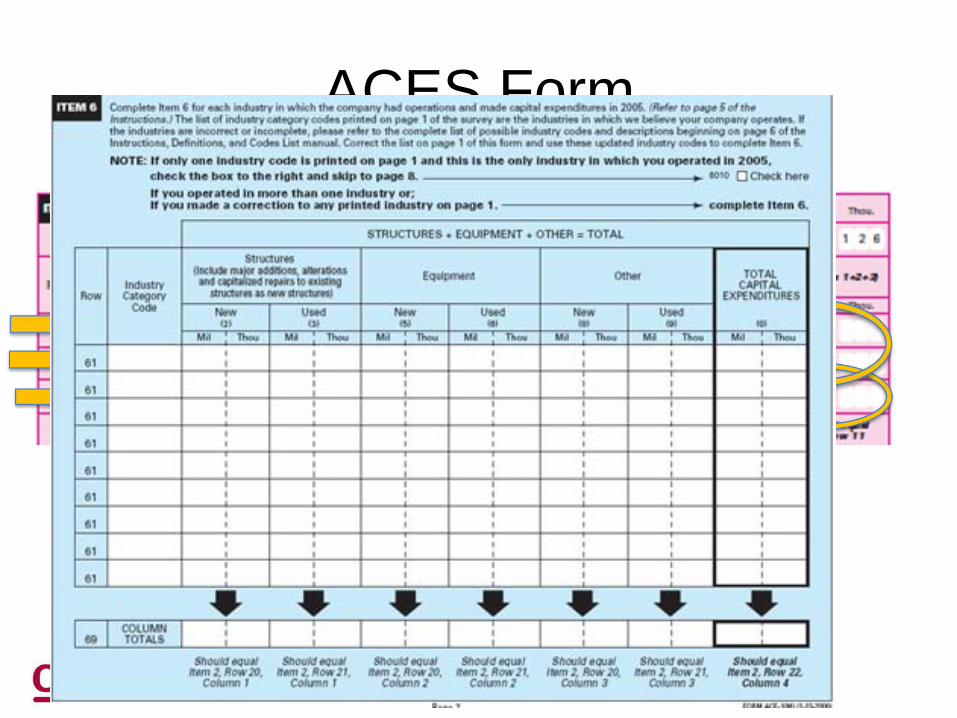
ACES Form
16
1st Study Question • Is Web collection increasing?
• If yes, – Is it an across-the-board phenomenon or– Is it confined to the larger businesses?
• Metrics studied– URR– QRR
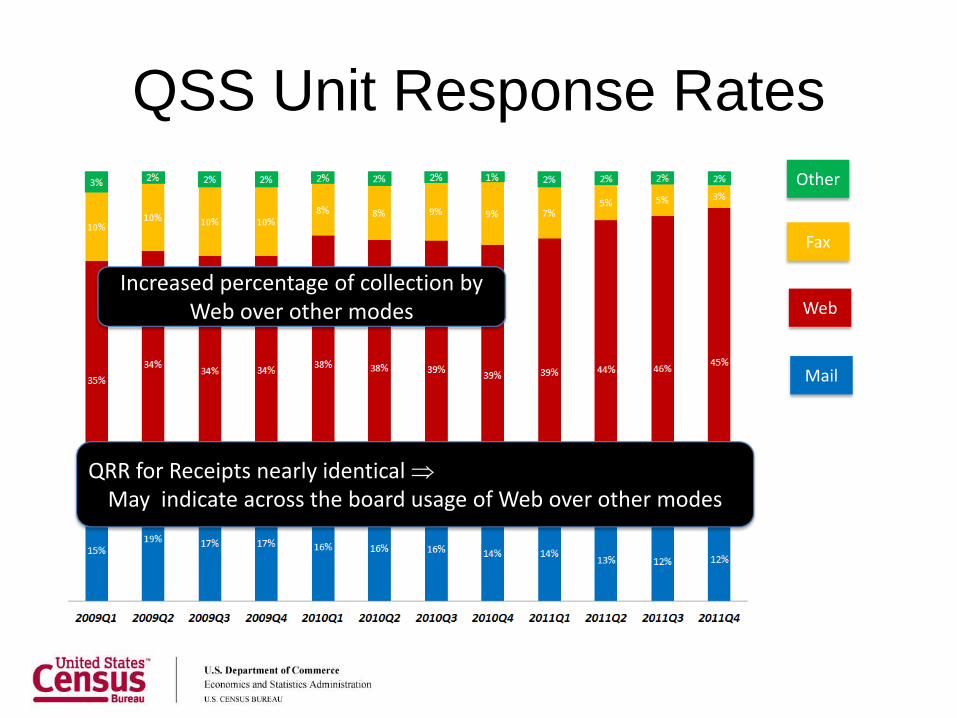
QSS Unit Response Rates
Increased percentage of collection by Web over other modes
QRR for Receipts nearly identical ⇒May indicate across the board usage of Web over other modes
Web
Fax
Other
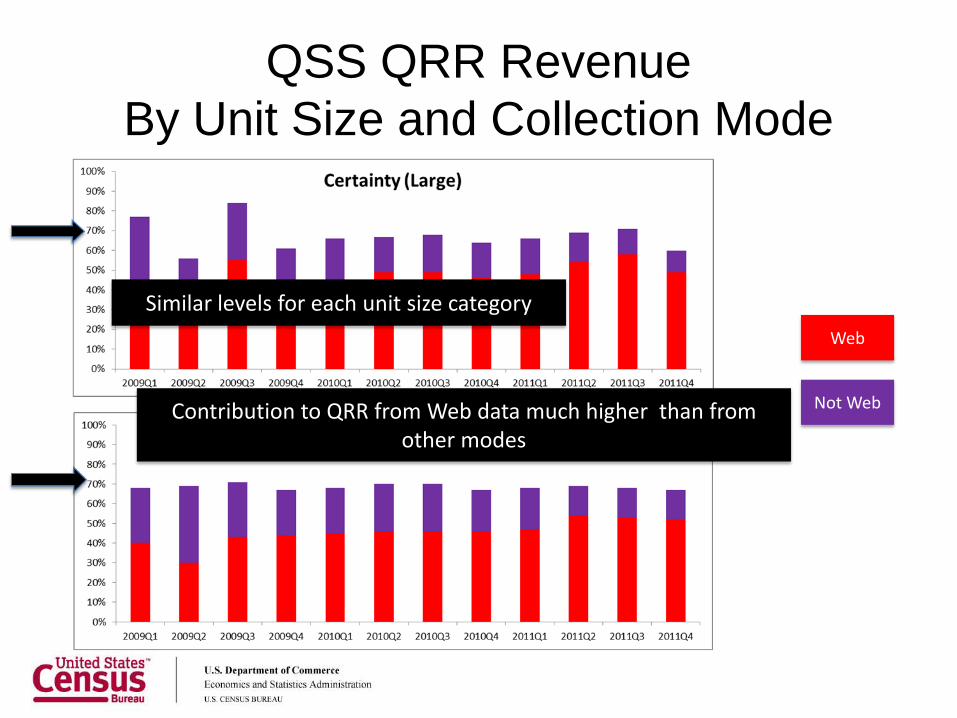
QSS QRR RevenueBy Unit Size and Collection Mode
Web
Not Web
Similar levels for each unit size category
Contribution to QRR from Web data much higher than from other modes
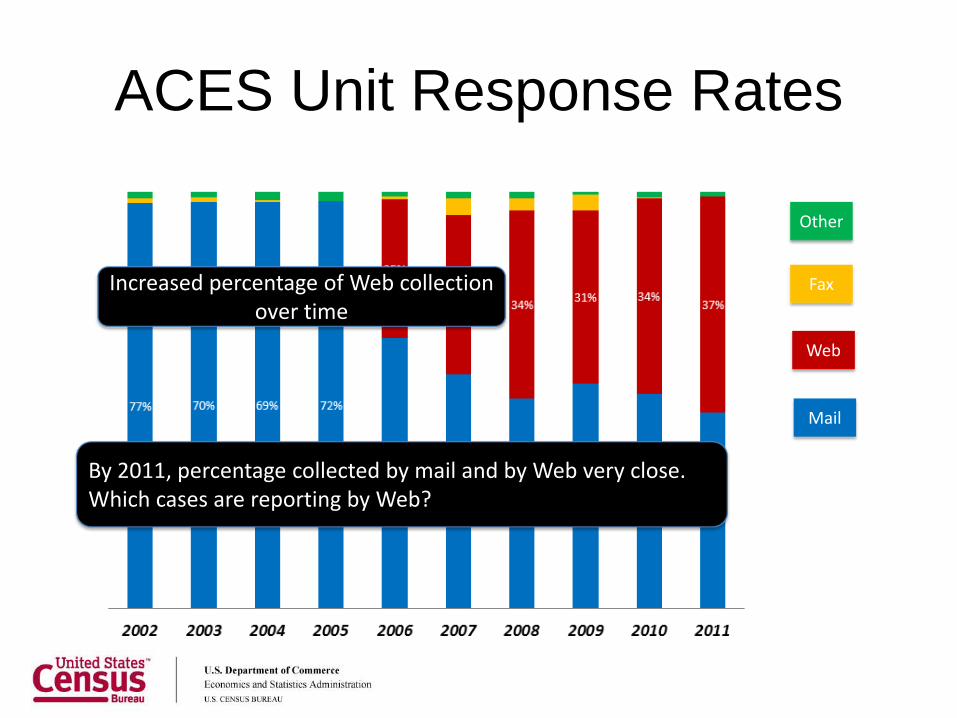
ACES Unit Response Rates
Increased percentage of Web collection over time
By 2011, percentage collected by mail and by Web very close.Which cases are reporting by Web?
Web
Fax
Other
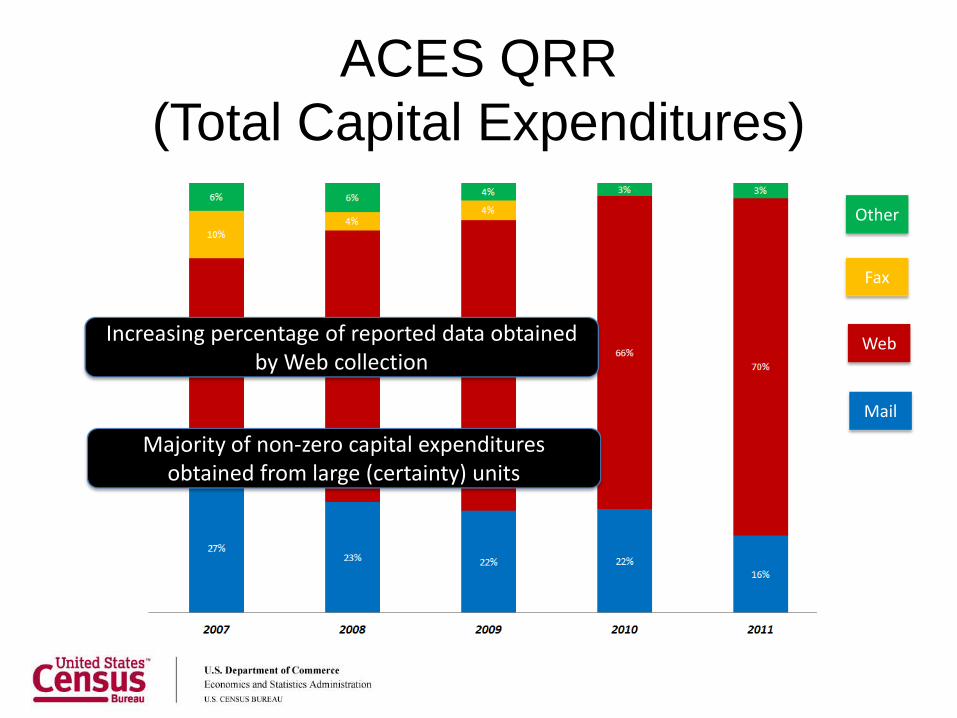
ACES QRR (Total Capital Expenditures)
Web
Fax
Other
Increasing percentage of reported data obtained by Web collection
Majority of non-zero capital expenditures obtained from large (certainty) units
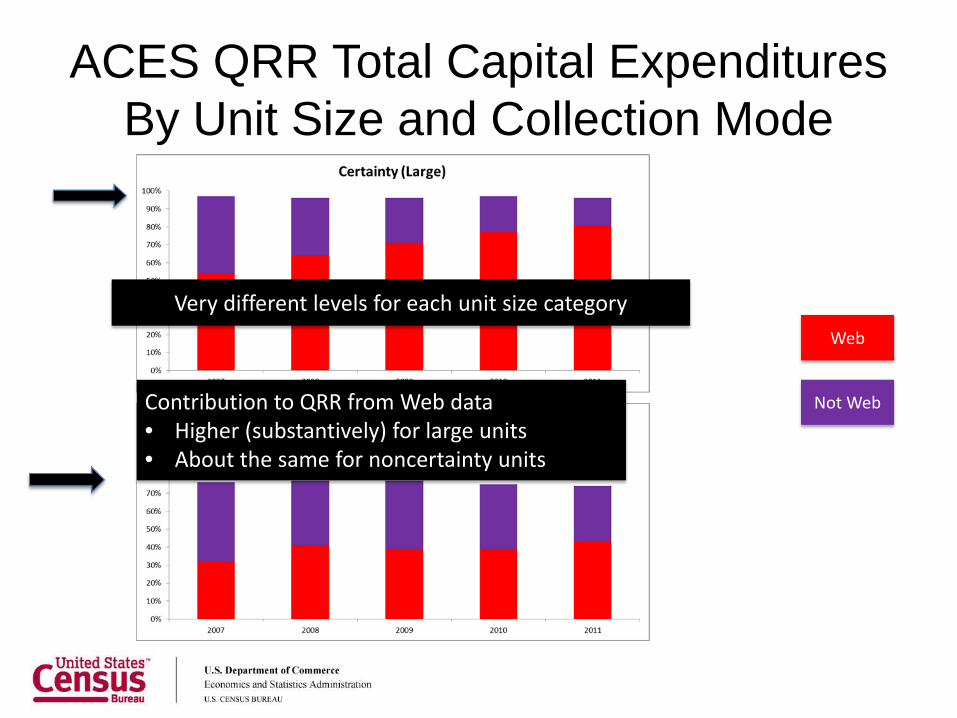
ACES QRR Total Capital ExpendituresBy Unit Size and Collection Mode
Web
Not Web
Very different levels for each unit size category
Contribution to QRR from Web data• Higher (substantively) for large units• About the same for noncertainty units
2nd Study Question
• Are there differences in data quality by mode of data collection?
• Are there interactions between unit size and mode of data collection in terms of quality?
• Metric used: SDI
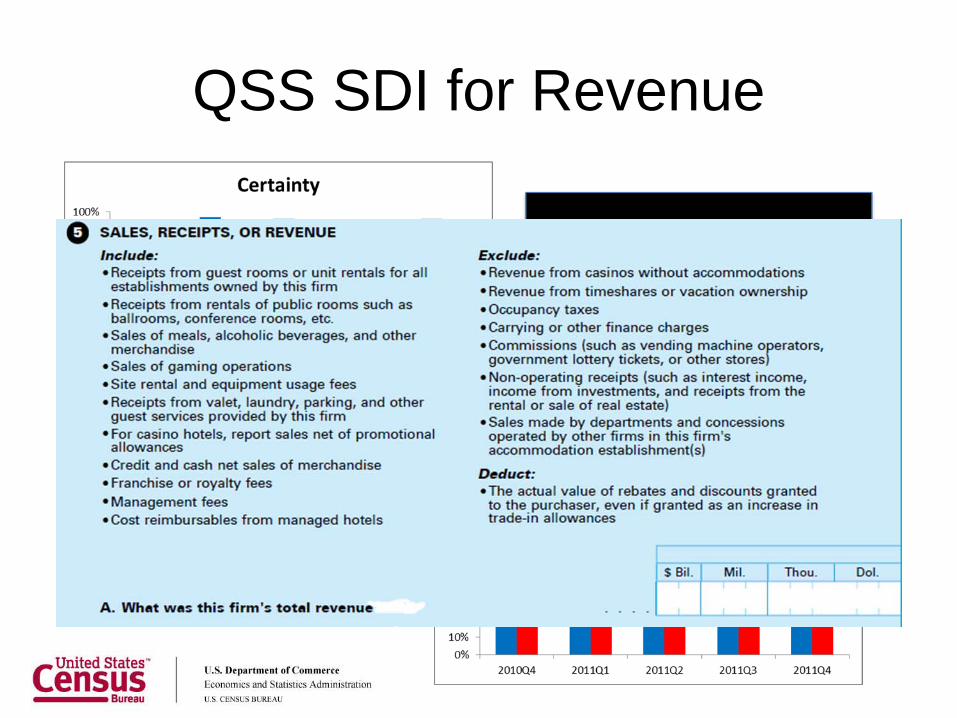
QSS SDI for Revenue
Minimal differences from Web versus mail collection
WebMail
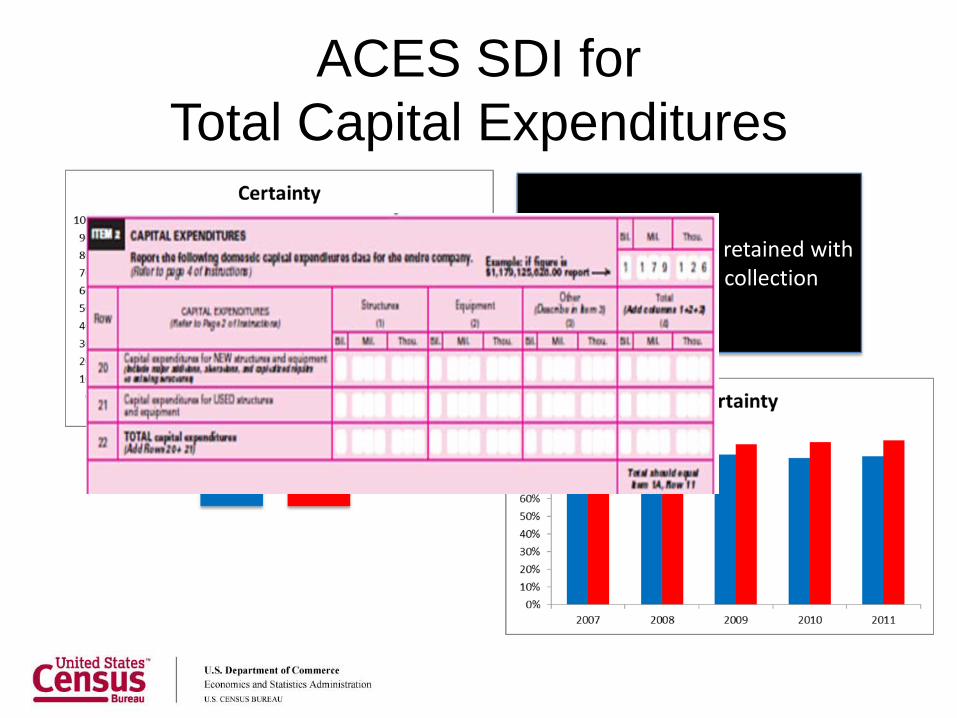
ACES SDI for Total Capital Expenditures
WebMail
More reported data retained with Web versus mail collection
Discussion• Three simple metrics
– Examined consistency (URR)– Provided insights into accuracy (QRR and SDI)
• Found differences in (voluntary) uptake– Across-the-board usage for QSS – Primarily confined to large businesses for ACES
Discussion• Identified interaction between mode and
difficulty of questionnaire– Simple – minimal differences in quality by mode– Complex – higher proportion of retained reported
data with Web collection
Missed Opportunity?• Demonstrated
– Web collection in these survey yields quality data– Uptake of Web is not necessarily equally used voluntarily
• Contention– The collection instrument that minimizes the probability of
response error for all units maximizes a major component of quality
• Need to learn how to bridge the gap in uptake