Embed Size (px)
Citation preview

What one lab has learned about using Real Time Analytics: A case study
USING REAL TIME ANALYTICS TO IMPROVE TURNAROUND TIME, STREAMLINE STAFF
SCHEDULING, AND IDENTIFY VARIOUS SOURCES OF ERROR, BOTH IN THE LAB AND IN THE ED


ST. JOSEPH’S HOSPITAL AND MEDICAL CENTER DIGNITY HEALTH
• Founded in 1895 by the Sisters of Mercy
• First hospital in the Phoenix area
• 586 beds, not for profit
• Includes:
• Barrow Neurological Institute
• Norton Thoracic Center
• University of Arizona Cancer Center
• Level 1 Trauma Center
• Part of Dignity Health, with more than 40 hospitals in Arizona, California and Nevada

SJHMC Laboratory Full service Laboratory, which includes Chemistry, Hematology, Blood Bank, Microbiology, Anatomic Pathology, Molecular Testing and Cytogenetics, and Point of Care testing
Performs over 4 million tests/year
Centralized testing site for Microbiology
Very little automation

AGENDA
• What are real time analytics? • Why did we choose to use them? • How did we initiate this process? • How did we implement Performance Insight? • Case studies and sample reports. • What we learned, what we did well, what we could have
done better.

WHAT ARE REAL TIME ANALYTICS?
• Access to and use of data and related resources as soon as data enters the system.
• Real time analytics can provide up to the minute information, and present it so that better and quicker business decisions can be made.
• Both recurring reports and unpredictable, ad hoc inquiries can provide valuable information.
• “Real time business intelligence”

WHY DID WE CHOOSE TO USE REAL TIME ANALYTICS?
• LIS system was not giving us the clean, actionable data required to make real time decisions.
• Report generation was slow, cumbersome, and the outcome was uncertain. • Greater flexibility in the types of reports we could generate was required—both
overview and “drill down” report capability. • Support of LEAN process improvement projects. • The potential to optimize staffing. • Identifying performance problems, and not allowing them to go unchecked.
• Improving management team’s effectiveness!

HOW DID WE INITIATE THIS PROCESS? (OR: HOW DID WE GET FROM THE EXECUTIVE WAR COLLEGE TO
HERE?)
• Starting point: The Executive War College
• Intermediate stops: Supply Chains, Finance, and IT
• Challenges unique to St. Joseph’s Hospital and Dignity Health
• Final approval and timeline

HOW DID WE IMPLEMENT PERFORMANCE INSIGHT?
• The 3 “buy-ins”
• System
• Facility
• Department
• Actual implementation
• Post-implementation hiccups
• Where we are now

ED TURNAROUND TIME AND QUALITY OF SERVICE
CASE STUDIES AND SAMPLE REPORTS

ED CHALLENGES
• Emphasis on faster throughput in the ED to decrease patient wait times, increase patient satisfaction and ensure better patient outcomes
• Complaints from physicians—”Why can’t we have the Stat Lab back?”
• Turnaround times were too long
• Specimen quality issues ►More phlebotomists needed
• Perception among lab staff that the ED staff “just likes to complain”
• Poor communication between ED and Lab, and also among Lab departments

PERFORMANCE INSIGHT DASHBOARD
ED TURNAROUND TIME DASHBOARD


Report Type: 3
Composite Turnaround Time
Sun, Sep 24, 2017 to Sat, Sep 30, 2017
CriteriaTest: CMP Comprehensive Metabolic Panel Count: 775 Pat Loc Group: 3 EDLab ID: sjh 10 lab Activity Being Counted: Tests
1st Time Segment: Order to Collect 2nd Time Segment: Collect to Receive 3rd Time Segment: Receive to Verify
Performance Summary Turnaround Time (minutes)Average Median 90% Completion Outliers (above target)
Current vs: Current vs: Current vs: n % of TotalOverall Target 60.0 102% 60.0 96% 60.0 149%Total 61.3 57.5 89.3 351 45.3%
Order to Collect 22.1 17.6 40.5 Collect to Receive 14.9 10.0 29.0 Receive to Verify 30.0 27.3 45.0
0
10
20
30
40
50
60
70
0
20
40
60
80
100
120
0 1 2 3 4 5 6 7 8 9 10 11 12 13 14 15 16 17 18 19 20 21 22 23
Coun
t
Turn
arou
nd Ti
me
(Min
utes
)
Hour of Day
Hourly Turnaround Times Per Segment
Order to Collect Collect to Receive Receive to Verify Target TestVol
Weekly CMP Composite Turnaround Time Report

Report Type: 82
Hemolysis and QNS Audit
Receive Date: Monday, October 2, 2017
Filter Criteria: Report Summary:Test: - All Pct of TotalPat Loc Group: 3 ED Total Hemolyzed 9 16.4%Lab ID: sjh 10 lab Total QNS - 0.0%
Total Hemolyzed and QNS 9 16.4%Overall Total 55
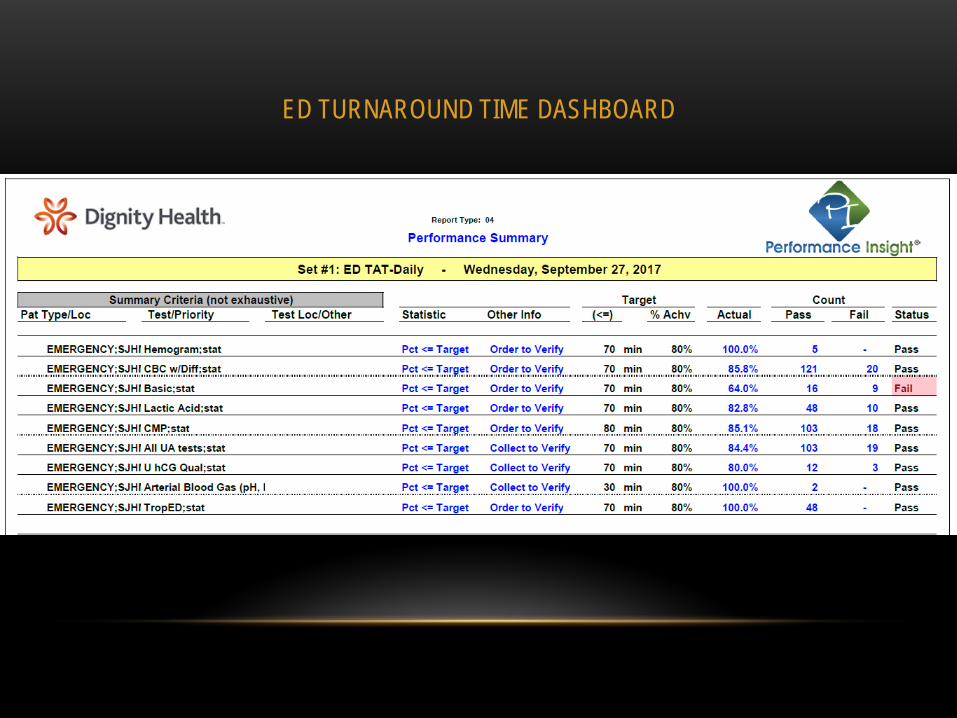
Analysis Period Day
Counting Containers
By Patient Loction By Phlebotomist
Top Hemol and QNS by Count Top Hemol and QNS by CountPat Loc Name Hemol QNS H+QNS Ttl Events Pct Ttl Phleb ID Name Hemol QNS H+QNS Ttl Events Pct TtlSJH ED 4 - 4 23 17.4% 3 - 3 3 100.0%SJH EDIP 3 - 3 28 10.7% SJHNL ##### 2 - 2 3 66.7%SJH Trauma EDIP 2 - 2 4 50.0% MHTET ##### 1 - 1 2 50.0%
- 0.0% MSIY ##### 1 - 1 2 50.0%- 0.0% SFRANKL ##### 1 - 1 2 50.0%- 0.0% PCHAVEZ ##### 1 - 1 1 100.0%- 0.0% - 0.0%
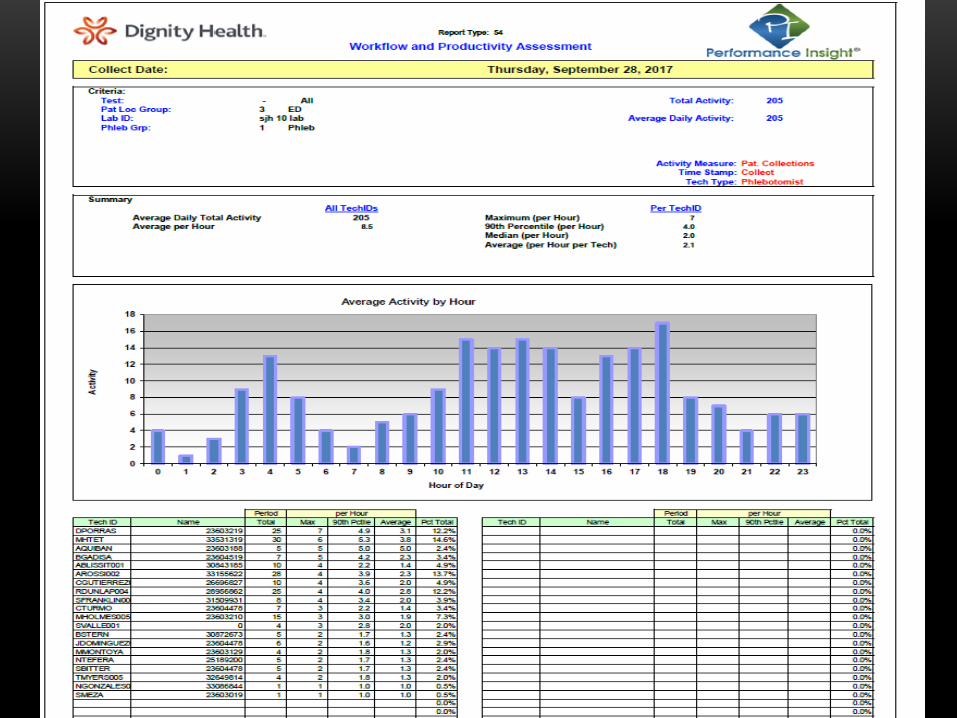
Export Data for Off-line Analysis

Report Details Baseline Period (Wed, Mar 1, 2017 - Fri, Mar 31, 2017) Current Period (Fri, Sep 1, 2017 - Mon, Sep 25, 2017) Percent Change (from Baseline to Current) Volume Absolute Change (Current - Baseline)
ReportID ReportName Average Median
90th Percentil
e
95th Percentil
e
98th Percentil
e%
Outliers Average Median
90th Percentil
e
95th Percentil
e
98th Percentil
e%
Outliers Average Median
90th Percentil
e
95th Percentil
e
98th Percentil
e%
Outliers(Tests /
Day) Average Median
90th Percentil
e
95th Percentil
e
98th Percentil
e1 Hemogram Order-Verify 48.97 44.28 83.65 103.24 133.41 18.8% 42.57 38.23 67.37 83.07 104.97 8.6% -13.1% -13.7% -19.5% -19.5% -21.3% -54.2% 13 (6.40) (6.05) (16.28) (20.17) (28.43) 2 CBC wDiff Order-Verify 59.50 53.86 93.81 112.40 133.74 26.5% 50.39 46.42 77.95 90.51 106.55 15.5% -15.3% -13.8% -16.9% -19.5% -20.3% -41.3% 120 (9.11) (7.44) (15.86) (21.89) (27.18) 3 Basic Order-Verify 67.11 61.78 104.01 122.61 143.95 36.6% 57.47 54.58 82.94 94.68 117.64 22.1% -14.4% -11.6% -20.3% -22.8% -18.3% -39.6% 32 (9.64) (7.19) (21.07) (27.93) (26.31) 5 Lactic Acid Order-Verify 63.80 59.32 97.83 116.99 137.37 33.5% 60.19 55.55 92.10 109.45 131.88 25.6% -5.7% -6.4% -5.9% -6.4% -4.0% -23.5% 34 (3.61) (3.77) (5.73) (7.54) (5.49) 8 CMP Order-Verify 73.66 68.70 108.75 124.19 143.15 32.5% 63.92 60.10 91.77 106.05 121.66 18.4% -13.2% -12.5% -15.6% -14.6% -15.0% -43.5% 100 (9.73) (8.60) (16.98) (18.14) (21.48) 9 UA Collect-Verify 55.90 49.33 93.50 118.09 148.07 23.4% 47.72 41.13 81.50 102.16 125.92 15.9% -14.6% -16.6% -12.8% -13.5% -15.0% -32.1% 108 (8.17) (8.19) (12.00) (15.93) (22.14)
10 U hCG Qual Collect-Verify 42.14 37.88 69.51 89.84 114.23 10.0% 39.23 31.44 67.13 92.49 141.11 8.1% -6.9% -17.0% -3.4% 2.9% 23.5% -18.4% 13 (2.91) (6.44) (2.38) 2.64 26.87 12 ABG Collect-Verify 10.08 7.57 18.27 20.44 30.27 2.8% 12.03 8.07 18.19 31.42 72.43 6.4% 19.4% 6.6% -0.4% 53.7% 139.2% 126.6% 2 1.95 0.50 (0.07) 10.98 42.15 80 TropED Order-Verify 42.65 39.07 66.41 77.84 95.75 8.3% 39.68 36.42 60.94 72.20 89.84 5.9% -7.0% -6.8% -8.2% -7.2% -6.2% -28.9% 45 (2.98) (2.65) (5.46) (5.64) (5.90)
Performance Comparison: March 2017 to September 2017 Turnaround Time and Percentage of Outliers

IMPROVED PERFORMANCE!
Hemogram Order-Verify CBC wDiff Order-Verify Basic Order-Verify Lactic Acid Order-Verify CMP Order-Verify UA Collect-Verify U hCG Qual Collect-Verify ABG Collect-Verify TropED Order-Verify
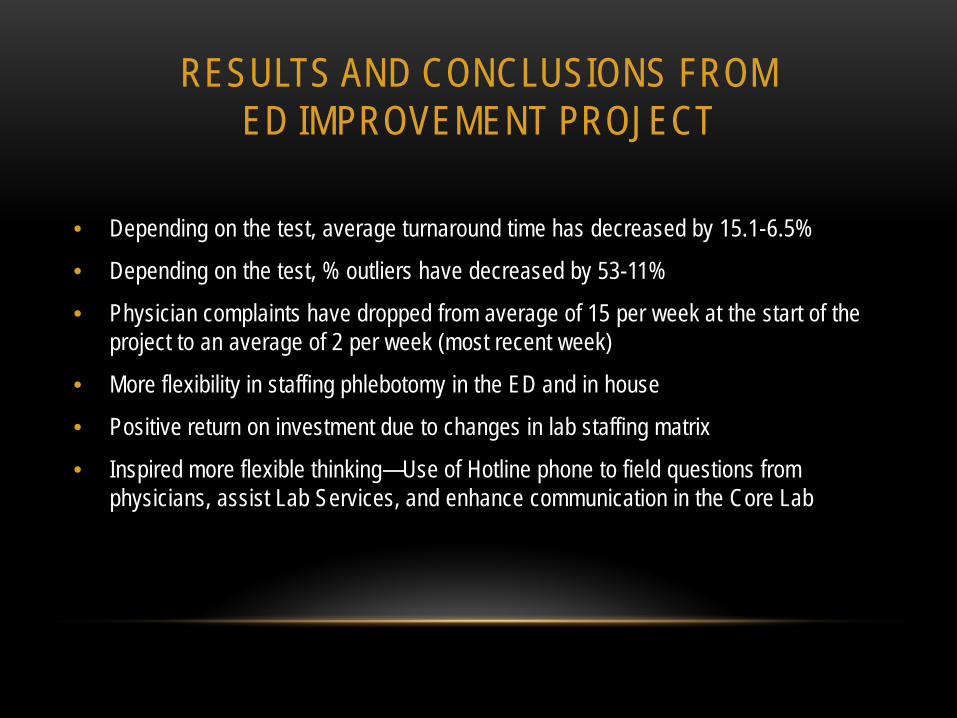
RESULTS AND CONCLUSIONS FROM ED IMPROVEMENT PROJECT
• Depending on the test, average turnaround time has decreased by 15.1-6.5%
• Depending on the test, % outliers have decreased by 53-11%
• Physician complaints have dropped from average of 15 per week at the start of the project to an average of 2 per week (most recent week)
• More flexibility in staffing phlebotomy in the ED and in house
• Positive return on investment due to changes in lab staffing matrix
• Inspired more flexible thinking—Use of Hotline phone to field questions from physicians, assist Lab Services, and enhance communication in the Core Lab
ED Troponin and Chest Pain Certification
CASE STUDIES AND SAMPLE REPORTS

ED TROPONIN CHALLENGES
• Chest pain accreditation required specific performance measures
• Challenge required generating data, analyzing that data, and compiling the data into a concise report for the Cardiac Care Committee
• Data analysis over time (trending) is required
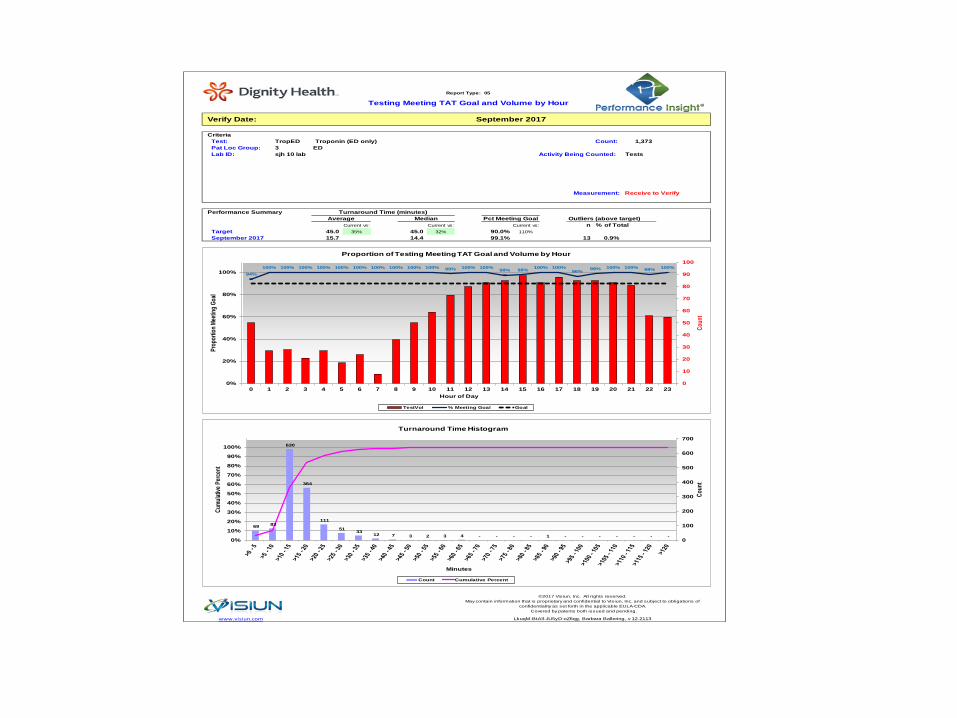
Report Type: 05
Testing Meeting TAT Goal and Volume by Hour
Verify Date: September 2017
CriteriaTest: TropED Troponin (ED only) Count: 1,373 Pat Loc Group: 3 EDLab ID: sjh 10 lab Activity Being Counted: Tests
Measurement: Receive to Verify
Performance Summary Turnaround Time (minutes)Average Median Pct Meeting Goal Outliers (above target)
Current vs: Current vs: Current vs: n % of TotalTarget 45.0 35% 45.0 32% 90.0% 110%
15.7 14.4 99.1% 13 0.9%
www.visiun.com
September 2017
©2017 Visiun, Inc. All rights reserved.May contain information that is proprietary and confidential to Visiun, Inc. and subject to obligations of
confidentiality as set forth in the applicable EULA-CDA. Covered by patents both issued and pending.
LkuqM-BtAll-JU5yD-oZ6qg, Barbara Ballering, v 12.2113
69 83
630
364
111
51 33 12 7 3 2 3 4 - - - - 1 - - - - - - -
0
100
200
300
400
500
600
700
0%
10%
20%
30%
40%
50%
60%
70%
80%
90%
100%
Coun
t
Cumu
lative
Perc
ent
Minutes
Turnaround Time Histogram
Count Cumulative Percent
94%100% 100% 100% 100% 100% 100% 100% 100% 100% 100% 99% 100% 100% 98% 98% 100% 100%
96% 99% 100% 100% 98% 100%
0
10
20
30
40
50
60
70
80
90
100
0%
20%
40%
60%
80%
100%
0 1 2 3 4 5 6 7 8 9 10 11 12 13 14 15 16 17 18 19 20 21 22 23
Coun
t
Prop
ortio
n Mee
ting G
oal
Hour of Day
Proportion of Testing Meeting TAT Goal and Volume by Hour
TestVol % Meeting Goal Goal

Report Type: 15
Trending of Turnaround Time and VolumePage 1 of 2
Report Looks Back from:
CriteriaTest: TropED Troponin (ED only) Period of Time Being Analyzed: WeeksLab ID: sjh 10 lab
Measurement: Order to Verify
Performance Summary Turnaround Time (minutes)Average Median (approx) 90% Completion (approx)
Current vs: Current vs: Current vs:Target 45.0 92% 45.0 83% 45.0 142%
41.3 37.5 63.8
www.visiun.com
Monday, October 2, 2017
Values for Entire Report
©2017 Visiun, Inc. All rights reserved.May contain information that is proprietary and confidential to Visiun, Inc. and subject to
obligations of confidentiality as set forth in the applicable EULA-CDA. Covered by patents both issued and pending.
7rjZ7-BtAll-KOdiS-X10kt, Barbara Ballering, v 12.2118
0
10
20
30
40
50
60
70
80
90
Turn
aroun
d Tim
e (mi
nutes
)
Weeks (1St Day Of Week Shown In Label)
Turnaround Time Trend
Average Median 90th Percentile Target
0
100
200
300
400
500
600
# Tes
ts Or
dered
Time
Test Volume
Test Volume 3 Period Moving Avg
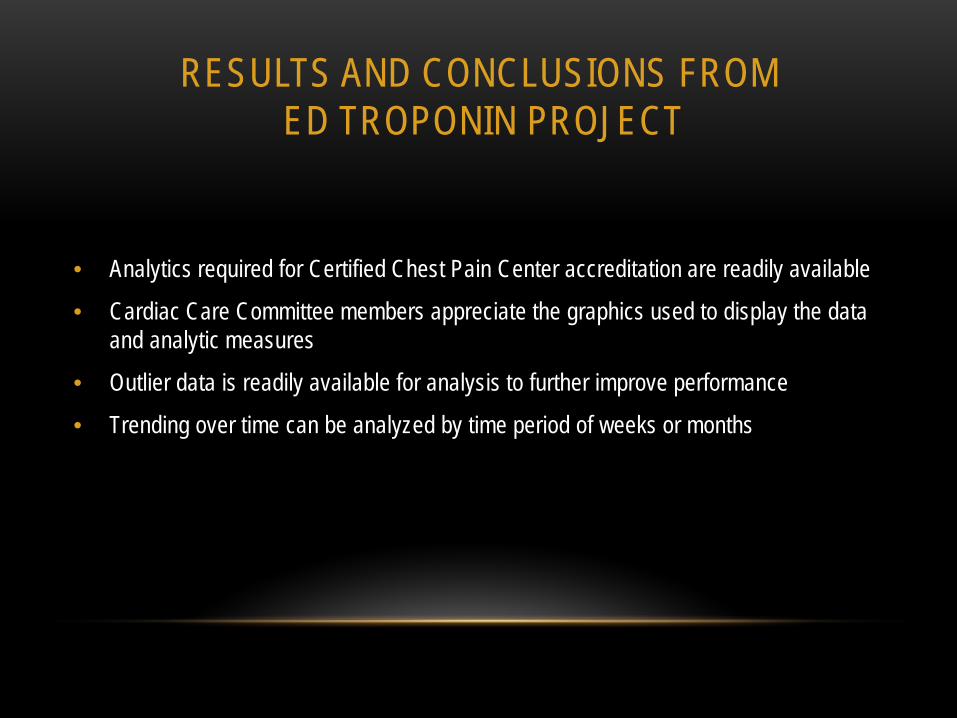
RESULTS AND CONCLUSIONS FROM ED TROPONIN PROJECT
• Analytics required for Certified Chest Pain Center accreditation are readily available
• Cardiac Care Committee members appreciate the graphics used to display the data and analytic measures
• Outlier data is readily available for analysis to further improve performance
• Trending over time can be analyzed by time period of weeks or months

WHAT WE LEARNED
• Improvements from Cerner reports:
• Ease of setting up software (once we finally got to that point)
• Flexibility to get the big picture, or to drill down to exact data needed
• Continual improvements and updates from the manufacturer
• Speed of pulling up reports
• Auto-email !!!!!!!!
• Excellent customer service
• Ongoing:
• User guide could be more user friendly
• Cerner is still useful for some data collection and reporting

WHAT WE DID RIGHT
• We chose a really good company and a really good product.
• We thoughtfully chose which modules to purchase.
• We paved the way for other Dignity Health facilities to purchase and implement Performance Insight.
• We worked closely with the Performance Insight technical staff, and relied on their expertise.

WHAT WE COULD HAVE DONE BETTER
• Worked more closely with Dignity Health IT.
• Recognized that the process would proceed slowly due to continuing Cerner Millennium implementation at the 42 Dignity Health facilities.
We’re still learning!

RETURN ON INVESTMENT
• By better planning and use of our phlebotomists, we were able to eliminate 12 Lab Services FTEs while providing a better level of service to our ED customers.
• Total savings = approximately $499,000 per year
• Simple return on investment: 467% • Must also consider additional benefits, including less frustration and lost productivity for
time spent trying to pull necessary information out of LIS

QUESTIONS?