Embed Size (px)
Citation preview

Accepted Manuscript
Using Quality Function Deployment and Analytical Hierarchy Process for Ma‐
terial Selection of Body-in-White
Abdelraoof Mayyas, Qin Shen, Ahmad Mayyas, Mahmoud abdelhamid, Dongri
Shan, Ala Qattawi, Mohammed Omar
PII: S0261-3069(11)00002-1
DOI: 10.1016/j.matdes.2011.01.001
Reference: JMAD 3509
To appear in: Materials and Design
Received Date: 4 October 2010
Accepted Date: 3 January 2011
Please cite this article as: Mayyas, A., Shen, Q., Mayyas, A., abdelhamid, M., Shan, D., Qattawi, A., Omar, M.,
Using Quality Function Deployment and Analytical Hierarchy Process for Material Selection of Body-in-White,
Materials and Design (2011), doi: 10.1016/j.matdes.2011.01.001
This is a PDF file of an unedited manuscript that has been accepted for publication. As a service to our customers
we are providing this early version of the manuscript. The manuscript will undergo copyediting, typesetting, and
review of the resulting proof before it is published in its final form. Please note that during the production process
errors may be discovered which could affect the content, and all legal disclaimers that apply to the journal pertain.

Using Quality Function Deployment and Analytical Hierarchy
Process for Material Selection of Body-in-White
Abdelraoof Mayyas1, Qin Shen
1, Ahmad Mayyas
1 , Mahmoud abdelhamid
3, Dongri
Shan1,2
, Ala Qattawi1, Mohammed Omar
1,
1 Clemson University International Center for Automotive Research – CU-ICAR, 4
Research Drive, Greenville, SC 29607, USA.
2 School of Mechanical Engineering, Shandong Institute of Light Industry, Jinan
250353, PR China.
3 Department of Mechanical Engineering, Clemson University, Clemson, SC 29634,
USA.
Abstract
Presented manuscript discusses the usage of multi-attribute decision making tools to
assist in the material selection for vehicular structures; mainly the automotive Body-in-
White (BiW) panels at the conceptual design stage using Quality Function Deployment
(QFD) and Analytical Hierarchy Process (AHP). The main advantage of using QFD and
AHP is their abilities to rank choices in the order of their effectiveness in meeting the
functional objective. AHP discriminates between competing options where interrelated
objectives need to be met; AHP is based on straightforward mathematical formulations.
QFD on the other side is a customer focused method that usually starts by collecting
customer needs and tries to integrate these needs into the product. In this study, following
classes of engineering materials are analyzed; forming grade Bake Harden-able steel
(BH), Dual Phase steel (DP), High Strength Low Alloy Steel (HSLA), Martenistic steel,
Aluminum 5xxx, 6xxx sheets, Magnesium sheets, Titanium sheets, Carbon Fiber
Clemson University International Center for Automotive Research – CU-ICAR, 4 Research Drive,
Greenville, SC 29607, United States
Phone: + 1- 864-283-7226
Fax: +1-864-283-7208
E-mail: [email protected]

Reinforced Plastic (CFRP) and High Density Polyethylene (HDPE). The presented study
showed that the different grades of steel gained the first ranks in the selection process for
almost most of the BiW panels; however other alternatives could work in trade-off with
cost and manufacturability.
Keywords: E. Mechanical; H. Selection for material properties. H. Weighting and
ranking factors
1. Introduction
New trends in vehicle light-weighting not only aim at enhancing the vehicle fuel
efficiency, but also at improving its driving performance in addition to lowering its
emissions [1]. Weight saving might be achieved through replacing current high density
materials such as Steel, in chassis and suspension, and other power-train and driveline
vehicular sub-systems with lightweight to achieve small weight savings. However,
significant improvements in vehicle efficiency in terms of the mile per gallon will require
larger reductions in the vehicle weight. To quantitatively describe the relationship
between the vehicle weight and its fuel efficiency, several correlations have been
proposed and are listed through equations (1) to (3).
(1)
(2)
(3)
Where, the MPG is the mile per gallon and the mass is the curb weight in Lbs, while the
FE is the fuel economy.
Inspecting these equations one can conclude that in average a weight reduction of 10% of
the total vehicle curb weight can only lead to about 5% improvement in the fuel
efficiency. That means that major weight reductions (>10%) are required to have any

tangible effects on the vehicle fuel consumption. Automotive designers typically target
the vehicle main structure or Body In White BIW for weight reduction activities because;
any weight savings from the vehicle interior trim affects its comfort options (e.g.
motorized seats, etc), while any weight savings from the power-train imparts the vehicle
mobility function, both of these effects hinder the vehicle marketability. Figure 1 displays
the weight distribution of a typical sedan, with the BIW weight comprises around 20-25%
of the total vehicle curb weight.
Insert Figure 1 Here
The direct replacement of steel structures with other less dense materials has been the
usual route for earlier light weight engineering efforts, especially using more Aluminum
in the BiW. However this trend is challenged by the following; (a) the complexity
associated in forming aluminum using the standard press based stamping, which limits
the minimum bending radius to panel thickness ratio hence limiting the geometries, and
design features which in turn affect the vehicle styling and limiting the use of Aluminum
to flat or semi-flat panels as in the hood. Even though some OEMs have used space frame
platforms to facilitate the use of aluminum in the form of extrusions and tubes as in the
Audi A3 platform and the Rolls Royce, still the space frame is not easily manufactured
for high volume vehicles due to the high manual work-content associated in its joining
process. (b) Aluminum is weaker than steel and its Young’s modulus is almost 1/3 that of
steel affecting its dent resistance and stiffness negatively, respectively. To provide a
quantitative example, to replace a steel panel with aluminum while conserving the a panel
torsional stiffness requires the designers to match the panel thicknesses based on
, which not only neutralizes the weight reduction achieved but also
complicates the forming process. Additionally (c) the introduction of new steel grades
with higher strengths as the Advanced High Strength Steels AHSS, which include; the
Transformation Induced Plasticity TRIP, Dual Phase DP steels, allow designers to design
steel panels with thinner thicknesses allowing for further weight savings. Lastly, (d) the
high cost of aluminum (almost 4 times that of mild steel) limits its wide use in vehicular
structures [2]. Figure 2 displays the trends in the material usage for vehicles; indicating
that the development of new steel grades have revived the use of steel for automobile

bodies. However at the same time some automotive Original Equipment Manufacturers
OEMs have started to use some integrated metrics to better evaluate the use of light
weight materials in their vehicles some of these metrics include the cost added per unit
weight saved as in $/kgsaved and the light weight engineering index L used by the BMW
group illustrated in equation (4);
(4)
Where, Ctorsional is the torsional stiffness of the BiW, and A is the vehicle size, and the
mass is the mass of the BiW.
Insert Figure 2 Here
The above mentioned facts about using aluminum in automobile bodies motivate
the development of a more quantitative material selection process and methodology for
the different vehicular structures and panels. The material selection process is recently
getting recognized as one of the major branches of the materials science and engineering
discipline. It starts by considering all materials and ends by selecting the most appropriate
one based on the application functionality and the design constraints. Ashby’s work in
ranking and material spaces is considered pioneering in the field [3]. This study presents
the use of Decision Making (DM) tools to address the vehicle body design, which have
conflicting objectives and multi-attribute constraints. The integration of the material
selection principles with decision making methods is a growing trend [4-5], which have
in resulted in the Environmental Priorities System (EPS), the Sustainability Decision
Support System (SDSS), in addition to material selection using fuzzy logic [6-7].
This study focuses on the use of two specific decision making tools the Quality Function
Deployment (QFD), and the Analytical Hierarchy Process (AHP). The ultimate goal of
using QFD is to help designers in developing new or existing product or service by
incorporating customer needs, the Voice of the Customer (VOC), into engineering
characteristics for a product or a service. By doing so, the planners can then prioritize
each product or service attributes to set the levels needed to achieve such characteristics.

However, QFD can be considered a complimentary method for determining how and
where priorities are to be assigned in the product development, where the intent is to
employ objective procedures in increasing the detailed design throughout the
development of the product [8]. Hence the QFD presents a tool that can be used in all
engineering stages and can be applied mainly at the conceptual design stage.
A limited number of papers in the open literature discussed the use of QFD to improve
and optimize the vehicle body design; among these limited manuscripts, [9] discussed the
implementation of a QFD based procedure to quantify and identify improvements in the
vehicle door design. Other publication by Banu et al. [10] utilized QFD to the design of
car bodywork to determine the priorities and their impacts on the customer satisfaction.
Among the other decision making methods, the AHP has a distinct advantage of
combining both qualitative and quantitative approaches [11]. In the qualitative sense, it
decomposes an unstructured problem into a systematic decision hierarchy. It then uses a
quantitative ranking using numerical ranks and weights in which a pair-wise comparison
is employed to determine the local and the global priority weights and finally the overall
ranking of proposed alternatives. Byun in [12] used the AHP methodology to select the
car model to purchase, where the selection criteria was basically focused on the customer
needs more than on design and reliability. Hambali et al. [13] proposed a concept
selection model called Concurrent Design Concept Selection and Materials Selection
(CDCSMS) to assist designers in selecting the most appropriate design concepts and
materials for automotive composite components at the conceptual design stage using the
AHP. Eight design concepts of automotive composite bumper beams were considered in
that study and the most appropriate one was ultimately identified using the AHP process.
Bovornsethanant and Wongwises in [14] used AHP and Vector Projection Approach
(VPA) to determine the useful service life of lubricants; the VPA is a simple numerical
approach based on trending all the model variables, the AHP was also then used to
analyze the variables and produce the final service life prediction.
In this study, both QFD and AHP are used as decision supporting methods to
direct the design selection towards a quantitative material ranking for each of the vehicle

panels while satisfying the performance functionalities and the manufacturability
requirements; taken into consideration the main goal of reducing the total vehicle weight.
2. Methodology
2.1. Quality function deployment (QFD)
In proposed material selection process, the objective function for each panel is
used to rank the different competitive materials to optimize the overall design. The study
employs a conventional uni-body, stamped BiW from a typical family vehicle. The major
panels considered in the study are shown in Table 1.
Insert Table 1 Here
First a set of constraints are used in the optimization method, based on the
following subsets:
Material constraints (e.g. modulus of elasticity, weight, strength, etc.)
Technical constraints (e.g. formability, joinability, energy used, etc.).
Correlations among the constraints, i.e. how the increase in one constraints will
affect the other constraints (e.g. if we increase the stiffness then this will affect
the weight, also any increase in weight will affect the MPG and so on and so
forth). This inter-relationship matrix between the engineering metrics provides a
complete view of how an increase in score of one of the metric will affect the
other. Basically, this needs a lot of work to classify these relations. In order to
get this set of constraints, we can either use a relative score between 1 and 10 or
just use the numerical equations (e.g. dent energy vs. thickness, strength vs.
stiffness, etc.).
One of the merits of QFD over other decision making systems is that QFD provide
flexible space for the designer to correlate both customer needs and engineering metrics
through assigning scores and weights for each, and at the same time it defines the
direction of improvement for each metric, in other words there are some metrics that are
directly proportional while others are inversely proportional.

However, for the QFD house to be established the customer needs and engineering
metrics should be first identified and filled in. Following customer needs are included in
the QFD: Vehicle Performance, Economics, Safety, Fuel Economy (MPG), Durability,
Appearance, Environmental Friendliness, Noise, Vibration and Harshness (NVH) and
Maintenance. Whereas following engineering metrics are considered: Density, cost,
young’s modulus, tensile strength, total elongation, n & r values, formability, joinability,
paintability, recyclability, and corrosion resistance [3, 15].
Furthermore, scores have to be assigned for each customer need, for instance a score of 3
will be assigned for dent resistance as a high valued customer need for those panels that
are prone to dent such as the front and rear fenders, quarter panels, and door outers.
Meanwhile lower dent resistance scores are assigned to the A, B and C pillars due to the
fact that they are not prone to dent in the same manner like the outer panels,
correspondingly, the rest f the matrix should be completed. Table 2 illustrates the
customer needs and the associated scores for BiW panels.
Insert Table 2 Here
2.1.1. QFD House Construction
For each BIW component, an independent QFD house was constructed and properly
scored according to previously mentioned methodology. However, QFD matrices are
widely available in the web; hence QFD template is pulled out and modified to make sure
it fulfills the design requirements in terms of relating customer needs to the other
engineering metrics where QFD house consists of the following matrix elements as
shown in Fig. 3:
1. Costumer needs specified by “what” window in the figure.
2. Engineering requirements metrics specified by “How” window in the figure.
3. Weights for costumer needs where scores (1 to 10) were assigned for each
costumer need as shown in Fig. 3, where score of 10 represents the most

important where the lower scores reflects less importance (i.e. score of 1 is the
least important need).
4. Costumer needs versus engineering metric relationship scores, where scores (1 to
3) were used to define the relationship between the customer needs and the
engineering metrics according to the following scheme: 1 weak, 2 for medium
and 3 for strong relationship specified by “relationship matrix” in the figure.
5. Interrelationship between engineering metrics, scores (1 to 3) define the
interrelationship between the engineering metrics where score of 1 represents an
inversely proportional relationship, 2 when it is not specified or there is no
relationship and 3 to represent the directly proportional relationship) specified by
correlation matrix in the figure.
6. Direction of improvement to indicate whether the score defines the relationship
between customer needs and engineering metrics mentioned in part tow is being
improved as the score increases or decreases.
7. The following outcomes were turned out at the bottom of the QFD house: raw
score, relative weight, rank, technical requirement targets, technical rank.
Specified as “Targets” at the bottom of the figure.
Insert Figure 3 Here
2.1.2. QFD Decision algorithm
The inner workings of the QFD are based on computing the scores for each of the
customer demands then normalize it based on the technical requirements and its inter-
relationships. Initially, the raw scores are calculated as the sum of the product of the
customer needs weights by the scores assigned for every engineering metric in the same
raw, see Fig. 4.The next step is to normalize the raw scores by dividing every row score
by the maximum score in that raw, then relative weights are calculated by dividing each
normalized score by the summation of all scores in the same raw. Then the rank is
calculated by prioritizing the previously calculated raw scores, however, this rank only
reflects the importance of each engineering metric. Nonetheless, in order to relate the

customer needs to the engineering metrics, the QFD returns the Upper Specification
Limit (USL) which is the technical requirement; the technical requirements define the
engineering metrics interrelationship. USL is calculated as the sum product of the
engineering metrics interrelation scores in the same raw.
Insert Figure 4 Here
Though, the previous rank prioritizes the engineering metric with respect to the values of
its scores and the scores of customer needs, the advantage of the QFD is apparent when
computing the technical rank through relating the interrelation scores and the engineering
metrics scores, hence, targeted technical requirements are evaluated by product
multiplication of the normalized raw score with its associated technical requirements
(USL).
Then the technical requirement targets are prioritized to turn out what is called the
technical rank for every engineering metric, the technical rank prioritizes all engineering
metrics according to customer point of view with a compromise of the technical
requirements and the interrelationship among all of these metrics, however, it is
important to know that this technical rank prioritizes the engineering metrics in ascending
order. Of course ;( i.e. the higher the score the more important the engineering metric).
However; the returned technical rank guides the designer to the relative importance for
all engineering metrics, in this paper the top three metrics are considered in the analysis
noting that this decision does not conflict with the fact that for each part there is a
different functionality encircled by certain material properties, hence the relative scores
are assigned for the engineering metrics based on its relative importance depending on
the functional requirements of the part under consideration.
2.2. Analytic Hierarchy Process (AHP)
The Analytic Hierarchy Process (AHP) is a structured technique developed by
Saaty in 1970s based on the mathematics and the psychology for dealing with complex
decisions [16]. Nowadays, AHP and its refinements are widely used around the world in
many decision making fields (government, industry, education, healthcare, etc.).

AHP provides a comprehensive framework for structuring a system of objectives,
criteria and alternatives. A decision problem is firstly set then a comprehensive data
collection process is performed before constructing the AHP hierarchy. The hierarch is
used establish a relation between objective function and criteria in the first hierarch level
and between criteria and alternatives in the second hierarchy level, however other
hierarchy levels could be developed depending on the presence of subcriteria and their
relations to major criteria on the upper level.. The basic idea of AHP is to decompose the
decision problem into a hierarchy of more easily comprehended sub-problems, each of
which can be analyzed independently. Once the hierarchy is built, the DM evaluates the
various elements of the hierarchy by comparing them to one another using pair-wise
comparison methods [13]. In making the comparisons, the DM can use both objective
information about the elements as well as the subjective opinions about the elements’
relative meaning and importance. The AHP converts these evaluations to numerical
values that are processed and compared over the entire range of the problem. A numerical
weight or priority is derived for each element of the hierarchy, allowing diverse and often
incommensurable elements to be compared to one another in a rational and consistent
way. This is the main advantage of AHP with respect to other decision making
techniques. At its final step, numerical priorities are calculated for each of the decision
alternatives. These numbers represent the alternatives’ relative ability to achieve the
decision goal. The main steps in deploying AHP method can be summarized in [13, 17-
18] which start with (a) Collecting the required data to construct the model. Both
numerical data and attributes can be used in this phase. However, attributes should be
translated into numerical values based on a proper scaling or weighting method.
(b) Model the problem as a hierarchy containing the decision goal as an upper
level at hierarch, the criteria for evaluating the alternatives as a second hierarchy level
and the alternatives or competitors in the third hierarchy level. However, a more complex
hierarchy can be constructed by adding more hierarchy levels between criteria and
subcriteria. Sometimes subcriteria hierarch level may contain dependent elements that
appear as subcriteria in two or more main criteria (e.g. density is a subcriteria of fuel
economy and design parameters). This adds some complexity to the hierarchy, but this

will not affect the overall generalization of the AHP as it deals with each block alone (i.e.
it considered the main criteria and their corresponding subcriteria as independent blocks).
(c) Establish a pair-wise comparison between two elements at a time. Table 3
shows the scaling values that used by Saaty which is based on a scale between 1-10. This
will result in a series of judgments that gives a prioritizing of all elements in lower levels
of the hierarchy.
(d) Check the consistency of the judgments (weights) we assigned to all elements
in the AHP. If the matrices in the AHP are inconsistent, the expert should revise the
judgments and assign new weights by revising pairwise comparison. Consistency index
(C.I.) can be calculated using the following equation [13]:
1... max
n
nIC
(5)
Where λmax is the largest eigenvalue and n is the number of attributes in the
square matrix.
However, the conclusion about the consistency of the matrix can be drawn from
the consistency ratio (CR). CR is the ratio between C.I. and the random consistency index
(RI), where RI was obtained from a large number of simulation runs and varies
depending upon the order of matrix and has been tabulated in Table 4 [13].
(6)
(e) Synthesize results to yield a set of overall priorities for the hierarchy; and
finally (f) Compute/predict the final decisions based on the results of this process and
select the alternative with the highest priority.
Insert Table 3 Here
Insert Table 4 Here
3. Results and Discussion
In any material selection process, the objective function will try to select the
material that fits the panel or structure functionalities taken into consideration the
manufacturability into consideration. However, most automotive OEMs use steel in their

vehicle’s BiW. Typically a conventional stamped steel sheet is widely used for
automotive BiW applications in a typical family vehicle [19].The arising question now,
what is the possibility of replacing steel while keeping the functional requirements? Some
panels are not subjected to sever environments rather they are subjected to heavy loads
(e.g. trunk lid and outer door panel) [9, 19].
The methodology used in the present study depends on the selection of the best
material for a given panel of BiW at the conceptual design stage, by utilizing both the
QFD and the AHP as decision-aid tools that combine both simplicity and ability to rank
choices in the order of their effectiveness in meeting the objective.
Ten classes of engineering materials have been considered in this study, namely:
forming grade, Bake Hardenable steel (BH), Dual Phase steel (DP), High Strength Low
Alloy steel (HSLA), Martenistic steel, Aluminum 5xxx and Aluminum 6xxx sheets,
Magnesium sheets, Titanium sheets, Carbon Fiber Reinforced Plastic (CFRP) and High
Density Polyethylene (HDPE). Material properties are shown in Table 5 while Table 6
summarizing the major functionality and selection criteria for realistic selection of BiW
materials.
Insert Table 5 Here
Insert Table 6 Here
3.1. Best material selection using QFD
Subsequent to determination of the technical rank for all engineering metric without
scarifying the customer voice, it is more effectual to prioritize the candidate materials in
the material space for each BiW component. Recalling that for each BiW component
there is a need to specify the most and least engineering metric, so for each part, the
results of corresponding QFD are pulled out and the values of the properties for every
candidate material in the material space is recorded, Table 7 and Table 8 illustrate some
of material candidates in the material space with its corresponding properties and the
normalized values of its properties, respectively.

Insert Table 7 Here
Insert Table 8 Here
Then normalized material properties are multiplied by its relative technical score, the sum
products of these multiplications are scores that prioritize all material candidates in the
material space for each part. As a final point, the QFD produced the best optimized
material choice for each BiW part independently and based on the customer demand and
other engineering metrics. Table 9 illustrates sample calculation for some of such scores
for some of the material candidates (the higher the score the better).
Insert Table 9 Here
Consequently, the material selection table is constructed based on the returned scores
from the QFD house for each BiW component as displayed in Table 10, the first three
choices are extracted from the QFD decision, the reason for that, the scoring assignment
for both engineering metrics and customer weights may be biased towards one more than
the other, which in turn will affect the QFD decision, however, one can manipulate these
weights and scores to accommodate the customer demands and/or engineering
requirements as will be discussed in the next section.
Relatively; the masses for parts of the new BiW are calculated in addition to the cost,
weight, MPG, Added cost per Weight saved $/kgsaved, break even mileage, % change in
demand and light weight index as it will be discussed in the next section.
The previous calculated results are contrasted with those of the base design; it is
important to know that the base design is made out of cold rolled steel, and the minimum
gage thickness added one more constraint to the process, i.e. if the new calculated
thickness is less than the available gage thickness available in the market (from steel
mills), then the next available gage thickness will be considered in the calculations for the
weight and other engineering indices.
Insert Table 10 Here

3.2. Best material selection using AHP
Nowadays, the majority of manufacturers are considering the selection criteria beyond
the range of physical and mechanical properties on which old selection method is based
[18]. However, the legislative requirements concerning, for instance, emissions and end-
of-life (ELV) disposal are now influencing the initial choice of material, and increasingly
the process chain or successive stages [15]. Manufacturers must consider all mechanical,
manufacturing and environment aspects to ensure that minimum disruption is incurred
which may have consequences in productivity and quality. By doing so, all materials are
considered candidate for a given design if they meet the design requirements in the
conceptual design stage. After that screening takes place in the embodiment design stage
to remove materials that do not perform well from the selection list.
AHP can be used as a decision making tool in the conceptual and embodiment design
stages [13]. The most efficient design attributes for different BiW panels have been
determined based on the AHP results; because the selection decision is a multi-attribute
problem, AHP is able to rank both the decision criteria and candidate materials as it will
be discussed later. The proposed AHP methodology used is shown in Fig. 5. The first
step in AHP is to identify the problem and determine its goal. The goal is “selecting the
best material for a given BiW panel”. All major panels are considered in this paper (Table
1). The second hierarchy level contains the main selection criteria, which are developed
by expert engineering team. Both the goal and selection criteria should be clearly stated
and decision makers have to identify the factors or subcriteria affecting the selection
process. The last hierarchy level consists of the candidate materials. Taking the roof as an
example, we constructed the complete hierarchy layout as shown in Fig. 6. Expert Choice
11.5 software is used to construct and evaluate the hierarchy shown in Fig. 6. The most
critical and time consuming task is the pair-wise comparison, which begins by comparing
the relative importance of the two selected items at a time and it ends with a complete
comparison matrix, however, this matrix must be consistent to be used in the next steps.
Figure 7 shows all of the pair-wise comparison values assigned to the selection criteria of
roof material. This relative importance is then translated into numerical values and is
incorporated in the AHP.
Insert Figure 5 Here
Insert Figure 6 Here
Insert Figure 7 Here
The characteristics of various candidate materials are shown in Tables 5-6. The judgment
values or ratings (Figure 7) are based on the authors’ experience, experts opinion and
materials handbooks. The priority vectors and consistency test for the main criteria with
respect to the goal are shown in Figure 8. Taking the roof as an example, it can be shown
that pair-wise comparison shows that dent resistance is the most important selection
criteria with priority vector (p) of 0.217, followed by NVH with priority vector of 0.179.
Other important selection criteria for roof include fuel economy (p=0.139), cost
(p=0.123), bending stiffness (p=0.094), durability (p=0.069), cost (p=0.077), and
torsional stiffness (p=0.062). However, other selection criteria have lower relative
importance with (p≤0.050). This does not mean that factors are not considered in the
selection, but they had low contribution levels in the roof selection attributes. The overall
inconsistency was 0.05≤0.10, which means acceptable level of inconsistency.
Insert Figure 8 Here
Now, investigating the hierarchy at a deeper level, i.e. assigning values for subcriteria
with respect to the main selection criteria; this process greatly impacts the overall results.
For example, the ease of manufacturing has four subcriteria namely: yield strength,
ultimate tensile strength, modulus of elasticity and impact strength. The authors assigned
these criteria the same weights with respect to the main criteria (mechanical performance)
as all of them have the same importance level in the conceptual and embodiment design
stages. However, HDPE gets the highest rating value in terms of ductility, but it has the
lowest values of modulus of elasticity, yield strength and ultimate tensile strength when
compared to other metals.
The judgments for all levels are acceptable as CR was always kept less than 0.1.
The ranking of the material alternatives for roof is shown in Figure 9. It shows that the
CFRP is the best candidate with a weight of 0.141 (14.1%) that satisfies the design

requirements for roof material. The second choice is Ti with a weight of 0.134 (13.4%),
and the third choice is the Martensitic steel with a weight of only 0.124 (12.4%) as it has
three main advantages: it has low relative cost, it is relatively easy to manufacture and it
has good NVH properties. The overall inconsistency was 0.04≤0.10, which is within the
acceptable levels of inconsistency.
Now, the following question may arise in this situation, why CFRP achieve a
higher priority vector compared to Ti and steels? As mentioned before the following
main selection criteria (dent resistance, NVH properties, fuel economy and bending
stiffness) shifted the priority vector of CFRP and Ti to upper levels. On the other hand,
HDPE is ranked sixth as polymers in general tend to have a greater rate of thermal
expansion than steel, it is possible to have visual quality problems in terms of buckling,
warping or uneven panel gaps. This expansion must be incorporated at the design stage –
by appropriate design of the fixing method. Also, HDPE would not perform well in terms
of durability as it becomes weak when exposed to Ultra Violet UV light [19].
Insert Figure 9 Here
Similarly, all BiW panels have been subjected to the same selection process by keeping
all matrices fixed except the ratings of the main criteria with respect to the goal. For
example, in fender selection process we assigned more weights to dent resistance and less
weight to temperature performance (Fig. 8). Table 11 summarizes the best three
candidate materials for different BiW panels obtained from AHP. Again, different grades
of steel remain the best choice for most applications, but other candidates could work.
Even though the new trends in lightweight design suggest using Aluminum,
Magnesium and CFRP, the selection of these materials should take into consideration
how to optimize the material design with respect to the processing chain in a current
automotive assembly plant. Furthermore, most manufacturers are maintaining a
conservative steel grade policy, requiring only minimal changes in the processes.
Actually, the use of predominantly Aluminum structures is only evident by one or two of
the more adventurous companies who can absorb the extra supply and manufacturing
costs [19]. Thus, for the main BiW structure the increasing use of high strength steel will

continue to be the case and the general trend in the industry. Additionally weight savings
of 10–15% can still be achieved from certain parts via thickness reduction [19].
Insert Table 11 Here
3.3. Comparison between QFD and AHP results
The comparison between QFD and AHP results shows that both tools work well, but the
AHP has the ability to adjust its weights if any inconsistency is found. However, such
inconsistency index could be used in QFD, even though no established role of this
inconsistency index is present in the literature. Moreover, AHP uses the pair-wise
comparison between all of the selection criteria and candidate materials among
themselves and among each other. On the other hand, the QFD has the ability to translate
customer needs into the final product through the technical ranks [10-11]. The ranking
results from both tools show that the new steel grades are the best choice for replacing the
current BiW mild steel bodies. Some deviations in the rank are found as in the material
rank, however the main difference is in the rank of the second and third choice. This
means that as many candidate materials considered in the selection process, slight change
in rank would arise due to weights assigned by different persons. Another issue in using
QFD is that no typical scaling has been established so the scaling can be subjective. This
subjectivity can limit the discriminating ability of the QFD; for instance one might use a
scale from 1-3 and another from 1-5. This variation can be avoided by using a wide range
scale (e.g. 1-10 sacle as that one used in AHP). The bias arises when dealing with such
tools can be avoided by establishing a customer-oriented questionnaire and by
incorporating a team that has members from engineering, marketing, research and
development departments in the firm.
4. Conclusion
The proposed model for exploiting decision making systems in the design process is an
attractive procedure which aids the designers to determine the best alternatives material
for the BiW in the early design stages. QFD was found to be a superior tool to decide on
material selection for automotive body panel replacement for light weight BIW without

scarifying the necessities of other customer needs as well as engineering requirements.
As a comprehensive tool QFD was used in order to optimize the BIW designs based on a
comprehensive methodology. However, AHP is a decision-making system which
provides systematic selection method based on the selection criteria and subcriteria; also
it gives numerical priority vectors of the candidates. The AHP analysis reveals that steel
is still the best choice for BiW among the other candidates. However, other candidates
might work in some cases, but in trade off cost or ease of manufacturing.
References
1. Fuchs E, Field F, Roth R, Kirchain R. Strategic Materials Selection In The
Automobile Body: Economic Opportunities for Polymer Composite
DesignComposites Science and Technology 2008, 68: 1989-2002.
2. Roth R, Clark J, Kelkar A. Automobile bodies: Can aluminum be an economical
alternative to steel? Journal of the Minerals, Metals and Materials Society 53:
28-32.
3. Ashby M. Materials Selection in Mechanical Design, Third Edition Butterworth-
Heinemann, p. 79-173.
4. Rao RV, Davim JP. A decision-making framework model for material selection using
a combined multiple attribute decision-making method. The International Journal of
Advanced Manufacturing Technology 2008, 35: 751-760.
5. Jee D-H, Kang K-J. A method for optimal material selection aided with decision
making theory. Materials & Design 2000, 22: 199-206.
6. Rao RV. A decision making methodology for material selection using an improved
compromise ranking method. Materials and Design 2008, 29: 1949–1954.
7. Pearce AR, Hastak M, Vanegas JA. A Decision Support System for Construction
Materials Selection using Sustainability as a Criterion. Available online at:
http://www.fec.unicamp.br/arqs/20090520034957-T6-
decision%20suport%20system%20.pdf. Last accessed 12/03/2010.
8. Chen CC, Yeh TM, Yang CC. Performance measurement for new product
development: a model based on total costs. International Journal of Production
Research 2006, 44: 4631–4648
9. Miller K, Brand C, Heathcote N, Rutter B. Quality function deployment and its
application to automotive door design. Proceedings of the Institution of Mechanical
Engineers, Part D: Journal of Automobile Engineering
10. Banu M, Naidim O, Paunoiu V, Maier C, Polanco RSM, Nieto JGA. QFD
Application in an Automotive Case Study., Technologies in Mechanical Engineering
ISSN 1221-4566. 2006.
11. Chen SC, Yang CC, Lin WT, Yeh TM, Lin YS. Construction of key model for
knowledge management system using AHP-QFD for semiconductor industry in
Taiwan. Journal of Manufacturing Technology Management 2007, 18: 576-598.
12. Byun D-H. The AHP approach for selecting an automobile purchase model.
Information & Management 2001, 38: 289-297.
13. Hambali A, Sapuan SM, Ismail N, Nukman Y. Application of analytical hierarchy
process in the design concept selection of automotive composite bumper beam during
the conceptual design stage. Scientific Research and Essay 2009, 4: 198-211.
14. Bovornsethanant S, Wongwises S. Assessment of Useful Life of Lubricants Using
Analytical Hierarchy Process (AHP) and Vector Projection Approach (VPA).
American J. of Engineering and Applied Sciences 2010, 3: 470-475.
15. Das S, The Life-Cycle Impacts of Aluminum Body-in-White Automotive Material,
Journal of the Minerals 2000, 52: 41-44.
16. Saaty, T. How to make a decision: The analytic hierarchy process. European Journal
of Operational Research 1990, 48(1): 9-26.
17. Bayazit O. Use of AHP in decision-making for flexible manufacturing systems.
Journal of Manufacturing Technology Management 2005, 16: 808-819.
18. Al-Harbi K. Application of the AHP in project management. International Journal of
Project Management 2001,19: 19-27.
19. Davies G, Materials for Automobile Bodies Book, Butterworth-Heinemann, 1st
edition. 2004, page 27:150.

Tables
Table 1. BiW major panels and their main design functions
No. Panel Name Main design functions
1 Roof Dent Resistance,NVH, Durability
2 Hood (inner) Bending Stiffness, NVH, Ease of manufacturing
3 Hood (outer) Dent Resistance, NVH
4 Trunk (inner) Bending Stiffness, NVH, Ease of manufacturing
5 Trunk (outer) Dent Resistance, NVH
6 Trunk Pan Bending Stiffness, NVH, Durability
7 Engine Cradle Crashworthiness, Temperature Performance, NVH, Durability
8 Strut Towers Bending Stiffness, NVH, Durability
9 Splash Wall Torsional Stiffness, Temperature Performance, NVH, Durability
10 Quarter Panel Dent Resistance, NVH
11 Front Fender Dent Resistance, NVH
12 Door (inner) Bending Stiffness, NVH, Ease of manufacturing
13 Door (outer) Dent Resistance, NVH
14 Wheel House Bending Stiffness, NVH, Durability
15 A, B Pillars Bending Stiffness, NVH, Ease of manufacturing, Durability
16 Floor pan Bending Stiffness, NVH, Durability

Table 2: Associated score of customer needs for BiW panels.
Cu
sto
mer
Nee
ds
Ea
se o
f
Ma
nu
fact
uri
ng
En
vir
on
men
tal
Fri
end
lin
ess
Du
rab
ilit
y
Co
st
Tem
per
atu
re
Per
form
an
ce
Fu
el E
con
om
y
NV
H
To
rsio
na
l S
tiff
nes
s
Den
t R
esis
tan
ce
Ben
din
g S
tiff
nes
s
Cra
shw
ort
hin
ess
Roof 1 2 3 2 1 2 3 1 3 1 2
Hood (inner) 3 2 2 2 2 2 3 1 1 3 1
Hood (outer) 1 2 2 2 1 2 3 1 3 1 1
Trunk (inner) 3 2 2 2 1 2 3 1 1 3 1
Trunk (outer) 1 2 2 2 1 2 3 1 3 1 1
Trunk Pan 2 2 3 2 2 2 3 1 1 3 1
Engine
Cradle 2 2 3 2 3 2 3 1 1 1 3
Strut Towers 2 2 3 2 1 2 3 1 1 3 1
Splash Wall 2 2 3 2 3 2 3 3 1 1 1
Quarter Panel 1 2 2 2 1 2 3 2 3 1 1
Front Fender 1 2 2 2 1 2 3 1 3 1 1
Door (inner) 3 2 2 2 1 2 3 1 1 3 2
Door (outer) 1 2 2 2 1 2 3 1 3 1 2
Wheel House 2 2 3 2 1 2 3 1 1 3 1
A B Pillars 3 2 3 2 1 2 3 1 1 3 3
Floor pan 2 2 3 2 2 2 3 1 1 3 1

Table 3: Saaty rating scale for pairwise comparison [12]
Intensity of
importance
Definition Explanation
1 Equal importance Two factors contribute equally to the objective
3 Somewhat more
important
Experience and judgment slightly favor one over
the other.
5 Much more
important
Experience and judgment strongly favor one over
the other.
7 Very much more
important
Experience and judgment very strongly favor one
over the other. Its importance is demonstrated in
practice
9 Absolutely more
important.
The evidence favoring one over the other is of the
highest possible validity.
2,4,6,8 Intermediate
values
When compromise is needed
Table 4: Random consistency index [17]
n 1 2 3 4 5 6 7 8
R.I. 0 0 0.52 0.89 1.11 1.25 1.35 1.4

Table 5: Main criteria and ratings for realistic selection of automotive body materials
[18].
Material
Design parameters Ease of manufacturing
Environmental
friendliness Cost
YS
(MPa)
UTS
(MPa)
A80
min%
E
(GPa)
Density
(g/cm3) Forming Joining Painting
CO2
emission Disposal
(forming
steel =1)
Forming
grade steel
EN 10130
DCO4+Z 140 min 270 min 40 210 7.87 8 9 9 7 9 1
HSS EN
10292
H300YD+Z 300 min 400 min 26 210 7.87 6 8 9 8 8.5 1.1
UHSS-
Martensitic
1050—
1250
1350—
1550 5 210 7.87 4 7 9 8 8.5 1.5
Aluminum
5xxx 110 240 23 69 2.69 6 5 8 9 9 4
Aluminum
6xxx 120 250 24 69 2.69 6 5 8 9 9 5
Magnesium
sheets 160 240 7 45 1.75 4 4 7 9.5 6 4
Titanium
sheet 880 924 5 110 4.5 6 5 7 9 6 60
GRP 950
400—
1800 <2.0 40 1.95 8 7 8 8 5 8
Carbon
fiber
composite 1100
1200—
2250 <2.0
120—
250
1.60—
1.90 8 7 8 9 5 50.0+

Table 6: Decision criteria used in AHP.
Criteria Subcriteria Definition
Dent resistance
Yield strength
(YS), panel
thickness and panel
stiffness.
It is important to avoid panel damage in-plant and minimize
dents and dings on external parts in-service. Poor panel quality
in used cars will generally depress resale values and possibly
influence the decision to purchase a particular brand.
Ease of
manufacturing
Forming
Joining
Painting
Optimize design, layout, and processing for the BiW panel to
reduce variability and improve manufacturing parameters with
the aim of increasing production rate and good quality of the
end products. The main manufacturing processes for BiW are
classified in three groups forming, joining, and painting. The
design team should be aware of all of these manufacturing
process when the select the material.
Noise, vibration,
harshness (NVH)
The main measure of NVH is the static and dynamic material
stiffness. Static and dynamic stiffness are the measures of the
ability of a material to withstand elastic deflections under static
loading conditions and low-frequency vibrations under
dynamic loading conditions.
Fuel economy Density The direct performance measure of this selection criterion is
density of the chosen material. By doing so, magnesium and
CFRP gain the highest rank while steel gets the lowest rank.
Cost Material cost
Manufacturing cost
The designers always look to cost as a major constraints in
their selections, however, materials selection, design selection,
and manufacturing process selection are important and need to
be selected accordingly. In this study, design selection and its
associated cost is beyond our goal is it includes many selection
parameters.
Temperature
performance
Not all materials would perform well at high temperature (e.g.
plastic and CFRP), hence it is important to avoid the selection
of these materials for high temperature applications like in
splash wall. Also temperature performance reflects the
performance of the candidate material in terms of thermal
distortion and thermal conductivity.
Crashworthiness The crashworthiness of the BiW structure is measured in terms

of its ability to maintain a survivable volume for the
passengers and minimization of the loads transmitted to the
passenger compartment during potentially accident scenarios.
Sometimes, impact toughness is used as a direct measure of
this criterion.
Durability Fatigue strength
Corrosion
resistance
Wear resistance
Fatigue strength: a measure of the ability of a material to
withstand high-cycle alternating loading without failing.
Corrosion resistance: a measure of the ability of a material
to withstand the exposure to different chemical substances
without suffering property degradation or failure.
Wear resistance: a measure of the ability of the material to
resist scratch or material removal upon movement against
harder materials
Bending stiffness The resistance to bending is called the bending stiffness, per
unit width, the bending stiffness depends on the modulus of
elasticity E and thickness t of the panel
Torsional stiffness The resistance of the panel to twisting, the torsional stiffness
depends on the modulus of elasticity E, area A and the length L
of the panel.

Table 7: Values of material candidates properties in the material space.
Material
Properties
Mea
sure
men
t U
nit
Steel-BH Steel
-DP
Steel-
HSLA
Steel-
Martensite
Al-
5xxx
Al-
6xxx Mg Ti GFRP HDPE
Density g/cc 7.87 7.87 7.87 7.87 2.7 2.7 1.75 4.5 1.9 1.59
Price $/kg 0.78 0.99 0.82 1.1 3 3.85 3 46 6.24 40
Young's Modulus Gpa 210 210 210 210 70 70 45 100 25 142
Tensile Strength Mpa 320 600 524 1200 270 210 240 924 300 1730
Total Elongation % 39 34 30 7 24 26 6 5 2 2
n value 0.2 0.21 0.14 0.07 0.33 0.3 0.086
r value 1.7 1 1 0.9 0.8 0.61
*Formability 8 6 6 4 6 6 4 6 8 8
*Joinability 9 8 8 7 5 5 4 5 7 7
*Paintability 9 9 9 9 8 8 7 7 8 8
**Corrosion 2 2 2 2 3 3 1 3 3 3
***CO2 Emission 8 8 8 8 9 9 9.5 9 8 9
***Disposal 8.5 8.5 8.5 8.5 9 9 6 6 5 5
*range 1=difficult to process, 10=few
production problems
**3:Good, 2:Be Careful, 1:
Not Useabe
**10 = without difficulty, 1 = extensive
development required

Table 8: Normalized values of material candidates properties in the material space
No
rma
liza
tio
n o
f M
ate
ria
l P
rop
erti
es
Material
Properties D
irect
ion
of
Imp
rov
emen
t
Steel-
BH
Steel-
DP
Steel-
HSLA
Steel-
Martensite
Al-
5x
xx
Al-
6xxx Mg Ti GFRP HDPE
Density -1 1.000 1.000 1.000 1.000
0.3
43
0.34
3
0.22
2
0.5
72 0.241 0.122
Price -1 0.017 0.022 0.018 0.024
0.0
65
0.08
4
0.06
5
1.0
00 0.136 0.026
Young's
Modulus 1
1.000 1.000 1.000 1.000
0.3
33
0.33
3
0.21
4
0.4
76 0.119 0.004
Tensile
Strength 1
0.267 0.500 0.437 1.000
0.2
25
0.17
5
0.20
0
0.7
70 0.250 0.013
Total
Elongation 1
0.390 0.340 0.300 0.070
0.2
40
0.26
0
0.06
0
0.0
50 0.020 1.000
n value 1 0.606 0.636 0.424 0.212
1.0
00
0.90
9
0.2
61 0.036
r value 1 1.000 0.588 0.588 0.529
0.4
71
0.35
9
Formability 1 1.000 0.750 0.750 0.500
0.7
50
0.75
0
0.50
0
0.7
50 1.000 1.000
Joinability 1 1.000 0.889 0.889 0.778
0.5
56
0.55
6
0.44
4
0.5
56 0.778 0.778
Paintability 1 1.000 1.000 1.000 1.000
0.8
89
0.88
9
0.77
8
0.7
78 0.889 0.889
Corrosion 1 0.667 0.667 0.667 0.667
1.0
00
1.00
0
0.33
3
1.0
00 1.000 1.000
CO2
Emission 1
0.842 0.842 0.842 0.842
0.9
47
0.94
7
1.00
0
0.9
47 0.842 0.947
Disposal 1 0.944 0.944 0.944 0.944
1.0
00
1.00
0
0.66
7
0.6
67 0.556 0.556

Table 9: QFD based top three material candidates for the roof.
Engineering Metrics Rank 1 2 3
Score Rank Top 3 Engineering Metrics Density Tensile Strength Young's Modulus
Technical Targets 13 9.942857143 8.228571429
Direction of Improvement -1 1 1
Steel-BH 1 0.266666667 1 -0.068 10
Steel-DP 1 0.5 1 0.0064 6
Steel-HSLA 1 0.436666667 1 -0.0138 8
Steel-Martensite 1 1 1 0.1659 1
Aluminum-5xxx 0.343074968 0.225 0.333333333 0.0167 4
Aluminum-6xxx 0.343074968 0.175 0.333333333 0.0007 7
Magnesium 0.222363405 0.2 0.214285714 0.0276 3
Titanium 0.571791614 0.77 0.476190476 0.1328 2
GFRP 0.241423126 0.25 0.119047619 0.0105 5
HDPE 0.121982211 0.0125 0.003809524 -0.0459 9

Table 10: New BIW QFD based design, first three choices.
Part First Choice Second Choice Third Choice
Roof CFRP Steel-Martensite Steel-DP
Hood (inner) CFRP Steel-Martensite Steel-DP
Hood (outer) CFRP GFRP Al-6xxx
Trunk (inner) CFRP Steel-Martensite Steel-DP
Trunk (outer) CFRP Steel-Martensite Steel-DP
Trunk Pan CFRP Steel-Martensite Steel-DP
Engine Cradle Steel-DP Steel-BH Steel-HSLA
Shock Towers Steel-DP Steel-BH Steel-HSLA
Quarter Panel CFRP Steel-Martensite Steel-DP
Front Fender CFRP GFRP Al-6xxx
Door (inner) CFRP Steel-Martensite Steel-DP
Door (outer) CFRP Steel-Martensite Steel-DP
Wheel House CFRP Steel-Martensite Magnesium
A B Pillars Steel-DP Steel-BH Steel-HSLA
Floor pan CFRP Steel-Martensite Steel-DP
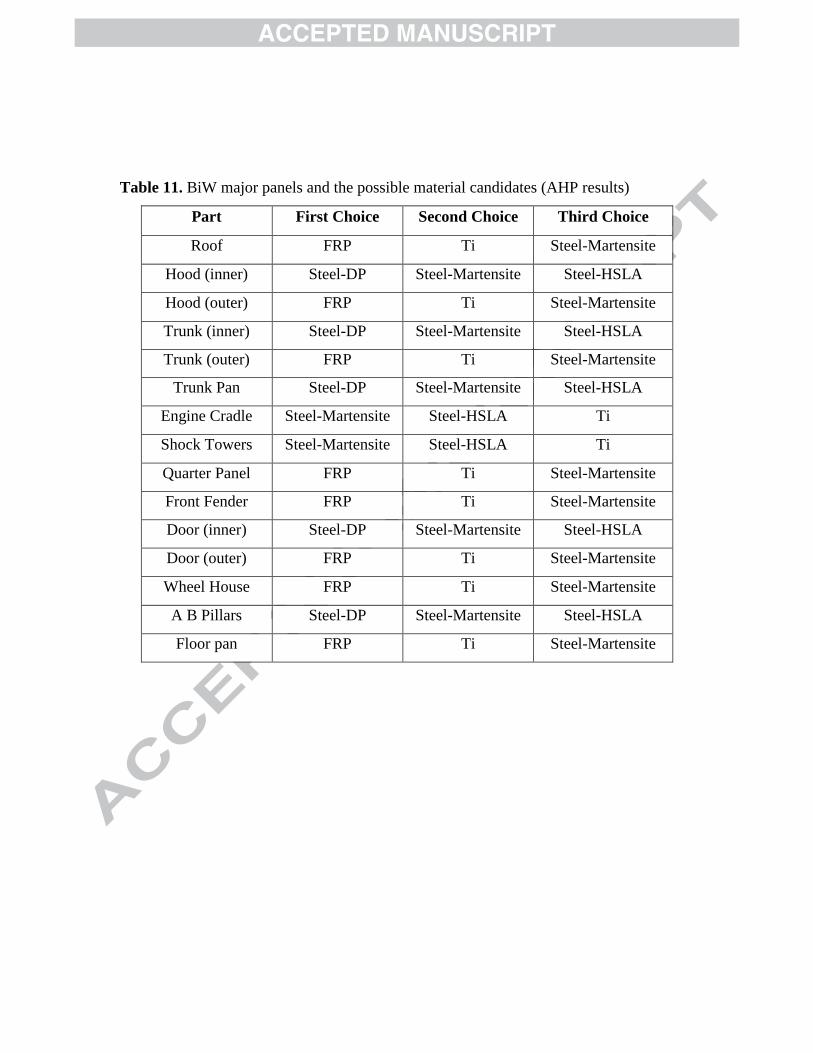
Table 11. BiW major panels and the possible material candidates (AHP results)
Part First Choice Second Choice Third Choice
Roof FRP Ti Steel-Martensite
Hood (inner) Steel-DP Steel-Martensite Steel-HSLA
Hood (outer) FRP Ti Steel-Martensite
Trunk (inner) Steel-DP Steel-Martensite Steel-HSLA
Trunk (outer) FRP Ti Steel-Martensite
Trunk Pan Steel-DP Steel-Martensite Steel-HSLA
Engine Cradle Steel-Martensite Steel-HSLA Ti
Shock Towers Steel-Martensite Steel-HSLA Ti
Quarter Panel FRP Ti Steel-Martensite
Front Fender FRP Ti Steel-Martensite
Door (inner) Steel-DP Steel-Martensite Steel-HSLA
Door (outer) FRP Ti Steel-Martensite
Wheel House FRP Ti Steel-Martensite
A B Pillars Steel-DP Steel-Martensite Steel-HSLA
Floor pan FRP Ti Steel-Martensite

Figures
Figure 1: Material distribution of total vehicle curb weight

Figure 2: Material use in the automobile bodies trends.
Figure 3. House of quality matrix diagram

Figure 4. QFD house showing scores assigned for customer needs and ranking of other
engineering metrics.

Figure 5: AHP algorithm used in this study
Set the goal, selection criteria, subcriteria, and alternatives
Make the decision based on the overall rank of the
alternatives
Get the overall rank of the alternatives
No
Yes
Get the priorities of all selection criteria and the rank of
each alternative with respect to the selection criteria
Is the matrix consistence, CR ≤ 0.10
Check consistency for all matrices in AHP
Piarwise comparison between selection criteria and
among the alternatives
Collect the required data to build the model

Figure 6: Hierarchal layout of the problem
Figure 7: Piarwise comparison between the main selection criteria.

Figure 8: Rank of the selection criteria with respect to goal statement (CR=0.05).
Figure 9: Final rank of the alternatives for roof (CR=0.04).
0 0.05 0.1 0.15 0.2 0.25
Dent resistance
NVH
Fuel economy
Cost
Bending stiffness
Durability
Torsional stiffness
Ease of manufacturing
Enviromental friendliness
Temperture performance
Crashworthiness
Relative priority
0 0.05 0.1 0.15
FRP
Ti
Steel-…
Steel-HSLA
Steel-DP
Steel-BH
HDPE
Al-5xxx
Al-6xxx
Mg
Relative priority

Research Highlights:
The presented manuscript has following research highlights:
Decision making tools for selecting materials for automotive panels.
Performance criteria & manufacturability aspects are quantified.
QFD & AHP analyze each body panel in the BiW separately & collectively.
BiW overall BiW weight, performance, & compatibility are assessed.
QFD & AHP rank several materials for BiW including; BH, DP, HSLA.