Embed Size (px)
Citation preview

USING PUBLIC POLICY TOOLS TO SHAPE TRAVEL PATTERNS
AND LAND USE DEVELOPMENT IN EUROPE
Prof. John PucherRutgers University
[email protected] http://policy.rutgers.edu/faculty/pucher.htm
“Finance: The Critical Link”UCLA Arrowhead Conference
October 19-21, 2003
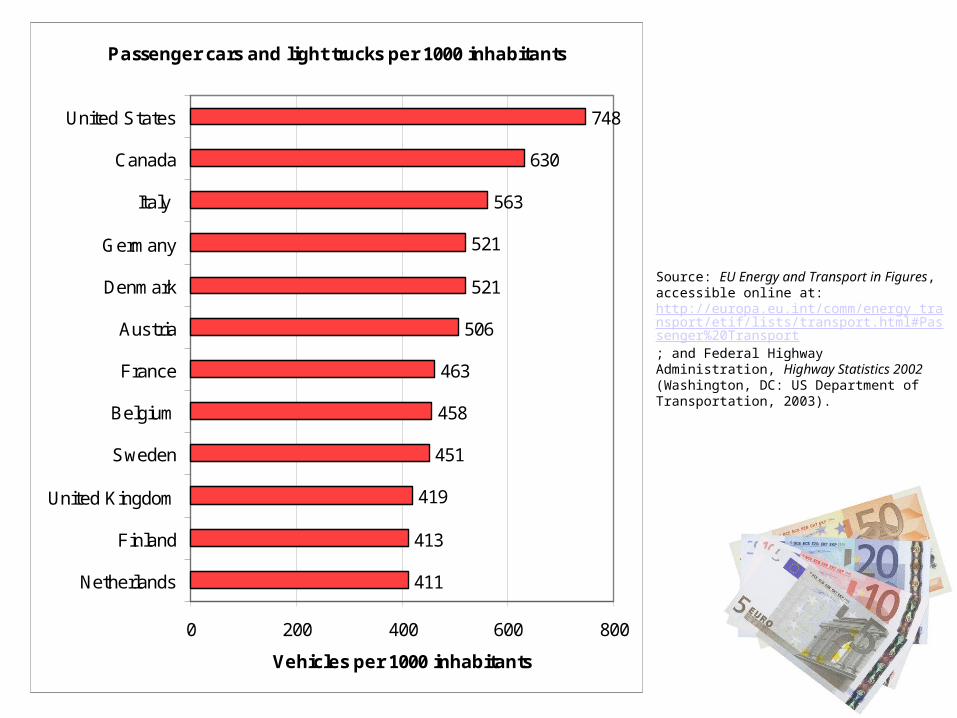
Passenger cars and light trucks per 1000 inhabitants
411
413
419
451
458
463
506
521
521
563
630
748
0 200 400 600 800
Netherlands
Finland
United Kingdom
Sweden
Belgium
France
Austria
Denmark
Germany
Italy
Canada
United States
Vehicles per 1000 inhabitants
Source: EU Energy and Transport in Figures, accessible online at: http://europa.eu.int/comm/energy_transport/etif/lists/transport.html#Passenger%20Transport; and Federal Highway Administration, Highway Statistics 2002 (Washington, DC: US Department of Transportation, 2003).

Percentage of Urban Trips by Walking, Cycling, and Public Transport in the USA, Canada and Europe, 1995
0
5
10
15
20
25
30
35
40
45
50
55
60U
SA
Can
ada
Eng
land
& W
ales
Fra
nce
Ital
y
Ger
man
y
Sw
eden
Aus
tria
Net
herl
ands
Sw
itzer
land
Den
mar
k
Per
cen
t
Walk
Bicycle
Public Transport
Source: Transportation Research Board, Making Transit Work: Insights from Western Europe, Canada, and the United States (Washington, DC: National Research Council, 2001), Table 2-2.

Passenger km of car use per capita in the USA, Canada, and Western Europe in 2000
8647
8805
9522
10363
10469
10487
10763
11532
11553
12469
18482
23102
0 5000 10000 15000 20000 25000
Austria
Germany
Netherlands
Belgium
United Kingdom
Sweden
Finland
Italy
France
Denmark
Canada
United States
Passenger km per person per year
Source: EU Energy and Transport in Figures, online at: http://europa.eu.int/comm/energy_transport/etif/lists/transport.html#Passenger%20Transport; and Federal Highway Administration, Highway Statistics 2002 (Washington, DC: US Department of Transportation, 2003).

Public Policies Affecting Travel Behavior in Europe
•High sales taxes and fees on new car purchases
•Restricted parking supply, limited parking duration, and high parking prices
•High cost and difficulty of getting driver’s license
•Limitations on all sorts on auto use (lower speeds, traffic calming, auto-free zones, no through traffic, turn restrictions, residents-only streets, etc.)
•Very high gasoline taxes and prices
•Congestion pricing experiment (in central London)
•Large subsidies to public transport for decades, resulting in high-quality, state-of-the-art systems with attractive fares for regular users
•Traffic priority for public transit over private car
•Superb facilities for walking and cycling
•Commutation subsidies for all travel modes, including walking and cycling, based on distance from home to work (Germany)

Taxes and Fees on New Car Purchases in Europe and USA, 2002
(on standard subcompact car)
6%
16%
17%
20%
20%
22%
26%
28%
50%
89%
164%
0% 50% 100% 150% 200%
United States
Germany
United Kingdom
Italy
France
Belgium
Sweden
Austria
Netherlands
Finland
Denmark
Source: EU Energy and Transport in Figures, accessible online at: http://europa.eu.int/comm/energy_transport/etif/transport_means_road/motorization.html

Public Policies Affecting Travel Behavior in Europe
•Very high sales taxes and fees on new car purchases
•Restricted parking supply, limited parking duration, and high parking prices
•High cost and difficulty of getting driver’s license
•Limitations on all sorts on auto use (lower speeds, traffic calming, auto-free zones, no through traffic, turn restrictions, residents-only streets, etc.)
•Very high gasoline taxes and prices
•Congestion pricing experiment (in central London)
•Large subsidies to public transport for decades, resulting in high-quality, state-of-the-art systems with attractive fares for regular users
•Traffic priority for public transit over private car
•Superb facilities for walking and cycling
•Commutation subsidies for all travel modes, including walking and cycling, based on distance from home to work (Germany)

Average Range
Muenster 1,00 € 0,50 to 2,50 €
Dresden 1,00 € 0,50 to 1,80 €
Ulm 1,20 € 0,50 to 1,50 €
Koeln 1,50 € 1,00 to 2,00 €
Freiburg 1,50 € 0,80 to 1,80 €
Hamburg 2,00 € 1,60 to 4,50 €
Zuerich 2,00 € 1,60 to 2,25 €
Munich 3,00 € 2,00 to 6,00 €
Wien 3,20 € 2,20 to 3,50 €
Source: http://www.parkinfo.com/
Hourly Parking Fees in Selected European Cities, 2003

Public Policies Affecting Travel Behavior in Europe
•Very high sales taxes and fees on new car purchases
•Restricted parking supply, limited parking duration, and high parking prices
•High cost and difficulty of getting driver’s license
•Limitations on all sorts on auto use (lower speeds, traffic calming, auto-free zones, no through traffic, turn restrictions, residents-only streets, etc.)
•Very high gasoline taxes and prices
•Congestion pricing experiment (in central London)
•Large subsidies to public transport for decades, resulting in high-quality, state-of-the-art systems with attractive fares for regular users
•Traffic priority for public transit over private car
•Superb facilities for walking and cycling
•Commutation subsidies for all travel modes, including walking and cycling, based on distance from home to work (Germany)

Source: Energy Prices and Taxes, 2nd Quarter 2003 (Paris: International Energy Agency, OECD, 2003), pp. 316-317.
Gasoline Prices in US Dollars/liter (2002)
$0.41
$0.50
$0.81
$0.82
$0.83
$0.92
$0.96
$0.96
$0.99
$1.01
$1.04
$1.08
$1.10
$1.12
$0.00 $0.20 $0.40 $0.60 $0.80 $1.00 $1.20
United States
Canada
Italy
Austria
Switzerland
Belgium
France
Sweden
Germany
Finland
Denmark
Netherlands
United Kingdom
Norway
US Dollars

Source: Energy Prices and Taxes, 2nd Quarter 2003 (Paris: International Energy Agency, OECD, 2003), pp. 291-292.
Percentage of Taxes in Gasoline Prices (2002)
24.8%
39.6%
64.1%
64.3%
68.4%
69.2%
69.6%
69.7%
70.0%
70.0%
70.9%
73.4%
73.7%
77.5%
0% 20% 40% 60% 80% 100%
United States
Canada
Austria
Switzerland
Italy
Belgium
Sweden
Denmark
Finland
Norway
Netherlands
Germany
France
United Kingdom
Percentage

Public Policies Affecting Travel Behavior in Europe
•Very high sales taxes and fees on new car purchases
•Restricted parking supply, limited parking duration, and high parking prices
•High cost and difficulty of getting driver’s license
•Limitations on all sorts on auto use (lower speeds, traffic calming, auto-free zones, no through traffic, turn restrictions, residents-only streets, etc.)
•Very high gasoline taxes and prices
•Congestion pricing experiment (in central London)
•Large subsidies to public transport for decades, resulting in high-quality, state-of-the-art systems with attractive fares for regular users
•Traffic priority for public transit over private car
•Superb facilities for walking and cycling
•Commutation subsidies for all travel modes, including walking and cycling, based on distance from home to work (Germany)

Congestion Pricing in Central London since February 2003
•Purpose: to counter severe congestion in central London (8 mph average speed)
•Charge of £5 ($8) for vehicles in inner zone from 7 am to 6:30 pm, paid by about 100,000 vehicles per day
•Payable until 10 pm on day of travel by internet, phone, retail outlets, mobile phones, etc.— penalties for late payments
•Surveillance by digital cameras to photograph license plates
•Congestion pricing raised avg. speed by 31% overall but by 40% for buses, eliminated 150,000 car trips per day in inner zone, no significant congestion from diverted traffic outside the zone
•50%-70% of ex-car users rode transit instead
•Raises revenues of £130 million per year to be invested in improved and expanded public transit (already 300 new buses added)
•Equity impact: 90% of car drivers into central London come from richest households

Area of Congestion Pricing in Central London

Public Policies Affecting Travel Behavior in Europe
•Very high sales taxes and fees on new car purchases
•Restricted parking supply, limited parking duration, and high parking prices
•High cost and difficulty of getting driver’s license
•Limitations on all sorts on auto use (lower speeds, traffic calming, auto-free zones, no through traffic, turn restrictions, residents-only streets, etc.)
•Very high gasoline taxes and prices
•Congestion pricing experiment (in central London)
•Large subsidies to public transport for decades, resulting in high-quality, state-of-the-art systems with attractive fares for regular users
•Traffic priority for public transit over private car
•Superb facilities for walking and cycling
•Commutation subsidies for all travel modes, including walking and cycling, based on distance from home to work (Germany)

European and Canadian Cities are Much More Compact than American Cities
•Comparing only large cities, Kenworthy (2002) found that in 1995, European cities were about twice as dense as Canadian cities and almost four times denser than American cities (55 vs 26 vs 15 persons per hectare).
•European and Canadian cities are also less polycentric than American cities, with central cores that have remained vibrant and far more dominant over their metropolitan regions than American cities.

•Exclusion of vast amounts of agricultural land, forests, parkland, and other open space around metropolitan areas for any commercial development--Restricts supply of land and raises land price--Forces compact development to save on land costs
•Integrated federal, state, regional, and local land-use plans which are detailed, enforced, and highly restrictive of new commercial and residential development
•Coordination of land-use plans with environmental and transport plans at each government level, especially at regional level
•Limited land-use competition among localities, since land-use plans are coordinated among communities within a region, and tax base is shared
German Regulations and Planning Policies Affecting Land Development Patterns

Public Finance Policies Affecting Land Development Patterns in Germany
•Fees assessed by all local governments on private developers to finance public infrastructure costs of sewers, sidewalks, lighting, utility lines, streets in new suburban developments
•Both vertical and horizontal sharing of all three tax bases (income, sales, and property taxes) among governments—much less fiscal competition among local governments than in USA
•Tax revenues distributed by federal and state governments to regions and cities to favor dense urban centers that provide a wide range of public services to their surrounding regions
•Most school construction costs and all teacher salaries are paid by the state government, not local communities—school financing thus independent of local fiscal capacity, but best schools are generally in the city center, not in the suburbs, as in USA
•Homeowner subsidies are only for low and moderate-income households, only once per lifetime
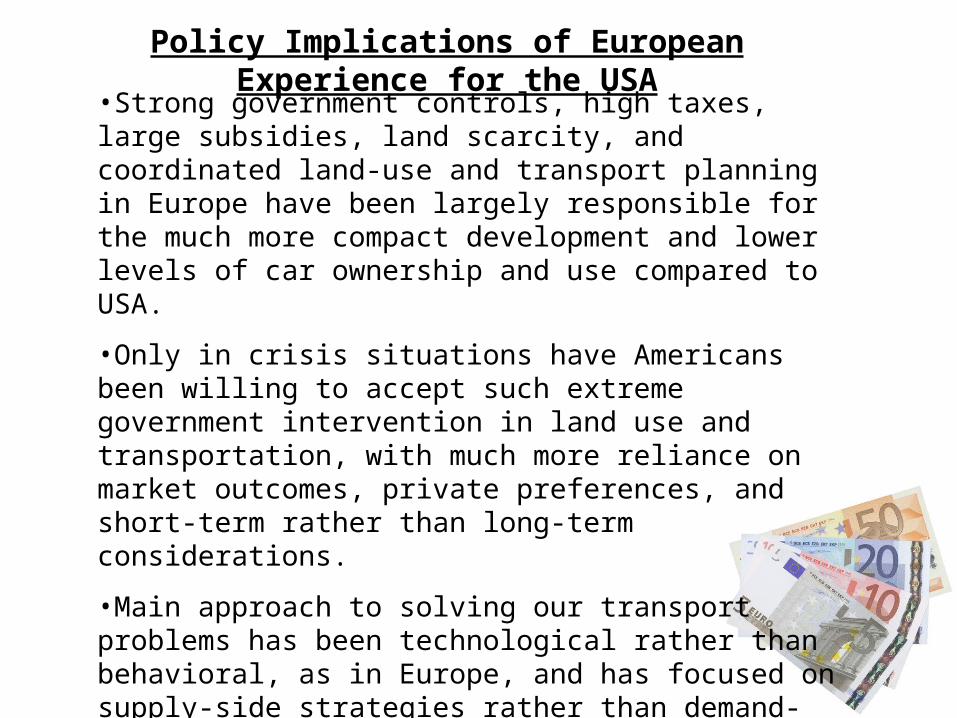
Policy Implications of European Experience for the USA
•Strong government controls, high taxes, large subsidies, land scarcity, and coordinated land-use and transport planning in Europe have been largely responsible for the much more compact development and lower levels of car ownership and use compared to USA.
•Only in crisis situations have Americans been willing to accept such extreme government intervention in land use and transportation, with much more reliance on market outcomes, private preferences, and short-term rather than long-term considerations.
•Main approach to solving our transport problems has been technological rather than behavioral, as in Europe, and has focused on supply-side strategies rather than demand-side restrictions.
•American states that have been most innovative in land use and transport planning have been prompted by severe problems (pollution, congestion, lack of space) and/or by very strong environmental movements.

For any questions or further information, please feel free to contact:
Prof. John Pucher
Rutgers University
Email:[email protected]
http://policy.rutgers.edu/faculty/pucher.htm
For free PDF and Word downloads of publications, see either of the two Rutgers University websites:
http://policy.rutgers.edu/tpi/articles.html
or
http://policy.rutgers.edu/papers