Embed Size (px)
Citation preview
J
gAacPC
Using Procedural Codes to Supplement RiskAdjustment: A Nonparametric Learning ApproachZeeshan Syed, PhD, Ilan Rubinfeld, MD, MBA, FACS, Joe H Patton JR, MD, FACS, Jennifer Ritz, RN,ack Jordan, MS, Andrea Doud, MD, Vic Velanovich, MD, FACS
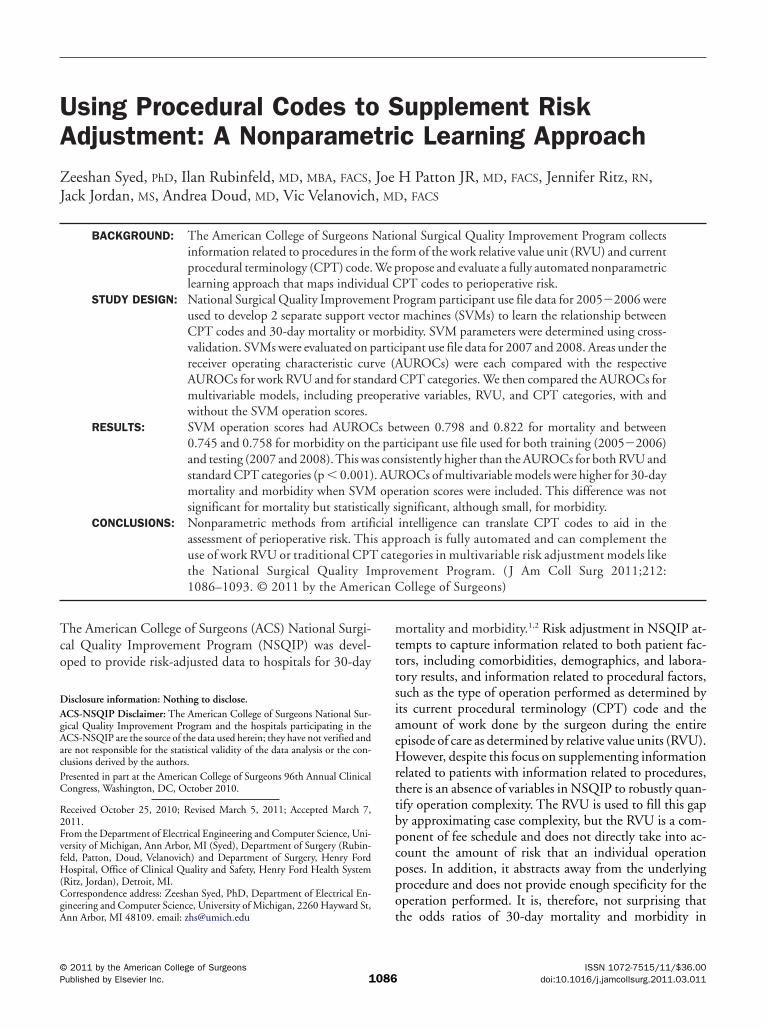
BACKGROUND: The American College of Surgeons National Surgical Quality Improvement Program collectsinformation related to procedures in the form of the work relative value unit (RVU) and currentprocedural terminology (CPT) code. We propose and evaluate a fully automated nonparametriclearning approach that maps individual CPT codes to perioperative risk.
STUDY DESIGN: National Surgical Quality Improvement Program participant use file data for 2005�2006 wereused to develop 2 separate support vector machines (SVMs) to learn the relationship betweenCPT codes and 30-day mortality or morbidity. SVM parameters were determined using cross-validation. SVMs were evaluated on participant use file data for 2007 and 2008. Areas under thereceiver operating characteristic curve (AUROCs) were each compared with the respectiveAUROCs for work RVU and for standard CPT categories. We then compared the AUROCs formultivariable models, including preoperative variables, RVU, and CPT categories, with andwithout the SVM operation scores.
RESULTS: SVM operation scores had AUROCs between 0.798 and 0.822 for mortality and between0.745 and 0.758 for morbidity on the participant use file used for both training (2005�2006)and testing (2007 and 2008).This was consistently higher than the AUROCs for both RVU andstandard CPT categories (p � 0.001). AUROCs of multivariable models were higher for 30-daymortality and morbidity when SVM operation scores were included. This difference was notsignificant for mortality but statistically significant, although small, for morbidity.
CONCLUSIONS: Nonparametric methods from artificial intelligence can translate CPT codes to aid in theassessment of perioperative risk. This approach is fully automated and can complement theuse of work RVU or traditional CPT categories in multivariable risk adjustment models likethe National Surgical Quality Improvement Program. ( J Am Coll Surg 2011;212:
1086–1093. © 2011 by the American College of Surgeons)tttsiaeHrttbpcppo
The American College of Surgeons (ACS) National Surgi-cal Quality Improvement Program (NSQIP) was devel-oped to provide risk-adjusted data to hospitals for 30-day
Disclosure information: Nothing to disclose.ACS-NSQIP Disclaimer: The American College of Surgeons National Sur-ical Quality Improvement Program and the hospitals participating in theCS-NSQIP are the source of the data used herein; they have not verified andre not responsible for the statistical validity of the data analysis or the con-lusions derived by the authors.resented in part at the American College of Surgeons 96th Annual Clinicalongress, Washington, DC, October 2010.
Received October 25, 2010; Revised March 5, 2011; Accepted March 7,2011.From the Department of Electrical Engineering and Computer Science, Uni-versity of Michigan, Ann Arbor, MI (Syed), Department of Surgery (Rubin-feld, Patton, Doud, Velanovich) and Department of Surgery, Henry FordHospital, Office of Clinical Quality and Safety, Henry Ford Health System(Ritz, Jordan), Detroit, MI.Correspondence address: Zeeshan Syed, PhD, Department of Electrical En-
tgineering and Computer Science, University of Michigan, 2260 Hayward St,Ann Arbor, MI 48109. email: [email protected]
1086© 2011 by the American College of SurgeonsPublished by Elsevier Inc.
mortality and morbidity.1,2 Risk adjustment in NSQIP at-empts to capture information related to both patient fac-ors, including comorbidities, demographics, and labora-ory results, and information related to procedural factors,uch as the type of operation performed as determined byts current procedural terminology (CPT) code and themount of work done by the surgeon during the entirepisode of care as determined by relative value units (RVU).owever, despite this focus on supplementing information
elated to patients with information related to procedures,here is an absence of variables in NSQIP to robustly quan-ify operation complexity. The RVU is used to fill this gapy approximating case complexity, but the RVU is a com-onent of fee schedule and does not directly take into ac-ount the amount of risk that an individual operationoses. In addition, it abstracts away from the underlyingrocedure and does not provide enough specificity for theperation performed. It is, therefore, not surprising that
he odds ratios of 30-day mortality and morbidity inISSN 1072-7515/11/$36.00doi:10.1016/j.jamcollsurg.2011.03.011
atpeCeeci
mwtsg(2mvphi
asrt
1087Vol. 212, No. 6, June 2011 Syed et al Nonparametric Modeling of Procedural Codes
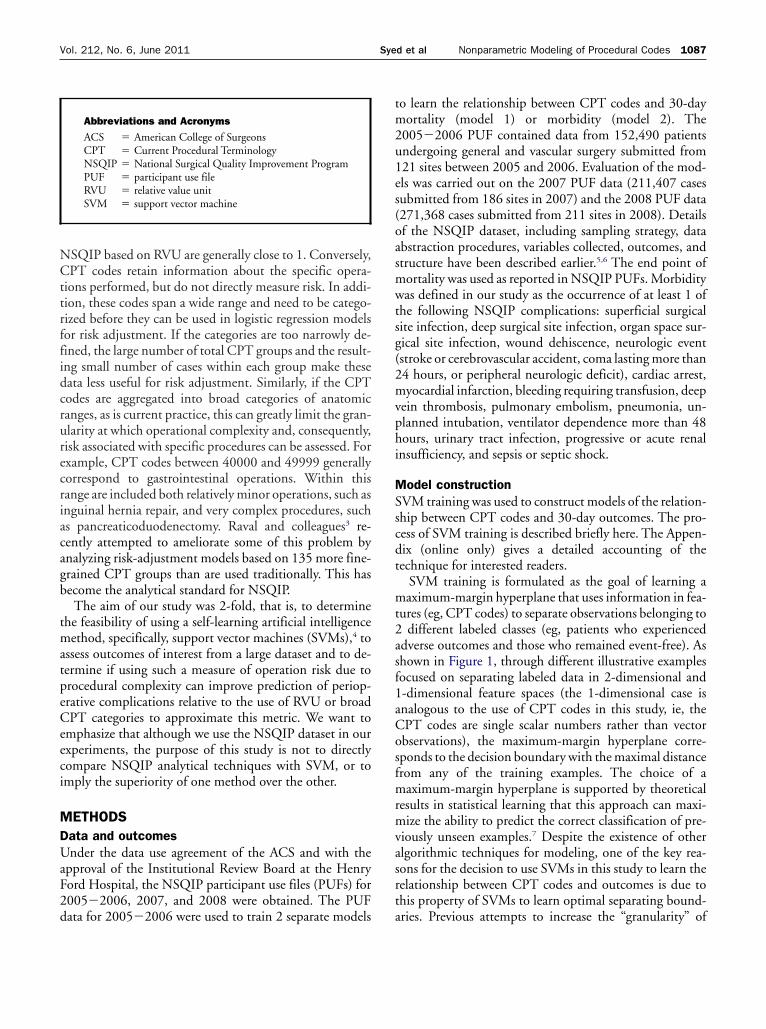
NSQIP based on RVU are generally close to 1. Conversely,CPT codes retain information about the specific opera-tions performed, but do not directly measure risk. In addi-tion, these codes span a wide range and need to be catego-rized before they can be used in logistic regression modelsfor risk adjustment. If the categories are too narrowly de-fined, the large number of total CPT groups and the result-ing small number of cases within each group make thesedata less useful for risk adjustment. Similarly, if the CPTcodes are aggregated into broad categories of anatomicranges, as is current practice, this can greatly limit the gran-ularity at which operational complexity and, consequently,risk associated with specific procedures can be assessed. Forexample, CPT codes between 40000 and 49999 generallycorrespond to gastrointestinal operations. Within thisrange are included both relatively minor operations, such asinguinal hernia repair, and very complex procedures, suchas pancreaticoduodenectomy. Raval and colleagues3 re-cently attempted to ameliorate some of this problem byanalyzing risk-adjustment models based on 135 more fine-grained CPT groups than are used traditionally. This hasbecome the analytical standard for NSQIP.
The aim of our study was 2-fold, that is, to determinethe feasibility of using a self-learning artificial intelligencemethod, specifically, support vector machines (SVMs),4 tossess outcomes of interest from a large dataset and to de-ermine if using such a measure of operation risk due torocedural complexity can improve prediction of periop-rative complications relative to the use of RVU or broadPT categories to approximate this metric. We want to
mphasize that although we use the NSQIP dataset in ourxperiments, the purpose of this study is not to directlyompare NSQIP analytical techniques with SVM, or tomply the superiority of one method over the other.
METHODSData and outcomesUnder the data use agreement of the ACS and with theapproval of the Institutional Review Board at the HenryFord Hospital, the NSQIP participant use files (PUFs) for2005�2006, 2007, and 2008 were obtained. The PUF
Abbreviations and Acronyms
ACS � American College of SurgeonsCPT � Current Procedural TerminologyNSQIP � National Surgical Quality Improvement ProgramPUF � participant use fileRVU � relative value unitSVM � support vector machine
data for 2005�2006 were used to train 2 separate models a
to learn the relationship between CPT codes and 30-daymortality (model 1) or morbidity (model 2). The2005�2006 PUF contained data from 152,490 patientsundergoing general and vascular surgery submitted from121 sites between 2005 and 2006. Evaluation of the mod-els was carried out on the 2007 PUF data (211,407 casessubmitted from 186 sites in 2007) and the 2008 PUF data(271,368 cases submitted from 211 sites in 2008). Detailsof the NSQIP dataset, including sampling strategy, dataabstraction procedures, variables collected, outcomes, andstructure have been described earlier.5,6 The end point of
ortality was used as reported in NSQIP PUFs. Morbidityas defined in our study as the occurrence of at least 1 of
he following NSQIP complications: superficial surgicalite infection, deep surgical site infection, organ space sur-ical site infection, wound dehiscence, neurologic eventstroke or cerebrovascular accident, coma lasting more than4 hours, or peripheral neurologic deficit), cardiac arrest,yocardial infarction, bleeding requiring transfusion, deep
ein thrombosis, pulmonary embolism, pneumonia, un-lanned intubation, ventilator dependence more than 48ours, urinary tract infection, progressive or acute renal
nsufficiency, and sepsis or septic shock.
Model constructionSVM training was used to construct models of the relation-ship between CPT codes and 30-day outcomes. The pro-cess of SVM training is described briefly here. The Appen-dix (online only) gives a detailed accounting of thetechnique for interested readers.
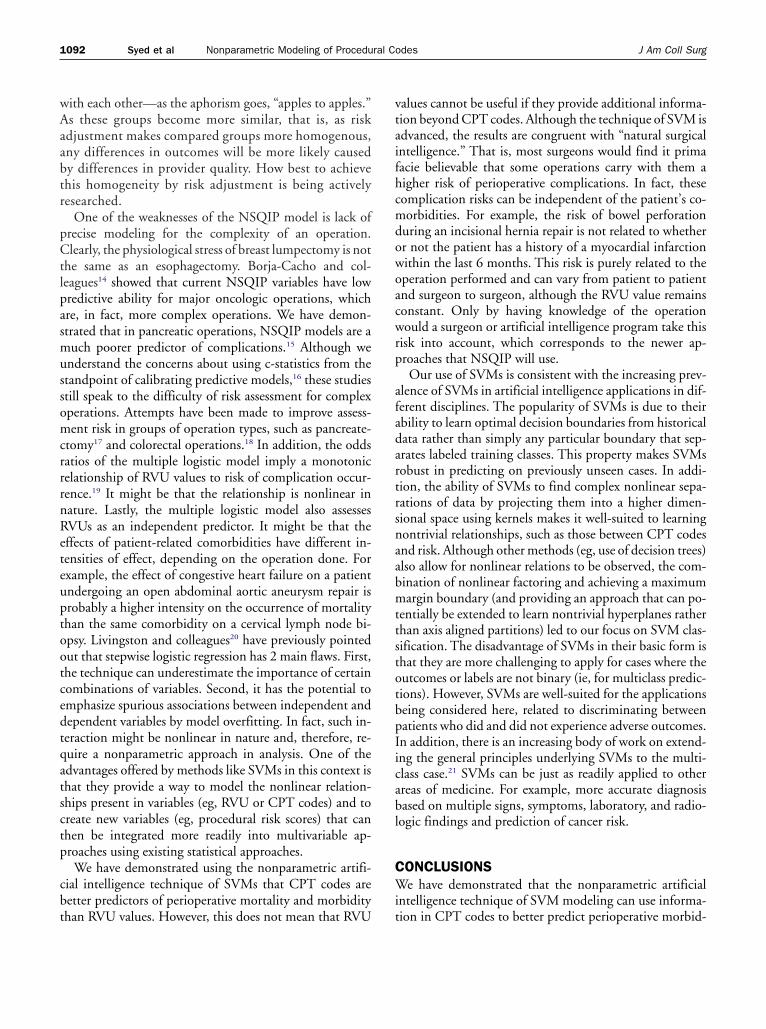
SVM training is formulated as the goal of learning amaximum-margin hyperplane that uses information in fea-tures (eg, CPT codes) to separate observations belonging to2 different labeled classes (eg, patients who experiencedadverse outcomes and those who remained event-free). Asshown in Figure 1, through different illustrative examplesfocused on separating labeled data in 2-dimensional and1-dimensional feature spaces (the 1-dimensional case isanalogous to the use of CPT codes in this study, ie, theCPT codes are single scalar numbers rather than vectorobservations), the maximum-margin hyperplane corre-sponds to the decision boundary with the maximal distancefrom any of the training examples. The choice of amaximum-margin hyperplane is supported by theoreticalresults in statistical learning that this approach can maxi-mize the ability to predict the correct classification of pre-viously unseen examples.7 Despite the existence of otherlgorithmic techniques for modeling, one of the key rea-ons for the decision to use SVMs in this study to learn theelationship between CPT codes and outcomes is due tohis property of SVMs to learn optimal separating bound-
ries. Previous attempts to increase the “granularity” of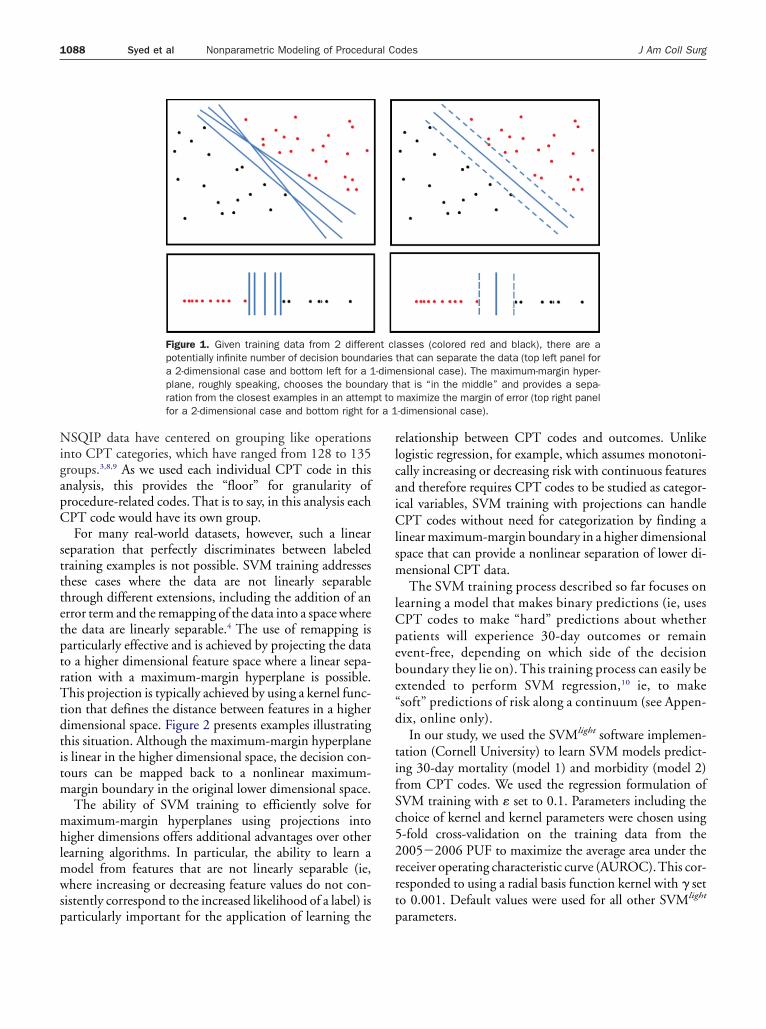
ptrTtdtitm
mhlmwsp
rlcaiClsm
lCpebe
t
r a 1
1088 Syed et al Nonparametric Modeling of Procedural Codes J Am Coll Surg
NSQIP data have centered on grouping like operationsinto CPT categories, which have ranged from 128 to 135groups.3,8,9 As we used each individual CPT code in thisanalysis, this provides the “floor” for granularity ofprocedure-related codes. That is to say, in this analysis eachCPT code would have its own group.
For many real-world datasets, however, such a linearseparation that perfectly discriminates between labeledtraining examples is not possible. SVM training addressesthese cases where the data are not linearly separablethrough different extensions, including the addition of anerror term and the remapping of the data into a space wherethe data are linearly separable.4 The use of remapping is
articularly effective and is achieved by projecting the datao a higher dimensional feature space where a linear sepa-ation with a maximum-margin hyperplane is possible.his projection is typically achieved by using a kernel func-
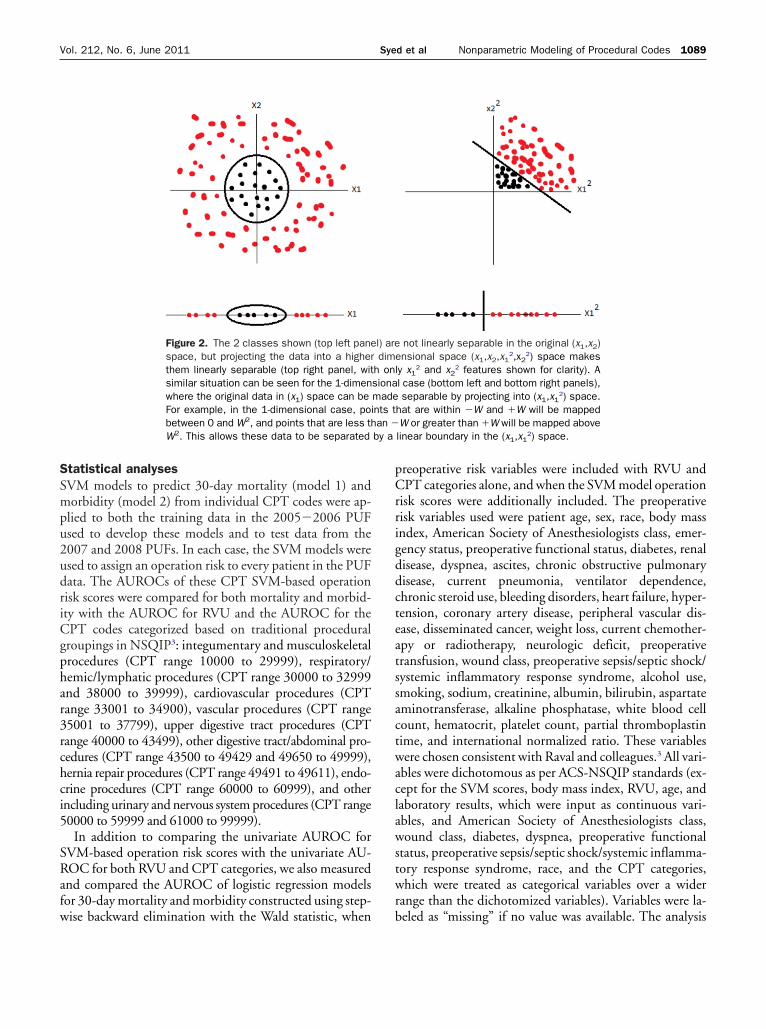
ion that defines the distance between features in a higherimensional space. Figure 2 presents examples illustratinghis situation. Although the maximum-margin hyperplanes linear in the higher dimensional space, the decision con-ours can be mapped back to a nonlinear maximum-argin boundary in the original lower dimensional space.The ability of SVM training to efficiently solve foraximum-margin hyperplanes using projections into
igher dimensions offers additional advantages over otherearning algorithms. In particular, the ability to learn a
odel from features that are not linearly separable (ie,here increasing or decreasing feature values do not con-
istently correspond to the increased likelihood of a label) is
Figure 1. Given training data from 2 differepotentially infinite number of decision boundaa 2-dimensional case and bottom left for a 1plane, roughly speaking, chooses the boundration from the closest examples in an attemfor a 2-dimensional case and bottom right fo
articularly important for the application of learning the
elationship between CPT codes and outcomes. Unlikeogistic regression, for example, which assumes monotoni-ally increasing or decreasing risk with continuous featuresnd therefore requires CPT codes to be studied as categor-cal variables, SVM training with projections can handlePT codes without need for categorization by finding a
inear maximum-margin boundary in a higher dimensionalpace that can provide a nonlinear separation of lower di-ensional CPT data.The SVM training process described so far focuses on
earning a model that makes binary predictions (ie, usesPT codes to make “hard” predictions about whetheratients will experience 30-day outcomes or remainvent-free, depending on which side of the decisionoundary they lie on). This training process can easily bextended to perform SVM regression,10 ie, to make
“soft” predictions of risk along a continuum (see Appen-dix, online only).
In our study, we used the SVMlight software implemen-tation (Cornell University) to learn SVM models predict-ing 30-day mortality (model 1) and morbidity (model 2)from CPT codes. We used the regression formulation ofSVM training with � set to 0.1. Parameters including thechoice of kernel and kernel parameters were chosen using5-fold cross-validation on the training data from the2005�2006 PUF to maximize the average area under thereceiver operating characteristic curve (AUROC).This cor-responded to using a radial basis function kernel with � seto 0.001. Default values were used for all other SVMlight
asses (colored red and black), there are athat can separate the data (top left panel forensional case). The maximum-margin hyper-hat is “in the middle” and provides a sepa-maximize the margin of error (top right panel-dimensional case).
nt clries-dimary tpt to
parameters.
by a
1089Vol. 212, No. 6, June 2011 Syed et al Nonparametric Modeling of Procedural Codes
Statistical analysesSVM models to predict 30-day mortality (model 1) andmorbidity (model 2) from individual CPT codes were ap-plied to both the training data in the 2005�2006 PUFused to develop these models and to test data from the2007 and 2008 PUFs. In each case, the SVM models wereused to assign an operation risk to every patient in the PUFdata. The AUROCs of these CPT SVM-based operationrisk scores were compared for both mortality and morbid-ity with the AUROC for RVU and the AUROC for theCPT codes categorized based on traditional proceduralgroupings in NSQIP3: integumentary and musculoskeletalprocedures (CPT range 10000 to 29999), respiratory/hemic/lymphatic procedures (CPT range 30000 to 32999and 38000 to 39999), cardiovascular procedures (CPTrange 33001 to 34900), vascular procedures (CPT range35001 to 37799), upper digestive tract procedures (CPTrange 40000 to 43499), other digestive tract/abdominal pro-cedures (CPT range 43500 to 49429 and 49650 to 49999),hernia repair procedures (CPT range 49491 to 49611), endo-crine procedures (CPT range 60000 to 60999), and otherincluding urinary and nervous system procedures (CPT range50000 to 59999 and 61000 to 99999).
In addition to comparing the univariate AUROC forSVM-based operation risk scores with the univariate AU-ROC for both RVU and CPT categories, we also measuredand compared the AUROC of logistic regression modelsfor 30-day mortality and morbidity constructed using step-
Figure 2. The 2 classes shown (top left panespace, but projecting the data into a higherthem linearly separable (top right panel, witsimilar situation can be seen for the 1-dimenwhere the original data in (x1) space can beFor example, in the 1-dimensional case, pobetween 0 and W2, and points that are less thW2. This allows these data to be separated
wise backward elimination with the Wald statistic, when
preoperative risk variables were included with RVU andCPT categories alone, and when the SVM model operationrisk scores were additionally included. The preoperativerisk variables used were patient age, sex, race, body massindex, American Society of Anesthesiologists class, emer-gency status, preoperative functional status, diabetes, renaldisease, dyspnea, ascites, chronic obstructive pulmonarydisease, current pneumonia, ventilator dependence,chronic steroid use, bleeding disorders, heart failure, hyper-tension, coronary artery disease, peripheral vascular dis-ease, disseminated cancer, weight loss, current chemother-apy or radiotherapy, neurologic deficit, preoperativetransfusion, wound class, preoperative sepsis/septic shock/systemic inflammatory response syndrome, alcohol use,smoking, sodium, creatinine, albumin, bilirubin, aspartateaminotransferase, alkaline phosphatase, white blood cellcount, hematocrit, platelet count, partial thromboplastintime, and international normalized ratio. These variableswere chosen consistent with Raval and colleagues.3 All vari-ables were dichotomous as per ACS-NSQIP standards (ex-cept for the SVM scores, body mass index, RVU, age, andlaboratory results, which were input as continuous vari-ables, and American Society of Anesthesiologists class,wound class, diabetes, dyspnea, preoperative functionalstatus, preoperative sepsis/septic shock/systemic inflamma-tory response syndrome, race, and the CPT categories,which were treated as categorical variables over a widerrange than the dichotomized variables). Variables were la-
not linearly separable in the original (x1,x2)ensional space (x1,x2,x1
2,x22) space makes
ly x12 and x2
2 features shown for clarity). Al case (bottom left and bottom right panels),separable by projecting into (x1,x1
2) space.hat are within �W and �W will be mappedW or greater than �W will be mapped abovelinear boundary in the (x1,x1
2) space.
l) aredim
h onsionamadeints tan �
beled as “missing” if no value was available. The analysis
proce
1090 Syed et al Nonparametric Modeling of Procedural Codes J Am Coll Surg
was carried out for both the SVM training data in the2005�2006 PUF and the test data from 2007 and 2008.Given the large number of missing laboratory results forpatients in the 2005�2006 and 2007 and 2008 PUF, weperformed these experiments using all preoperative vari-ables and all preoperative variables excluding laboratoryresults.
All statistical analyses were carried out using PASW Sta-tistics 18 (SPSS Inc.) with Matlab (Mathworks Inc.) beingused to compare AUROC values for the different logisticregression models using the method proposed by Hanleyand McNeil.11
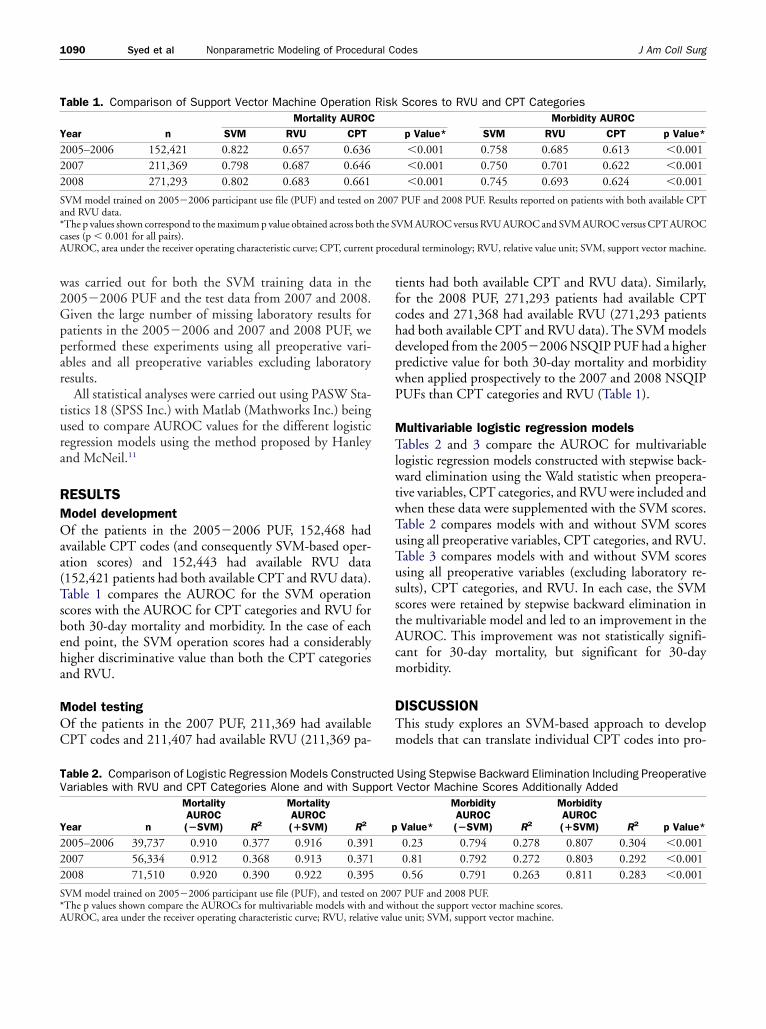
RESULTSModel developmentOf the patients in the 2005�2006 PUF, 152,468 hadavailable CPT codes (and consequently SVM-based oper-ation scores) and 152,443 had available RVU data(152,421 patients had both available CPT and RVU data).Table 1 compares the AUROC for the SVM operationscores with the AUROC for CPT categories and RVU forboth 30-day mortality and morbidity. In the case of eachend point, the SVM operation scores had a considerablyhigher discriminative value than both the CPT categoriesand RVU.
Model testingOf the patients in the 2007 PUF, 211,369 had availableCPT codes and 211,407 had available RVU (211,369 pa-
Table 1. Comparison of Support Vector Machine Operation
Year nMortality AUROC
SVM RVU CPT
2005–2006 152,421 0.822 0.657 0.6362007 211,369 0.798 0.687 0.6462008 271,293 0.802 0.683 0.661
SVM model trained on 2005�2006 participant use file (PUF) and tested onand RVU data.*The p values shown correspond to the maximum p value obtained across bothcases (p � 0.001 for all pairs).AUROC, area under the receiver operating characteristic curve; CPT, current
Table 2. Comparison of Logistic Regression Models ConstruVariables with RVU and CPT Categories Alone and with Sup
Year n
MortalityAUROC(�SVM) R2
MortalityAUROC(�SVM) R2
2005–2006 39,737 0.910 0.377 0.916 0.3912007 56,334 0.912 0.368 0.913 0.3712008 71,510 0.920 0.390 0.922 0.395
SVM model trained on 2005�2006 participant use file (PUF), and tested o
*The p values shown compare the AUROCs for multivariable models with and wiAUROC, area under the receiver operating characteristic curve; RVU, relative valutients had both available CPT and RVU data). Similarly,for the 2008 PUF, 271,293 patients had available CPTcodes and 271,368 had available RVU (271,293 patientshad both available CPT and RVU data). The SVM modelsdeveloped from the 2005�2006 NSQIP PUF had a higherpredictive value for both 30-day mortality and morbiditywhen applied prospectively to the 2007 and 2008 NSQIPPUFs than CPT categories and RVU (Table 1).
Multivariable logistic regression modelsTables 2 and 3 compare the AUROC for multivariablelogistic regression models constructed with stepwise back-ward elimination using the Wald statistic when preopera-tive variables, CPT categories, and RVU were included andwhen these data were supplemented with the SVM scores.Table 2 compares models with and without SVM scoresusing all preoperative variables, CPT categories, and RVU.Table 3 compares models with and without SVM scoresusing all preoperative variables (excluding laboratory re-sults), CPT categories, and RVU. In each case, the SVMscores were retained by stepwise backward elimination inthe multivariable model and led to an improvement in theAUROC. This improvement was not statistically signifi-cant for 30-day mortality, but significant for 30-daymorbidity.
DISCUSSIONThis study explores an SVM-based approach to developmodels that can translate individual CPT codes into pro-
Scores to RVU and CPT CategoriesMorbidity AUROC
p Value* SVM RVU CPT p Value*
�0.001 0.758 0.685 0.613 �0.001�0.001 0.750 0.701 0.622 �0.001�0.001 0.745 0.693 0.624 �0.001
PUF and 2008 PUF. Results reported on patients with both available CPT
VM AUROC versus RVU AUROC and SVM AUROC versus CPT AUROC
dural terminology; RVU, relative value unit; SVM, support vector machine.
Using Stepwise Backward Elimination Including PreoperativeVector Machine Scores Additionally Added
Value*
MorbidityAUROC(�SVM) R2
MorbidityAUROC(�SVM) R2 p Value*
0.23 0.794 0.278 0.807 0.304 �0.0010.81 0.792 0.272 0.803 0.292 �0.0010.56 0.791 0.263 0.811 0.283 �0.001
7 PUF and 2008 PUF.
Risk
2007
the S
ctedport
p
n 200
thout the support vector machine scores.e unit; SVM, support vector machine.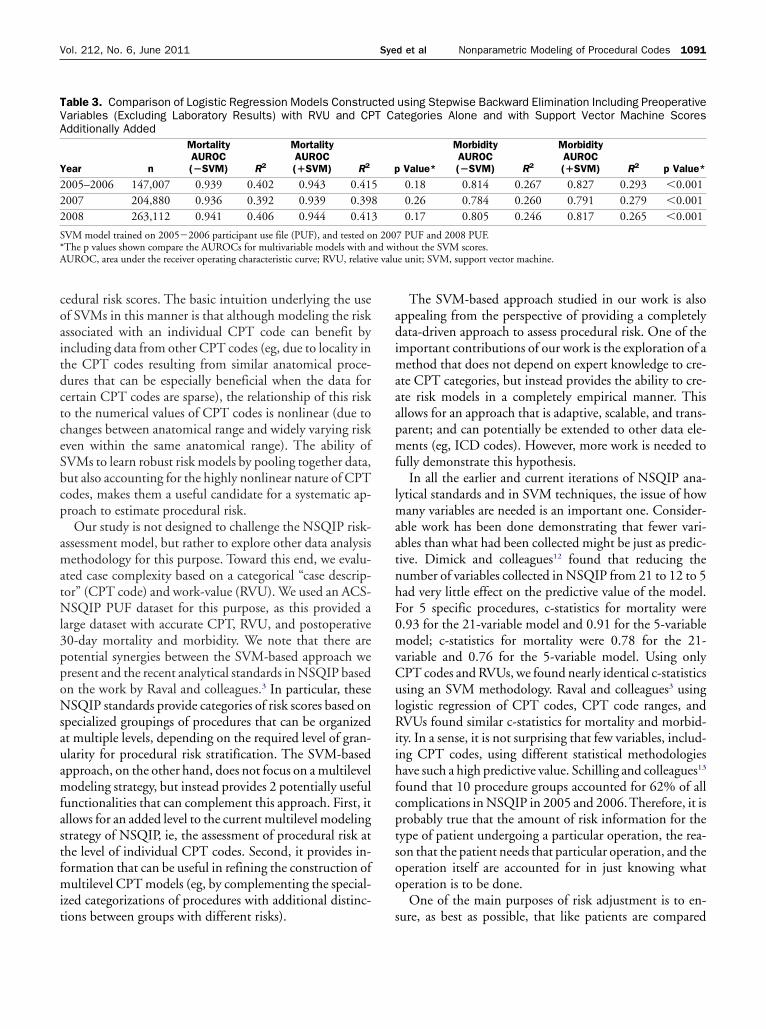
Nsauamfastfmit
adimaaapmf
lmaatnhF0mvCu
nd wie valu
1091Vol. 212, No. 6, June 2011 Syed et al Nonparametric Modeling of Procedural Codes
cedural risk scores. The basic intuition underlying the useof SVMs in this manner is that although modeling the riskassociated with an individual CPT code can benefit byincluding data from other CPT codes (eg, due to locality inthe CPT codes resulting from similar anatomical proce-dures that can be especially beneficial when the data forcertain CPT codes are sparse), the relationship of this riskto the numerical values of CPT codes is nonlinear (due tochanges between anatomical range and widely varying riskeven within the same anatomical range). The ability ofSVMs to learn robust risk models by pooling together data,but also accounting for the highly nonlinear nature of CPTcodes, makes them a useful candidate for a systematic ap-proach to estimate procedural risk.
Our study is not designed to challenge the NSQIP risk-assessment model, but rather to explore other data analysismethodology for this purpose. Toward this end, we evalu-ated case complexity based on a categorical “case descrip-tor” (CPT code) and work-value (RVU). We used an ACS-NSQIP PUF dataset for this purpose, as this provided alarge dataset with accurate CPT, RVU, and postoperative30-day mortality and morbidity. We note that there arepotential synergies between the SVM-based approach wepresent and the recent analytical standards in NSQIP basedon the work by Raval and colleagues.3 In particular, these
SQIP standards provide categories of risk scores based onpecialized groupings of procedures that can be organizedt multiple levels, depending on the required level of gran-larity for procedural risk stratification. The SVM-basedpproach, on the other hand, does not focus on a multilevelodeling strategy, but instead provides 2 potentially useful
unctionalities that can complement this approach. First, itllows for an added level to the current multilevel modelingtrategy of NSQIP, ie, the assessment of procedural risk athe level of individual CPT codes. Second, it provides in-ormation that can be useful in refining the construction ofultilevel CPT models (eg, by complementing the special-
zed categorizations of procedures with additional distinc-
Table 3. Comparison of Logistic Regression Models ConstruVariables (Excluding Laboratory Results) with RVU and CPAdditionally Added
Year n
MortalityAUROC(�SVM) R2
MortalityAUROC(�SVM) R2
2005–2006 147,007 0.939 0.402 0.943 0.412007 204,880 0.936 0.392 0.939 0.392008 263,112 0.941 0.406 0.944 0.41
SVM model trained on 2005�2006 participant use file (PUF), and tested o*The p values shown compare the AUROCs for multivariable models with aAUROC, area under the receiver operating characteristic curve; RVU, relativ
ions between groups with different risks).
The SVM-based approach studied in our work is alsoppealing from the perspective of providing a completelyata-driven approach to assess procedural risk. One of the
mportant contributions of our work is the exploration of aethod that does not depend on expert knowledge to cre-
te CPT categories, but instead provides the ability to cre-te risk models in a completely empirical manner. Thisllows for an approach that is adaptive, scalable, and trans-arent; and can potentially be extended to other data ele-ents (eg, ICD codes). However, more work is needed to
ully demonstrate this hypothesis.In all the earlier and current iterations of NSQIP ana-
ytical standards and in SVM techniques, the issue of howany variables are needed is an important one. Consider-
ble work has been done demonstrating that fewer vari-bles than what had been collected might be just as predic-ive. Dimick and colleagues12 found that reducing theumber of variables collected in NSQIP from 21 to 12 to 5ad very little effect on the predictive value of the model.or 5 specific procedures, c-statistics for mortality were.93 for the 21-variable model and 0.91 for the 5-variableodel; c-statistics for mortality were 0.78 for the 21-
ariable and 0.76 for the 5-variable model. Using onlyPT codes and RVUs, we found nearly identical c-statisticssing an SVM methodology. Raval and colleagues3 using
logistic regression of CPT codes, CPT code ranges, andRVUs found similar c-statistics for mortality and morbid-ity. In a sense, it is not surprising that few variables, includ-ing CPT codes, using different statistical methodologieshave such a high predictive value. Schilling and colleagues13
found that 10 procedure groups accounted for 62% of allcomplications in NSQIP in 2005 and 2006. Therefore, it isprobably true that the amount of risk information for thetype of patient undergoing a particular operation, the rea-son that the patient needs that particular operation, and theoperation itself are accounted for in just knowing whatoperation is to be done.
One of the main purposes of risk adjustment is to en-
using Stepwise Backward Elimination Including Preoperativetegories Alone and with Support Vector Machine Scores
Value*
MorbidityAUROC(�SVM) R2
MorbidityAUROC(�SVM) R2 p Value*
0.18 0.814 0.267 0.827 0.293 �0.0010.26 0.784 0.260 0.791 0.279 �0.0010.17 0.805 0.246 0.817 0.265 �0.001
7 PUF and 2008 PUF.thout the SVM scores.e unit; SVM, support vector machine.
ctedT Ca
p
583
n 200
sure, as best as possible, that like patients are compared
pasm
somcrrr
abl
1092 Syed et al Nonparametric Modeling of Procedural Codes J Am Coll Surg
with each other—as the aphorism goes, “apples to apples.”As these groups become more similar, that is, as riskadjustment makes compared groups more homogenous,any differences in outcomes will be more likely causedby differences in provider quality. How best to achievethis homogeneity by risk adjustment is being activelyresearched.
One of the weaknesses of the NSQIP model is lack ofprecise modeling for the complexity of an operation.Clearly, the physiological stress of breast lumpectomy is notthe same as an esophagectomy. Borja-Cacho and col-leagues14 showed that current NSQIP variables have low
redictive ability for major oncologic operations, whichre, in fact, more complex operations. We have demon-trated that in pancreatic operations, NSQIP models are auch poorer predictor of complications.15 Although we
understand the concerns about using c-statistics from thestandpoint of calibrating predictive models,16 these studiestill speak to the difficulty of risk assessment for complexperations. Attempts have been made to improve assess-ent risk in groups of operation types, such as pancreate-
tomy17 and colorectal operations.18 In addition, the oddsatios of the multiple logistic model imply a monotonicelationship of RVU values to risk of complication occur-ence.19 It might be that the relationship is nonlinear in
nature. Lastly, the multiple logistic model also assessesRVUs as an independent predictor. It might be that theeffects of patient-related comorbidities have different in-tensities of effect, depending on the operation done. Forexample, the effect of congestive heart failure on a patientundergoing an open abdominal aortic aneurysm repair isprobably a higher intensity on the occurrence of mortalitythan the same comorbidity on a cervical lymph node bi-opsy. Livingston and colleagues20 have previously pointedout that stepwise logistic regression has 2 main flaws. First,the technique can underestimate the importance of certaincombinations of variables. Second, it has the potential toemphasize spurious associations between independent anddependent variables by model overfitting. In fact, such in-teraction might be nonlinear in nature and, therefore, re-quire a nonparametric approach in analysis. One of theadvantages offered by methods like SVMs in this context isthat they provide a way to model the nonlinear relation-ships present in variables (eg, RVU or CPT codes) and tocreate new variables (eg, procedural risk scores) that canthen be integrated more readily into multivariable ap-proaches using existing statistical approaches.
We have demonstrated using the nonparametric artifi-cial intelligence technique of SVMs that CPT codes arebetter predictors of perioperative mortality and morbidity
than RVU values. However, this does not mean that RVUvalues cannot be useful if they provide additional informa-tion beyond CPT codes. Although the technique of SVM isadvanced, the results are congruent with “natural surgicalintelligence.” That is, most surgeons would find it primafacie believable that some operations carry with them ahigher risk of perioperative complications. In fact, thesecomplication risks can be independent of the patient’s co-morbidities. For example, the risk of bowel perforationduring an incisional hernia repair is not related to whetheror not the patient has a history of a myocardial infarctionwithin the last 6 months. This risk is purely related to theoperation performed and can vary from patient to patientand surgeon to surgeon, although the RVU value remainsconstant. Only by having knowledge of the operationwould a surgeon or artificial intelligence program take thisrisk into account, which corresponds to the newer ap-proaches that NSQIP will use.
Our use of SVMs is consistent with the increasing prev-alence of SVMs in artificial intelligence applications in dif-ferent disciplines. The popularity of SVMs is due to theirability to learn optimal decision boundaries from historicaldata rather than simply any particular boundary that sep-arates labeled training classes. This property makes SVMsrobust in predicting on previously unseen cases. In addi-tion, the ability of SVMs to find complex nonlinear sepa-rations of data by projecting them into a higher dimen-sional space using kernels makes it well-suited to learningnontrivial relationships, such as those between CPT codesand risk. Although other methods (eg, use of decision trees)also allow for nonlinear relations to be observed, the com-bination of nonlinear factoring and achieving a maximummargin boundary (and providing an approach that can po-tentially be extended to learn nontrivial hyperplanes ratherthan axis aligned partitions) led to our focus on SVM clas-sification. The disadvantage of SVMs in their basic form isthat they are more challenging to apply for cases where theoutcomes or labels are not binary (ie, for multiclass predic-tions). However, SVMs are well-suited for the applicationsbeing considered here, related to discriminating betweenpatients who did and did not experience adverse outcomes.In addition, there is an increasing body of work on extend-ing the general principles underlying SVMs to the multi-class case.21 SVMs can be just as readily applied to otherreas of medicine. For example, more accurate diagnosisased on multiple signs, symptoms, laboratory, and radio-
ogic findings and prediction of cancer risk.
CONCLUSIONSWe have demonstrated that the nonparametric artificialintelligence technique of SVM modeling can use informa-
tion in CPT codes to better predict perioperative morbid-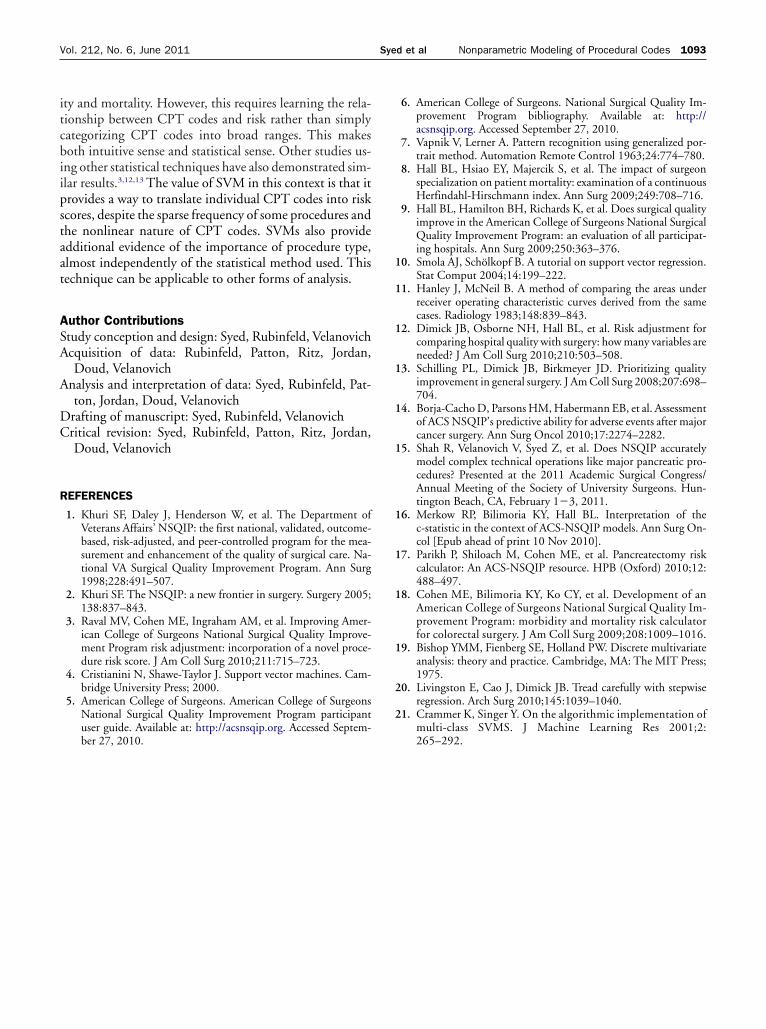
1093Vol. 212, No. 6, June 2011 Syed et al Nonparametric Modeling of Procedural Codes
ity and mortality. However, this requires learning the rela-tionship between CPT codes and risk rather than simplycategorizing CPT codes into broad ranges. This makesboth intuitive sense and statistical sense. Other studies us-ing other statistical techniques have also demonstrated sim-ilar results.3,12,13 The value of SVM in this context is that itprovides a way to translate individual CPT codes into riskscores, despite the sparse frequency of some procedures andthe nonlinear nature of CPT codes. SVMs also provideadditional evidence of the importance of procedure type,almost independently of the statistical method used. Thistechnique can be applicable to other forms of analysis.
Author ContributionsStudy conception and design: Syed, Rubinfeld, VelanovichAcquisition of data: Rubinfeld, Patton, Ritz, Jordan,
Doud, VelanovichAnalysis and interpretation of data: Syed, Rubinfeld, Pat-
ton, Jordan, Doud, VelanovichDrafting of manuscript: Syed, Rubinfeld, VelanovichCritical revision: Syed, Rubinfeld, Patton, Ritz, Jordan,
Doud, Velanovich
REFERENCES
1. Khuri SF, Daley J, Henderson W, et al. The Department ofVeterans Affairs’ NSQIP: the first national, validated, outcome-based, risk-adjusted, and peer-controlled program for the mea-surement and enhancement of the quality of surgical care. Na-tional VA Surgical Quality Improvement Program. Ann Surg1998;228:491–507.
2. Khuri SF. The NSQIP: a new frontier in surgery. Surgery 2005;138:837–843.
3. Raval MV, Cohen ME, Ingraham AM, et al. Improving Amer-ican College of Surgeons National Surgical Quality Improve-ment Program risk adjustment: incorporation of a novel proce-dure risk score. J Am Coll Surg 2010;211:715–723.
4. Cristianini N, Shawe-Taylor J. Support vector machines. Cam-bridge University Press; 2000.
5. American College of Surgeons. American College of SurgeonsNational Surgical Quality Improvement Program participantuser guide. Available at: http://acsnsqip.org. Accessed Septem-
ber 27, 2010.6. American College of Surgeons. National Surgical Quality Im-provement Program bibliography. Available at: http://acsnsqip.org. Accessed September 27, 2010.
7. Vapnik V, Lerner A. Pattern recognition using generalized por-trait method. Automation Remote Control 1963;24:774–780.
8. Hall BL, Hsiao EY, Majercik S, et al. The impact of surgeonspecialization on patient mortality: examination of a continuousHerfindahl-Hirschmann index. Ann Surg 2009;249:708–716.
9. Hall BL, Hamilton BH, Richards K, et al. Does surgical qualityimprove in the American College of Surgeons National SurgicalQuality Improvement Program: an evaluation of all participat-ing hospitals. Ann Surg 2009;250:363–376.
10. Smola AJ, Schölkopf B. A tutorial on support vector regression.Stat Comput 2004;14:199–222.
11. Hanley J, McNeil B. A method of comparing the areas underreceiver operating characteristic curves derived from the samecases. Radiology 1983;148:839–843.
12. Dimick JB, Osborne NH, Hall BL, et al. Risk adjustment forcomparing hospital quality with surgery: how many variables areneeded? J Am Coll Surg 2010;210:503–508.
13. Schilling PL, Dimick JB, Birkmeyer JD. Prioritizing qualityimprovement in general surgery. J Am Coll Surg 2008;207:698–704.
14. Borja-Cacho D, Parsons HM, Habermann EB, et al. Assessmentof ACS NSQIP’s predictive ability for adverse events after majorcancer surgery. Ann Surg Oncol 2010;17:2274–2282.
15. Shah R, Velanovich V, Syed Z, et al. Does NSQIP accuratelymodel complex technical operations like major pancreatic pro-cedures? Presented at the 2011 Academic Surgical Congress/Annual Meeting of the Society of University Surgeons. Hun-tington Beach, CA, February 1�3, 2011.
16. Merkow RP, Bilimoria KY, Hall BL. Interpretation of thec-statistic in the context of ACS-NSQIP models. Ann Surg On-col [Epub ahead of print 10 Nov 2010].
17. Parikh P, Shiloach M, Cohen ME, et al. Pancreatectomy riskcalculator: An ACS-NSQIP resource. HPB (Oxford) 2010;12:488–497.
18. Cohen ME, Bilimoria KY, Ko CY, et al. Development of anAmerican College of Surgeons National Surgical Quality Im-provement Program: morbidity and mortality risk calculatorfor colorectal surgery. J Am Coll Surg 2009;208:1009–1016.
19. Bishop YMM, Fienberg SE, Holland PW. Discrete multivariateanalysis: theory and practice. Cambridge, MA: The MIT Press;1975.
20. Livingston E, Cao J, Dimick JB. Tread carefully with stepwiseregression. Arch Surg 2010;145:1039–1040.
21. Crammer K, Singer Y. On the algorithmic implementation ofmulti-class SVMS. J Machine Learning Res 2001;2:
265–292.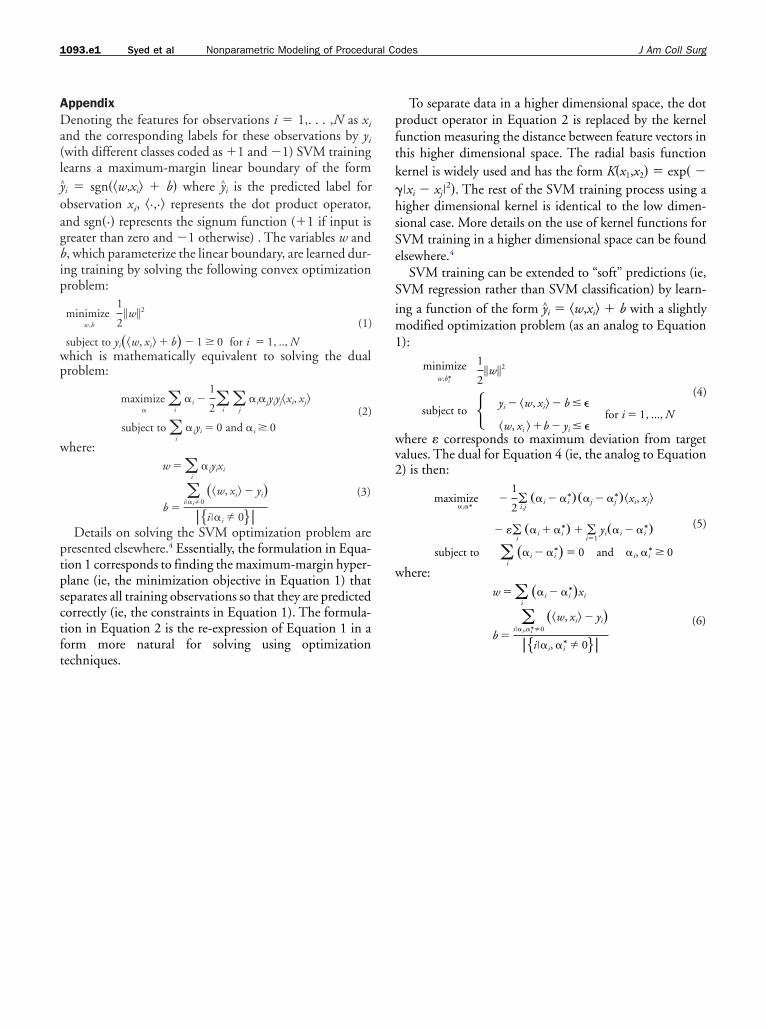
tpsctft
pftk
hsSe
1093.e1 Syed et al Nonparametric Modeling of Procedural Codes J Am Coll Surg
AppendixDenoting the features for observations i � 1,. . . ,N as xi
and the corresponding labels for these observations by yi
(with different classes coded as �1 and �1) SVM traininglearns a maximum-margin linear boundary of the formy^i � sgn��w,xi� � b� where y^i is the predicted label forobservation xi, �·,·� represents the dot product operator,and sgn�·� represents the signum function (�1 if input isgreater than zero and �1 otherwise) . The variables w andb, which parameterize the linear boundary, are learned dur-ing training by solving the following convex optimizationproblem:
minimizew,b
1
2�w�2
subject to yi��w, xi� � b� � 1 � 0 for i � 1, .., N
(1)
which is mathematically equivalent to solving the dualproblem:
maximize�
�i
�i �1
2�i�
j�i�jyiyj�xi, xj�
subject to �i
�iyi � 0 and �i � 0(2)
where:w � �
i�iyixi
b ��
i��i0��w, xi� � yi�
��i��i 0��
(3)
Details on solving the SVM optimization problem arepresented elsewhere.4 Essentially, the formulation in Equa-ion 1 corresponds to finding the maximum-margin hyper-lane (ie, the minimization objective in Equation 1) thateparates all training observations so that they are predictedorrectly (ie, the constraints in Equation 1). The formula-ion in Equation 2 is the re-expression of Equation 1 in aorm more natural for solving using optimization
echniques.To separate data in a higher dimensional space, the dotroduct operator in Equation 2 is replaced by the kernelunction measuring the distance between feature vectors inhis higher dimensional space. The radial basis functionernel is widely used and has the form K�x1,x2� � exp� �
��xi � xj�2�. The rest of the SVM training process using a
igher dimensional kernel is identical to the low dimen-ional case. More details on the use of kernel functions forVM training in a higher dimensional space can be foundlsewhere.4
SVM training can be extended to “soft” predictions (ie,SVM regression rather than SVM classification) by learn-ing a function of the form y^i � �w,xi� � b with a slightlymodified optimization problem (as an analog to Equation1):
minimizew,bi
∗
1
2�w�2
subject to � yi � �w, xi� � b �
�w, xi � �b � yi �for i � 1, ..., N
(4)
where � corresponds to maximum deviation from targetvalues. The dual for Equation 4 (ie, the analog to Equation2) is then:
maximize�,�∗
�1
2�i,j
��i � �i∗���j � �j
∗��xi, xj�
� ��i��i � �i
∗� � �i�1
yi��i � �i∗�
subject to �i
��i � �i∗� � 0 and �i, �i
∗ � 0
(5)
where:w � �
i��i � �i
∗�xi
b �
�i��i,�i
∗0��w, xi� � yi�
��i��i, �i∗ 0��
(6)