Embed Size (px)
Citation preview
Using Pattern Matching to inspect packaging prints
A typical task in print inspection is to identify a product out of multiple variants and then to further
inspect the integrity of the packaging (presence of labels, printing errors, etc.).
Even a small product palette can quickly lead to hundreds of packaging subtypes, especially in the
food industry where seasonal and regional ad campaigns are common and suppliers are often
switched. This is why the systems usually have a learning phase, during which identifiers and
inspection rules are stored in a database, and an operation phase, during which pattern matching
algorithms are used for presence and position detection.
Most image processing libraries provide pattern matching algorithms both based on normalized-
cross-correlation and on geometric descriptors. While the latter are advantageous when looking for
scaled or partially occluded templates and can be quick, they fail with low-contrast images and
gradients. Because print designs can be considered completely random, normalized cross-correlation
based algorithms are the standard choice of solution.
The concept
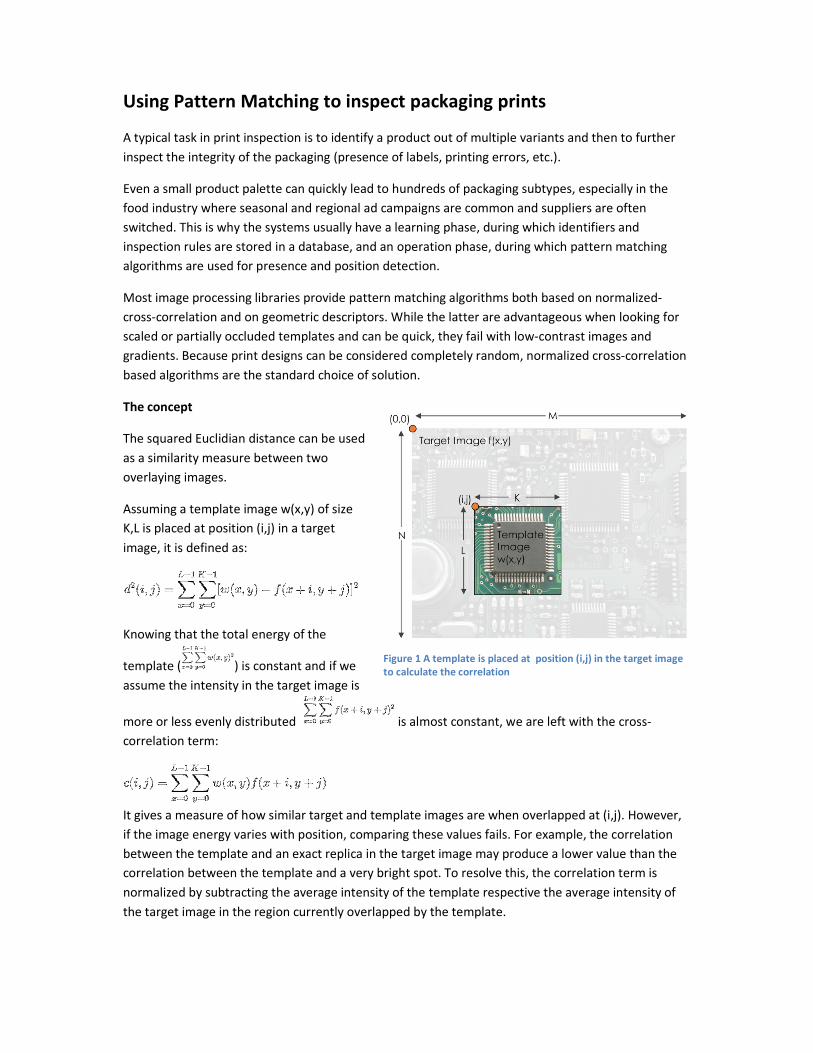
The squared Euclidian distance can be used
as a similarity measure between two
overlaying images.
Assuming a template image w(x,y) of size
K,L is placed at position (i,j) in a target
image, it is defined as:
Knowing that the total energy of the
template ( ) is constant and if we
assume the intensity in the target image is
more or less evenly distributed is almost constant, we are left with the cross-
correlation term:
It gives a measure of how similar target and template images are when overlapped at (i,j). However,
if the image energy varies with position, comparing these values fails. For example, the correlation
between the template and an exact replica in the target image may produce a lower value than the
correlation between the template and a very bright spot. To resolve this, the correlation term is
normalized by subtracting the average intensity of the template respective the average intensity of
the target image in the region currently overlapped by the template.
Figure 1 A template is placed at position (i,j) in the target image
to calculate the correlation
If a template is rotated by a very small angle (<5%), normalized cross-correlation algorithms can
typically detect it with a lowered matching score. Rotations of higher degrees require different
methods, which are all more or less sophisticated version of performing the same calculations
multiple times on rotated images.
For example, the NI Vision library samples images alongside a rotation-invariant path, such as a
circle. Rotating the image is then equivalent to shifting the array that contains the sample points’
intensities. The correlation is then defined as a cyclic correlation: A sample pixel taken from the
image is correlated with the respective pixel taken from the target, the template sample array is
shifted by one and correlated again, etc., until the original sample pixel (and rotation angle) is
reached. The maximum correlation value of this sequence is used for evaluation of the match, and its
index gives information about the angle. Typically, multiple non-overlapping search circles are
considered from one template.
Speeding up the process
Normalized cross-correlation is computationally expensive. To speed it up, sub-sampled images and
templates are used for a fast-pass search. Then the results are refined with localized searches in the
high-resolution images.
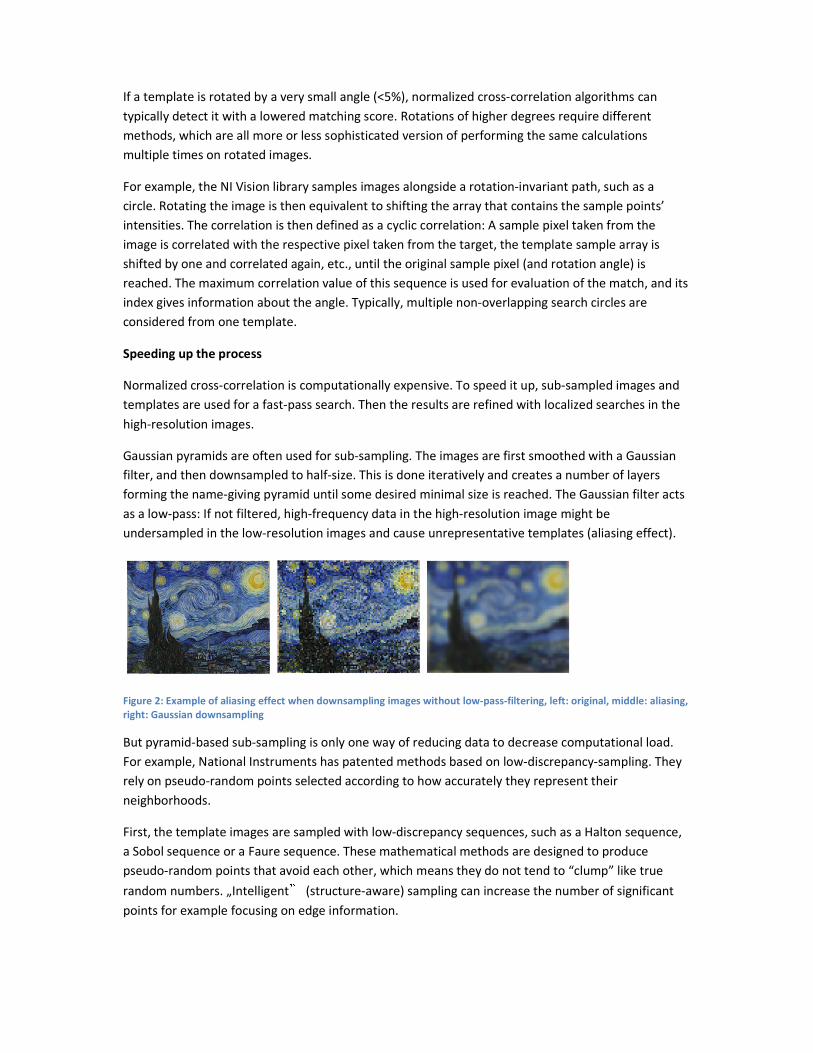
Gaussian pyramids are often used for sub-sampling. The images are first smoothed with a Gaussian
filter, and then downsampled to half-size. This is done iteratively and creates a number of layers
forming the name-giving pyramid until some desired minimal size is reached. The Gaussian filter acts
as a low-pass: If not filtered, high-frequency data in the high-resolution image might be
undersampled in the low-resolution images and cause unrepresentative templates (aliasing effect).
Figure 2: Example of aliasing effect when downsampling images without low-pass-filtering, left: original, middle: aliasing,
right: Gaussian downsampling
But pyramid-based sub-sampling is only one way of reducing data to decrease computational load.
For example, National Instruments has patented methods based on low-discrepancy-sampling. They
rely on pseudo-random points selected according to how accurately they represent their
neighborhoods.
First, the template images are sampled with low-discrepancy sequences, such as a Halton sequence,
a Sobol sequence or a Faure sequence. These mathematical methods are designed to produce
pseudo-random points that avoid each other, which means they do not tend to “clump” like true
random numbers. „Intelligent” (structure-aware) sampling can increase the number of significant
points for example focusing on edge information.
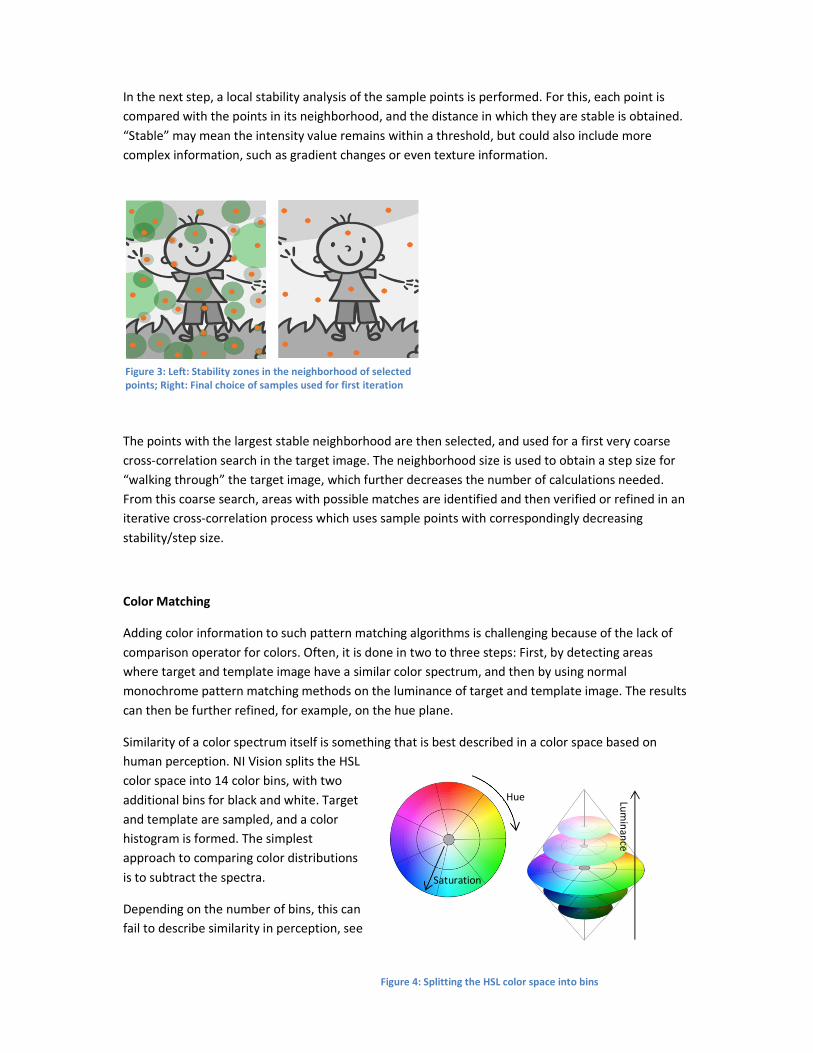
In the next step, a local stability analysis of the sample points is performed. For this, each point is
compared with the points in its neighborhood, and the distance in which they are stable is obtained.
“Stable” may mean the intensity value remains within a threshold, but could also include more
complex information, such as gradient changes or even texture information.
The points with the largest stable neighborhood are then selected, and used for a first very coarse
cross-correlation search in the target image. The neighborhood size is used to obtain a step size for
“walking through” the target image, which further decreases the number of calculations needed.
From this coarse search, areas with possible matches are identified and then verified or refined in an
iterative cross-correlation process which uses sample points with correspondingly decreasing
stability/step size.
Color Matching
Adding color information to such pattern matching algorithms is challenging because of the lack of
comparison operator for colors. Often, it is done in two to three steps: First, by detecting areas
where target and template image have a similar color spectrum, and then by using normal
monochrome pattern matching methods on the luminance of target and template image. The results
can then be further refined, for example, on the hue plane.
Similarity of a color spectrum itself is something that is best described in a color space based on
human perception. NI Vision splits the HSL
color space into 14 color bins, with two
additional bins for black and white. Target
and template are sampled, and a color
histogram is formed. The simplest
approach to comparing color distributions
is to subtract the spectra.
Depending on the number of bins, this can
fail to describe similarity in perception, see
Figure 3: Left: Stability zones in the neighborhood of selected
points; Right: Final choice of samples used for first iteration
Hue
Saturation
Lum
ina
nce
Figure 4: Splitting the HSL color space into bins
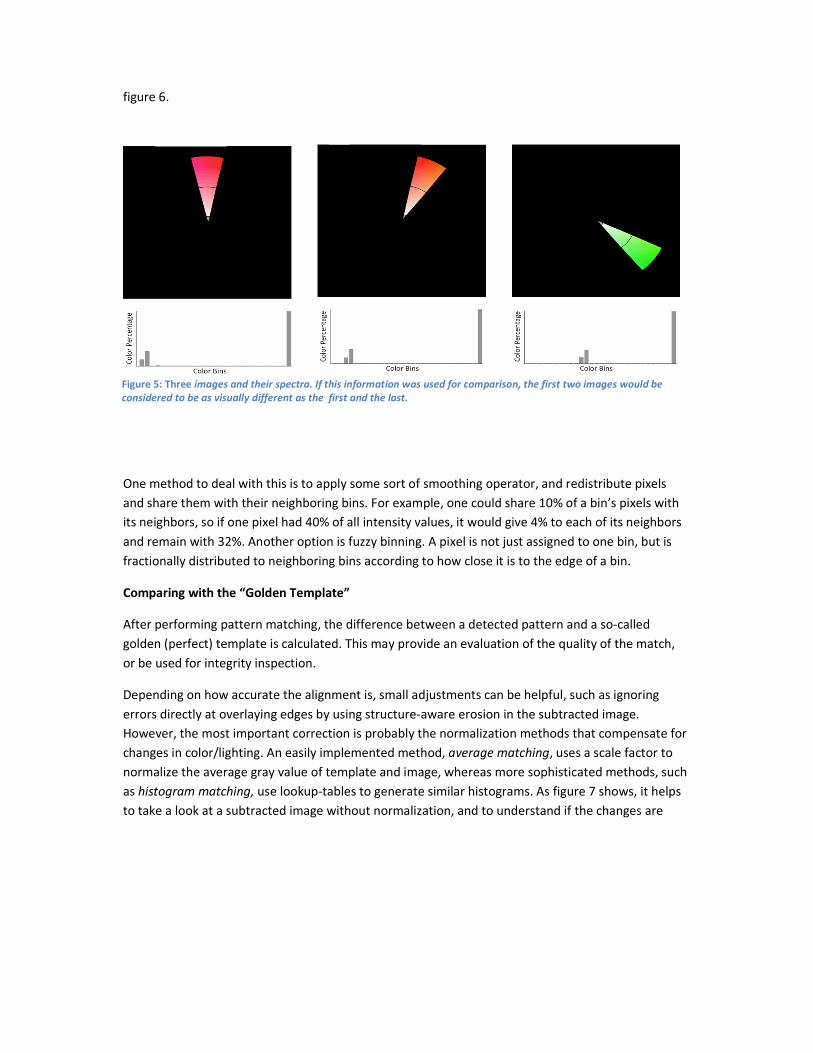
figure 6.
One method to deal with this is to apply some sort of smoothing operator, and redistribute pixels
and share them with their neighboring bins. For example, one could share 10% of a bin’s pixels with
its neighbors, so if one pixel had 40% of all intensity values, it would give 4% to each of its neighbors
and remain with 32%. Another option is fuzzy binning. A pixel is not just assigned to one bin, but is
fractionally distributed to neighboring bins according to how close it is to the edge of a bin.
Comparing with the “Golden Template”
After performing pattern matching, the difference between a detected pattern and a so-called
golden (perfect) template is calculated. This may provide an evaluation of the quality of the match,
or be used for integrity inspection.
Depending on how accurate the alignment is, small adjustments can be helpful, such as ignoring
errors directly at overlaying edges by using structure-aware erosion in the subtracted image.
However, the most important correction is probably the normalization methods that compensate for
changes in color/lighting. An easily implemented method, average matching, uses a scale factor to
normalize the average gray value of template and image, whereas more sophisticated methods, such
as histogram matching, use lookup-tables to generate similar histograms. As figure 7 shows, it helps
to take a look at a subtracted image without normalization, and to understand if the changes are
Figure 5: Three images and their spectra. If this information was used for comparison, the first two images would be
considered to be as visually different as the first and the last.
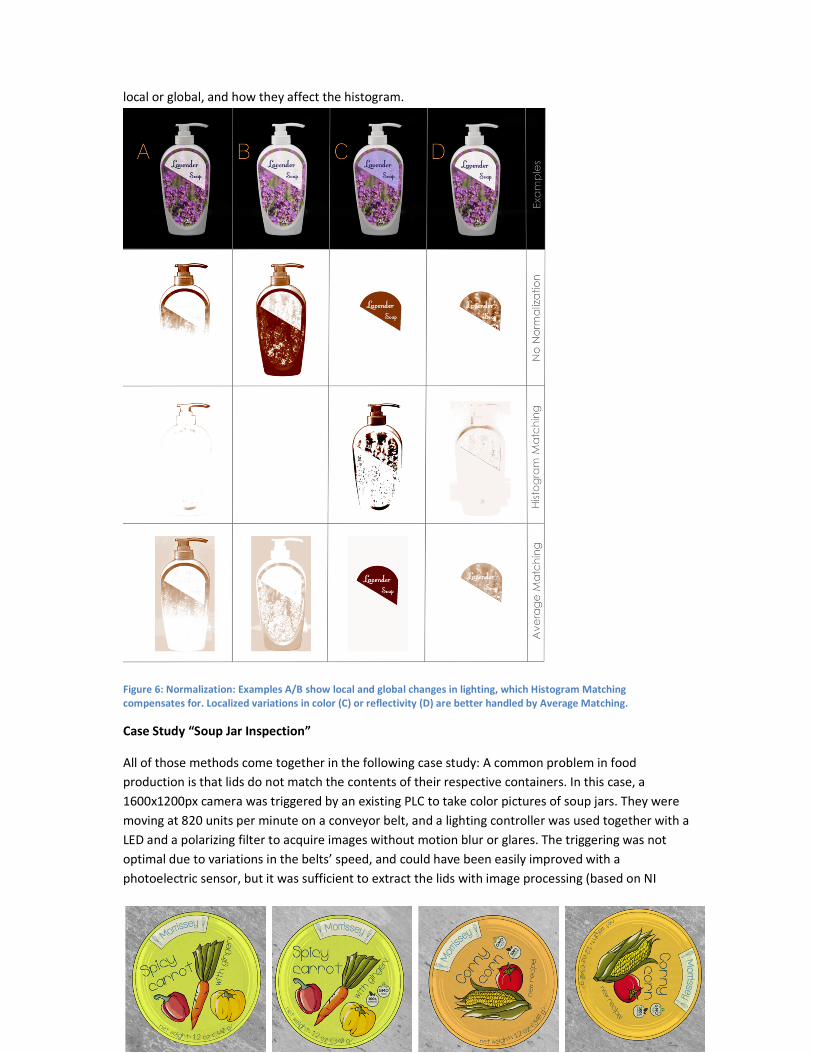
local or global, and how they affect the histogram.
Figure 6: Normalization: Examples A/B show local and global changes in lighting, which Histogram Matching
compensates for. Localized variations in color (C) or reflectivity (D) are better handled by Average Matching.
Case Study “Soup Jar Inspection”
All of those methods come together in the following case study: A common problem in food
production is that lids do not match the contents of their respective containers. In this case, a
1600x1200px camera was triggered by an existing PLC to take color pictures of soup jars. They were
moving at 820 units per minute on a conveyor belt, and a lighting controller was used together with a
LED and a polarizing filter to acquire images without motion blur or glares. The triggering was not
optimal due to variations in the belts’ speed, and could have been easily improved with a
photoelectric sensor, but it was sufficient to extract the lids with image processing (based on NI
Vision).
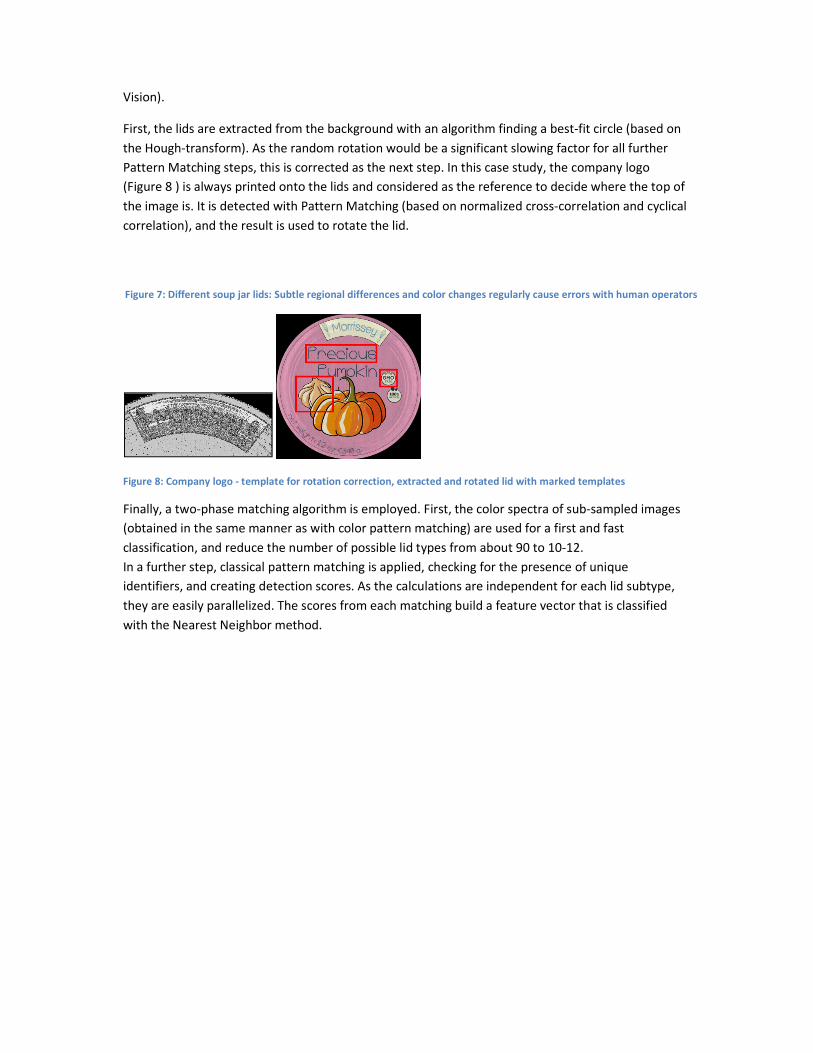
First, the lids are extracted from the background with an algorithm finding a best-fit circle (based on
the Hough-transform). As the random rotation would be a significant slowing factor for all further
Pattern Matching steps, this is corrected as the next step. In this case study, the company logo
(Figure 8 ) is always printed onto the lids and considered as the reference to decide where the top of
the image is. It is detected with Pattern Matching (based on normalized cross-correlation and cyclical
correlation), and the result is used to rotate the lid.
Figure 8: Company logo - template for rotation correction, extracted and rotated lid with marked templates
Finally, a two-phase matching algorithm is employed. First, the color spectra of sub-sampled images
(obtained in the same manner as with color pattern matching) are used for a first and fast
classification, and reduce the number of possible lid types from about 90 to 10-12.
In a further step, classical pattern matching is applied, checking for the presence of unique
identifiers, and creating detection scores. As the calculations are independent for each lid subtype,
they are easily parallelized. The scores from each matching build a feature vector that is classified
with the Nearest Neighbor method.
Figure 7: Different soup jar lids: Subtle regional differences and color changes regularly cause errors with human operators