Embed Size (px)
Citation preview

®
© 2008 IBM Corporation
Using Metrics to Understand Agile Project Health
…and of other projects too…
Anthony [email protected]

IBM Software Group | Rational software
2
Agenda
� Are your current measures good enough?
� The Big Five
� Measuring a project
� Measuring a program
� Measuring “throwdowns”
� Measuring ourselves

IBM Software Group | Rational software
3
Are your current measures good enough?
� Do you have actuals?
� Do you have estimates? …over time?
� Do the metric owners trust the data? Do the teams? Do the executives?
� Have you defined red, yellow and green for all of your metrics?
�Do you have default corrective action tasks for red and yellow metrics?
�How long are you in yellow and red? Bad: Green 90%, then bam! Red. No yellow…
� Do you have appropriately balanced “counter measures?”
� Do you measure the cost of cancelled projects?
� Do you measure the number of successful, partially successful and failed projects?
� Can you draw “goal lines” on a dashboard that if hit pay for the cost of innovation?
� Can you measure the winner of an innovation throwdown?
� Can you produce evidence of all of the above in two weeks or less?

IBM Software Group | Rational software
4
Agenda
� Are your current measures good enough?
� The Big Five
� Measuring a project
� Measuring a program
� Measuring “throwdowns”
� Measuring ourselves

IBM Software Group | Rational software
5
The Big Five
� Productivity
� Quality
� Predictability
� Job Satisfaction
� Innovation
� Are there measures you care about that are missing here?
� Are these the right measures?

IBM Software Group | Rational software
6
The Big Five – One Level Deeper
� Productivity – how much do we get done?
� Time, cost, scope
� Quality – how good is it?
� Defects, value
� Compliance violations
� Customer satisfaction
� Predictability – how long before we are “right” about productivity and quality?
� Accuracy, Time to accuracy
� Job Satisfaction – which innovations do the employees like and trust?
� Survey, Project Results Satisfaction, Retention, Overtime
� Innovation – which innovations improve Productivity, Quality, Predictability and Satisfaction?
� Throwdown Metrics
� Skill Growth
� Process Improvement Requests

IBM Software Group | Rational software
7
Dashboards
� Project dashboard – how is my team doing on one project?
� Program dashboard – how is my group of related teams doing?
� Portfolio dashboard – are we investing our precious resources in the right things?
� Personal dashboard – how am I doing compared to the team?
� All dashboards use the big five metrics

IBM Software Group | Rational software
8
Agenda
� Are your current measures good enough?
� The Big Five
� Measuring a project
� Measuring a program
� Measuring “throwdowns”
� Measuring ourselves

IBM Software Group | Rational software
9
How do we use the big five on a single project?
� Productivity
� Quality
� Predictability
� Job Satisfaction
� Innovation

IBM Software Group | Rational software
10
Where does “Burndown” fit in?
� Burndown Charts
�Release burndown vs. iteration burndown?
�Stories vs. tasks?
�Hours burndown?
� Our teams:
�Release burndown based on story points
�Task burndown based on number of tasks, NOT HOURS
�No hours burndown tracked

IBM Software Group | Rational software
11
Understanding Velocity “Lift”
� Looking across many projects, how much does velocity go up from iteration 1 to 2 to 3 and so on?
� When does stability hit?
� In our history, most “new to agile” teams see a lift of 4 to 5 times velocity from iteration 1 to 2. Sometimes not until iteration 3.
� Because of this, we can estimate the total possible scope for a new team right after iteration 1:
�V_future = V_Iteration_1 * 4
�Likely scope = V_future * (iterations_in_release – 1)
� Find your lift

IBM Software Group | Rational software
12
Project Level Dashboard: Productivity and Predictability
Scope: Velocity
0
20
40
60
80
100
120
140
160
I1 I2 I3 I4 I5
Po
ints
Co
mp
lete
d
Predictability: Relase Burndown
0
500
1000
1500
2000
1 2 3 4 5 6 7 8 9
Iteration
Sto
ry P
oin
ts Total / Stability
Actual Burn
Ideal Burn
How is this team doing?

IBM Software Group | Rational software
13
Adding cost, time and plan vs. actual

IBM Software Group | Rational software
14
Tasks and Task Burndown
� In addition to stories, there are tasks
�Tasks are details on how to get a story done
�We do not get any “credit” for doing tasks as they don’t have story points
�We put tasks on our iteration backlog so we don’t forget to do things
�You can estimate hours for tasks however
� This takes a lot of time (reduces productivity)
� The estimates are frequently wrong
� If we just count the number of tasks instead, we save all that time and get brilliant data
� We can graph task burndown (or task hours burndown)
�NOT a productivity measure
� IS a predictability measure

IBM Software Group | Rational software
15
How do we use task burndown for predictability?
Iteration 1 Task Burndown
0
20
40
60
80
100
120
140
1 3 5 7 9 11 13 15 17 19
Day
Total / Stability
Actual Burn
Ideal Burn
� How good was this iteration?
�How many tasks did they plan?
�How many tasks did they complete?
�How stable was their plan?
�How stable was their actual burn?

IBM Software Group | Rational software
16
Did they get better or worse in iteration 2?
Iteration 1 Task Burndow n
0
20
40
60
80
100
120
140
1 3 5 7 9 11 13 15 17 19
D ay
Total / Stability
Actual Burn
Ideal Burn
Iteration 2 Task Burndown
0
20
40
60
80
100
120
1 3 5 7 9 11 13 15 17 19
D ay
Total / Stability
Actual Burn
Ideal Burn

IBM Software Group | Rational software
17
How does iteration 3 compare?
Iteration 1 Task Burndow n
0
20
40
60
80
100
120
140
1 3 5 7 9 11 13 15 17 19
D ay
Total / Stability
Actual Burn
Ideal Burn
Iteration 2 Task Burndow n
0
20
40
60
80
100
120
1 3 5 7 9 11 13 15 17 19
D ay
Total / Stability
Actual Burn
Ideal Burn
Iteration 3 Task Burndow n
0
20
40
60
80
100
120
140
160
1 3 5 7 9 11 13 15 17 19
D ay
Total / Stability
Actual Burn
Ideal Burn

IBM Software Group | Rational software
18
And iteration 4?
Iteration 1 Task Burndow n
0
20
40
60
80
100
120
140
1 3 5 7 9 11 13 15 17 19
D ay
Total / Stability
Actual Burn
Ideal Burn
Iteration 2 Task Burndow n
0
20
40
60
80
100
120
1 3 5 7 9 11 13 15 17 19
D ay
Total / Stability
Actual Burn
Ideal Burn
Iteration 3 Task Burndow n
0
20
40
60
80
100
120
140
160
1 3 5 7 9 11 13 15 17 19
D ay
Total / Stability
Actual Burn
Ideal Burn
Iteration 4 Task Burndow n
0
20
40
60
80
100
120
1 3 5 7 9 11 13 15 17 19
D ay
Total / Stability
Actual Burn
Ideal Burn

IBM Software Group | Rational software
19
And finally… iteration 5?
Iteration 1 Task Burndow n
0
20
40
60
80
100
120
140
1 3 5 7 9 11 13 15 17 19
D ay
Total / Stability
Actual Burn
Ideal Burn
Iteration 2 Task Burndow n
0
20
40
60
80
100
120
1 3 5 7 9 11 13 15 17 19
D ay
Total / Stability
Actual Burn
Ideal Burn
Iteration 3 Task Burndown
0
20
40
60
80
100
120
140
160
1 3 5 7 9 11 13 15 17 19
Day
Total / Stability
Actual Burn
Ideal Burn
Iteration 4 Task Burndow n
0
20
40
60
80
100
120
1 3 5 7 9 11 13 15 17 19
D ay
Total / Stability
Actual Burn
Ideal Burn
Iteration 5 Task Burndow n
0
20
40
60
80
100
120
140
160
180
1 3 5 7 9 11 13 15 17 19
D ay
Total / Stability
Actual Burn
Ideal Burn

IBM Software Group | Rational software
20
How do we use the big five on a single project?
� Productivity
� Quality
� Predictability
� Job Satisfaction
� Innovation

IBM Software Group | Rational software
21
Quality: Defect Measures
� Pre-production Quality
�Defect Density
�Test Effectiveness
� What about post-production quality?
�A focus of program, product and portfolio management, not project management
� CRUD – Customer Reported in-Use Defects
� WAI – Works As Intended
� CNR – Can Not Reproduce

IBM Software Group | Rational software
22
Quality: Value Measures
� End of Iteration Survey
� Dynamic Portfolio Position

IBM Software Group | Rational software
23
Quality: Compliance Measures
� Internal Process Violations
� External Process Violations (audit findings)

IBM Software Group | Rational software
24
Project Level Dashboard: Quality

IBM Software Group | Rational software
25
How do we use the big five on a single project?
� Productivity
� Quality
� Predictability
� Job Satisfaction
� Innovation

IBM Software Group | Rational software
26
P: Job Satisfaction
� Survey
�Do you feel the innovation is being done correctly?
�Do you feel the innovation is directly causing improvements to the big five measures?
�Do you like your job more or less when including this innovation in your work?
�Has this innovation affected your overtime hours?
�Has this innovation increased the odds of retaining you as an employee?
�What percentage of your projects have been successful? Partially successful? Failed?
� Are you satisfied with this percentage?
�Will this innovation lead to more successful projects than in your past?
� Retention
� Overtime hours
� Project Results Satisfaction

IBM Software Group | Rational software
27
How do we use the big five on a single project?
� Productivity
� Quality
� Predictability
� Job Satisfaction
� Innovation
IBM Software Group | Rational software
28
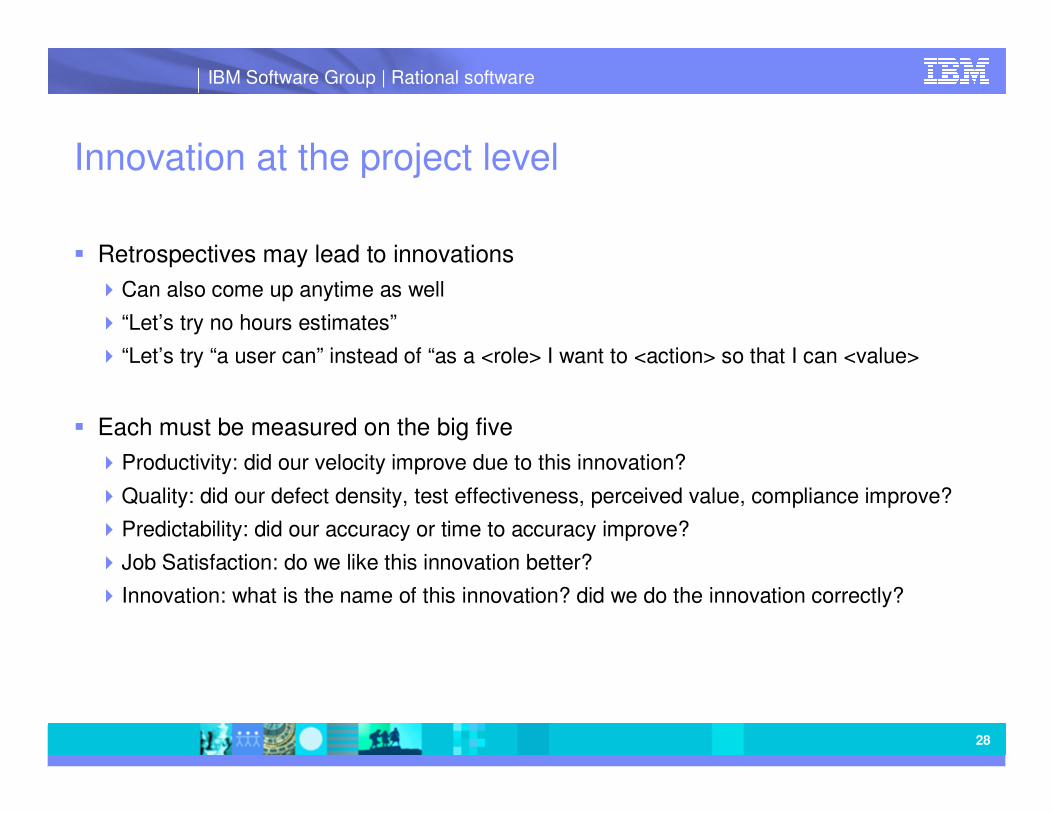
Innovation at the project level
� Retrospectives may lead to innovations
�Can also come up anytime as well
� “Let’s try no hours estimates”
� “Let’s try “a user can” instead of “as a <role> I want to <action> so that I can <value>
� Each must be measured on the big five
�Productivity: did our velocity improve due to this innovation?
�Quality: did our defect density, test effectiveness, perceived value, compliance improve?
�Predictability: did our accuracy or time to accuracy improve?
�Job Satisfaction: do we like this innovation better?
� Innovation: what is the name of this innovation? did we do the innovation correctly?

IBM Software Group | Rational software
29
Agenda
� Are your current measures good enough?
� The Big Five
� Measuring a project
� Measuring a program
� Measuring “throwdowns”
� Measuring ourselves

IBM Software Group | Rational software
30
Define Red, Yellow, Green for every metric
� Example: Productivity:
� Scope:
� Green: predicted_capacity >= release_backlog
� Yellow: not green, <I3 or <1/3 timeline
� Red: not green, >=I3 or >=1/3 timeline
� Action: remove velocity impediments, cap release backlog, add iterations, cancel project
� Velocity:
� Green: velocity trend flat or up
� Yellow: trending down 1 iteration
� Red: trending down 3+ iterations
� Action: remove velocity impediments
� Cost:
� Green: cost <= plan
� Yellow: cost up to 110% of plan
� Red: cost up to 120% of plan
� Action: remove cost impediments, reduce release backlog, add budget, cancel project

IBM Software Group | Rational software
31
Program Dashboard with Drill Down
� Know at a glance which projects to look at
� Drill down for details and for default corrective action tasks for red items

IBM Software Group | Rational software
32
Agenda
� Are your current measures good enough?
� The Big Five
� Measuring a project
� Measuring a program
� Measuring “throwdowns”
� Measuring ourselves

IBM Software Group | Rational software
33
What do we compare against?
� Vs. Historical
�Pre-Requisite: Historical data exists or can be mined
� If still not captured in next four weeks, admit it can’t be done
� Vs. Self
�Pre-Requisite: Iterative methodology or multiple releases
� Vs. Current Traditional
�Pre-Requisite: Similar project(s) can be identified and will cooperate
� Vs. Industry Benchmark
�Pre-Requisite: adequate benchmark can be found
� Vs. Plan
�Pre-Requisite: a plan must exist and be trusted or adjusted based on history
IBM Software Group | Rational software
34
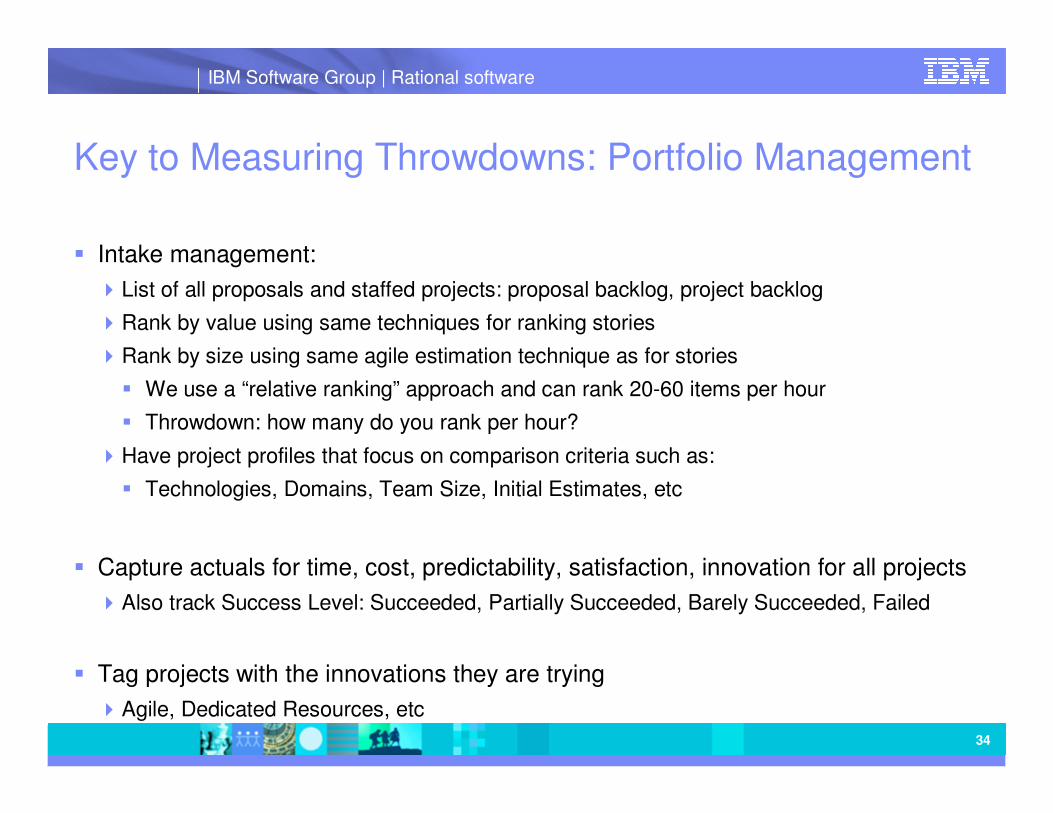
Key to Measuring Throwdowns: Portfolio Management
� Intake management:
�List of all proposals and staffed projects: proposal backlog, project backlog
�Rank by value using same techniques for ranking stories
�Rank by size using same agile estimation technique as for stories
� We use a “relative ranking” approach and can rank 20-60 items per hour
� Throwdown: how many do you rank per hour?
�Have project profiles that focus on comparison criteria such as:
� Technologies, Domains, Team Size, Initial Estimates, etc
� Capture actuals for time, cost, predictability, satisfaction, innovation for all projects
�Also track Success Level: Succeeded, Partially Succeeded, Barely Succeeded, Failed
� Tag projects with the innovations they are trying
�Agile, Dedicated Resources, etc
IBM Software Group | Rational software
35
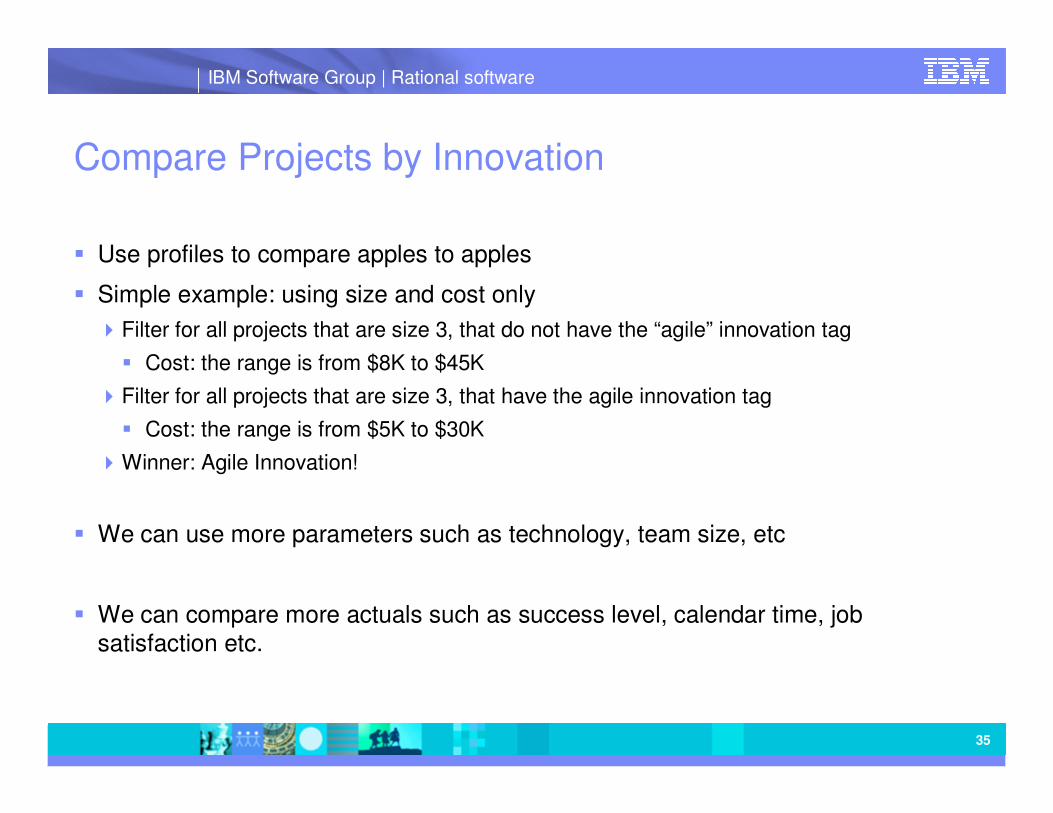
Compare Projects by Innovation
� Use profiles to compare apples to apples
� Simple example: using size and cost only
�Filter for all projects that are size 3, that do not have the “agile” innovation tag
� Cost: the range is from $8K to $45K
�Filter for all projects that are size 3, that have the agile innovation tag
� Cost: the range is from $5K to $30K
�Winner: Agile Innovation!
� We can use more parameters such as technology, team size, etc
� We can compare more actuals such as success level, calendar time, job satisfaction etc.

IBM Software Group | Rational software
36
Measuring at the Portfolio Level
� The following slides explore the big five specifically for portfolio management
�Understanding what’s different at the portfolio level vs. the project or program level
�Deciding what to measure at the portfolio level

IBM Software Group | Rational software
37
Productivity: Time and Cost Measures
� Time
�Proposal Submitted � to understand time from proposal to value received
�Project Initiation � traditional cycle time start
�Project Acceptance � traditional cycle time end
�First Value, 80% Value, Full Value � to understand real time to value
� Cost
�Cost of Cancelled Projects

IBM Software Group | Rational software
38
Productivity: Scope Measures
� Project Points (PP)
� Intake Requests Points (IRP)
� KLOC (thousands lines of code)
� LFP+QP (light function points plus quality points)
� FP (function points)
� SP (story points) don’t work as they are unique from project to project
� UP (use case points) don’t work unless every project uses use cases

IBM Software Group | Rational software
39
Predictability: Variance Measures
� Original estimate and date of estimate
� Updated estimates and date of estimates
� Final estimate and date of estimate
� Actuals
� Will lead to real “cones of uncertainty”
�How far off are our initial estimates?
�When are we 80% correct?
�When are we 90% correct?
� For Productivity and Quality

IBM Software Group | Rational software
40
Project Level Dashboard: Cones of Uncertainty

IBM Software Group | Rational software
41
Quality: Defect Measures
� Post-production Quality
�CRUD – Customer Reported in-Use Defects
�WAI – Works As Intended
�CNR – Can Not Reproduce
� % IT Budget on Correction Projects
� Correlation:
�Do projects with higher preproduction defects lead to higher post production defects?

IBM Software Group | Rational software
42
Quality: Value Measures
� Revenue generated in dollars
� Cost reduction in dollars
� Value Points (VP) using Agile Portfolio Management Fibonacci value ranking
� Weeks to First Value
� Weeks to 80% value
� Renewals in dollars or headcount
� # customers or users
� Dynamic Portfolio Position
� Non-Dollar Objective Value Measures
� End of Iteration Survey
� * % IT Budget on Enhancement Projects
� * Enhancement Requests
� * Portfolio Position

IBM Software Group | Rational software
43
Innovation: Skill Growth
� Innovation is about trying new ideas, techniques and practices
�And measuring the results using the big five
�The keeping the winners and ditching the losers
� Skill growth illuminates innovation growth
�What new process or tool skills are valuable to the organization?
�Which people are growing in these skills (such as agile skills)
�Which skills are growing
�What level are the skills growing to (L0 – L5)
�Which skill areas are lagging

IBM Software Group | Rational software
44
Innovation: Skill Growth Tracking
� Each practice is a skill, one for one: shared vision, release planning, etc.
� For each skill, practitioners grow from L0 to L5
� Each level clearly defined with objectively measurable tasks
� Levels require coaching to ensure quality of skill growth
� Levels require PIRs to ensure everyone participates in process improvement
� Peers at a higher level grant lower level approval instead of ivory towerists
� People are proud and competitive about growing skills
� Inspires a drive to change in all participants
� Adoption Measure: organizations can see skill growth in roll up reports
� Top 5 in growth recognized each cycle by executive management

IBM Software Group | Rational software
45
Innovation: Skill Types
� Role Based Skills – Generic skills that are useful on every project
� Technology Skills – specific technologies such as Java, SAP, etc
� Domain Skills – tied to each client’s specific business areas
� Earning skills is much like a merit badge system
� The more merit badges, the more project tasks they can own
� Increases whole team and recognizes people who make learning a goal
� Can create “baseball cards” for each person
� Can be used for staffing projects

IBM Software Group | Rational software
46
Skills “Baseball Card”
Technologies: SAP Config L3, .Net L5, PeopleSoft L2
Roles: Arch L3, Analyst L4, Coach L5
Domains: Milling L5, Transportation L1, Costing L1
Core Project: Kayak – Ranked #12
Extended On: WindJammer – Ranked #5
Guess: L3
Projects
Skills
Goal: L4
Role: L1LocationDowntown Office
Pat Jones
Partial: L3
Partial: highest level skill for a roleRole: all skills for this role at this level or higherGoal: shows if this person wishes to be staffed in this roleGuess: allows staffing before real skill evidence data has been submitted

IBM Software Group | Rational software
47
Innovation Dashboard: Skill Growth Graph
L5
0
10
20
30
40
50
60
Nu
m P
eo
ple
Level
How Many Have Learned Which Skills?
L5
L4
L3
L2
L1
PM
Reqts
Des
Arch
Imp
Test
Info Dev
Goals will be set for the number of Practitioners (L3), Junior (L4), and Senior (L5) mentors needed to sustain the transition

IBM Software Group | Rational software
48
Innovation: Process Improvement Requests (PIRs)
� PIRs are requests for innovation
� No PIRs means no innovation
� Questions:
�How many are being submitted per month
�Are submissions accelerating as more teams/people/projects go agile
� Is Pilot 0 keeping up with the PIRs by closing them
�How many are being rejected vs being closed as incorporated into the practices

IBM Software Group | Rational software
49
Innovation Dashboard: PIR Trends

IBM Software Group | Rational software
50
Agenda
� Are your current measures good enough?
� The Big Five
� Measuring a project
� Measuring a program
� Measuring “throwdowns”
� Measuring ourselves

23 May 2014 51
Personal HUD
top: d lance top: d princetop: m lane
top: k saunders top: m mccabe top: k zorel
78%65%
80%
30%
62%
Productivity Quality Commitment Process Imp Skill Growth

IBM Software Group | Rational software
5252
What concerns do you have about agile?

IBM Software Group | Rational software
5353


![Agile Metrics That Matter[1]](https://img.pdfslide.us/doc/110x75/55cf9b91550346d033a68ed5/agile-metrics-that-matter1.jpg)