Embed Size (px)
Citation preview
v&-b Res. Vol. 31, No. 2, pp. 275-286, 1991 00.42~6989/91 $3.00 + 0.00
Printed in Grunt Britain. All rights rescued Copyright 0 1991 Pcrgamon press pit
USING METAMERS TO EXPLORE MOTION PERCEPTION
DOUGLAS WILLIAMS,* SCOIT TV+ETE@ and ROBERT SEKULER$
Department of Neurobiology and Physiology, Northwestern University, Evanston, IL 60208, U.S.A.
(Received 3 February 1988; in revised form 23 April 1990)
Abs@ac&--We examined conditions under which two quite different types of random-dot ~nemato~ams were perceptually matched. In one stimulus type, directions of motion were defined by a uniform distribution; in the other, directions were drawn from a discrete set of just a few, widely separated directions, Cinematograms whose range of uniformly distributed directions lay between 180 and 270 deg could be matched by cinematograms containing just 6-10 discrete directions. The number of discrete directions required for a match was a nonmonotonic function of the range of directions present in the other cinematogram. The results are consistent with a line-element model in which the outputs of 12 direction-selective mechanisms, each with a h~f-amplitude half-~nd~dth of 3Odeg, are combined nonlinearly to produce the percept of motion.
Motion perception Line-element model Metamers Direction
Stimuli that are perceptually indistinguishable even though physically different are called metamers. The existence of metamers has been much exploited in the psychophysical explo- ration of color vision. But, in principle, metamers can be used as a tool to investigate other sensory dimension as well (Richards, 1979). Earlier, Williams and Sekuler (1984) cre- ated stimuli whose diverse components of motion gave up their individual identities and generated a percept of global coherent uni- directional motion. So, physically polymorphic stimuli can produce percepts having a shared directional character. Encouraged by this hint of metamerism, we set out to explore metamerism in visual motion perception.
In color vision, spectrally broad-band light, such as sunlight, can be perceptually matched by the sum of only a few suitably chosen spectrally narrow-band lights. Such demon- strations of metamerism lent crucial support to the hypothesis that color info~ation is pro- cessed initially by means of a few independent mechanisms selectively sensitive to light in somewhat different, but overlapping spectral
*Present address: Department of Psychology, Rutgers Uni- versity, New Brunswick, NJ 08854, U.S.A.
?Present address: Tulane University, School of Medicine, New Orleans, LA 70117, U.S.A.
SPresent address: Office of the Provost, Brandeis University, Waltham, MA 02254, U.S.A.
regions. With color vision in mind, we examined perceptual relations between (i) stimuli composed of a broad-band of directions of motion; and (ii) stimuli containing only a discrete number of directions. The aim of our experiments was to determine how few direc- tions would have to be added together in order to be perceptually indistinguishable from a broad-band stimulus of a particular bandwidth.
To anticipate, the results suggest that motion perception has much in common with color vision: at least with one particular kind of stimulus, a surprisingly small number of discrete directions yield a match to the percept of motion generated by a broad-band of direc- tions. Moreover, our results are consistent with the idea that motion perception depends on the nonlinear combination of responses from just a few different direction-selective mechanisms.
METHODS
Our displays were dynamic random-dot cine- matograms in which each dot took an indepen- dent, two-dimensional random walk of constant step size. Though all dots travelled the same distance from frame to frame, the directions in which each dot moved were independent of the directions in which the other dots moved. More- over, the direction in which one dot moved between successive frames was independent of the directions in which it had moved previously.
275
276 DOUGLAS WILLIAMS et al
Allowing dots’ movements to vary in this way produced a stimulus in which many different local motion vectors were spatially and tem- porally intermingled.
For any stimulus, the set of directions in which all dots moved was chosen from the same probability distribution, which could be either a ~nl~urm distribution or a multinomial distri- bution. A uniform distribution of dot directions produced a cinematogram containing a broad- band spectrum of directions*; the spectrum’s bandwith was defined by the range of the uni- form distribution. A ~uft~~o~iaI distribution of dot directions produced a cinematogram con- taining only a discrete set of directions. When the multinomial distribution was composed of a sufficient number of directions, a global percept resulted that proved to be indistinguishable from that producd by a broad-band pattern.
If motion info~ation were processed by direction-selective, bandlimited mechanisms, the minimum number of directions that sufficed to match a stimulus containing a broad-band of directions would help to define the number of different dir~tion-selective mechanisms in the visual system (Richards, 1979). For any band- width, however, an exhaustive search would be required to guarantee that the minimum num- ber of matching directions had actually been found. Such a search would have to examine an infinite set of possible stimuli since not only the number of discrete component directions, but also the particular identity of component direc- tions could be varied. To say the least, this type of search would be enormously time consuming. In our experiments, therefore, we restricted the set of discrete stimuli to only those stimuli constituted according to the following algor- ithm. For any broad-band stimulus of band- width, B deg, a discrete stimulus containing N directions was constructed such that the direc- tions were aligned symmetrically about the cen- ter direction of the broad-band pattern, with the separation between any two adjacent com- ponent directions given by:
Separation = B/N. (1)
All N directions occur with equal probability in the multinomial distribution defined for the discrete stimulus. With this algorithm the direc-
*The spatial grain of our display device made it impossible
to create a continuum of directions of motion. We
approximated a uniform ~st~bution of directions by
sampling directions at 1 deg intervals.
tions in each discrete stimulus span the band- width, B, of the broad-band stimulus.
For a particular bandwidth of broad-band stimulus, we determined the minimum number of directions, N,, constituted according to the algorithm, that would match perceptually. Note that any empirical value N,,, carries two limitations. First, any claim that two stimuli are perceptually indistinguishable is reaily a statistical statement made at some particular probability level. Stimuli that seem to be indis- tinguishable at one confidence level, might have been considered otherwise, statistically, had a different criterion been employed. All our tests of distinguishability used just a single, arbitrary criterion. Second, any one empirical value of N, is not necessarily the absolute obtainable mini- mum. Recall that we are not considering all possible combinations of number and identity of directions for the discrete stimuli. Thus by itself a single empirical value of N, cannot be an unequivocal guide to the number of underlying psychophysical mechanisms. However, we re- peated this operation several times, determining N, for each of several different broad-band stimuli. All of the N, values obtained in this way, together with the ordinal relations among those values, tightly circumscribe the underlying structure of bandlimited mechanisms that might account for these results. Structural features include the number of differently tuned mechanisms, their shape, bandwidth and optimal tuning. If any model were successful, we would then subject it to the challenge of predicting N,,, for stimuli of bandwidths not previously tested.
Altogether, six different bandwidths were used in this study. First we tested with band- widths of 210, 226, 240, 256 and 270deg; the study was completed by testing at 180 deg. In all cases, the center direction of the broad-band stimulus was upward. Of course, any set of bandwidths could have been tested. However, since there was no a priari knowledge of the bandwidths of the direction-selective mechan- isms, it seemed prudent to use relatively broad- band stimuli in an effort to simultaneously stimulate mechanisms with disparate direction selectivities.
Apparatus and procedure
Our displays were generated by a mini- computer that passed values through a digital- to-analog converter for display on a Hewlett-Packard 132lA X-Y display with a
Metamsrs and motion perception 271
P3 l phosphor. A “wrap around” scheme caused dots to disappear when displaced beyond the boundary of the display and then reappear at the opposite sides of the display. A cardboard mask restricted the visible pattern to a circular region of 16 deg dia. Observers fixated the cen- ter of the screen; viewing was monocular, with the other eye occluded by a translucent eye patch, No fixation point was used since it might provide a reference for judging the direction of nearby local motion vectors and we did, not want the observers to base their response on only a restricted region of the display.
Each dot measured 0.1 deg in diameter. The spatial density of dots was 1.6 dots/deg’. From one display frame to the next each dot was displaced by 0.9 deg. Frame duration, the time required to present all the dots once, was 9.0msec; the interval between frames was 95.0 msec. Total stimulus duration was 1.1 set, during which 11 frames were presented. For a more detailed discussion of the stimulus’ spatial and temporal properties, see Williams and Sekuler (1984).
The display itself provided the only lumi- nance in the room and observers adapted to total darkness for 5 min before starting an ex- perimental session. At the beginning of each session the threshold luminance for seeing stationary dots was established using a von Bekesy tracking procedure (Tynan & Sekuler, 1977). Thereafter, each dot in the patterns was maintained at twice the observer’s threshold. Under these conditions, we estimate that a dot’s luminance was approx. 0.5 cd/m2. At consider- ably higher luminances the persistence of the display’s phosphor caused moving dots to ap- pear streaked. We should note that the spatial and temporal parameters of our display had been carefully adjusted to yield good, perceptu- ally smooth apparent motion at this low lumi: nance . *
A two-alternative farmed-choice procedure determined when a cinematogram with a dis- crete set of directions perceptually matched a cinematogram containing a broad-baud of di- rections. The trial structure consisted of two stimulus presentations, each 1.1 set in duration and separated by a 4.0 set interst~mulus interval. On half the trials, randomly chosen, the broad-
*Our experiments were conducted at low light levels only. Befau~e temporal responses do vary with light level, it is not certain that tire results wouId hold under other conditions.
band stimulus was presented first, followed by the discrete stimulus; on the other trials, this order was reversed. After both intervals* the observer tried to identify the interval that had contained the discrete stimulus. A camputer- generated sound informed the observer when the response had been correct. A session con- sisted of 40 trials.
Experimental desigrt
For each bandwidth of broad-band stimulus we begin by testing with a discrete stimulus containing a small number of components, typi- cally five. After collecting data in at least nine sessions spread over three days, we continued testing at that same bandwidth, but with a discrete stimulus to which one more component direction had been added. Again, nine sessions were run. Thereafter, we continued to increase the number of directions in the discrete stimu- lus, and run new sets of nine sessions, until a statistical criterion (see below) confirmed that the observer was not able to discriminate the discrete stimulus from the broad-band stimulus_ We chose not to intersperse different conditions of bandwidth and numbers of discrete within the same experimental session. Instead, within a single session, one bandwidth and one number of discrete directions were examined within a session. We reasoned that this would allow the observer to get maximum benefit from the feed- back for that condition. Also, before stimulus conditions were changed, a constant bandwidth and number of discrete directions was tested in nine successive experimental sessions.
For each discrete stimulus the first two ses- sions were treated as practice, and discarded; only the last seven sessions were actually ana- lyzed. On the assumption that our two-alterna- tive famed-choice procedure would reflect binomial random variability, we calcutated the percent correct performance above which one can be 95% confident that the observer was able to discriminate between broad-band and dis- crete stimuli. This confidence level, carrespond- ing to 55.7% correct over seven sessions, provided a convenient, if arbitrary, benchmark for deciding that an observer was or was not able to make the discrimination.
Observers
In our principal experiment, three observers were tested, two of the authors, and a third observer, who was naive as to the purpose of the

27x DOUGLAS WILLIAMS et al
study. All conditions were measured for ob- server DWW. For observer SDT all conditions except for the smallest bandwidth were used. Observer DBF was tested on only three representative bandwidths. In a supplementary experiment, reported toward the end of the paper, an additional naive observer was tested.
RESULTS
Figure 1 shows observers SDT’s results with three bandwidths, 210, 226 and 240deg. The
BondwIdth 226. -
Bondwidth 240. -
Number of Directions
Fig. 1. The percent of trials on which observer SDT correctly distinguished the broad-band stimulus from the discrete stimulus, as a function of the number of directions in the discrete stimuli. Data are shown for three different bandwidths of broad-band stimulus--210,226 and 240 deg. The horizontal dashed line in each panel is the percent correct above which the two stimuli are reliably distinguished at the 95% confidence level. The single solid data point denotes the minimum number of directions that is confused with the broad-band stimulus. Each data point is based on 280 trials. Note that for all three bandwidths the
minimum number is 8.
SDT
Bandwidth 256’
60
I L
Bandwidth 270’
t
___---_- t-----
--_
.A
sob -G4, ’ I I I I I
6 7 8 9 10 11
Number of directions
Fig. 2. Same as in Fig. 1 except data are for bandwidths of 256 and 270 deg. Note that as bandwidth increased from 256 to 270 deg, the minimum number of directions for a match
(denoted by the solid symbol) decreases from 10 to 9.
percentage of trials on which the observer cor- rectly distinguished the broad-band stimulus from the discrete stimulus is plotted against the number of directions in the discrete stimulus. Note that as the number of directions in the discrete stimulus increases, the observer’s ability to distinguish between broad-band and discrete stimuli decreases. The horizontal dashed line in the figure shows the percentage correct above which we can be 95% confident that the two stimuli are reliably distinguished.
In Fig. 1 each point represents 280 trials (40 trials each in seven sessions). The single solid data point highlights the minimum number of directions, N,,,, that produces confusion with the broad-band stimulus. Here, and throughout this paper, N,,, is defined by the first data point that falls below the 95% confidence limits. For each of the bandwidths shown in Fig. 1, the mini- mum number, N,, is eight. The same observer’s results with the two largest bandwidths, 256 and 270 deg, are shown in Fig. 2. For a bandwidth
Metamers and motion perception 279
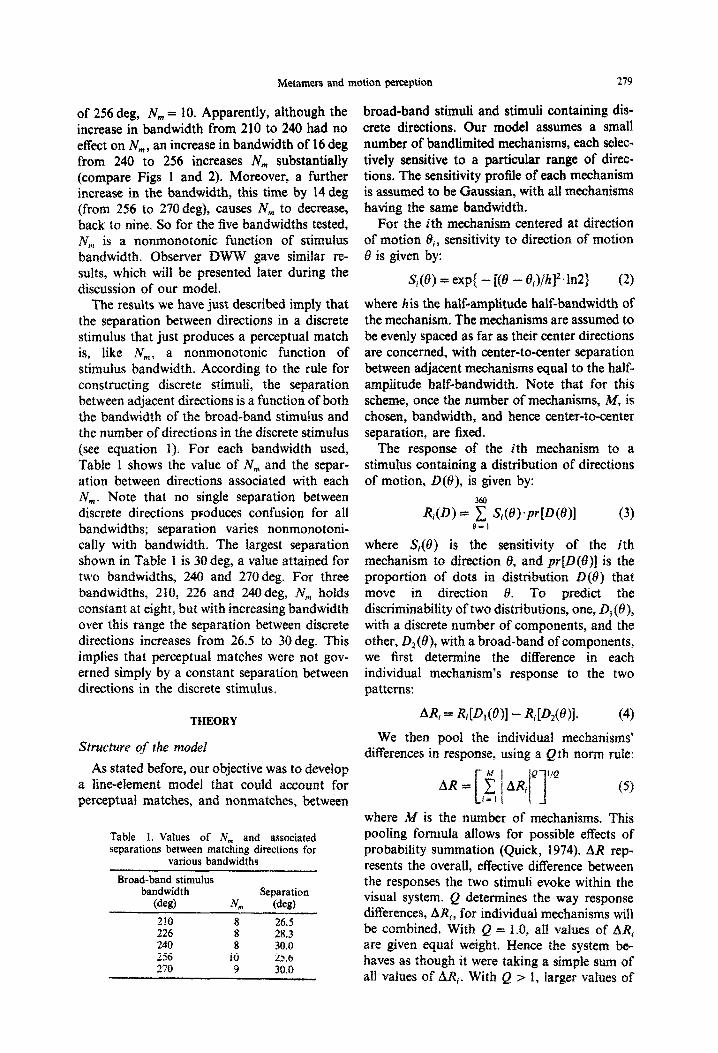
of 256 deg, N,,, = 10. Apparently, although the increase in bandwidth from 210 to 240 had no effect on N,,,, an increase in bandwidth of 16 deg from 240 to 256 increases N,,, substantially (compare Figs 1 and 2). Moreover, a further increase in the bandwidth, this time by 14 deg (from 256 to 2?0deg), causes N, to decrease, back to nine. So for the five bandwidths tested, N, is a nonmonotonic function of stimulus bandwidth. Observer DWW gave similar re- sults, which will be presented later during the discussion of our model.
The results we have just described imply that the separation between directions in a discrete stimulus that just produces a perceptual match is, like N,, a nonmonotonic function of stimulus bandwidth. According ta the rule for constructing discrete stimuli, the separation between adjacent directions is a function of both the band~dth of the broad-band stimulus and the number of directions in the discrete stimulus (see equation 1). For each bandwidth used, Table 1 shows the value of N,,, and the separ- ation between directions associated with each N,,,. Note that no single separation between discrete directions produces confusion for all bandwidths; separation varies nonmonotoni- tally with bandwidth. The largest separation shown in Table I is 30 deg, a value attained for two &andwidt~~ 240 and 270deg. For three bandwidths, 210, 226 and 240 deg, N, hoIds constant at eight, but with increasing bandwidth over this range the separation between discrete directions increases from 26.5 to 30deg. This implies that perceptual matches were not gov- erned simply by a constant separation between directions in the discrete stimulus,
THEORY
SErueture of the m&ef
As stated before, our objective was to develop a line-element model that could account for perceptual matches, and nonmatches, between
Table 1. Values of IV,,, and associated separations between matching directions for
various bandwidths
Broad-band stimulus bandwidth Separation
(ded NWI (de&
210 8 26.5 226 8 28.3 240 8 30.0 256 10 25.6 270 9 30.0
broad-band stimuli and stimuli containing dis- crete directions, Our model assumes a small number of bandlimited mechanisms, each selec- tively sensitive to a particular range of direc- tions. The sensitivity profile of each mechanism is assumed to be Gaussian with all mechanisms having the same bandwidth.
For the ith mechanism centered at direction of motion a,, sensitivity to direction of motion B is given by:
S,(0) = exp( - [(B - t?i>/h]2=ln2~ (2)
where his the half-amplitude half-bandwidth of the mechanism, The mechanisms are assumed to be evenly spaced as far as their center directions are concerned, with center-to-center separation between adjacent mechanisms equal to the half- amplitude half-bandwid~. Note that for this scheme, once the number of mechanisms, &f, is chosen, band~dth, and hence center-to-center separation, are fixed.
The response of the ith mechanism to a stimulus containing a distribution of directions of motion, O(e), is given by:
R,(D) s F Si(O)‘pr[D(8)] (3) a=1
where S,(B) is the sensitivity of the ith mechanism to direction 8, and p@(e)] is the proportion of dots in ~st~bu~on L)(6) that move in direction 01. To predict the di~minability of two dist~bu~ons~ one, IIt( with a discrete number of components, and the other, D2(0), with a broad-band of components, we first determine the difference in each individual mechanism’s response to the two patterns:
AR! = Ri[Dl(O>] - Ri[D2(8)]* (41
We then pool the individual mechanisms” differences in response, using a Qth norm rule:
where M is the number of mechanisms. This pooling formula allows for possible effects of probability summation (Quick, 1974). AR rep- resents the overall, effective difference between the responses the two stimuli evoke within the visual system. Q determines the way response differences, A& x for individual mechanisms will be combined. With Q = 1.0, all values of AR, are given equal weight. Hence the system be- haves as though it were taking a simpte sum of al1 values of AR?. With Q 2 f, larger values of
2x0 DOUGLAS WILLIAMS et al.
ARi are weighted more than smaller values. At the extreme, Q = infinity, the visual system be- haves as a peak detector and only the largest value of AR, is taken into account, with all others being ignored.
In order to relate predicted values of AR to the empirical results obtained in our two- alternative forced-choice experiments, we used Quick’s psychometric function of the form:
In this formulation P is related to the slope of the psychometric fuction while k is equal to the value of AR for which $(AR) = 0.75.
As the preceding suggests, our model has four free parameters: M (the number of mechan- isms), Q (the exponent of the equation for pooling responses), and the parameters P and k of the psychometric function. We chose values for these parameters that would provide the best fit to the discrimination data, using the fewest number of mechanisms, M.
Although the model as described thus far does define the separation between mechanisms as well as the mechanisms’ bandwidth, one necessary element has not been considered: what values should be assigned to the mechan- isms’ center directions. To see what the implication of this omission consider a model with M directionally-selective mechanisms represented on a polar coordinate system. Any rigid rotation of the mechanisms about the coordinate system’s origin would leave unchanged M, the number of mechanisms, and the mechanisms’ bandwidths and separations. A rotation within polar coordinates represents a constant phase shift for all mechanisms. To complete the model’s specification, then, one must define the absolute phase of at least one mechanism (only one need be defined since mechanisms’ relative phases were already specified). A useful way to specify phase is to define the arrangement of the model’s mechan- isms relative to the center direction, upward, of our broadband stimuli.
For simplicity we concentrated on just three phases of the mechanisms relative to the center of the broad-band stimulus. In the first arrange- ment of phase, the center direction of one mechanism was taken to be upward, the center direction of the broad-band stimulus. In the second, mechanisms were aligned such that the center of the broad-band stimulus was midway between two adjacent mechanisms. Like the first arrangement, this arrangement also postulates
mechanisms that are symmetrically aligned with respect to the center of the broad-band stimulus. The other case we examined involves an asym- metric alignment of mechanisms relative to the center of the broad-band stimulus. For this last arrangement the mechanisms were situated so that the center of the broad-band stimulus is separated from the nearest mechanism by a quarter of a mechanisms’s bandwidth.
Our model gave a predicted psychometric function relating the probability of discriminat- ing broad-band from discrete stimuli as a func- tion of the number of components in the discrete stimulus. For each broad-band stimu- lus, of bandwidth B, and each discrete stimulus with N directions the model predicted the prob- ability of discrimination PD(B, N).
Testing the model’s predictions
In order to identify the best fitting set of parameters we took advantage of the fact that the psychometric function, equation (6), is merely a monotonic scaling function, albeit nonlinear. Ignoring equation (6) initially, we used the model to compute predictions of dis- criminability for integer values of Q ranging from 1 to 10 and for values of A4 ranging from 3 to 15. Since changes in the values of P and k in the psychometric function, equation (6), simply expand or contract differences between the discriminability curves at different band- widths, leaving invariant the order relation among curves, we sought a set of parameters that would match these invariant features in the data.
To extract the empirical invariants for which the model would have to account, data points on each psychophysical function (for example, the three functions shown in Fig. 1) were di- vided into two groups: data points that lay above the 95% confidence level and data points that lay below that level. This division creates a set of binary relations, or inequalities, with all members of one group (data points above the 95% confidence level) representing significantly greater discriminability than all members of the other group (data points below the 95% confi- dence level). Dividing the data points in this way converts a fully-ordered set of points into a partially-ordered one, since relations among data points within the group are not defined. The inequalities in this partially-ordered set represent the empirical invariants that must be satisfied by the predicted probabilities of dis- crimination, PD(B, N).
Metamers and motion perception 281
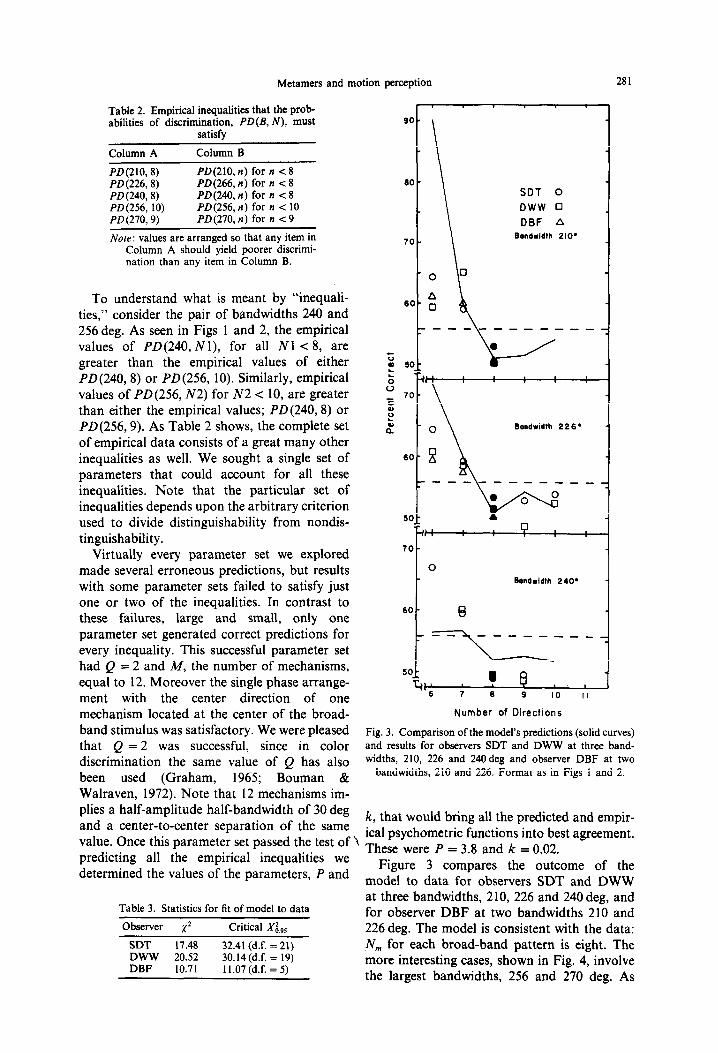
Table 2. Empirical inequalities that the prob- abilities of discrimination, PD(B, N), must
satisfy
Column A Column B
PD(210,8) PD(210, n) for n < 8 PD(226,8) PD(266, n) for n c 8 PD (240,8) PD(240, n) for n c 8 PD(256, 10) PD(256, n) for n < 10 PD (270,9) PD(270, n) for n c 9
Nofe: values are arranged so that any item in Column A should yield poorer discrimi- nation than any item in Column B.
To understand what is meant by “inequali- ties,” consider the pair of bandwidths 240 and 256 deg. As seen in Figs 1 and 2, the empirical values of PD(240, N 1), for all N 1 < 8, are greater than the empirical values of either PD(240, 8) or PD(256, 10). Similarly, empirical values of PD(256, N2) for N2 < 10, are greater than either the empirical values; PD(240,8) or PD(256,9). As Table 2 shows, the complete set of empirical data consists of a great many other inequalities as well. We sought a single set of parameters that could account for all these inequalities. Note that the particular set of inequalities depends upon the arbitrary criterion used to divide distinguishability from nondis- tinguishability.
Virtually every parameter set we explored made several erroneous predictions, but results with some parameter sets failed to satisfy just one or two of the inequalities. In contrast to these failures, large and small, only one parameter set generated correct predictions for every inequality. This successful parameter set had Q = 2 and M, the number of mechanisms, equal to 12. Moreover the single phase arrange- ment with the center direction of one mechanism located at the center of the broad- band stimulus was satisfactory. We were pleased that Q = 2 was successful, since in color discrimination the same value of Q has also been used (Graham, 1965; Bouman & Walraven, 1972). Note that 12 mechanisms im- plies a half-amplitude half-bandwidth of 30 deg and a center-to-center separation of the same value. Once this parameter set passed the test of ‘? predicting all the empirical inequalities we determined the values of the parameters, P and
Table 3. Statistics for fit of model to data
Observer x2
SDT 17.48 DWW 20.52 DBF 10.71
Critical XQ,,
32.41 (d.f. = 21) 30.14 (d.f. = 19) 11.07 (d.f. = 5)
r u I
SDT 0
DWW 0 DBF A
Bandwidth 210*
Bandwidth 226.
::
BondwIdth 240. 1
60
t
-------_
I - I
Number of Directions
Fig. 3. Comparison of the model’s predictions (solid curves) and results for observers SDT and DWW at three band- widths, 210, 226 and 240deg and observer DBF at two
bandwidths, 210 and 226. Format as in Figs 1 and 2.
k, that would bring all the predicted and empir- ical psychometric functions into best agreement. These were P = 3.8 and k = 0.02.
Figure 3 compares the outcome of the model to data for observers SDT and DWW at three bandwidths, 210, 226 and 240 deg, and for observer DBF at two bandwidths 210 and 226 deg. The model is consistent with the data: N,,, for each broad-band pattern is eight. The more interesting cases, shown in Fig. 4, involve the largest bandwidths, 256 and 270 deg. As
282 DOUGLAS WILLIAMS et al
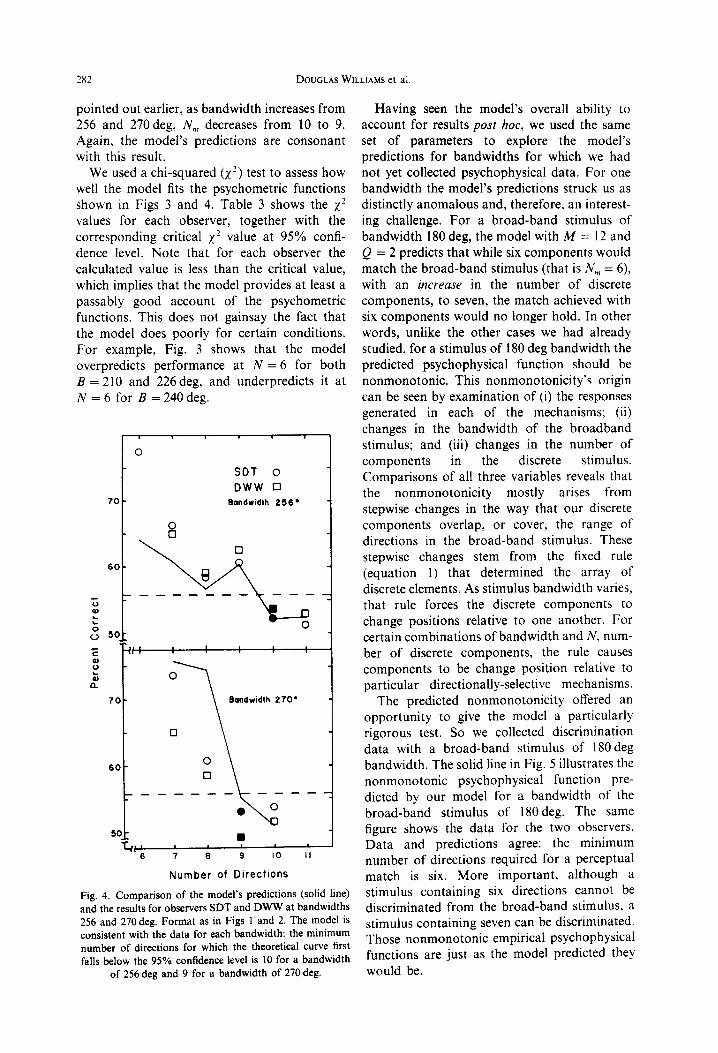
pointed out earlier, as bandwidth increases from 256 and 270deg, N, decreases from 10 to 9. Again, the model’s predictions are consonant with this result.
We used a chi-squared (XI) test to assess how well the model fits the psychometric functions shown in Figs 3 and 4. Table 3 shows the x’ values for each observer, together with the corresponding critical 1’ value at 95% confi- dence level. Note that for each observer the calculated value is less than the critical value, which implies that the model provides at least a passably good account of the psychometric functions. This does not gainsay the fact that the model does poorly for certain conditions. For example, Fig. 3 shows that the model overpredicts performance at N = 6 for both B = 210 and 226 deg, and underpredicts it at N = 6 for B = 240 deg.
I ’ 1
t
0
SDT 0 DWW 0
70 Bandwidlh 256.
60
Number of Directions
Fig. 4. Comparison of the model’s predictions (solid line) and the results for observers SDT and DWW at bandwidths 256 and 270 deg. Format as in Figs 1 and 2. The model is consistent with the data for each bandwidth: the minimum number of directions for which the theoretical curve first falls below the 95% confidence level is 10 for a bandwidth
of 256 deg and 9 for a bandwidth of 270 deg.
Having seen the model’s overall ability to account for results post hoc, we used the same set of parameters to explore the model’s predictions for bandwidths for which we had not yet collected psychophysical data. For one bandwidth the model’s predictions struck us as distinctly anomalous and, therefore, an interest- ing challenge. For a broad-band stimulus of bandwidth 180 deg, the model with A4 = 12 and Q = 2 predicts that while six components would match the broad-band stimulus (that is N,,, = 6), with an increase in the number of discrete
components, to seven, the match achieved with six components would no longer hold. In other words, unlike the other cases we had already studied, for a stimulus of 180 deg bandwidth the predicted psychophysical function should be nonmonotonic. This nonmonotonicity’s origin can be seen by examination of (i) the responses generated in each of the mechanisms; (ii) changes in the bandwidth of the broadband stimulus; and (iii) changes in the number of components in the discrete stimulus. Comparisons of all three variables reveals that the nonmonotonicity mostly arises from stepwise changes in the way that our discrete components overlap, or cover, the range of directions in the broad-band stimulus. These stepwise changes stem from the fixed rule (equation 1) that determined the array of discrete elements. As stimulus bandwidth varies, that rule forces the discrete components to change positions relative to one another. For certain combinations of bandwidth and N, num- ber of discrete components, the rule causes components to be change position relative to particular directionally-selective mechanisms.
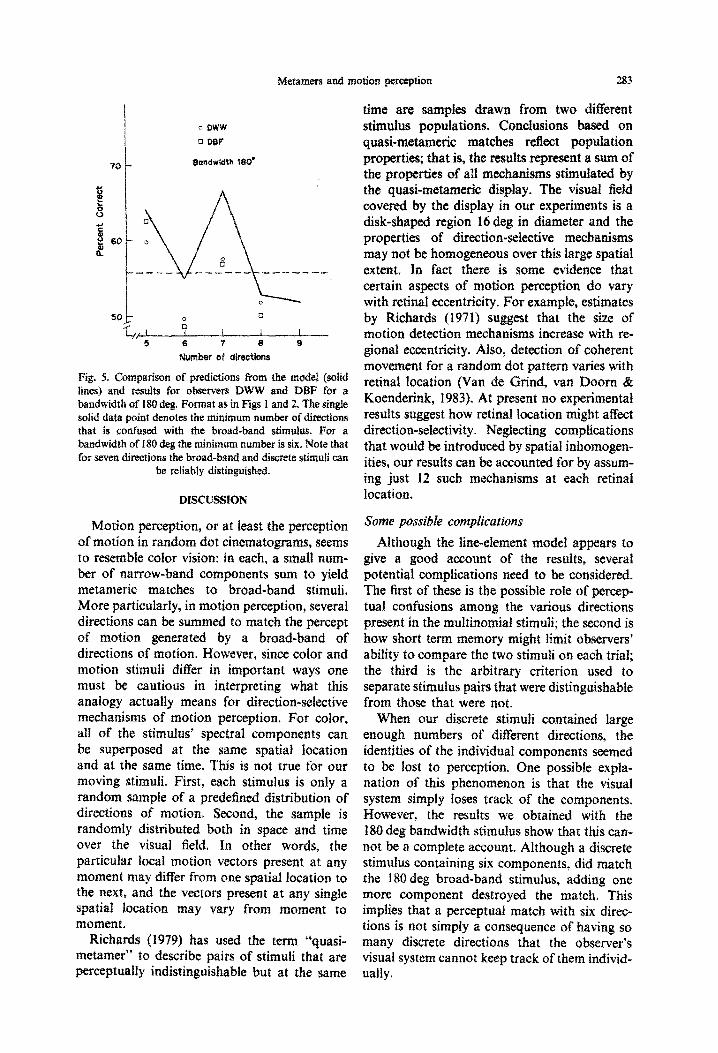
The predicted nonmonotonicity offered an opportunity to give the model a particularly rigorous test. So we collected discrimination data with a broad-band stimulus of 180 deg bandwidth. The solid line in Fig. 5 illustrates the nonmonotonic psychophysical function pre- dicted by our model for a bandwidth of the broad-band stimulus of 180 deg. The same figure shows the data for the two observers. Data and predictions agree: the minimum number of directions required for a perceptual match is six. More important, although a stimulus containing six directions cannot be discriminated from the broad-band stimulus, a stimulus containing seven can be discriminated. Those nonmonotonic empirical psychophysical functions are just as the model predicted they would be.
Metamers and motion perception 2g3
0 DWW
0 DBC
BondwIdth lC@
Fig. 5. CQ~~~~~~~ of predictinns from tb m&S (s&d lines) and results for observers DWW and DlBE for a bandwidth of 180 deg. Format a$ in Figs 1 and 2. The sing solid data point denotes the minimum number of directions that is confused with the broad-band stimulus. For a ~~d~dtb of 181) deg the m~~murn number is six. Note that for seven directions the broad-band and discrete stimtdi can
be reliably d~st~uguished.
Motion perception, or at ieast the perception of motion in random dot ~inematograms, seems to resemble color vision: in each, a small num- ber of narrow-band components sum to yield metarn~rj~ matches to broad-band stimuli. More particularly, in motion perception, several directions can be summed to match the percept of motion generated by a broad-band of directions of motion. However, since color and motion stimuli differ in important ways one must be cautious in i~t~~reting what this analogy actually means for direction-selective mechanisms of motion perception. For color, all of the stimulus’ spectral components can be superposed at the same spatial location and at the same time. This is not true for our moving stimuli. First, each stimulus is only a random sample of a predefined distribution of directions of motion. Second, the sample is randomly dist~buted both in space and time over the visual field. In other words, the particular local motion vectors present at any moment may differ from one spatial location to the next, and the vectors present at any single spatial location may vary from moment to moment.
Richards (1979) has used the tetm “quasi-
metamer’* to describe pairs of stimuli that are
perceptually indistinguishable but at the same
time are samples drawn from two different stimulus populations. Conclusions based on q~i-rn~~rne~c matches reflect population properties; that is, the results represent a sum of the properties of all m~cha~sms stimulated by the quasi-metame~~ display. The visual field covered by the display in our experiments is a disk-saved region 16 deg in diameter and the properties of d~r~ti~~~selective mechanisms may not be homogeneous over this large spatial extent. In fact there is some evidence that certain aspects of motion perception do vary with retinal eccentricity. For example, estimates by Richards (1971) suggest that the size of motion detection mechanisms increase with re- gional eccentricity. Also, detection of coherent movement for a random dot pattern varies with retinal location (Van de Grind, van Doom & Koenderink, 1983). At present no experimental results suggest how retinal location might affect direction-selectivity. Neglecting complications that would be introd~~d by spatial i~homogen- ities, our results can be accounted for by assum- ing just 12 such mechanisms at eack retinal location.
Although the line-element model appears to give a good account of the results, several potential complications need to be considered. The first of these is the! possible role of pereep- tual confusions among the various directions present in the m~ltinomial stimuli; the second is how short term memory might fimit observers’ ability to compare the two stimuli on each trial; the third is the arbitrary criterion used to separate stimulus pairs that were disti~~~shable from those that were not.
When our discrete stimuli contained large eno~~b numbers of difTerent directions, the identities of the individual components seemed to be lost to perception. One possible expla- nation of this phenamenon is that the visual system simply loses track of the components. However, the results we obtained with the 180 deg bandwidth stimulus show that this can- not be a complete account. Although a discrete stimulus containing six components, did match the 180 deg broad-band stimulus, adding one more component destroyed the match, This implies that a perceptual match with six direc- tions is not simply a consequence of having so many discrete directions that the observer’s visual system cannot keep track of them individ- ually.

TheYt: is, hOWWeY, ZiR alteFna~Ve explanations
one might also suspect that confusion OCCURS because the separation between directions in the discrete stimulus becomes suEicientIy smaXi that ~~divjdua~ directions cart no longer be distia- guished, According to equation (I), for 8 fixed bandwidth, the separation between adjacent di- rection aT the discrete stimulus decreases with increasing number of directions, Again, the results with bandwidth of 18Odeg falsify the hypotheses: six directions produce better disw ~~rn~n~tj~n than do seven directions. Faih.~e of d~sc~rn~~~t~o~, therefore, is not merely the re- sult of too small a separation between dir~~~~~~s in the discrete stimulus.
There is yet another ~xtra~~o~ factor that might have shaped our results: the frrng deXay separating the two intervals of any trial. En each experiment reported thus far, the intervals were separated by a 4-see gap. We were co~~~rn~d that this relativeiy iong interstimulus interva’l might have coiored our resuhs. For exampie, the interval might have been s~ffi~~~~~~y itong that, by the time the second stimulus was pre- sented, the observer retained only an imperfect memory of what the first stimulus looked like. Naturally, such a imperG memory might have arti%SIy d~rn~n~shed the observer’s powers of dis~r~rn~~~t~o~ between broadband and discrete stimuli. To check on the importance of this long interstim~~~s interval, we tested an add~t~~~a~ naive observer (AX) with three different band- widths, 240, 256 and 27Qdeg, and with two different i~terst~mu~~s intervals. 4 set and another of only 25ffmsec.
Results for this observer are shown in Fig. 6 Two ~~d~~~s are particularly noteworthy. First, with each bandwidth this new observer gave results that were esse~t~~~ly the same as those from other observers--failures to dis~r~m~nat~ occurred at the same values of NM as we had found with others. Second, her results did not differ between the two values of i~ter-st~~~~~us interval, Changing the separation between intervals by a factor of 16 had no systematic e&ct on the resutts, This gives us e~~~de~~ that the re-elativety tong separation in our first experiments did not play a crucial role in shaping our earlier results.
As noted earlier, one needs to consider the possible impact of the arbitrary criterion that we used to decide whether two stimuli were psycho- physically d~stingujsh~bl~ or not. Choosing another criterion would have altered the set of empirical inequalities that guided selection of
70
6 7 B 9 30 13
Num&Pr of Direcfiana
Fig, 6. Results with stimulus bandwidths of 2713, 2% and 24odeg with observation intervals separated by Bsec {left panelf or by 25Gmsec (right panel). Data are for observer
AK. Format as before.
the model’s parameters (Table 2). A crriterion other than 95% would have r~l~ssi.~ed as distinguishable some stimulus pairs that were classified as indist~~gnisha&~e, and, demanding upon the criterion chosen, vice versa. The essential point thrush is that for ust?abfe psy- chophysical value (between 50 and l~~*~~, any criterion would product; a set of empirical ~ne~u~~~t~es that are simple, additive Wmsform~ ations of those listed in Tabie 2, For exampie, a11 values of N in probabilities of d~s~r~rn~nat~on~ PD(B, N), would be increased or decreased by the same constant value as a result of a &ange in critarion. A model satisfying one set would
Metamers and motion perception 285
thereby satisfy any other set, allowing for com- pensating adjustments in the scaling values P and k from the psychometric function. It should be noted that this argument assumes that for stimulus bandwidths of interest, PD(B, N) is monotonic with N, which did seem to be the case for large values of B.
An alternative to the approach we did take would have been to work not from a semi- ordered set like that of Table 2, but from the entire set of empirical inequalities. This alterna- tive would have eliminated the need to select some arbitrary cutoff between distinguishability and nondistinguishability. We decided against this approach because our data seemed to be too noisy to support it and because we view this effort at model building as frankly preliminary.
Variations in M
As we have indicated, of the models we explored, the best fitting model was one contain- ing twelve mechanisms, each with 30 deg half- bandwidth at half-amplitude. If, for M = 12, one substitutes M = 11 or M = 13 into the model, changing the number of mechanisms by just one, the model can no longer account for the results. With 11 mechanisms, the model is consistent with the data for the four smallest bandwidths used, but incorrectly predicts N, = 8 for the 256 deg bandwidth and N, = 12 for a bandwidth of 270 deg. Thirteen mechan- isms give predictions that are generally consist- ent with the data, but fail with stimulus bandwidths of 180 and 270 deg. A model with 13 mechanisms incorrectly predicts N,,, = 8 for both these cases.
For an efficiency of covering all directions of motion, our model has assumed that the half- amplitude half-bandwidth of the mechanisms is equal to the center-to-center separation of the mechanisms. With 12 mechanisms, this assump- tion yields half-amplitude half-bandwidths and center-to-center separations of 30 deg. Among values of M from 3 to 15, only M = 12 gave a good account of our results. However, over a larger range of possible values, M = 12 was not unique in its ability to generate correct predictions. In particular, the data can also be accounted for with M = 24, providing that the half-amplitude half-bandwidth of each mechan- ism is maintained at 30 deg. Note that in these cases the center-to-center separations would be 15 deg. Likewise, a model with M = 36 is also successful if the mechanisms have appropriate bandwidth and separation. The success of
models containing equally-spaced Guassian mechanisms in integer multiples of 12-12, 24, %-can be explained intuitively. In such models, mechanisms’ responses are projected into n-dimensional spaces that are related by simple transformation to the space produced by the basic model, with just 12 mechanisms. Es- sentially, these integer-multiple models parcel any one original mechanism’s coverage into n parts, so that the summed response of the n are equivalent to the one original. Thus, a model with M = 12 is not unique in its fit to empirical observations; however, with M = 12 a model does manage to account for the data with the fewest mechanisms.
Physiological plausibility
Although we are reluctant to place much weight on the connection, it is worth to note the physiological plausibility of the directional tun- ing values we have derived psychophysically. Maunsell and Van Essen (1983) reported direc- tional tuning curves for 163 neurons in Area MT of the macaque monkey. The characteristics of MT neurones hold particular interest for us because Area MT plays a crucial role in motion perception (Newsome & Pare, 1988). The breadth of directional tuning did vary widely from cell to cell, but the mean directional tuning across all the neurons apears to be consistent with the breadth of tuning in the mechanisms postulated here (cf. Fig. 2B of Maunsell & Van Essen, 1983).
For the sake of fairness we must acknowledge various inconsistencies between the character- istics of our directionally-selective mechanisms and the properties of single neuons described by Maunsell and Van Essen. For example, although we have assumed that all mechanisms, regard- less of center direction, have the same breadth of tuning and sensitivity, Maunsel and Van Essen noted that certain preferred directions tended to be underrepresented in their sample.
Relations to other psychophysical results
Williams and Sekuler (1984) showed that a distribution of spatially intermingled, local di- rection vectors can produce a percept of global motion in a single direction. This basic obser- vation was recently extended to various stimulus durations, using both Gaussian and uniform distributions of directions (Watamaniuk, Sekuler & Williams, 1989). Their results, which were collected after our own, are material because Watamaniuk et al. used the same

286 DOUGLAS WILLIAMS et al
line-element model and parameters as we did.
Watamaniuk et al. examined the ease with which observers could discriminate between the directions of global motion that were produced by distributions whose mean directions differed slightly. In order to account for their results, Watamaniuk et al. used the line element model described here: the full range of directions was assumed to be spanned by 12, evenly-spaced Gaussian-shaped mechanisms. Center-to-separ- ation between mechanisms was taken to be 30 deg; each mechanism had a haIf-amplitude, half-bandwidth of 30 deg. For Q, the nonlinear pooling exponent, a value of Q = 2 yielded a good account of results from most experimental conditions, just as that value did here. When cinematograms were presented for very short durations, e.g. 3 frames, Q = 2 failed to fit the results satisfactorily, but Q = 6 succeeded. Watamaniuk et al. interpreted this as signifying a time-dependent variation in the visual sys- tem’s nonlinear summation. Note, however, that Q = 2, the value we used, sufficed for their stimulus durations that spanned ours.
CONCLUSIONS
We have found that a surprisingly small number of discrete directions of motion can sum to form a metameric match to the percept of motion generated by a broad-band of directions of motion. The experimental results indicate that the variation in the number of directions required to match, as the bandwidth of the broad-band stimulus varies, can be accounted for by non-linear summation of information from just 12 direction selective mechanisms with a half-amplitude half bandwidth of 30deg.
Aekno~iedgemeni-This research was supported by grants AFOSR-85-0246 and 89-0243 from the U.S. Air Force Office of Scientitic Research.
REFERENCES
Bouman, M. A. & Walraven, P. L. (1972). Color discrimi- nation data. In Hurvich, L. M. & Jameson, D. (Eds.), Handbook of sensory physiology (Vol. VI1,/4, pp. 484-5 16). Berlin: Springer.
Graham, C. H. (1965). Color: Data and theories, In Graham, C. H., Bartlett, N. R., Brown, J. L., Hsia, Y., Miiller, C. G. & Riggs. L. A. (Eds.), Vision and uisuul perception (pp. 414-451). New York: Wiley.
Maunseil, J. H. R. & Van Essen, D. C. (1983). Functional properties of neurons in middle temporal visual area of the macaque monkey. I. Selectivity for stimulus dir~tion. speed, and orientation. Journal qf Neurophysioiogy, 49, 1127-I 147.
Newsome, W. T. & Pare, E. B. (1988). A selective impair- ment of motion perception following lesions of the middle temporal visual area (MT). Jownal q” &uroscience, 8, 2201-2211.
Quick, R. F. (1974). A v~tor-ma~itude mode1 for contrast detection. Kybernetik. 16, 65-61.
Richards, W. A. (1971). Motion perception in man and other animals. Brain. Behavior and Evolution, 4, 16%181.
Richards, W. A. (1979). Quantifying sensotry channels: Generalizing coiorimetry to orientation and texture, touch and tones. Sensory Processes, 3, 207-229.
Tynan, P. & Sekuler, R. (1977). Rapid measurement of contrast sensitivity functions. American Journal of Optometry and ~hysiolo~icai Optics, S4, 513-575.
Van de Grind, W. A., Van Doorn A. J. & Koenderink. J. J. (1983). Detection of coherent movement in peripherally viewed random-dot patterns. Journal qf the #p&al Society of America, 74, 1674-l 683.
Watamaniuk, S. N. J.. Sekuler, R. 81 Williams, D. W. (1989). Direction perception in complex dynamic dis- plays: The integration of direction information. Vision Research, 29, 47-60.
Williams, D. W. & Sekuler, R. (1984). Coherent global motion percepts from stochastic local motions. l&ion Research, 24, 55-62.


![Metamers of neural networks reveal divergence from human …mcdermottlab.mit.edu/papers/Feather_etal_2019_NeurIPS_me... · 2020-01-08 · natural sound [30, 31]. Our work here is](https://img.pdfslide.us/doc/110x75/5e6837783bfff10bec151fe7/metamers-of-neural-networks-reveal-divergence-from-human-2020-01-08-natural-sound.jpg)