Embed Size (px)
Citation preview

Using maximum entropy to predict the potentialdistribution of an invasive freshwater snail
MONICA PAPES�* , JOHN E. HAVEL † AND M. JAKE VANDER ZANDEN‡
*Department of Integrative Biology, Oklahoma State University, Stillwater, OK, U.S.A.†Department of Biology, Missouri State University, Springfield, MO, U.S.A.‡Center for Limnology, University of Wisconsin-Madison, Madison, WI, U.S.A.
SUMMARY
1. Ecological niche modelling is a technique used to estimate potential distributions of invasive
species based on available occurrence data and associated environmental conditions. Maximum
entropy (Maxent) is a powerful method for ecological niche modelling and yet has only rarely been
applied to aquatic species.
2. Here we applied Maxent to estimate the potential distribution of the invasive Chinese mystery
snail (Cipangopaludina chinesis) in Wisconsin and analysed several methodological issues associated
with using Maxent for lentic species.
3. To generate Maxent estimates of the potential distribution of C. chinesis, we used presence records
from 292 lakes, five spatially explicit climatic variables, and two lake-specific environmental data sets
(area, conductivity) from 7995 lakes. Our investigations included three aspects that could affect
model prediction accuracy and transferability: (i) combining climate and lake variables into a single
data set in two different ways, using each lake as a single observation and as a grid of 1 ha cells; (ii)
varying the size of the background data set (locations without presences); and (iii) contrasting
environmental conditions between locations with and without C. chinesis.
4. The lake-based model had higher accuracy than the grid-based model, although both models had
accuracy values indicative of good performance. Conductivity and lake area were important
predictor variables for both models, but had higher contribution to the lake-based model accuracy.
Decreasing the background sample size minimally affected model accuracy and thus Maxent can be
used even when background sampling does not meet the algorithm’s default settings. Lastly, lakes
that were environmentally dissimilar from lakes with known C. chinesis records were more likely to
be predicted unsuitable by both grid-based and lake-based models.
5. Overall, the models predicted high potential suitability across Wisconsin lakes for C. chinesis,
especially in lakes ≥60 ha. Our study provides evidence that small or environmentally biased
presence data sets may underestimate the number of environmentally suitable locations of invasive
species.
Keywords: Bellamya chinensis, chinese mystery snail, Cipangopaludina chinensis, ecological niche modelling,Maxent
Introduction
With growing recognition of the adverse impacts of
invasive species, researchers have increasingly focused
on modelling their potential spread and distribution
(Kareiva, 1996; Sakai et al., 2001; Leung et al., 2005;
Asner et al., 2008; Vander Zanden & Olden, 2008; Papes�et al., 2011). One commonly used approach for assessing
potential distributions of invasive species is ecological
niche modelling (Peterson, Papes� & Kluza, 2003; Arriaga
et al., 2004; Steiner et al., 2008; Kulhanek, Leung &
Ricciardi, 2011; Hill et al., 2012). The general concept
Correspondence: Monica Papes�, Oklahoma State University, Department of Integrative Biology, 501 LSW, Stillwater, OK 74078, U.S.A.
E-mail: [email protected]
© 2016 John Wiley & Sons Ltd 457
Freshwater Biology (2016) 61, 457–471 doi:10.1111/fwb.12719

involves identifying statistically significant associations
between known species occurrences and environmental
variables (usually climate-based) and using these associ-
ations to locate suitable environmental conditions in a
region of interest (Peterson & Vieglais, 2001).
Ecological niche modelling has benefitted from a
recent proliferation of new methods and approaches
(reviewed in Elith & Leathwick, 2009; Peterson et al.,
2011). Methods vary in the type of species information
needed (presence only or presence and absence), per-
formance with low samples or spatially biased samples,
and model transferability to new regions or environ-
mental conditions (reviewed in Elith & Leathwick,
2009). Maxent, a maximum entropy algorithm (Phillips,
Anderson & Schapire, 2006), has been widely used for
ecological niche modelling in terrestrial systems and
has been shown to produce high accuracy models (Her-
nandez et al., 2006). With Maxent, environmental condi-
tions associated with species presence data are
compared to those of a large random sample of back-
ground sites (sites without presence information; Phil-
lips & Dud�ık, 2008). For predictors, Maxent studies
generally use gridded (rasterised) climatic data sets
such as WorldClim (Hijmans et al., 2005) or remotely
sensed environmental data sets (Papes�, Peterson &
Powell, 2012). These data are available as digital maps
(GIS layers) and are highly amenable for niche mod-
elling because they provide a sufficient number of
background sites for the approach. Generally, Maxent
is used to estimate the relative environmental
suitability for a species (Phillips & Dud�ık, 2008; Guil-
lera-Arroita, Lahoz-Monfort & Elith, 2014), but recent
modifications to Maxent have been proposed to esti-
mate intensity of occurrence through a Poisson Point
Process modelling approach (Renner & Warton, 2013;
Renner et al., 2015).
The extent to which aquatic species distributions are
limited by climate may be debatable. While at broad
geographic scales climate is likely to determine species
distributions (Gaston, 2003), waterbody-specific factors
are known to constrain species distributions at finer
spatial scales (Brown, 2001), leading to patchy spatial
distributions (Jackson, Peres-Neto & Olden, 2001; Papes�et al., 2011). Maxent has been widely used for terrestrial
systems; in contrast, this method has rarely been
applied to freshwater systems (close to 900 versus 23
publications respectively; Web of Science query, 2 July
2015). Maxent estimates of terrestrial species distribu-
tions generally rely on climatic predictor variables,
whereas aquatic ecologists often focus on regional or
finer spatial scales, with waterbody-specific variables
such as lake size, pH, chlorophyll, and conductivity as
potentially limiting freshwater species distributions
(Mercado-Silva et al., 2006; Cordell, Tear & Bollens,
2010; Kornis & Vander Zanden, 2010; Kulhanek et al.,
2011; Olden, Vander Zanden & Johnson, 2011; Stewart-
Koster et al., 2013; Tamayo & Olden, 2014). Given the
difficulties of collecting waterbody-specific data at broad
scales and for thousands of rivers or lakes (e.g. J€ahnig
et al., 2012), most Maxent studies of freshwater species
have used climate data as predictor variables and grid
cells rather than individual waterbodies as the units of
analysis (Table 1). As a result, in general, the potential
distributions do not distinguish between terrestrial and
Table 1 Summary of published studies estimating aquatic invasive species potential distributions, using Maxent and grid-based environ-
mental variables.
Reference Environmental data used Spatial resolution Extent
Barnes et al. (2014) Temperature 0.5 degrees (50 km) North America
Byers et al. (2013) Climate N/A SE United States
Gallardo & Aldridge (2015) Climate, elevation, geology,
anthropogenic, land use
5 arc-minutes (9 km) SE Europe, Great Britain
Gallardo and Aldridge ((2013) Climate, geology, socio-economic 30 arc-seconds (1 km) Great Britain, Ireland
Gallardo, Ermgassen and Aldridge (2013) Climate, elevation, geology 5 arc-minutes (9 km) Europe, North America
Kumar et al. (2009) Climate, topography, land cover,
vegetation index, geology, hydrology
30 arc-seconds (1 km) United States
Larson, Olden and Usio (2010) Climate 5 arc-minutes (9 km) Japan, NW North America
Masin et al. (2014) Climate, solar radiation, vegetation index 10 arc-minutes (18 km) Global
McDowell, Benson and Byers (2014) Climate N/A United States
Montecino et al. (2014) Climate, topography, hydrology,geology,
vegetation
30 arc-seconds (1 km) Chile, United States
Morehouse and Tobler (2013) Climate 30 arc-seconds (1 km) United States
Poulos et al. (2012) Climate, topography, hydrology 30 arc-seconds (1 km) United States
Quinn, Gallardo and Aldridge (2014) Climate, elevation, geology 2 arc-minutes (4 km) Europe, United States
Reshetnikov and Ficetola (2011) Climate 10 arc-minutes (18 km) Eurasia
© 2016 John Wiley & Sons Ltd, Freshwater Biology, 61, 457–471
458 M. Papes� et al.
freshwater cells and thus are not waterbody-specific.
However, state-level efforts to develop GIS databases of
waterbody-specific environmental variables (e.g. Wis-
consin Department of Natural Resources Surface Water
Integrated Monitoring System, Minnesota Geospatial
Information Office Surface Water Resource Data), as
well as national (e.g. USGS National Water Information
System) and multi-national initiatives (e.g. GLEON,
CUAHSI; Ames et al., 2009; Weathers et al., 2013), indi-
cate potential for future studies that are waterbody-spe-
cific, at regional and broader scales. Lastly, Maxent
requires a large background data set, further limiting its
application for freshwater systems, where data sets tend
to be one or two orders of magnitude smaller than for
terrestrial systems (Olden & Jackson, 2002). In essence,
the contrast between freshwater and terrestrial species’
estimations of potential distributions lies in the limita-
tion to presence of water for the former and the associ-
ated challenges of variable and modelling algorithm
selection (see Domisch et al., 2015 for a review of issues
in riverine systems).
Although niche modelling tools such as Maxent may
be powerful for identifying suitable freshwater environ-
ments, there are several issues pertaining to lakes that
require in-depth investigations. In this study, we use
Maxent to estimate the potential distribution of invasive
Chinese mystery snail (Cipangopaludina chinensis malleata
Gray 1863: Viviparidae) in Wisconsin, U.S.A. The Chi-
nese mystery snail (hereafter CMS) has also been recog-
nised as Bellamya chinensis (Smith, 2000), but the
nomenclature is still uncertain, so we follow the name in
most common usage (Turgeon et al., 1998). CMS is a
large snail that was introduced from Asia into United
States in the late 1800s and currently has established
populations in 21 states (of a total of 34 states with con-
firmed records; Jokinen, 1982; U.S. Geological Survey,
2014). High resistance to air exposure suggests high
potential for overland dispersal by boats (Havel, 2011).
In the United States, large variation in population den-
sity and growth rates have been reported (Solomon
et al., 2010; McCann, 2014). Nevertheless, CMS does not
appear to have a strong effect on assemblages of native
gastropods in north-temperate lakes (Solomon et al.,
2010).
We use the case of CMS to investigate three method-
ological issues. First, the effect of combining gridded cli-
mate and lake attribute data to model accuracy has not
been formally evaluated in ecological niche models, nor
has the effect of treating lakes as individual observations
versus grid cells. We compare models based on environ-
mental data formatted as grids, where lakes are
represented by cells, limited to the extent of lakes (thus
eliminating the surrounding terrestrial cells), to models
based on environmental data where each lake is repre-
sented by a single point (see Domisch et al., 2013 for a
similar approach in riverine systems). Second, we inves-
tigate the large background sample size requirement of
Maxent by evaluating model performance across a range
of background sampling intensities. Third, studies of ter-
restrial and stream species have shown limitations of
model transferability to environments that differ from
the ones associated with species presences, used to cali-
brate the model (Peterson, Papes� & Eaton, 2007; Zhu
et al., 2014; Gies et al., 2015). We investigate this issue in
lakes by quantifying environmental similarities between
presences and background samples through a multivari-
ate environmental similarity surface analysis (MESS)
and evaluating the effect of environmental dissimilarity
on model accuracy. This case study thus allows us to
address critical methodological issues and to provide
guidance for future research on estimating potential dis-
tributions of aquatic species.
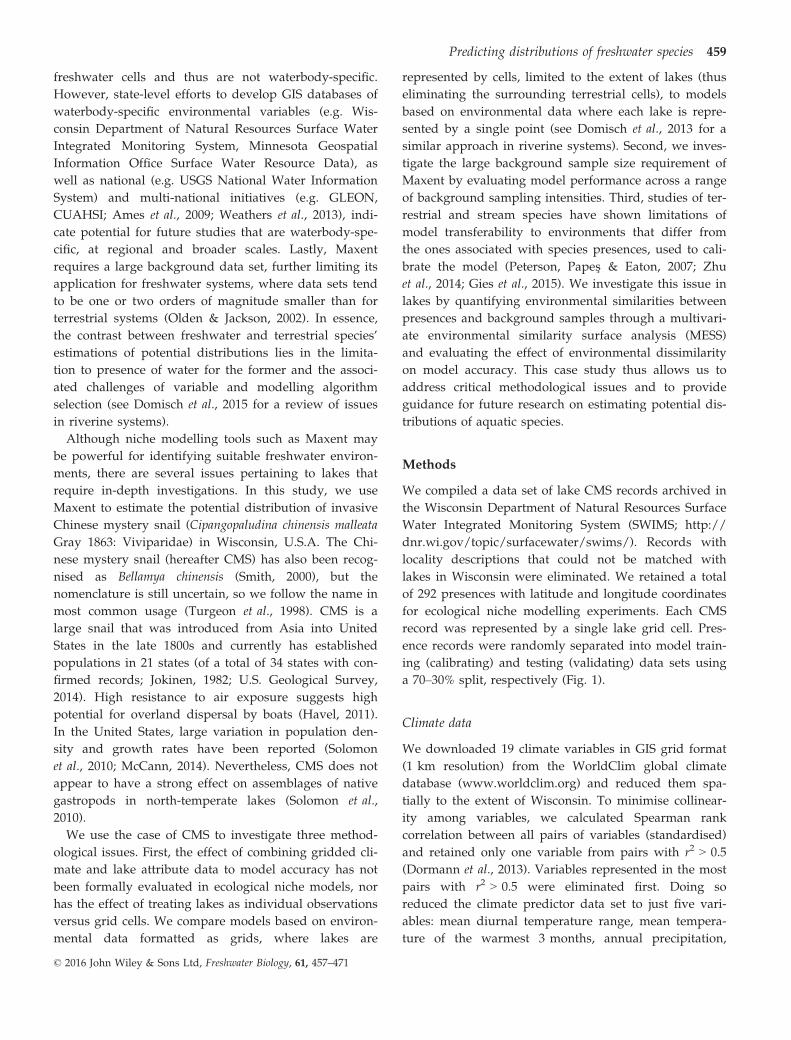
Methods
We compiled a data set of lake CMS records archived in
the Wisconsin Department of Natural Resources Surface
Water Integrated Monitoring System (SWIMS; http://
dnr.wi.gov/topic/surfacewater/swims/). Records with
locality descriptions that could not be matched with
lakes in Wisconsin were eliminated. We retained a total
of 292 presences with latitude and longitude coordinates
for ecological niche modelling experiments. Each CMS
record was represented by a single lake grid cell. Pres-
ence records were randomly separated into model train-
ing (calibrating) and testing (validating) data sets using
a 70–30% split, respectively (Fig. 1).
Climate data
We downloaded 19 climate variables in GIS grid format
(1 km resolution) from the WorldClim global climate
database (www.worldclim.org) and reduced them spa-
tially to the extent of Wisconsin. To minimise collinear-
ity among variables, we calculated Spearman rank
correlation between all pairs of variables (standardised)
and retained only one variable from pairs with r2 > 0.5
(Dormann et al., 2013). Variables represented in the most
pairs with r2 > 0.5 were eliminated first. Doing so
reduced the climate predictor data set to just five vari-
ables: mean diurnal temperature range, mean tempera-
ture of the warmest 3 months, annual precipitation,
© 2016 John Wiley & Sons Ltd, Freshwater Biology, 61, 457–471
Predicting distributions of freshwater species 459

precipitation seasonality, and precipitation of the wettest
3 months.
Lake data compilation and formatting
Lake-specific data for lakes ≥1 ha in size were assembled
from various state and federal sources (Papes� et al.,
2011). We included only lake area and conductivity as
predictors, as these variables were frequently repre-
sented in our database of lakes (thus maximising the
number of lakes considered in the analysis) and have
been shown to be most influential for the distribution of
snails (Brown, 2001; Hrabik et al., 2005; Latzka et al.,
2015). The final lake data set used for the modelling
experiments included 7995 lakes, which represent 53%
of lakes in Wisconsin.
We combined climate and lake variables into a single
data set in two distinct ways, in order to compare how
different data set formats affect model predictions
(Fig. 2). The first approach treats each individual lake as
a single observation (hereafter termed ‘lake’). The sec-
ond approach treats individual lakes as comprised of
multiple 1-ha grid cells (hereafter termed ‘grid’). In the
grid approach, a given lake is represented by multiple
grid cells, such that the number of grid cells for a lake is
proportional to lake area. All grid cells representing a
single lake had the same area and conductivity values,
corresponding to that particular lake. Note that we did
not estimate CMS distributions for all grid cells in the
state of Wisconsin (waterbodies and surrounding terres-
trial matrix), but rather only for grid cells that represent
lakes. Our lake data set included 7995 records (the num-
ber of lakes), while the grid data set included 82 000
observations (the number of 1-ha cells that represent
lakes).
Ecological niche modelling experiments
We used the environmental data and CMS presence
records in Maxent 3.3.3k (https://www.cs.prince-
ton.edu/~schapire/maxent/) to generate models of
environmental suitability and to map CMS potential dis-
tribution in Wisconsin. Maxent is based on the maxi-
mum entropy theory that, in ecological modelling,
0 30 60 km
Lakes with CMS presences
Used for model training
Used for model testingFig. 1 Lakes with confirmed Chinese
mystery snail records in Wisconsin, sepa-
rated into data sets used for model train-
ing (white circles) and model testing
(black circles).
© 2016 John Wiley & Sons Ltd, Freshwater Biology, 61, 457–471
460 M. Papes� et al.

estimates the probability distribution that is maximised
when considering a set of constraints (Phillips et al.,
2006). The constraints are defined in relation to the envi-
ronmental values associated with species known pres-
ences. Models that assign higher probability values to
presence sites compared to a random set of background
samples (sites without presences) are characterised by
higher log likelihood values. We used the default
parameter settings in Maxent 3.3.3k (for features used as
constraints, maximum number of background points,
maximum model iterations of 500, and model conver-
gence threshold) to run models using both grid and lake
data sets.
During model iteration Maxent performs several eval-
uation tests. First, to rank importance of environmental
variables, the contribution of each variable to overall
model accuracy gain is expressed as a proportion of con-
tributions of all variables. Second, the area under the
curve of the receiver operating characteristic (ROC
AUC) is used to assess model performance by plotting
model sensitivity (fraction of occurrences predicted suit-
able) on the y axis and 1 - specificity (fraction of back-
ground samples predicted suitable) on the x axis. A
ROC AUC score closer to 1 indicates high model accu-
racy, while a value ≤0.5 indicates models that are no
better than random (Hanley & McNeil, 1982). The appli-
cability of ROC to evaluating performance of models
obtained with presence-background modelling algo-
rithms has been questioned in recent literature and mod-
ifications of ROC have been proposed (Lobo, Jim�enez-
Valverde & Real, 2008; Peterson, Papes� & Sober�on, 2008;
Jim�enez-Valverde, 2012). As an additional measure of
model accuracy, Maxent also calculates omission error,
which is the proportion of presence records in the test-
ing data set incorrectly predicted as unsuitable. To cal-
culate omission error, a threshold is needed to transform
the model output that contains continuous suitability
values between 0 and 1 to a categorical form, unsuit-
able-suitable. We used the ‘lowest presence threshold’
(Anderson, Lew & Peterson, 2003), representing the
Maxent model output value at which all CMS presences
in the training data set were predicted suitable. The
omission error calculations were done separately for the
two models obtained with lake and grid data set for-
mats. We also calculated true skills statistic for the two
models, using the same threshold, unsuitable-suitable
model outputs. The true skills statistic (TSS) is calculated
as sensitivity plus specificity minus 1 and thus it
accounts for correct predictions of both presences and
absences to evaluate model performance (Allouche,
Aerial view of a subset of the lakes included in this study
Individual lake observations (lake dataset format)
Gridded lake observations (grid dataset format)
(b)
(c)
(a)
Fig. 2 A subset of the lakes in Wisconsin included in this study (a; white triangles) and the two representations of lakes in the environmen-
tal data sets used in the models: individual observations for each lake (b; lake data set format) and gridded variables in 1-ha cells (c; grid
data set format, showing conductivity values in grey scale).
© 2016 John Wiley & Sons Ltd, Freshwater Biology, 61, 457–471
Predicting distributions of freshwater species 461

Tsoar & Kadmon, 2006). TSS ranges from �1 to 1, with
values <0 attributable to a random model and has been
shown to be unaffected by the size of the validation data
set or species’ prevalence (Allouche et al., 2006). As we
studied the invasive potential of CMS, we did not have
absence data, thus the TSS was calculated using the
background samples.
Finally, we summarised the mismatch between the
binary suitable-unsuitable predictions of the grid and
lake-based models by calculating the percent of lakes
predicted suitable and unsuitable by one or both mod-
els. We visualised these results on a consensus map
showing lakes for which predictions of the two models
agreed or disagreed.
Multivariate analysis of lake environmental similarity
Model transferability to environmental conditions that
are markedly different can be unreliable, resulting in
unrealistic or incomplete predictions of potential distri-
butions (Peterson et al., 2007). To assess if our results
would be affected by model transferability, we used a
second set of modelling experiments to estimate the dif-
ferences between the environmental conditions of the
lakes with CMS and those in the entire study region. We
used the multivariate environmental similarity surface
analysis (MESS) implemented in Maxent 3.3.3k to calcu-
late the percentage of lakes associated with CMS pres-
ences (292 lakes) that differ in their environmental
values compared to the rest of Wisconsin lakes (7703
lakes). MESS determines fi, the percentage of reference
sites that have lower environmental variable values than
the site of interest, and calculates the similarity value for
the site of interest as 2 * fi if 0 < fi ≤ 50 and 2(100 � fi) if
50 < fi ≤ 100, for each environmental dimension; the
minimum similarity value across all environmental vari-
ables represents the multivariate similarity of the site of
interest (Elith, Kearney & Phillips, 2010). We then
revised the CMS consensus prediction map obtained
with the first set of Maxent experiments to identify the
lakes (sites of interest) estimated with MESS as having
environmental conditions that are distinct from those of
the presence records (reference sites). Such environmen-
tal differences could indicate higher uncertainty of the
prediction.
Background sampling experiment
The default setting in Maxent of 10 000 background
samples may not be feasible for freshwater species stud-
ies due to the limited availability of lake-specific (or
river-specific) environmental data. To investigate the
effect of background sample size on model accuracy, we
withheld randomly selected subsets of lakes from the
available 7703 lakes. Specifically, we decreased the back-
ground sample size by increasing the presence/back-
ground ratio from the observed value of 0.03 (292
presence lakes/7703 background lakes), to 0.1, 0.25, 0.3,
0.5, 0.75, 1, 1.25, 1.5, 1.75 and 2. Thus, the background
data sets in our 10 simulations ranged from approaching
the default 10 000 background samples option in Max-
ent, to nearly two orders of magnitude lower (back-
ground sample of 146 lakes; presence/background = 2).
We then compared the ROC AUC, TSS, test omission
error, and proportion of lakes predicted suitable across
the 10 simulations to evaluate the sensitivity of Maxent
performance to background sample sizes.
Results
Ecological niche modelling experiments
We obtained two different rankings of environmental
variables that contributed most to the ecological niche
models using grid and lake data set formats. However,
the highest contributing variable for both models was
lake area. Most of the lakes (95%) predicted suitable for
CMS by the lake-based model had area ≥65 ha and most
(95%) of the unsuitable predictions were for lakes with
area ≤60 ha. In the case of grid-based model prediction,
we obtained some overlap in lake area values of most
lakes (95%) predicted suitable (≥35 ha) and unsuitable
(≤65 ha). The tendency for larger lakes to be predicted
present may be explained by the high proportion (70%)
of large lakes (≥65 ha) in the presence data set used to
train the models, probably because larger lakes are more
likely to be accessible and sampled for invasive species.
A cumulative variable contribution >90% to model accu-
racy gain was achieved with four variables for the grid-
based model and just two variables for the lake-based
model (Table 2). Conductivity contributed towards the
cumulative 90% accuracy gain of both models, but in
contrast with lake area, we did not observe a distinct
separation of conductivity values between suitable and
unsuitable lakes.
The performance of the grid-based model was lower
than that of the lake-based model, as measured by ROC
AUC (Table 2). Nevertheless, both models had ROC
AUC scores that are considered indicative of good per-
formance (>0.7; Swets, 1988). The second measure of
model performance, omission error (lakes with known
CMS records predicted unsuitable) calculated using the
© 2016 John Wiley & Sons Ltd, Freshwater Biology, 61, 457–471
462 M. Papes� et al.

minimum training presence threshold, produced more
comparable values between the two models (Table 2): of
the known CMS presences (in the testing data set), 3%
were incorrectly predicted unsuitable by the grid-based
model and 0% by the lake-based model. The third evalu-
ation method, TSS, indicated good performance of both
models (Table 2, TSS > 0; Allouche et al., 2006).
Both models predicted that a high proportion of lakes
should be suitable for CMS: 47% of lakes by the lake-
based model and 55% by the grid-based model. In addi-
tion to overall number of lakes predicted suitable, we
compared model predictions from lake-based and grid-
based approaches for each lake (Fig. 3a and b). There
was disagreement between the two approaches for 11%
of the lakes (Table 3). Overall, there was no obvious spa-
tial pattern to the lake suitability predictions (Fig. 3a).
We used consensus maps of CMS potential distribution
to further evaluate the geographic distribution of the
agreement (89% of the lakes; Fig. 4a) and disagreement
(11% of the lakes; Fig. 4b) between the two models. The
model agreement and disagreement did not show partic-
ular geographic patterns, indicating lack of model bias
towards a geographic region.
Multivariate analysis of lake environmental similarity
Given that transferability of models to new regions and
new environmental conditions could generate unreliable
predictions (Zhu et al., 2014), we refined the consensus
map based on environmental similarity of lakes. The
MESS analysis identified 51% of the lakes as environ-
mentally dissimilar from lakes with CMS presences and
49% as similar (Fig. 5a and b, respectively). Of the 51%
lakes that were environmentally dissimilar from lakes
with CMS records, 75% were predicted unsuitable by
both models, 17% were predicted suitable by one model,
and 8% were predicted suitable by both models
(Fig. 5a). Thus, the model unreliability due to environ-
mental dissimilarity was largely associated with predic-
tions of unsuitability. In contrast, of the lakes that were
environmentally similar to CMS presence lakes (49%),
most (86%) were predicted suitable by both models
(Fig. 5b). Of the remainder, 4% by one model and 10%
were predicted unsuitable by both models (Fig. 5b). For
environmentally dissimilar lakes, the MESS analysis
identified lake area as the variable most frequently
(82%) different between background lakes and those
with CMS. Small lakes (<8 ha) represented the majority
(94%) of the dissimilar lakes, whereas lakes similar to
the ones used to train the models were concentrated in
the medium size range (8–80 ha).
Background sampling experiment
Our background sampling experiment using the lake
data set format indicated that Maxent generates models
that perform well (ROC AUC >0.7; omission error <0.01)
with background sample sizes down to one order of
magnitude lower than the default 10 000 (Fig. 6). The
omission error remained low (<0.1) for all models,
regardless of background sample size, indicating good
model performance (Fielding & Bell, 1997). ROC AUC
scores of models decreased steadily with decreasing
sample sizes (Fig. 6), but remained above 0.7, also indi-
cating good model performance (Hanley & McNeil,
1982), until reaching the lowest two background sample
sizes (167 and 146 samples), close to two orders of mag-
nitude lower than the default 10 000 background sam-
ples. Similarly, the TSS values decreased with sample
sizes, but remained above zero (indicative of models bet-
ter than random). However, the proportion of lakes pre-
dicted suitable increased steadily, suggesting that
discrimination between suitable and unsuitable lakes
becomes more difficult with decreasing background
sample sizes (Fig. 6). Decreasing the number of back-
ground samples had the strongest effect on the propor-
tion of lakes predicted suitable for CMS: we obtained an
average 3% increase with each reduction of background
sample size, from 40% of lakes predicted suitable by the
model that used all background samples, to 80% by the
Table 2 Summary of accuracy measures and environmental variable contribution to models obtained using environmental data sets repre-
senting lakes as individual observation (lake data set format) or gridded (grid data set format)
Type of lake representation Omission error TSS ROC AUC
Highest contribution
(variable; value)
Variables with summed
contribution >90%
Individual observations
(lake data set format)
0 0.54 0.92 Lake area; 85.5% Lake area, conductivity
Gridded observations
(grid data set format)
0.03 0.37 0.79 Lake area; 71.7% Lake area, conductivity,
precipitation of the wettest quarter,
mean diurnal temperature range
© 2016 John Wiley & Sons Ltd, Freshwater Biology, 61, 457–471
Predicting distributions of freshwater species 463

model that used the lowest number of background
samples.
Discussion
Estimates of potential distributions of invasive species
are increasingly a part of invasive species prevention
and management efforts, thereby allowing for proactive
management (Leung & Mandrak, 2007; Vander Zanden
& Olden, 2008; Papes� et al., 2011). Ecological niche mod-
elling studies traditionally rely on climate predictor vari-
ables and estimate species potential distributions at
broad spatial scales, at which climate is likely to
constrain species distributions (Jim�enez-Valverde et al.,
2011). The local environmental factors that presumably
determine species distributions at finer scales are typi-
cally not incorporated (but see Hopkins & Burr, 2009;
Oliveira et al., 2010; Wilson, Roberts & Reid, 2011; Breece
et al., 2013; Stewart-Koster et al., 2013; Kuemmerlen
et al., 2014 for examples of riverine studies). These con-
straints stem from unavailability of such information for
large data sets of waterbodies and are well-illustrated
when we consider predicting invasive species in lakes.
A traditional ecological niche modelling framework of
predicting species occurrence in grid cells from climate
variables may not capture lake-specific patterns.
Our models predicted roughly half of lakes in Wiscon-
sin to be suitable for CMS (Table 3). The grid-based
model predicted higher suitability compared to the lake-
based approach (55% versus 48% of the lakes, Table 3).
This difference is likely due to the fact that the grid-
based approach treats an individual lake as comprised
of multiple cells, with the number of cells being propor-
tional to lake area, and large lakes are more likely to be
suitable. Since individual lakes or river segments (rather
than grid cells) are the unit of analysis for limnologists,
results of the lake-based modelling approach are more
0 30 60 km
Lakes predicted unsuitableLakes predicted suitable
0 30 60 km
Lakes predicted unsuitableLakes predicted suitable
Lake-based model prediction Grid-based model prediction(a) (b)
Fig. 3 The potential distribution of Chinese mystery snail in Wisconsin lakes obtained with models based on the two formats of environ-
mental data: lake data set (individual lake observations; a) and grid data set (gridded lake observations; b). Lakes predicted unsuitable are
identified by the white triangles and suitable lakes by the black triangles. The maps are comparable given the overall prediction agreement
between the two models (89% of the lakes; see also Fig. 4).
Table 3 Comparison of predictions obtained with models using
lake and grid data set formats. Numbers represent the percent of
lakes for which the model predictions agreed or disagreed (in bold)
Grid
Suitable Unsuitable
Lake
Suitable 46 2
Unsuitable 9 43
© 2016 John Wiley & Sons Ltd, Freshwater Biology, 61, 457–471
464 M. Papes� et al.

Lakes predicted unsuitable byboth modelsLakes predicted suitable by both models
Agreement between model predictions Disagreement between model predictions
0 30 60 km 0 30 60 km
Lakes predicted unsuitable byone model and suitable bythe other
(a) (b)
Fig. 4 A consensus map of potential distributions of Chinese mystery snail obtained with the two models based on lake and grid data sets.
Lakes predicted unsuitable (white triangles) or suitable (black triangles) by both models are shown in panel a; prediction mismatch, suitable
lakes according to one model and unsuitable according to the other (dotted circles), is shown in panel b.
Environmental similarity and model predictionsEnvironmental dissimilarity and model predictions
Lakes predicted unsuitable byboth modelsLakes predicted suitable by both modelsLakes predicted unsuitable byone model and suitable bythe other
Lakes predicted unsuitable byboth modelsLakes predicted suitable by both modelsLakes predicted unsuitable byone model and suitable bythe other
0 30 60 km 0 30 60 km
(a) (b)
Fig. 5 Potential distribution variability in relation to environmental dissimilarity and similarity between lakes without and lakes with Chi-
nese mystery snail records in Wisconsin. Note that for environmentally dissimilar lakes (panel a), both models predict most of the lakes
unsuitable for Chinese mystery snail (74.7% of the dissimilar lakes), whereas for similar lakes (panel b), both models predict most of the
lakes suitable for Chinese mystery snail (86% of the similar lakes).
© 2016 John Wiley & Sons Ltd, Freshwater Biology, 61, 457–471
Predicting distributions of freshwater species 465

readily interpretable. To make our predictions for speci-
fic lakes available, we have added our assessment of
lake suitability from the lake-based model to the Inva-
sive Species Interactive Mapping System for Wisconsin
(www.aissmartprevention.wisc.edu). This decision sup-
port tool is designed to help resource managers and lake
associations in their ongoing efforts to prioritise and pre-
vent the spread of freshwater invasive species (Papes�et al., 2011).
Overall, there were no obvious spatial patterns in the
lake suitability predictions (Fig. 3a). This result suggests
that lake-specific environmental conditions have a role
in determining predicted suitability to CMS. While two
climate variables (precipitation in the wettest quarter
and mean diurnal temperature range) contributed to the
grid-based model, the lake-based model was mainly
influenced by local environmental variables (conductiv-
ity and lake area).
There are three novel aspects in our estimation of an
invasive species potential distribution in lakes: (i) we
considered lake-specific variables (conductivity and lake
area) in addition to climate variables; (ii) we restricted
the grid format of the variables to lakes and (iii) we
compared lake-based models to the commonly used
grid-based models (excluding terrestrial cells). Lake-
based models present the challenge of relying on
environmental information for waterbodies that is
difficult to obtain at broad scales. In terrestrial systems,
the use of maximum entropy algorithm Maxent to
estimate potential distributions of species is extensive
because large scale climate data sets are freely avail-
able (e.g. WorldClim, PRISM). In lakes, environmental
information is more often summarised as single
observations per waterbody than a gridded surface.
The availability of lake-specific information affects the
amount of background sampling necessary to run Max-
ent. The implications of background sampling selection
have been comprehensively examined in recent litera-
ture, but mostly using terrestrial species (Anderson &
Raza, 2010; Merow, Smith & Silander, 2013) or virtual
species (Barve et al., 2011; Lobo & Tognelli, 2011; Bar-
bet-Massin et al., 2012). Thus, our study adds to this
discussion the effects for predicting potential distribu-
tions of aquatic species.
Our study indicates that Maxent can produce models
with good performance (as measured by ROC AUC,
omission error, and TSS) using background sample sizes
smaller than the default 10 000 points, but that model
accuracy declines as background sample size decreases,
particularly beyond sample sizes of 1000. In addition,
discrimination between suitable and unsuitable lakes
becomes questionable for models with background sam-
ples lower than 1000. We presume that a data set with
fewer background samples decreases the discrimination
power between suitable and unsuitable lakes because
the models are trained on less heterogeneous back-
ground data and environmental conditions are more
similar between presence and background data.
The environmental data set format (lake versus grid)
influenced model performance measures, but not
greatly. The lake-based model had lower omission error
and higher ROC AUC than the grid-based models; thus
the former can be considered more reliable than the lat-
ter. Nevertheless, the omission error, TSS, and ROC
RO
C A
UC
sco
re a
nd T
SS
Pro
porti
on o
f lak
es p
redi
cted
sui
tabl
e
CMS presences/background samples
0
0.2
0.4
0.6
0.8
1
0
0.2
0.4
0.6
0.8
1
0.03 0.1 0.25 0.3 0.5 0.75 1 1.25 1.5 1.75 2
Fig. 6 The effects of simulated decreasing background sample sizes on model performance, measured with ROC AUC (square symbol; val-
ues above 0.7 indicate good performance) and TSS (triangle symbol; values above 0 indicate models better than random) and on discrimina-
tory power between suitable and unsuitable lakes, assessed as the proportion of lakes predicted suitable (filled circle symbol). The
minimum training presence threshold was used to convert the Maxent continuous suitability values to binary suitable-unsuitable and calcu-
late proportion of lakes predicted suitable. The background samples sizes were selected based on the ratio between the number of known
Chinese mystery snail presence records (CMS) and the rest of the lakes.
© 2016 John Wiley & Sons Ltd, Freshwater Biology, 61, 457–471
466 M. Papes� et al.

AUC scores indicated good performance for both mod-
els. We attribute the good performance of the two mod-
els to large background sample sizes (default 10 000 for
the grid-based model and 7703 for the lake-based
model). Thus, in light of this comparison and the back-
ground simulation experiments, we propose that, if
background sample sizes are above 1000, the data set
format (lake or grid) may not have a major effect on
model performance for predicting environmental suit-
ability for invasive species in lakes.
The main goal of estimating environmental similarity
of a large number of locations to locations supporting
an invasive species is to generate a potential distribu-
tion map that can help with species prevention and
containment efforts (Stewart-Koster, Olden & Johnson,
2015; Uden et al., 2015). Our CMS consensus map
between the two models generated using the lake and
the grid data set formats indicated model disagreement
of the suitability or unsuitability of 11% of the lakes.
Depending on the species and prevention or contain-
ment situation, this level of discrepancy may or may
not be acceptable.
Upon further analysis of the consensus map that con-
sidered environmental dissimilarity between lakes with
and without known CMS presences, the models pre-
dicted that dissimilar lakes were mostly unsuitable for
CMS (75% of lakes). On the contrary, environmentally
similar lakes were largely predicted to be suitable for
CMS (86% of the lakes). Thus, it seems that the modelling
algorithm is more likely to associate environmentally dis-
similar conditions to unsuitability than to suitability pre-
dictions. While this outcome may be expected given that
Maxent attempts to estimate a species’ ecological niche
based on environmental associations with known pres-
ences of species, we note that limited knowledge of an
invasive species’ presence affects model accuracy and
potential distribution estimates. In the context of invasion
biology, previous studies using various modelling tech-
niques have investigated the effects of model transferabil-
ity on accuracy measurements (Randin et al., 2006;
Peterson et al., 2007; Fern�andez et al., 2012; Gies et al.,
2015). The reality of working with invasive species is that
the incomplete nature of presence information, either due
to sampling bias or invasion stage (undersaturated land-
scapes), will generally reduce the transferability of model
predictions to broad geographic areas. However, moni-
toring and prevention efforts would still need to consider
lakes or regions with high environmental dissimilarity, to
account for the possibility of underestimated potential
distributions.
Conclusions
We investigated the applicability of Maxent, an ecologi-
cal niche modelling algorithm frequently used in terres-
trial systems, to estimate the potential distribution of an
invasive species in Wisconsin lakes. We found that
environmental conditions summarised as individual lake
observations (lake data set format) produce lower accu-
racy Maxent models when the background sample sizes
are below one order of magnitude lower than the algo-
rithm default of 10 000 points. Our study also high-
lighted that the models tended to predict as unsuitable
lakes that are environmentally distinct from lakes with
the invasive Chinese mystery snail presence records.
Thus, potential distribution predictions may underesti-
mate environmental suitability for the species of interest
when the presence data set is small or environmentally
biased.
Acknowledgments
Wisconsin Department of Natural Resources provided
financial support to MJVZ and MP. JEH acknowledges
Missouri State University for a sabbatical leave. We
thank A. Mikulyuk, J. Walsh and two anonymous
reviewers for editing suggestions on a previous version
of this manuscript.
References
Allouche O., Tsoar A. & Kadmon R. (2006) Assessing the
accuracy of species distribution models: prevalence,
kappa and the true skill statistic (TSS). Journal of Applied
Ecology, 43, 1223–1232.Ames D.P., Horsburgh J., Goodall J., Whiteaker T., Tarboton
D. & Maidment D. (2009) Introducing the open source
CUAHSI Hydrologic Information System desktop appli-
cation (HIS Desktop). In: 18th World IMACS/MODSIM
Congress (Ed. Anderssen R.S., Braddock R.D., Newham
L.T.H.), pp. 4353–4359. Modelling and Simulation Society
of Australia and New Zealand and International Associa-
tion for Mathematics and Computers in Simulation,
Cairns, Australia.
Anderson R.P., Lew D. & Peterson A.T. (2003) Evaluating
predictive models of species’ distributions: criteria for
selecting optimal models. Ecological Modelling, 162, 211–232.
Anderson R.P. & Raza A. (2010) The effect of the extent of
the study region on GIS models of species geographic
distributions and estimates of niche evolution: prelimi-
nary tests with montane rodents (genus Nephelomys) in
Venezuela. Journal of Biogeography, 37, 1378–1393.
© 2016 John Wiley & Sons Ltd, Freshwater Biology, 61, 457–471
Predicting distributions of freshwater species 467

Arriaga L., Castellanos V.A.E., Moreno E. & Alarc�on J.
(2004) Potential ecological distribution of alien invasive
species and risk assessment: a case study of buffel grass
in arid regions of Mexico. Conservation Biology, 18, 1504–1514.
Asner G.P., Knapp D.E., Kennedy-Bowdoin T., Jones M.O.,
Martin R.E., Boardman J. et al. (2008) Invasive species
detection in Hawaiian rainforests using airborne imaging
spectroscopy and LiDAR. Remote Sensing of Environment,
112, 1942–1955.Barbet-Massin M., Jiguet F., Albert C.H. & Thuiller W.
(2012) Selecting pseudo-absences for species distribution
models: how, where and how many? Methods in Ecology
and Evolution, 3, 327–338.Barnes M.A., Jerde C.L., Wittmann M.E., Chadderton W.L.,
Ding J., Zhang J., Purcell M., Budhathoki M. & Lodge
D.M. (2014) Geographic selection bias of occurrence data
influences transferability of invasive Hydrilla verticillata
distribution models. Ecology and Evolution, 4, 2584–2593.Barve N., Barve V., Jim�enez-Valverde A., Lira-Noriega A.,
Maher S.P., Peterson A.T. et al. (2011) The crucial role of
the accessible area in ecological niche modelling and spe-
cies distribution modelling. Ecological Modelling, 222,
1810–1819.Breece M.W., Oliver M.J., Cimino M.A. & Fox D.A. (2013)
Shifting distributions of adult Atlantic sturgeon amidst
post-industrialization and future impacts in the Delaware
river: a maximum entropy approach. PLoS ONE, 8,
e81321.
Brown K.M. (2001) Mollusca: Gastropoda. In: Ecology and
Classification of North American Freshwater Invertebrates.
(EdsJ.H. Thorp & A.P. Covich), pp. 297–329. Academic
Press, San Diego, CA.
Byers J.E., McDowell W.G., Dodd S.R., Haynie R.S., Pintor
L.M. & Wilde S.B. (2013) Climate and pH predict the
potential range of the invasive apple snail (Pomacea insu-
larum) in the southeastern United States. PLoS ONE, 8,
e56812.
Cordell J.R., Tear L.M. & Bollens S.M. (2010) Modelling
physico-chemical factors affecting occurrences of a non-
indigenous planktonic copepod in northeast Pacific estu-
aries. Biological Invasions, 12, 1427–1445.Domisch S., J€ahnig S.C., Simaika J.P., Kuemmerlen M. &
Stoll S. (2015) Application of species distribution models
in stream ecosystems: the challenges of spatial and tem-
poral scale, environmental predictors and species occur-
rence data. Fundamental and Applied Limnology, 186, 45–61.Domisch S., Kuemmerlen M., J€ahnig S.C. & Haase P. (2013)
Choice of study area and predictors affect habitat suit-
ability projections, but not the performance of species dis-
tribution models of stream biota. Ecological Modelling, 257,
1–10.Dormann C.F., Elith J., Bacher S., Buchmann C., Carl G.,
Carre G. et al. (2013) Collinearity: a review of methods to
deal with it and a simulation study evaluating their per-
formance. Ecography, 36, 27–46.Elith J., Kearney M. & Phillips S. (2010) The art of mod-
elling range-shifting species. Methods in Ecology and Evolu-
tion, 1, 330–342.Elith J. & Leathwick J.R. (2009) Species distribution models:
ecological explanation and prediction across space and
time. Annual Review of Ecology, Evolution, and Systematics,
40, 677–697.Fern�andez M., Hamilton H., Alvarez O. & Guo Q. (2012)
Does adding multi-scale climatic variability improve our
capacity to explain niche transferability in invasive spe-
cies? Ecological Modelling, 246, 60–67.Fielding A.H. & Bell J.F. (1997) A review of methods for the
assessment of prediction errors in conservation presence/
absence models. Environmental Conservation, 24, 38–49.Gallardo B. & Aldridge D.C. (2013) The ‘dirty dozen’: socio-
economic factors amplify the invasion potential of 12
high-risk aquatic invasive species in Great Britain and
Ireland. Journal of Applied Ecology, 50, 757–766.Gallardo B. & Aldridge D.C. (2015) Is Great Britain heading
for a Ponto-Caspian invasional meltdown? Journal of
Applied Ecology, 52, 41–49.Gallardo B., Ermgassen P.S.E.Z. & Aldridge D.C. (2013)
Invasion ratcheting in the zebra mussel (Dreissena poly-
morpha) and the ability of native and invaded ranges to
predict its global distribution. Journal of Biogeography, 40,
2274–2284.Gaston K.J. (2003) The Structure and Dynamics of Geographic
Ranges. Oxford University Press, Oxford.
Gies M., Sondermann M., Hering D. & Feld C.K. (2015) Are
species distribution models based on broad-scale environ-
mental variables transferable across adjacent watersheds?
A case study with eleven macroinvertebrate species. Fun-
damental and Applied Limnology, 186, 63–97.Guillera-Arroita G., Lahoz-Monfort J.J. & Elith J. (2014)
Maxent is not a presence–absence method: a comment on
Thibaud et al. Methods in Ecology and Evolution, 5, 1192–1197.
Hanley J.A. & McNeil B.J. (1982) The meaning and use of
the area under a receiver operating characteristic (ROC)
curve. Radiology, 143, 29–36.Havel J. (2011) Survival of the exotic Chinese mystery snail
(Cipangopaludina chinensis malleata) during air exposure
and implications for overland dispersal by boats. Hydrobi-
ologia, 668, 195–202.Hernandez P.A., Graham C.H., Master L.L. & Albert D.L.
(2006) The effect of sample size and species characteris-
tics on performance of different species distribution mod-
elling methods. Ecography, 29, 773–785.Hijmans R.J., Cameron S.E., Parra J.L., Jones P.G. & Jarvis
A. (2005) Very high resolution interpolated climate sur-
faces for global land areas. International Journal of Clima-
tology, 25, 1965–1978.
© 2016 John Wiley & Sons Ltd, Freshwater Biology, 61, 457–471
468 M. Papes� et al.

Hill M.P., Hoffmann A.A., Macfadyen S., Umina P.A. &
Elith J. (2012) Understanding niche shifts: using current
and historical data to model the invasive redlegged earth
mite, Halotydeus destructor. Diversity and Distributions, 18,
191–203.Hopkins R.L. II & Burr B.M. (2009) Modelling freshwater
fish distributions using multiscale landscape data: a case
study of six narrow range endemics. Ecological Modelling,
220, 2024–2034.Hrabik T.R., Greenfield B.K., Lewis D.B., Pollard A.I., Wil-
son K.A. & Kratz T.K. (2005) Landscape-scale variation in
taxonomic diversity in four groups of aquatic organisms:
the influence of physical, chemical, and biological proper-
ties. Ecosystems, 8, 301–317.Jackson D.A., Peres-Neto P.R. & Olden J.D. (2001) What
controls who is where in freshwater fish communities:
the roles of biotic, abiotic, and spatial factors. Canadian
Journal of Fisheries and Aquatic Sciences, 58, 157–170.J€ahnig S.C., Kuemmerlen M., Kiesel J., Domisch S., Cai Q.,
Schmalz B. et al. (2012) Modelling of riverine ecosystems
by integrating models: conceptual approach, a case study
and research agenda. Journal of Biogeography, 39, 2253–2263.
Jim�enez-Valverde A. (2012) Insights into the area under the
receiver operating characteristic curve (AUC) as a dis-
crimination measure in species distribution modelling.
Global Ecology and Biogeography, 21, 498–507.Jim�enez-Valverde A., Barve N., Lira-Noriega A., Maher
S.P., Nakazawa Y., Papes� M. et al. (2011) Dominant
climate influences on North American bird distributions.
Global Ecology and Biogeography, 20, 114–118.Jokinen E.H. (1982) Cipangopaludina chinensis (Gastropoda:
Viviparidae) in North America, review and update. Nau-
tilus, 96, 89–95.Kareiva P. (1996) Developing a predictive ecology for non-
indigenous species and ecological invasions. Ecology, 77,
1651–1652.Kornis M.S. & Vander Zanden M.J. (2010) Forecasting the
distribution of the invasive round goby (Neogobius
melanostomus) in Wisconsin tributaries to Lake Michigan.
Canadian Journal of Fisheries and Aquatic Sciences, 67, 553–562.
Kumar S., Spaulding S.A., Stohlgren T.J., Hermann K.A.,
Schmidt T.S. & Bahls L.L. (2009) Potential habitat distri-
bution for the freshwater diatom Didymosphenia geminata
in the continental US. Frontiers in Ecology and the Environ-
ment, 7, 415–420.Kuemmerlen M., Schmalz B., Guse B., Cai Q., Fohrer N. &
J€ahnig S.C. (2014) Integrating catchment properties in
small scale species distribution models of stream
macroinvertebrates. Ecological Modelling, 277, 77–86.Kulhanek S.A., Leung B. & Ricciardi A. (2011) Using eco-
logical niche models to predict the abundance and impact
of invasive species: application to the common carp. Eco-
logical Applications, 21, 203–213.
Larson E.R., Olden J.D. & Usio N. (2010) Decoupled conser-
vatism of Grinnellian and Eltonian niches in an invasive
arthropod. Ecosphere, 1, art16.
Latzka A.W., Crawford J.T., Koblings A.S., Caldeira Y.,
Hilts E. & Vander Zanden M.J. (2015) Representing calci-
fication in distribution models for aquatic invasive spe-
cies: surrogates perform as well as CaCO3 saturation
state. Hydrobiologia, 746, 197–208.Leung B., Finnoff D., Shogren J.F. & Lodge D. (2005)
Managing invasive species: rules of thumb for rapid
assessment. Ecological Economics, 55, 24–36.Leung B. & Mandrak N.E. (2007) The risk of establishment
of aquatic invasive species: joining invasibility and
propagule pressure. Proceedings Of The Royal Society B-Bio-
logical Sciences, 274, 2603–2609.Lobo J.M., Jim�enez-Valverde A. & Real R. (2008) AUC: a
misleading measure of the performance of predictive dis-
tribution models. Global Ecology and Biogeography, 17, 145–151.
Lobo J.M. & Tognelli M.F. (2011) Exploring the effects of
quantity and location of pseudo-absences and sampling
biases on the performance of distribution models with
limited point occurrence data. Journal for Nature Conserva-
tion, 19, 1–7.Masin S., Bonardi A., Padoa-Schioppa E., Bottoni L. & Fice-
tola G.F. (2014) Risk of invasion by frequently traded
freshwater turtles. Biological Invasions, 16, 217–231.McCann M.J. (2014) Population dynamics of the non-native
freshwater gastropod, Cipangopaludina chinensis (Vivipari-
dae): a capture-mark-recapture study. Hydrobiologia, 730,
17–27.McDowell W.G., Benson A.J. & Byers J.E. (2014) Climate
controls the distribution of a widespread invasive species:
implications for future range expansion. Freshwater Biol-
ogy, 59, 847–857.Mercado-Silva N., Olden J.D., T Maxted J., Hrabik T.R. &
Vander Zanden M.J. (2006) Forecasting the spread of inva-
sive rainbow smelt in the Laurentian Great Lakes region
of North America. Conservation Biology, 20, 1740–1749.Merow C., Smith M.J. & Silander J.A. (2013) A practical
guide to MaxEnt for modelling species’ distributions:
what it does, and why inputs and settings matter. Ecogra-
phy, 36, 1058–1069.Montecino V., Molina X., Kumar S., Castillo M.L.C. & Bus-
tamante R.O. (2014) Niche dynamics and potential geo-
graphic distribution of Didymosphenia geminata (Lyngbye)
M. Schmidt, an invasive freshwater diatom in Southern
Chile. Aquatic Invasions, 9, 507–519.Morehouse R.L. & Tobler M. (2013) Invasion of rusty cray-
fish, Orconectes rusticus, in the United States: niche shifts
and potential future distribution. Journal of Crustacean
Biology, 33, 293–300.Olden J.D. & Jackson D.A. (2002) A comparison of statistical
approaches for modelling fish species distributions. Fresh-
water Biology, 47, 1976–1995.
© 2016 John Wiley & Sons Ltd, Freshwater Biology, 61, 457–471
Predicting distributions of freshwater species 469

Olden J.D., Vander Zanden M.J. & Johnson P.T.J. (2011)
Assessing ecosystem vulnerability to invasive rusty cray-
fish (Orconectes rusticus). Ecological Applications, 21, 2587–2599.
Oliveira M.D., Hamilton S.K., Calheiros D.F., Jacobi C.M. &
Latini R.O. (2010) Modelling the potential distribution of
the invasive golden mussel Limnoperna fortunei in the
Upper Paraguay River system using limnological vari-
ables. Brazilian Journal of Biology, 70, 831–840.Papes� M., Peterson A.T. & Powell G.V.N. (2012) Vegetation
dynamics and avian seasonal migration: clues from remo-
tely sensed vegetation indices and ecological niche mod-
elling. Journal of Biogeography, 39, 652–664.Papes� M., S€allstr€om M., Asplund T.R. & Vander Zanden
M.J. (2011) Invasive species research to meet the needs of
resource management and planning. Conservation Biology,
25, 867–872.Peterson A. & Vieglais D. (2001) Predicting species inva-
sions using ecological niche modelling: new approaches
from bioinformatics attack a pressing problem. BioScience,
51, 363–371.Peterson A.T., Papes� M. & Eaton M. (2007) Transferability
and model evaluation in ecological niche modelling: a
comparison of GARP and Maxent. Ecological Modelling,
30, 550–560.Peterson A.T., Papes� M. & Kluza D.A. (2003) Predicting the
potential invasive distributions of four alien plant species
in North America. Weed Science, 51, 863–868.Peterson A.T., Papes� M. & Sober�on J. (2008) Rethinking
receiver operating characteristic analysis applications in
ecological niche modelling. Ecological Modelling, 213, 63–72.
Peterson A.T., Sober�on J., Pearson R.G., Anderson R.P.,
Mart�ınez-Meyer E., Nakamura M. et al. (2011)
Modelling algorithms. In: Ecological Niches and Geographic
Distributions (Ed. Peterson A. T., Sober�on J., Pearson R.
G., Anderson R. P., Mart�ınez-Meyer E., Nakamura M.
and Ara�ujo M. B.), pp. 101–112. Monographs in popula-
tion biology. Princeton University Press, Princeton, NJ.
Phillips S.J., Anderson R.P. & Schapire R.E. (2006) Maxi-
mum entropy modelling of species geographic distribu-
tions. Ecological Modelling, 190, 231–259.Phillips S.J. & Dud�ık M. (2008) Modelling of species distri-
butions with Maxent: new extensions and a comprehen-
sive evaluation. Ecography, 31, 161–175.Poulos H.M., Chernoff B., Fuller P.L. & Butman D. (2012)
Mapping the potential distribution of the invasive red
shiner, Cyprinella lutrensis (Teleostei: Cyprinidae) across
waterways of the conterminous United States. Aquatic
Invasions, 7, 377–385.Quinn A., Gallardo B. & Aldridge D.C. (2014) Quantifying
the ecological niche overlap between two interacting
invasive species: the zebra mussel (Dreissena polymorpha)
and the quagga mussel (Dreissena rostriformis bugensis).
Aquatic Conservation-Marine and Freshwater Ecosystems, 24,
324–337.Randin C.F., Dirnb€ock T., Dullinger S., Zimmermann N.E.,
Zappa M. & Guisan A. (2006) Are niche-based species
distribution models transferable in space? Journal of Bio-
geography, 33, 1689–1703.Renner I.W., Elith J., Baddeley A., Fithian W., Hastie T.,
Phillips S.J. et al. (2015) Point process models for pres-
ence-only analysis. Methods in Ecology and Evolution, 6,
366–379.Renner I.W. & Warton D.I. (2013) Equivalence of MAXENT
and Poisson Point Process Models for Species Distribu-
tion Modelling in ecology. Biometrics, 69, 274–281.Reshetnikov A.N. & Ficetola G.F. (2011) Potential range of
the invasive fish rotan (Perccottus glenii) in the Holarctic.
Biological Invasions, 13, 2967–2980.Sakai A.K., Allendorf F.W., Holt J.S., Lodge D.M., Molofsky
J., With K.A. et al. (2001) The population biology of inva-
sive species. Annual Review of Ecology and Systematics, 32,
305–332.Smith D.G. (2000) Notes on the taxonomy of introduced Bel-
lamya (Gastropoda: Viviparidae) species in northeastern
North America. Nautilus, 114, 31–37.Solomon C., Olden J., Johnson P.J., Dillon R. Jr & Zanden
M.J. (2010) Distribution and community-level effects of
the Chinese mystery snail (Bellamya chinensis) in northern
Wisconsin lakes. Biological Invasions, 12, 1591–1605.Steiner F.M., Schlick-Steiner B.C., VanDerWal J., Reuther
K.D., Christian E., Stauffer C. et al. (2008) Combined
modelling of distribution and niche in invasion biology: a
case study of two invasive Tetramorium ant species. Diver-
sity and Distributions, 14, 538–545.Stewart-Koster B., Boone E.L., Kennard M.J., Sheldon F.,
Bunn S.E. & Olden J.D. (2013) Incorporating ecological
principles into statistical models for the prediction of spe-
cies’ distribution and abundance. Ecography, 36, 342–353.Stewart-Koster B., Olden J.D. & Johnson P.T.J. (2015) Inte-
grating landscape connectivity and habitat suitability to
guide offensive and defensive invasive species manage-
ment. Journal of Applied Ecology, 52, 366–378.Swets J.A. (1988) Measuring the accuracy of diagnostic sys-
tems. Science, 240, 1285–1293.Tamayo M. & Olden J.D. (2014) Forecasting the vulnerabil-
ity of lakes to aquatic plant invasions. Invasive Plant
Science and Management, 7, 32–45.Turgeon D.D., Quinn J.F. Jr, Bogan A.E., Coan E.V., Hoch-
berg F.G., Lyons W.G. et al. (1998) Common and Scientific
Names of Aquatic Invertebrates From the United States and
Canada: Mollusks. American Fisheries Society, Special
Publication 26, Bethesda, Maryland.
Uden D.R., Allen C.R., Angeler D.G., Corral L. & Fricke
K.A. (2015) Adaptive invasive species distribution mod-
els: a framework for modelling incipient invasions. Biolog-
ical Invasions, 17, 1–20.
© 2016 John Wiley & Sons Ltd, Freshwater Biology, 61, 457–471
470 M. Papes� et al.

U.S. Geological Survey. (2014) Nonindigenous Aquatic Species
Database. Gainesville, Florida.
Vander Zanden M.J. & Olden J.D. (2008) A management
framework for preventing the secondary spread of aqua-
tic invasive species. Canadian Journal of Fisheries and Aqua-
tic Sciences, 65, 1512–1522.Weathers K., Hanson P., Arzberger P., Brentrup J., Brookes
J., Carey C. et al. (2013) The Global Lake Ecological
Observatory Network (GLEON): the evolution of grass-
roots network scienc. Limnology and Oceanography Bulletin,
22, 71–73.
Wilson C.D., Roberts D. & Reid N. (2011) Applying species
distribution modelling to identify areas of high conserva-
tion value for endangered species: a case study using
Margaritifera margaritifera (L.). Biological Conservation, 144,
821–829.Zhu G.P., Redei D., Kment P. & Bu W.J. (2014) Effect of
geographic background and equilibrium state on niche
model transferability: predicting areas of invasion of Lep-
toglossus occidentalis. Biological Invasions, 16, 1069–1081.
(Manuscript accepted 4 January 2016)
© 2016 John Wiley & Sons Ltd, Freshwater Biology, 61, 457–471
Predicting distributions of freshwater species 471