Embed Size (px)
Citation preview
The full text of this book is available on line via this link:
http://www.sourceoecd.org/agriculture/9264036571
Those with access to all OECD books on line should use this link:
http://www.sourceoecd.org/9264036571
SourceOECD is the OECD’s online library of books, periodicals and statistical databases. For more information about this award-winning service and free trials ask your librarian, or write to us at [email protected].
Using Market Mechanisms to Manage FisheriesSMOOTHING THE PATH
Why aren’t market mechanisms more widely used to manage fisheries in OECD countries? Despite the demonstrated benefits from instruments such as transferable access rights and individual transferable quotas, there remains some resistance to their further use in many OECD countries. Such resistance stems largely from a lack of information about the potential benefits and costs of introducing market mechanisms. There is also uncertainty about the available strategies for overcoming technical, institutional and political issues in the design and implementation of market mechanisms.
The purpose of this study is to help demystify the concept of market-like instruments and to help policy makers make better use of market-like instruments in fisheries management. The findings of the study are based on a survey of the use of market-like instruments in OECD fisheries in which the key characteristics of these instruments in different countries are identified. A key outcome of the survey is the recognition that a range of market-like instruments are, in fact, widely used in managing fisheries in OECD countries. This has generally improved the economic efficiency of the sector, and helped to ensure the sustainability of fish stocks.
One of the key benefits to policy makers from this study is the identification of practical steps that can be taken to address the range of challenging obstacles to the further use of market-like instruments. This will help policy makers in identifying strategies that may help smooth the path towards the wider use of market mechanisms in fisheries management in the OECD.
US
ING
MA
RK
ET
ME
CH
AN
ISM
S T
O M
AN
AG
E F
ISH
ER
IES
Sm
oo
thin
g th
e P
ath
«Using Market Mechanisms to Manage FisheriesSMOOTHING THE PATH
www.oecd.org
ISBN 92-64-03657-1 53 2006 01 1 P -:HSTCQE=UX[Z\Y:

ORGANISATION FOR ECONOMIC CO-OPERATION AND DEVELOPMENT
������������� �������
������������ ���
����������������
002.fm Page 1 Monday, March 27, 2006 11:07 AM
�������������������������� ���������
��� ��������
��������������� ��������������� ��������������������������������������������� ��
�������������������������������������������������������������������������������
��������������������������������������������������������������������������������������
���������������������������������� ���� ����������������� ���� �����������������
����� �������������������������������������������������������������������������
�!��������������������������������������������� ���������������������������"�������
�������������������������������
���������������������������#�$�������$������%������������������&����'��������
��������(�������(������)���� ��)�������*���� �� +������� +������� +�� �� ,����-����
.�!���������/�!���������0����������0���1������0��� ��2������2������������3�����'��������
3�����3�������3���&������������ ������4������-��������������4������3��������������������
�������������������������������������������������������
�����2����������������������� ���������������������������5�������������������
���������������������������������������������������������������������������������
������������� �����������
������������������ ������������� �
�������������������� �������������������� �
����������������� �� �������
�����������
������������������ ����������������������������������������� ������������������������������������������������������
��������������������������������� ����� !!�"#�$%�&$�"!�'"�������������������� ������������������(�������������������������������
����)����*�������������������������&+����������,�����-���������.%++/�������0������ ��� �����������#�
������������������ ������� �� ����������������� ������������� ��������� �� �����
�������� �� �� ���������� ���� ���� ��� � ����������� � �������� � �� ����� ���������
�� �������� ���������������������� ���� ��� ������������ �� �������� ��
FOREWORD – 3
USING MARKET MECHANISMS TO MANAGE FISHERIES: SMOOTHING THE PATH – ISBN-92-64-03657-1 © OECD 2006
Foreword
The increased use of market-based mechanisms to meet policy objectives has been a shared goal amongst OECD countries for some years now. It is widely recognised that such mechanisms can help to improve the efficiency of resource use and better align the incentives of economic agents with those of the broader community. The commitment to pursue market-based solutions to economic and environmental issues has been reaffirmed by OECD Ministers in recent years. The communiqué from the OECD's Council at Ministerial Level in 2001 called for OECD countries to make better use of market-based instruments in their economic policies. Then in 2002, OECD Ministers noted that "the market prices of natural resources must reflect the full environmental and social costs and benefits of economic activity, to take better account of non-market values and long-term impacts" and that there is a need to move forward in "making markets better serve conservation goals."
The OECD fisheries sector has also seen an increase in the use of market-based mechanisms in recent years. However, there remains some resistance in many economies to the increased use of market mechanisms due to concerns over the potential distributional, social, economic and environmental outcomes of such a shift. In order to address these concerns, the OECD's Committee for Fisheries decided to undertake a major study on the use of market mechanisms in fisheries management as part of its 2002-2005 Programme of Work.
Market-like instruments are based on defining access rights to fisheries resources. They include administrative regulations that influence fishers’ incentives to fish, as well as a wide range of economic instruments based on market interplay. This report explores the various ways OECD countries have used markets to enhance fisheries management and how they have dealt with trade offs between different fishing interests. It demonstrates that there is a wide variety in the design and implementation of market mechanisms between and within OECD countries. The report also identifies a number of practical steps that may assist policy makers in smoothing the path in the introduction of market mechanisms.
The report was approved by the Committee for Fisheries at its meeting on 10-12 October 2005 and the Committee agreed to make the report available to a larger public.
Acknowledgements
Bertrand Le Gallic of the OECD Fisheries Division was the primary author of the report, assisted by Anthony Cox and Carl-Christian Schmidt. The report was edited and prepared for publication by Sophie O'Gorman and Emily Andrews-Chouicha.

TABLE OF CONTENTS- 5
USING MARKET MECHANISMS TO MANAGE FISHERIES: SMOOTHING THE PATH – ISBN-92-64-03657-1 © OECD 2006
Table of Contents
Page
LIST OF ACRONYMS 7
GLOSSARY 9
EXECUTIVE SUMMARY 11
PART I. MARKET MECHANISMS AND FISHERIES 17
CHAPTER 1: Analysing the Use of Market Mechanisms in Fisheries 19
CHAPTER 2: Characteristics and Effects of Market Mechanisms 33
CHAPTER 3: Ten Tracks Towards Implementing Market Mechanisms 59
BIBLIOGRAPHY 91
PART II. SURVEY OF THE USE OF MARKET MECHANISMS IN OECD COUNTRIES 101
PART III. COUNTRY CASES 165
CHAPTER 4: Iceland 167
CHAPTER 5: Japan 203
CHAPTER 6: Korea 213
CHAPTER 7: Norway 221
CHAPTER 8: Spain 257
CHAPTER 9: United Kingdom 277
CHAPTER 10: United States 287

LIST OF ACRONYMS - 7
USING MARKET MECHANISMS TO MANAGE FISHERIES: SMOOTHING THE PATH – ISBN-92-64-03657-1 © OECD 2006
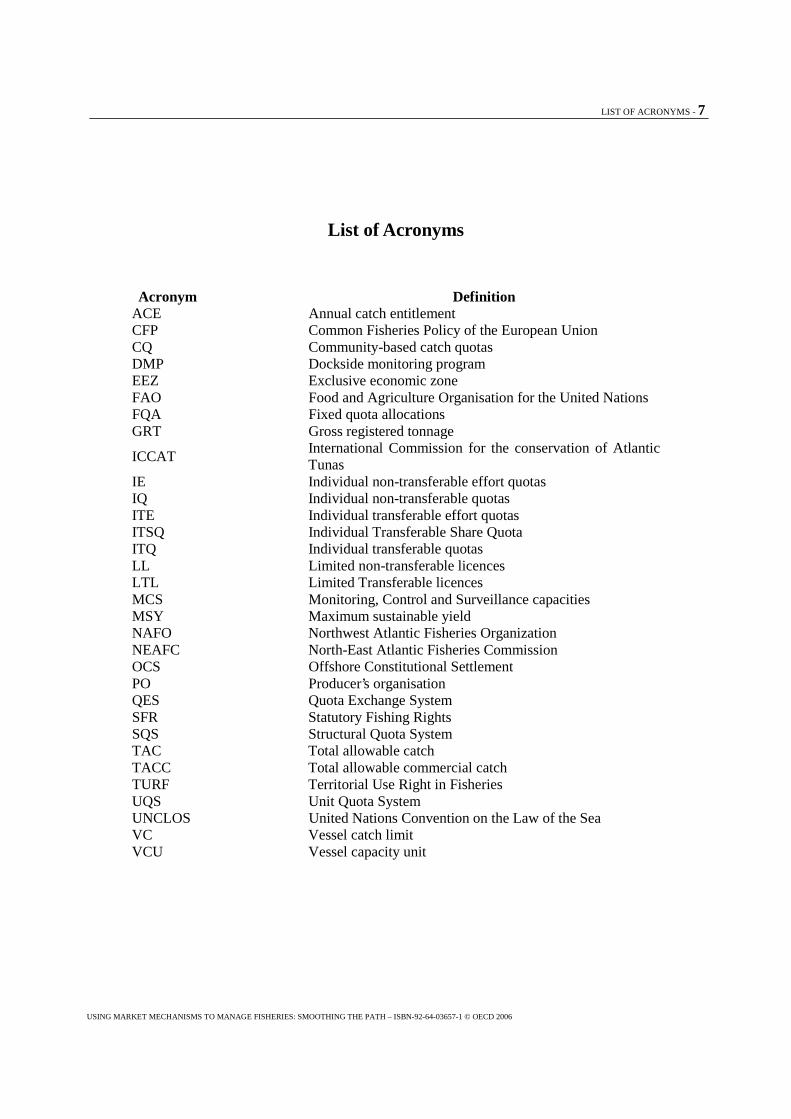
List of Acronyms
Acronym Definition ACE Annual catch entitlement CFP Common Fisheries Policy of the European Union CQ Community-based catch quotas DMP Dockside monitoring program EEZ Exclusive economic zone FAO Food and Agriculture Organisation for the United Nations FQA Fixed quota allocations GRT Gross registered tonnage
ICCAT International Commission for the conservation of Atlantic Tunas
IE Individual non-transferable effort quotas IQ Individual non-transferable quotas ITE Individual transferable effort quotas ITSQ Individual Transferable Share Quota ITQ Individual transferable quotas LL Limited non-transferable licences LTL Limited Transferable licences MCS Monitoring, Control and Surveillance capacities MSY Maximum sustainable yield NAFO Northwest Atlantic Fisheries Organization NEAFC North-East Atlantic Fisheries Commission OCS Offshore Constitutional Settlement PO Producer’s organisation QES Quota Exchange System SFR Statutory Fishing Rights SQS Structural Quota System TAC Total allowable catch TACC Total allowable commercial catch TURF Territorial Use Right in Fisheries UQS Unit Quota System UNCLOS United Nations Convention on the Law of the Sea VC Vessel catch limit VCU Vessel capacity unit

GLOSSARY – 9
USING MARKET MECHANISMS TO MANAGE FISHERIES: SMOOTHING THE PATH – ISBN-92-64-03657-1 © OECD 2006
Glossary
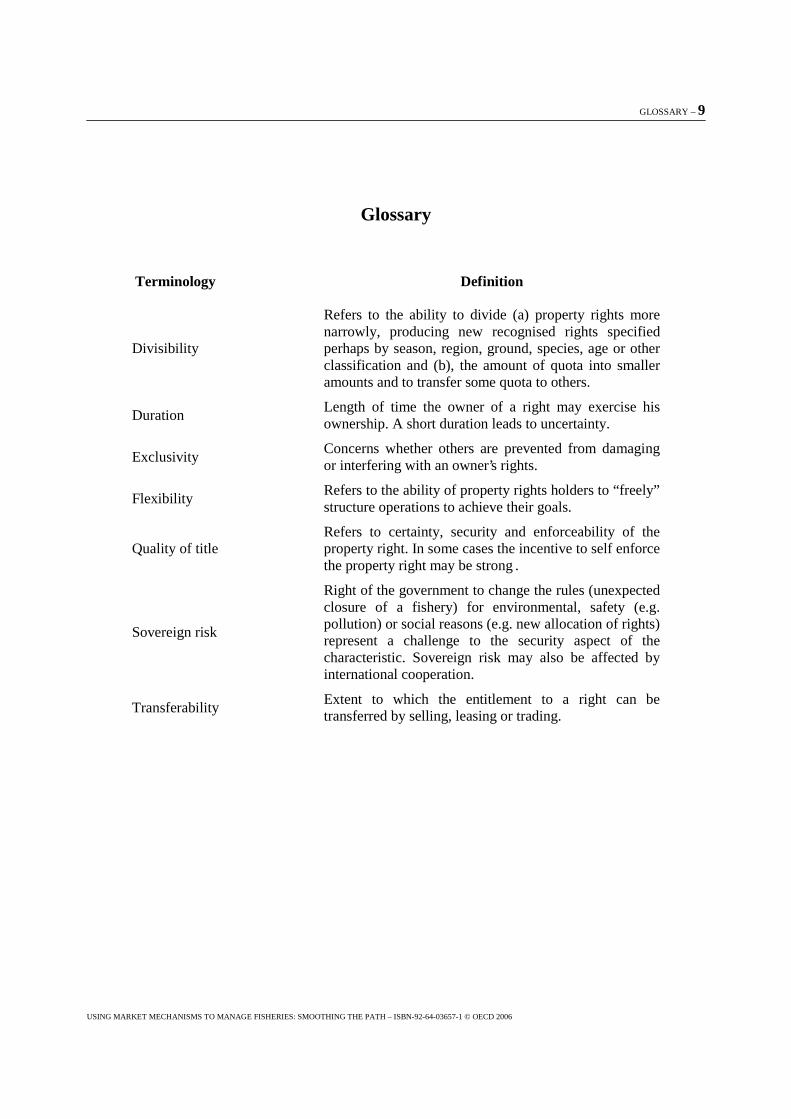
Terminology Definition
Divisibility
Refers to the ability to divide (a) property rights more narrowly, producing new recognised rights specified perhaps by season, region, ground, species, age or other classification and (b), the amount of quota into smaller amounts and to transfer some quota to others.
Duration Length of time the owner of a right may exercise his ownership. A short duration leads to uncertainty.
Exclusivity Concerns whether others are prevented from damaging or interfering with an owner’s rights.
Flexibility Refers to the ability of property rights holders to “freely” structure operations to achieve their goals.
Quality of title Refers to certainty, security and enforceability of the property right. In some cases the incentive to self enforce the property right may be strong .
Sovereign risk
Right of the government to change the rules (unexpected closure of a fishery) for environmental, safety (e.g. pollution) or social reasons (e.g. new allocation of rights) represent a challenge to the security aspect of the characteristic. Sovereign risk may also be affected by international cooperation.
Transferability Extent to which the entitlement to a right can be transferred by selling, leasing or trading.

EXECUTIVE SUMMARY – 11
USING MARKET MECHANISMS TO MANAGE FISHERIES: SMOOTHING THE PATH – ISBN-92-64-03657-1 © OECD 2006
Executive Summary
Market-like instruments are widely used in managing fisheries in OECD countries. These instruments are based on defining access rights to fisheries resources and encompass both those administrative regulations that influence fishers’ incentives to race for fish and to overcapitalise, and a range of economic instruments based on market interplay. There is a general recognition amongst policy makers that the use of market-like instruments can improve the efficiency of fisheries resource allocation and use, and help to better align the economic incentives of fishers’ with societal objectives. Recognising the potential benefits from market mechanisms, there is a general shift within OECD countries towards the increased use of market-like instruments.
However, the introduction of market-like instruments is often met with resistance from participants in the fisheries sector. One of the main reasons for such reluctance appears to be the relatively narrow interpretation taken of market-like instruments; they are often misconstrued as being synonymous with theoretical individual transferable quotas, the most-cited example of market-like instruments. However, as shown by the study, such a misconception belies the fact that there is a wide range of market-like management instruments actually employed in fisheries in OECD countries. These instruments vary considerably in the way in which they employ the attributes of rights-based approaches; individual transferable quotas are, therefore, just a part of a continuum of market-like instruments.
The purpose of this study is to demystify the concept of market-like instruments and to help policy makers make better use of market-like instruments in fisheries management. The study also responds to a call by OECD Ministers for the wider use of economic instruments in meeting sustainable development objectives. The study provides a survey of the use of market-like instruments in OECD countries and identifies the key characteristics of these instruments as they are implemented across countries. One of the key benefits to policy makers from this study is the identification of practical steps that can be taken to address the obstacles to the further use of market-like instruments. This will help to demystify some of the concerns surrounding the use of market-like instruments in the sector and assist policy makers in identifying strategies that may help smooth the path towards the wider use of market mechanisms.
Characteristics of market-like instruments
As shown by the study, different types of market-like instruments can be seen as combining the six characteristics of property rights – exclusivity, duration, quality of title, transferability, flexibility and divisibility. The characteristics are drawn from the literature on property rights and can be summarised as:
� Exclusivity concerns whether others are prevented from damaging or interfering with an owner’s rights and refers to the extent that a person’s property right overlap with the rights of others.
� Duration is the length of time the owner of a right may exercise his ownership. A longer duration allows the right holder to get the pay-off from investments.
12 – EXECUTIVE SUMMARY
USING MARKET MECHANISMS TO MANAGE FISHERIES: SMOOTHING THE PATH– ISBN-92-64-03657-1 © OECD 2006
� Quality of title refers to certainty, security and enforceability of the property right. The more predictable the entitlement attached to the right, the higher the quality of their title. When fish stocks are shared by several parties, the level of the quality of the title partly depends on the level and effectiveness of cooperation between parties.
� Transferability is the extent to which the entitlement to a right can be transferred by selling, leasing or trading. All degrees of transferability are possible and it is valued because it facilitates the transfer of rights from less efficient to more efficient operators.
� Divisibility refers to the ability to divide access rights into narrower forms of rights or quota into smaller amounts, primarily to enable the transfer of some quota to others.
� Flexibility refers to the ability of property rights holders to freely structure operations to achieve their goals. It allows rights owners to both use their rights in the most efficient way given technical constraints (including through selling or leasing it) and to modify their production operations in order to match their rights entitlements.
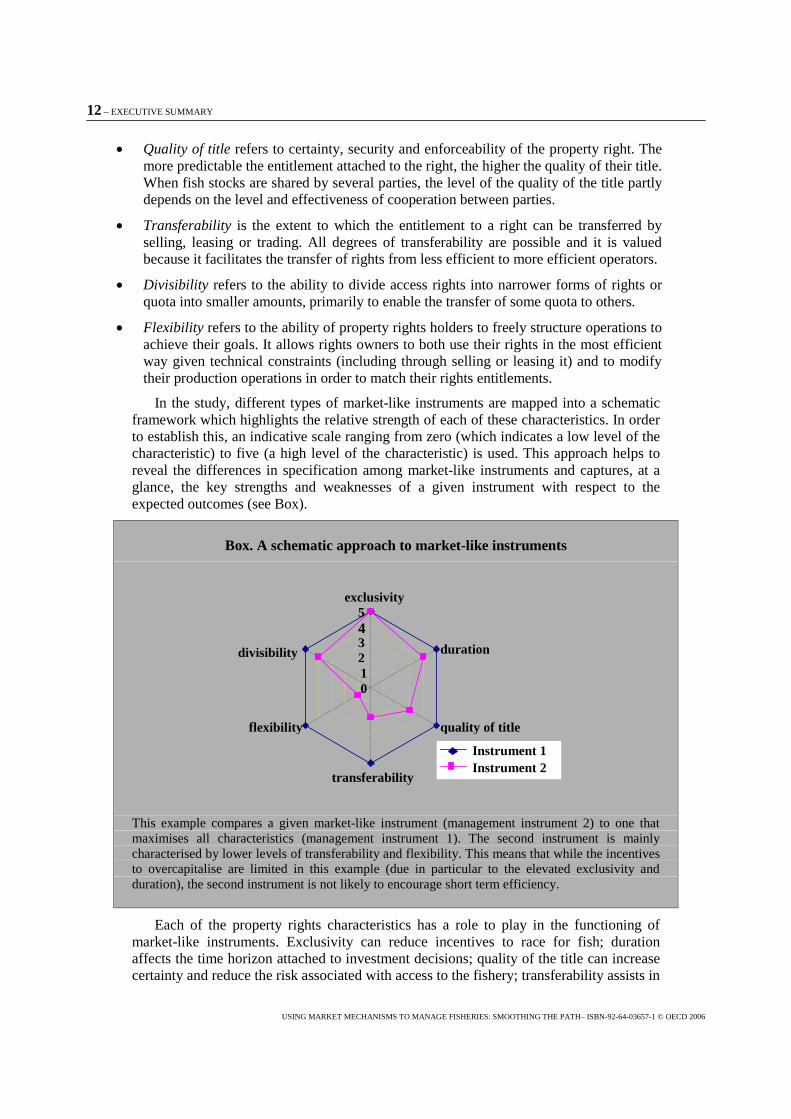
In the study, different types of market-like instruments are mapped into a schematic framework which highlights the relative strength of each of these characteristics. In order to establish this, an indicative scale ranging from zero (which indicates a low level of the characteristic) to five (a high level of the characteristic) is used. This approach helps to reveal the differences in specification among market-like instruments and captures, at a glance, the key strengths and weaknesses of a given instrument with respect to the expected outcomes (see Box).
Box. A schematic approach to market-like instruments
This example compares a given market-like instrument (management instrument 2) to one that maximises all characteristics (management instrument 1). The second instrument is mainly characterised by lower levels of transferability and flexibility. This means that while the incentives to overcapitalise are limited in this example (due in particular to the elevated exclusivity and duration), the second instrument is not likely to encourage short term efficiency.
Each of the property rights characteristics has a role to play in the functioning of market-like instruments. Exclusivity can reduce incentives to race for fish; duration affects the time horizon attached to investment decisions; quality of the title can increase certainty and reduce the risk associated with access to the fishery; transferability assists in
0
2 3 4 5
exclusivity
duration
quality of title
transferability
flexibility
divisibility
Instrument 1 Instrument 2
1
EXECUTIVE SUMMARY – 13
USING MARKET MECHANISMS TO MANAGE FISHERIES: SMOOTHING THE PATH– ISBN-92-64-03657-1 © OECD 2006
ensuring the efficient allocation of rights to the most valued users; and divisibility and flexibility can improve the adaptability to economic and environmental changes.
These six characteristics are also interrelated and, in combination, they generate a particular bundle of rights which will facilitate particular management outcomes. For example, some characteristics (exclusivity, duration, quality of the title and transferability) are more likely to facilitate structural adjustment (investment and fleet capacity), while others may mostly facilitate the efficient use of existing fishing capacity. Matching the bundle of characteristics to the institutional, social and biological constraints in particular fisheries is the challenge confronting policy makers.
In designing and implementing their management instruments, countries take either implicit or explicit decisions on how to bundle these various attributes together in order to meet their policy objectives. Given that there is an opportunity cost associated with reducing each of the property rights characteristics, countries are therefore trading off some level of economic efficiency in order to meet particular economic and social objectives.
Key findings
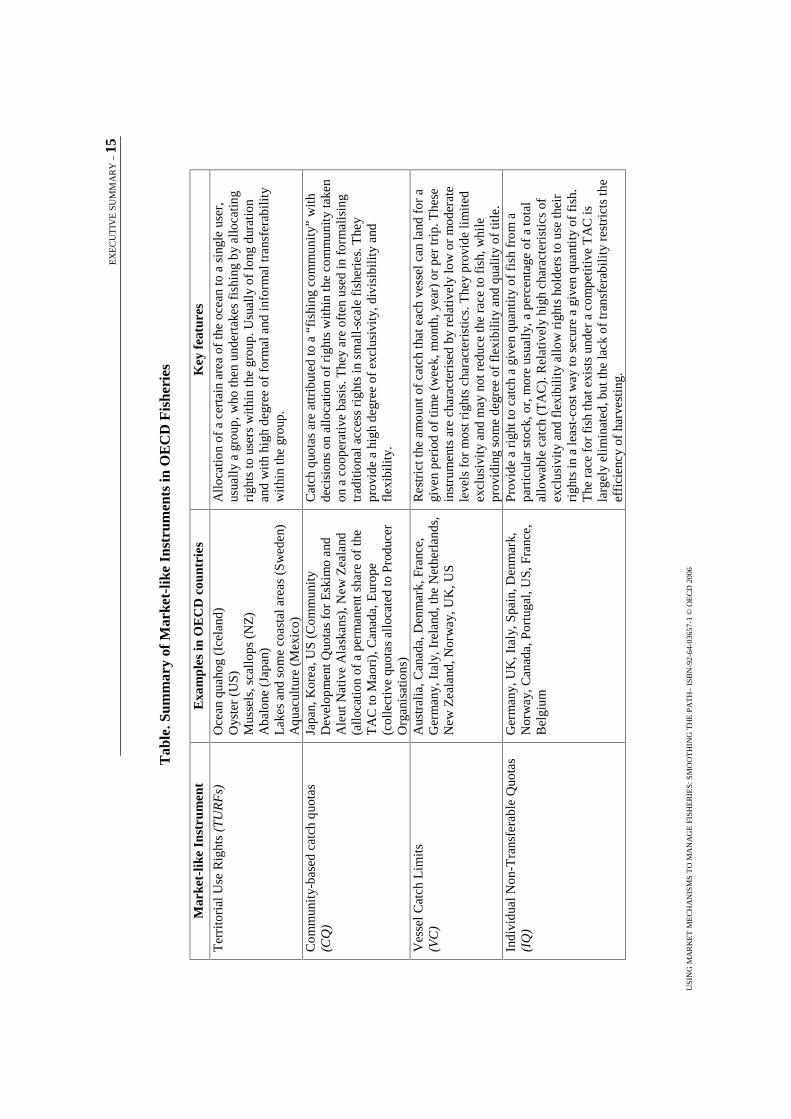
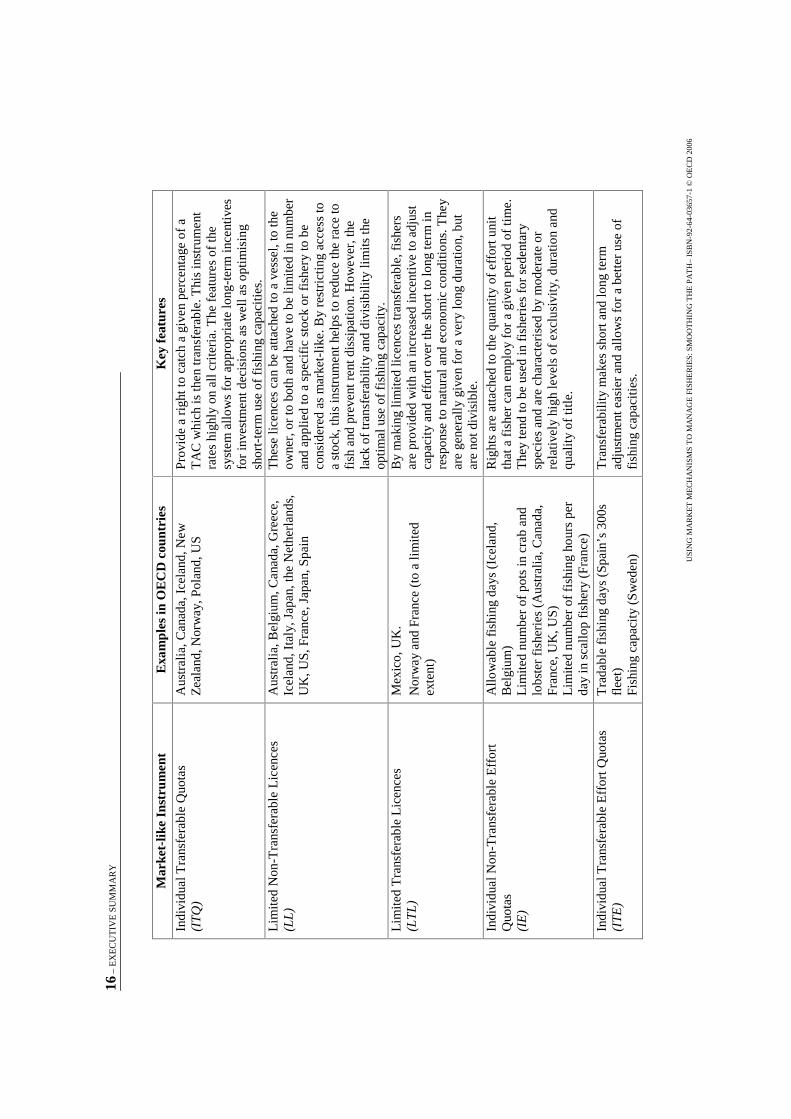
The study found that market-like instruments are not limited to any single instrument but represent a continuum of management instruments characterized by different levels of property rights characteristics (see table for a brief overview of the range of market-like instruments in use in OECD countries, and their key features). These characteristics are bundled together in different combinations to reach different management and societal objectives. The study also found that market-like instruments are widely used in OECD countries, although the coverage and implementation differs significantly across countries. This underscores the flexibility and potential breadth of application of market-like instruments and highlights the scope for market-like instruments to be further refined and applied in the OECD area.
The way in which different market-like instruments bundle characteristics together helps to determine the outcomes for the fisheries sector. In reviewing the experience of OECD countries, the study found that some instruments (such as individual quotas for effort and catches) are directed towards maximizing the economic efficiency of resource use, while others (such as community catch quotas and some types of vessel catch limits) will allow fishers to more readily adapt to short-term economic and natural fluctuations. Yet others (such as individual transferable quotas) are especially beneficial in facilitating long-term adjustment with respect to investment and capacity.
Natural, geographical and economic conditions will also play a role in the effectiveness of different market-like instruments. The study provided evidence that some instruments may be more appropriate for small-scale fisheries dedicated to local consumption and characterised by a large number of operators (for example, community quotas and individual transferable effort quotas). Other instruments (such as individual transferable quotas) may be more appropriate for large scale and industrial fisheries, while others may be better suited to managing fisheries for sedentary species (for example, territorial use rights).
In order to successfully develop and implement market-like instruments, fisheries managers need to address an array of technical, administrative and social challenges. Drawing on the experience of OECD member countries, the study presents ten tracks that policy makers can draw upon in meeting these challenges and which can ease the
14 – EXECUTIVE SUMMARY
USING MARKET MECHANISMS TO MANAGE FISHERIES: SMOOTHING THE PATH– ISBN-92-64-03657-1 © OECD 2006
introduction and improve the design of market-like instruments. The tracks are described in some detail in the study and can be summarised as:
1: Making all stakeholders comfortable with the concept of market-like instruments 2: Preferring an incremental or gradual implementation of market-like instruments 3: Not necessarily adopting a “one-size-fits-all” strategy 4: Carefully designing the process to allocate rights 5: Pragmatically using market forces 6: Overcoming the “excessive consolidation” question 7: Using the “demonstration effect” (drawing on experience) 8: Involving stakeholders in the reform process 9: Integrating fisheries characteristics 10: Dealing pragmatically with trade-offs
By demonstrating that market-like instruments are in more common usage than is generally recognised, and that many countries have benefited from their use, these tracks will help to overcome the “fear of change” that has been identified as one of the major impediments to the implementation of market-like instruments. Each of these tracks focuses on a particular issue challenging policy makers, the key findings from the survey of OECD countries, and insights for policy makers to how the challenges might be addressed, based on the experience of OECD countries.
Implications for policy makers
Three key implications for policy makers emerge from the report. First, it is clear that fisheries managers have a greater array of market-like instruments at their disposal than might be appreciated. The experience of OECD countries points to the need to maintain a flexible approach to the design and implementation of market-like instruments to take into account social and biological conditions in particular fisheries, as well as the institutional constraints (both domestic and international) that may constrain the extent to which countries can take up market-like instruments. While there is no uniform approach to the use of market-like instruments, there is clearly greater scope for the use of the range of market-like instruments in achieving improved management outcomes.
Second, several attributes of market-like instruments seem to be particularly important in improving the robustness of fisheries management, the regulatory environment for fishers and the efficiency of resource use. These relate to the duration of the right and the ability to transfer some or all of the right to others in the sector. Focusing on strengthening these characteristics will help to improve the adaptability and resilience of the sector in both the short and long term, and to internalise the process of adjusting to changing external conditions.
Finally, the extent of stakeholder involvement in decision making processes will heavily influence the prospects for realising the benefits from an increased use of market-like instruments. This will improve the chance of the demonstration effect being achieved and heightens the comfort level that participants in the sector are likely to have with market-like instruments.
EX
EC
UT
IVE
SU
MM
AR
Y –
15
USI
NG
MA
RK
ET
ME
CH
AN
ISM
S T
O M
AN
AG
E F
ISH
ER
IES:
SM
OO
TH
ING
TH
E P
AT
H–
ISB
N-9
2-64
-036
57-1
© O
EC
D 2
006
Tab
le. S
umm
ary
of M
arke
t-lik
e In
stru
men
ts in
OE
CD
Fis
heri
es
Mar
ket-
like
Inst
rum
ent
Exa
mpl
es in
OE
CD
cou
ntri
es
Key
fea
ture
s
Ter
rito
rial
Use
Rig
hts
(TU
RF
s)
Oce
an q
uaho
g (I
cela
nd)
Oys
ter
(US)
M
usse
ls, s
call
ops
(NZ
) A
balo
ne (
Japa
n)
Lak
es a
nd s
ome
coas
tal a
reas
(S
wed
en)
Aqu
acul
ture
(M
exic
o)
All
ocat
ion
of a
cer
tain
are
a of
the
ocea
n to
a s
ingl
e us
er,
usua
lly
a gr
oup,
who
then
und
erta
kes
fish
ing
by a
lloc
atin
g ri
ghts
to u
sers
wit
hin
the
grou
p. U
sual
ly o
f lo
ng d
urat
ion
and
with
hig
h de
gree
of
form
al a
nd in
form
al tr
ansf
erab
ility
w
ithi
n th
e gr
oup.
Com
mun
ity-
base
d ca
tch
quot
as
(CQ
) Ja
pan,
Kor
ea, U
S (
Com
mun
ity
Dev
elop
men
t Quo
tas
for
Esk
imo
and
Ale
ut N
ativ
e A
lask
ans)
, New
Zea
land
(a
lloca
tion
of a
per
man
ent s
hare
of
the
TA
C to
Mao
ri),
Can
ada,
Eur
ope
(col
lect
ive
quot
as a
lloc
ated
to P
rodu
cer
Org
anis
atio
ns)
Cat
ch q
uota
s ar
e at
trib
uted
to a
“fi
shin
g co
mm
unit
y” w
ith
deci
sion
s on
allo
catio
n of
rig
hts
wit
hin
the
com
mun
ity
take
n on
a c
oope
rativ
e ba
sis.
The
y ar
e of
ten
used
in f
orm
alis
ing
trad
ition
al a
cces
s ri
ghts
in s
mal
l-sc
ale
fish
erie
s. T
hey
prov
ide
a hi
gh d
egre
e of
exc
lusi
vity
, div
isib
ility
and
fl
exib
ility
.
Ves
sel C
atch
Lim
its
(V
C)
Aus
tral
ia, C
anad
a, D
enm
ark,
Fra
nce,
G
erm
any,
Ita
ly, I
rela
nd, t
he N
ethe
rlan
ds,
New
Zea
land
, Nor
way
, UK
, US
Res
tric
t the
am
ount
of
catc
h th
at e
ach
vess
el c
an la
nd f
or a
gi
ven
peri
od o
f ti
me
(wee
k, m
onth
, yea
r) o
r pe
r tr
ip. T
hese
in
stru
men
ts a
re c
hara
cter
ised
by
rela
tive
ly lo
w o
r m
oder
ate
leve
ls f
or m
ost r
ight
s ch
arac
teri
stic
s. T
hey
prov
ide
lim
ited
excl
usiv
ity
and
may
not
red
uce
the
race
to f
ish,
whi
le
prov
idin
g so
me
degr
ee o
f fl
exib
ility
and
qua
lity
of ti
tle.
Indi
vidu
al N
on-T
rans
fera
ble
Quo
tas
(IQ
) G
erm
any,
UK
, Ita
ly, S
pain
, Den
mar
k,
Nor
way
, Can
ada,
Por
tuga
l, U
S, F
ranc
e,
Bel
gium
Pro
vide
a r
ight
to c
atch
a g
iven
qua
ntit
y of
fis
h fr
om a
pa
rtic
ular
sto
ck, o
r, m
ore
usua
lly,
a p
erce
ntag
e of
a to
tal
allo
wab
le c
atch
(T
AC
). R
elat
ivel
y hi
gh c
hara
cter
isti
cs o
f ex
clus
ivit
y an
d fl
exib
ilit
y al
low
rig
hts
hold
ers
to u
se th
eir
righ
ts in
a le
ast-
cost
way
to s
ecur
e a
give
n qu
anti
ty o
f fi
sh.
The
rac
e fo
r fi
sh th
at e
xist
s un
der
a co
mpe
titi
ve T
AC
is
larg
ely
elim
inat
ed, b
ut th
e la
ck o
f tr
ansf
erab
ility
res
tric
ts th
e ef
fici
ency
of
harv
esti
ng.
16 –
EX
EC
UT
IVE
SU
MM
AR
Y
USI
NG
MA
RK
ET
ME
CH
AN
ISM
S T
O M
AN
AG
E F
ISH
ER
IES:
SM
OO
TH
ING
TH
E P
AT
H–
ISB
N-9
2-64
-036
57-1
© O
EC
D 2
006
Mar
ket-
like
Inst
rum
ent
Exa
mpl
es in
OE
CD
cou
ntri
es
Key
fea
ture
s
Indi
vidu
al T
rans
fera
ble
Quo
tas
(IT
Q)
Aus
tral
ia, C
anad
a, I
cela
nd, N
ew
Zea
land
, Nor
way
, Pol
and,
US
P
rovi
de a
rig
ht to
cat
ch a
giv
en p
erce
ntag
e of
a
TA
C w
hich
is th
en tr
ansf
erab
le. T
his
inst
rum
ent
rate
s hi
ghly
on
all c
rite
ria.
The
fea
ture
s of
the
syst
em a
llow
s fo
r ap
prop
riat
e lo
ng-t
erm
ince
ntiv
es
for
inve
stm
ent d
ecis
ions
as
wel
l as
opti
mis
ing
shor
t-te
rm u
se o
f fi
shin
g ca
paci
ties.
L
imit
ed N
on-T
rans
fera
ble
Lic
ence
s (L
L)
Aus
tral
ia, B
elgi
um, C
anad
a, G
reec
e,
Icel
and,
Ita
ly, J
apan
, the
Net
herl
ands
, U
K, U
S, F
ranc
e, J
apan
, Spa
in
The
se li
cenc
es c
an b
e at
tach
ed to
a v
esse
l, to
the
owne
r, o
r to
bot
h an
d ha
ve to
be
lim
ited
in n
umbe
r an
d ap
plie
d to
a s
peci
fic
stoc
k or
fis
hery
to b
e co
nsid
ered
as
mar
ket-
like
. By
rest
rict
ing
acce
ss to
a
stoc
k, th
is in
stru
men
t hel
ps to
red
uce
the
race
to
fish
and
pre
vent
ren
t dis
sipa
tion
. How
ever
, the
la
ck o
f tr
ansf
erab
ility
and
div
isib
ility
lim
its th
e op
tim
al u
se o
f fi
shin
g ca
paci
ty.
Lim
ited
Tra
nsfe
rabl
e L
icen
ces
(L
TL
) M
exic
o, U
K.
Nor
way
and
Fra
nce
(to
a li
mit
ed
exte
nt)
By
mak
ing
lim
ited
licen
ces
tran
sfer
able
, fis
hers
ar
e pr
ovid
ed w
ith
an in
crea
sed
ince
ntiv
e to
adj
ust
capa
city
and
eff
ort o
ver
the
shor
t to
long
term
in
resp
onse
to n
atur
al a
nd e
cono
mic
con
ditio
ns. T
hey
are
gene
rall
y gi
ven
for
a ve
ry lo
ng d
urat
ion,
but
ar
e no
t div
isib
le.
Indi
vidu
al N
on-T
rans
fera
ble
Eff
ort
Quo
tas
(IE
)
Allo
wab
le f
ishi
ng d
ays
(Ice
land
, B
elgi
um)
Lim
ited
num
ber
of p
ots
in c
rab
and
lobs
ter
fish
erie
s (A
ustr
alia
, Can
ada,
Fr
ance
, UK
, US)
L
imite
d nu
mbe
r of
fis
hing
hou
rs p
er
day
in s
call
op f
ishe
ry (
Fra
nce)
Rig
hts
are
atta
ched
to th
e qu
anti
ty o
f ef
fort
uni
t th
at a
fis
her
can
empl
oy f
or a
giv
en p
erio
d of
tim
e.
The
y te
nd to
be
used
in f
ishe
ries
for
sed
enta
ry
spec
ies
and
are
char
acte
rise
d by
mod
erat
e or
re
lativ
ely
high
leve
ls o
f ex
clus
ivit
y, d
urat
ion
and
qual
ity
of ti
tle.
Indi
vidu
al T
rans
fera
ble
Eff
ort Q
uota
s (I
TE
) T
rada
ble
fish
ing
days
(Sp
ain’
s 30
0s
flee
t)
Fis
hing
cap
acit
y (S
wed
en)
Tra
nsfe
rabi
lity
mak
es s
hort
and
long
term
ad
just
men
t eas
ier
and
allo
ws
for
a be
tter
use
of
fish
ing
capa
citie
s.
PART I - MARKET MECHANISMS AND FISHERIES – 17
USING MARKET MECHANISMS TO MANAGE FISHERIES: SMOOTHING THE PATH – ISBN-92-64-03657-1 © OECD 2006
PART I
MARKET MECHANISMS AND FISHERIES

CHAPTER 1 –ANALYSING THE USE OF MARKET MECHANISMS IN FISHERIES – 19
USING MARKET MECHANISMS TO MANAGE FISHERIES: SMOOTHING THE PATH – ISBN-92-64-03657-1 © OECD 2006
Chapter 1
Analysing the Use of Market Mechanisms1 in Fisheries
Introduction
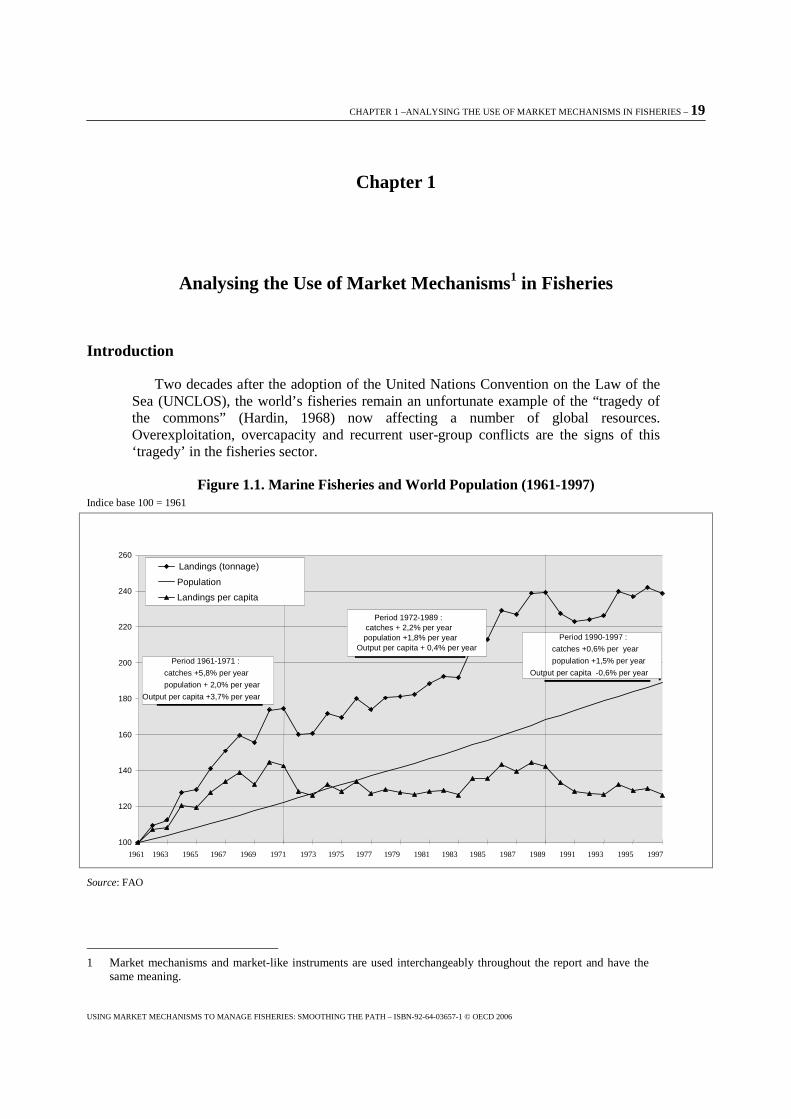
Two decades after the adoption of the United Nations Convention on the Law of the Sea (UNCLOS), the world’s fisheries remain an unfortunate example of the “tragedy of the commons” (Hardin, 1968) now affecting a number of global resources. Overexploitation, overcapacity and recurrent user-group conflicts are the signs of this ‘tragedy’ in the fisheries sector.
Figure 1.1. Marine Fisheries and World Population (1961-1997) Indice base 100 = 1961
Source: FAO
1 Market mechanisms and market-like instruments are used interchangeably throughout the report and have the same meaning.
Period 1961-1971 : catches +5,8% per year population + 2,0% per year
Output per capita +3,7% per year
Period 1972-1989 : catches + 2,2% per year population +1,8% per year
Output per capita + 0,4% per year Period 1990-1997 :
catches +0,6% per year population +1,5% per year
Output per capita -0,6% per year
100
120
140
160
180
200
220
240
260 Landings (tonnage)
Population Landings per capita
1961 1963 1965 1967 1969 1971 1973 1975 1977 1979 1981 1983 1985 1987 1989 1991 1993 1995 1997
20 – CHAPTER 1: ANALYSING THE USE OF MARKET MECHANISMS IN FISHERIES
USING MARKET MECHANISMS TO MANAGE FISHERIES: SMOOTHING THE PATH – ISBN-92-64-03657-1 © OECD 2006
Global output of commercial (mainly demersal) species has been declining for several years (FAO, 1994). Heavy overfishing of higher valued stocks is raising fears of a lasting negative effect on their reproductive capacity. Declining world catches of demersal stocks have to date been offset by heavier fishing of species at lower trophic levels (mainly small pelagic fish; Pauly et. al., 1998). However, as the reserves of currently underexploited stocks are being steadily depleted and now account for only about one-third of available stocks, the current harvesting regime is merely a stopgap solution. In the north Pacific and Atlantic, where the process of overfishing is already further advanced, total landings are steadily declining. Meanwhile, as overfishing targets commercial species with higher landing prices, the economic value may be stagnating.
The lead cause of overfishing is a large increase in catch capacity, which now significantly outstrips the productivity of available stocks. The FAO (1994) put the operating deficit of the world’s fishing fleet in the early 1990s at some USD 54 billion (17% of estimated vessel value). Although only a rough overview covering a variety of situations, this assessment has been confirmed by numerous studies that are geographically more specific (c.f. Troadec and Boncoeur, 2003).
Fleets are faced with imbalances between catch capacity and (available) stock productivity in an increasingly competitive and unregulated fishing arena [e.g. the “wars” over tuna in the Bay of Biscay (Antoine, 1995), cod in the north-east Atlantic (Hannesson 1996) and halibut in the north-west Atlantic (Song, 1997)]. Employment opportunities, already affected by technical gains and labour-capital substitution (in many cases promoted by government support), are further hampered by resource depletion. Concurrently, ageing of the fishers population could lead to the development of a labour shortage in some countries.
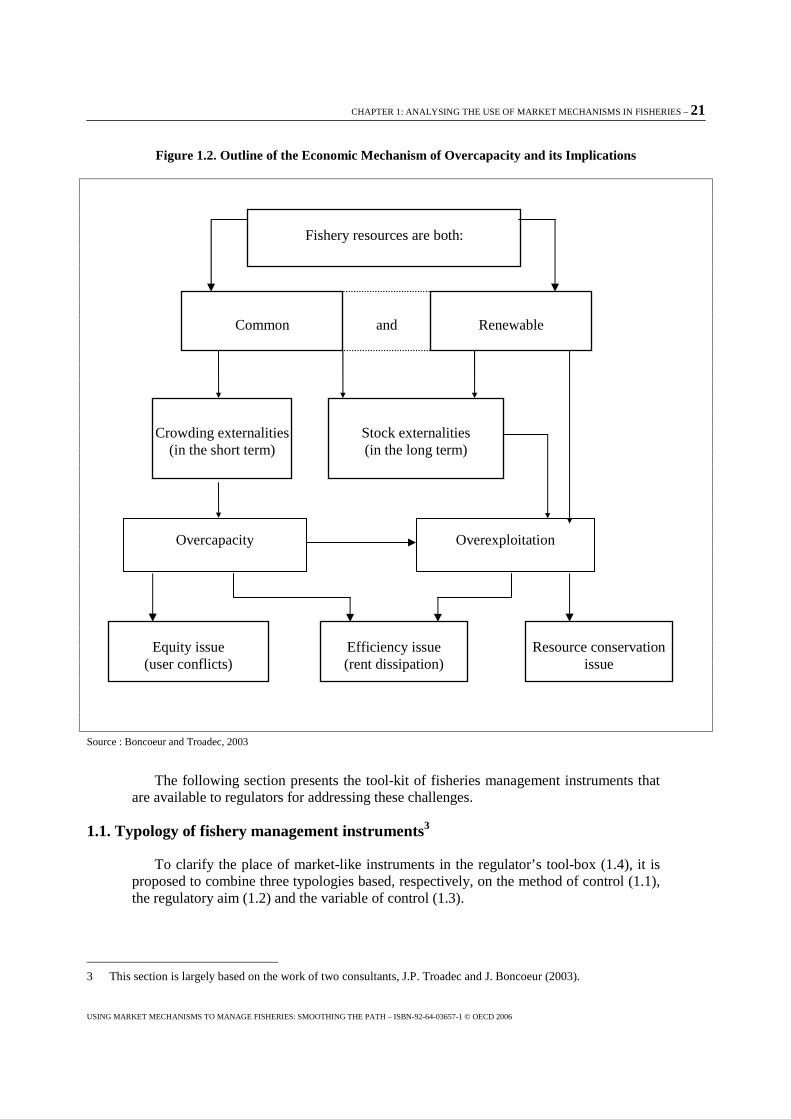
Consequently, the three pillars of the sustainable development paradigm (environmental, economic and social) are directly affected by the deterioration in the fisheries sector. The root of the problem is, to a large extent, economic (Figure 1.2). Overcapacity in the industry stems from the fact that too many fishers are competing for an increasingly scarce resource. If adequate management measures are not introduced, these externalities widen the gap between the social and the private marginal product of the fishing effort. This gap, possibly sustained by government support2, encourages the development of catch capacity that surpasses the resource’s natural productivity. This further deteriorates stock status and multiplies user conflicts.
2 Government financial transfers to marine capture fisheries in OECD countries were equivalent to an estimated 19% of the landed value of marine capture fishery products in 2000, although with substantial differences across countries (OECD, 2003).
CHAPTER 1: ANALYSING THE USE OF MARKET MECHANISMS IN FISHERIES – 21
USING MARKET MECHANISMS TO MANAGE FISHERIES: SMOOTHING THE PATH – ISBN-92-64-03657-1 © OECD 2006
Figure 1.2. Outline of the Economic Mechanism of Overcapacity and its Implications
Source : Boncoeur and Troadec, 2003
The following section presents the tool-kit of fisheries management instruments that are available to regulators for addressing these challenges.
1.1. Typology of fishery management instruments3
To clarify the place of market-like instruments in the regulator’s tool-box (1.4), it is proposed to combine three typologies based, respectively, on the method of control (1.1), the regulatory aim (1.2) and the variable of control (1.3).
3 This section is largely based on the work of two consultants, J.P. Troadec and J. Boncoeur (2003).
Fishery resources are both:
Common Renewable and
Crowding externalities
(in the short term)
Stock externalities (in the long term)
Overcapacity Overexploitation
Equity issue (user conflicts)
Efficiency issue (rent dissipation)
Resource conservation issue
22 – CHAPTER 1: ANALYSING THE USE OF MARKET MECHANISMS IN FISHERIES
USING MARKET MECHANISMS TO MANAGE FISHERIES: SMOOTHING THE PATH – ISBN-92-64-03657-1 © OECD 2006
Typology based on the method of control
In general, management instruments fall into two categories, namely economic regulatory instruments.
Economic instruments: These policy measures affect the costs and benefits of the choices facing fishing firms or individual fishers, in order to make resource exploitation more efficient. Economic instruments involve either:
(i) market creation – i.e. tradable rights or permits. These instruments are thus based on market interplay, leaving most economic decisions up to individual agents interacting through markets. Rights and permits are characterised by the following attributes or powers (Scott, 1988): the exclusive right to use, the right to profit and the right to sale;
or
(ii) a monetary transfer – i.e. payments or charges/taxes (such as taxes, subsidies and fees). These instruments are aimed at influencing behaviour through economic incentives not based on market interplay.
Regulatory and legal measures: These policy measures, also known as command and control, involve a compulsory restriction of the choices facing fishing firms or individual fishers – i.e. they are left with no choice but to comply with specific rules, or face penalties. Regulatory requirements tend to be less flexible than economic instruments, as they do not allow agents the freedom to determine the least costly way of meeting their objectives.
Typology based on regulatory aim
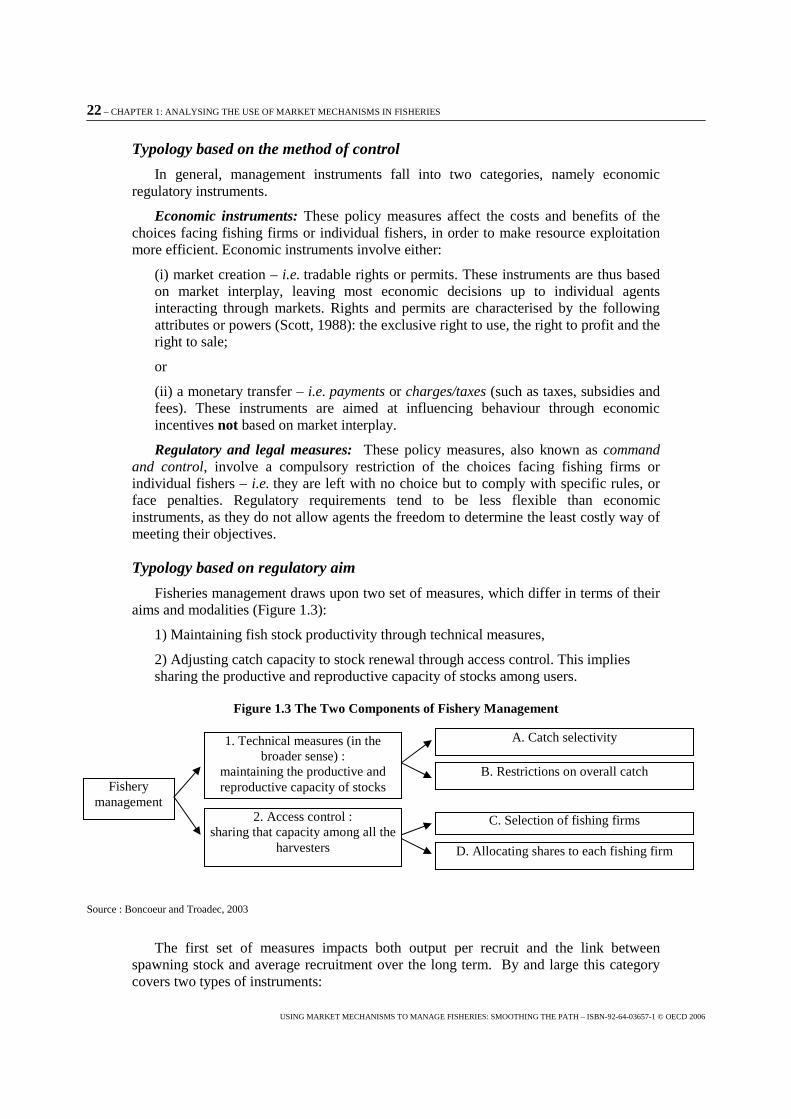
Fisheries management draws upon two set of measures, which differ in terms of their aims and modalities (Figure 1.3):
1) Maintaining fish stock productivity through technical measures,
2) Adjusting catch capacity to stock renewal through access control. This implies sharing the productive and reproductive capacity of stocks among users.
Figure 1.3 The Two Components of Fishery Management
Source : Boncoeur and Troadec, 2003
The first set of measures impacts both output per recruit and the link between spawning stock and average recruitment over the long term. By and large this category covers two types of instruments:
Fishery management
1. Technical measures (in the broader sense) :
maintaining the productive and reproductive capacity of stocks
2. Access control : sharing that capacity among all the
harvesters
A. Catch selectivity
B. Restrictions on overall catch
C. Selection of fishing firms
D. Allocating shares to each fishing firm
CHAPTER 1: ANALYSING THE USE OF MARKET MECHANISMS IN FISHERIES – 23
USING MARKET MECHANISMS TO MANAGE FISHERIES: SMOOTHING THE PATH – ISBN-92-64-03657-1 © OECD 2006
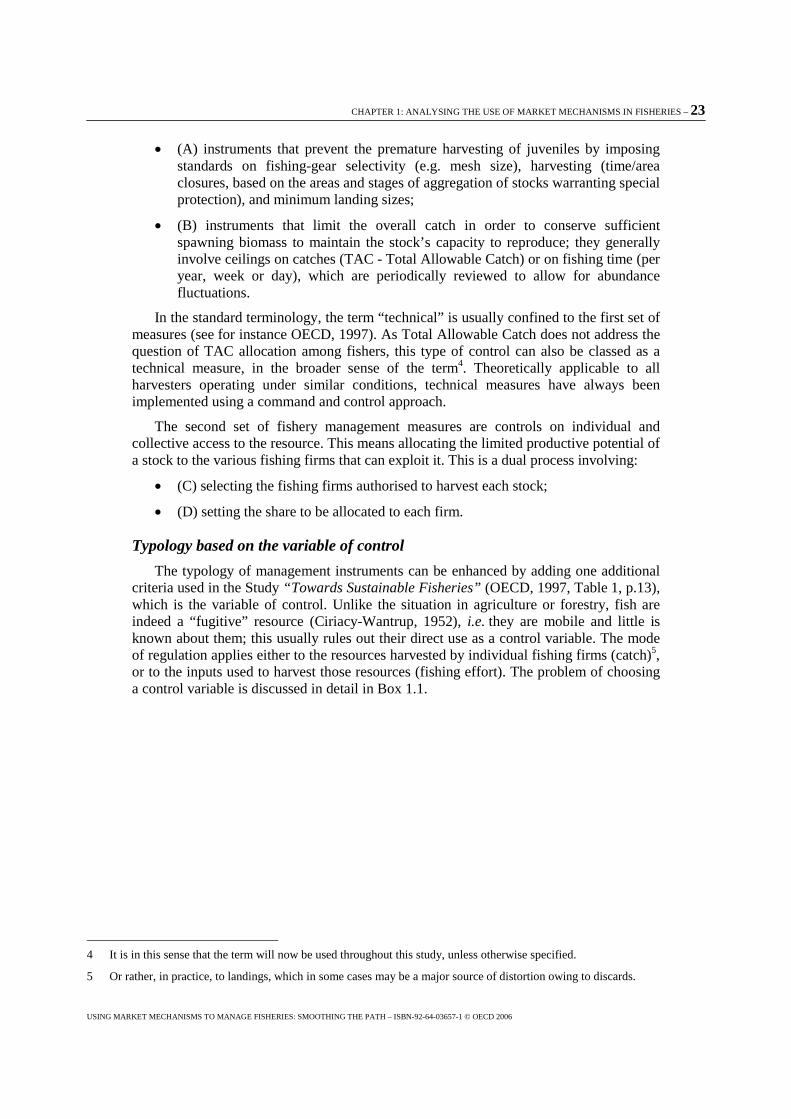
� (A) instruments that prevent the premature harvesting of juveniles by imposing standards on fishing-gear selectivity (e.g. mesh size), harvesting (time/area closures, based on the areas and stages of aggregation of stocks warranting special protection), and minimum landing sizes;
� (B) instruments that limit the overall catch in order to conserve sufficient spawning biomass to maintain the stock’s capacity to reproduce; they generally involve ceilings on catches (TAC - Total Allowable Catch) or on fishing time (per year, week or day), which are periodically reviewed to allow for abundance fluctuations.
In the standard terminology, the term “technical” is usually confined to the first set of measures (see for instance OECD, 1997). As Total Allowable Catch does not address the question of TAC allocation among fishers, this type of control can also be classed as a technical measure, in the broader sense of the term4. Theoretically applicable to all harvesters operating under similar conditions, technical measures have always been implemented using a command and control approach.
The second set of fishery management measures are controls on individual and collective access to the resource. This means allocating the limited productive potential of a stock to the various fishing firms that can exploit it. This is a dual process involving:
� (C) selecting the fishing firms authorised to harvest each stock;
� (D) setting the share to be allocated to each firm.
Typology based on the variable of control
The typology of management instruments can be enhanced by adding one additional criteria used in the Study “Towards Sustainable Fisheries” (OECD, 1997, Table 1, p.13), which is the variable of control. Unlike the situation in agriculture or forestry, fish are indeed a “fugitive” resource (Ciriacy-Wantrup, 1952), i.e. they are mobile and little is known about them; this usually rules out their direct use as a control variable. The mode of regulation applies either to the resources harvested by individual fishing firms (catch)5, or to the inputs used to harvest those resources (fishing effort). The problem of choosing a control variable is discussed in detail in Box 1.1.
4 It is in this sense that the term will now be used throughout this study, unless otherwise specified.
5 Or rather, in practice, to landings, which in some cases may be a major source of distortion owing to discards.
24 – CHAPTER 1: ANALYSING THE USE OF MARKET MECHANISMS IN FISHERIES
USING MARKET MECHANISMS TO MANAGE FISHERIES: SMOOTHING THE PATH – ISBN-92-64-03657-1 © OECD 2006
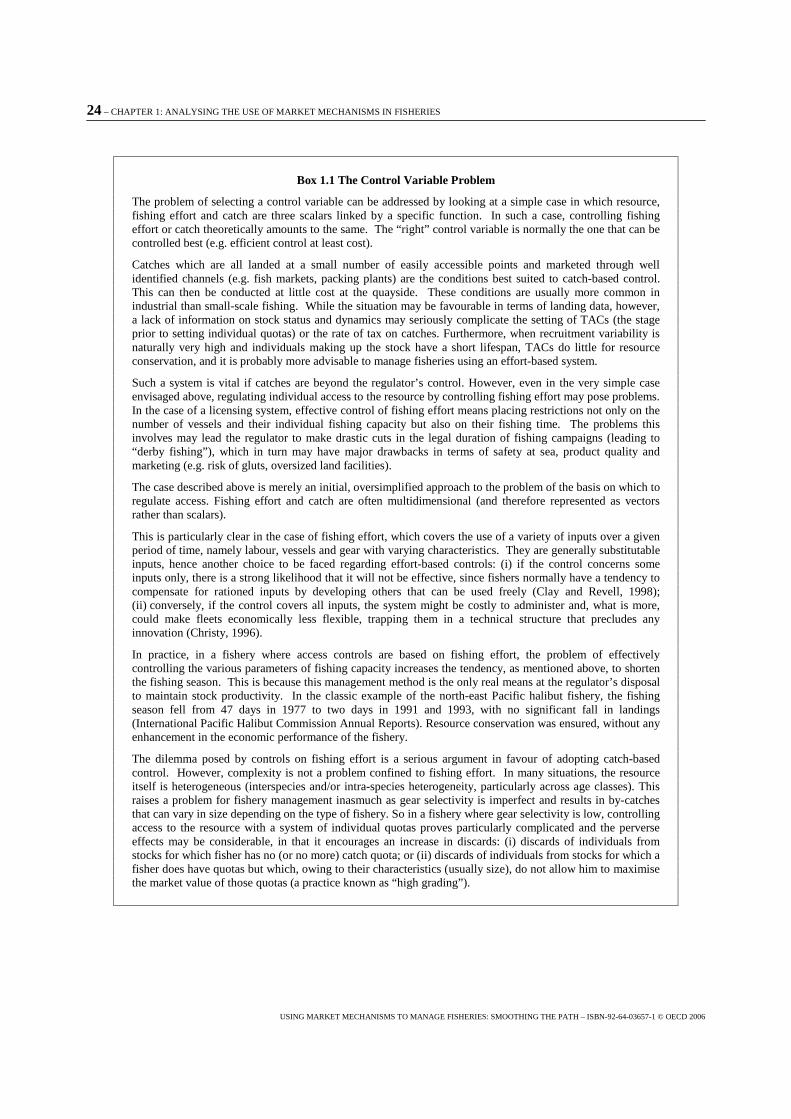
Box 1.1 The Control Variable Problem
The problem of selecting a control variable can be addressed by looking at a simple case in which resource, fishing effort and catch are three scalars linked by a specific function. In such a case, controlling fishing effort or catch theoretically amounts to the same. The “right” control variable is normally the one that can be controlled best (e.g. efficient control at least cost).
Catches which are all landed at a small number of easily accessible points and marketed through well identified channels (e.g. fish markets, packing plants) are the conditions best suited to catch-based control. This can then be conducted at little cost at the quayside. These conditions are usually more common in industrial than small-scale fishing. While the situation may be favourable in terms of landing data, however, a lack of information on stock status and dynamics may seriously complicate the setting of TACs (the stage prior to setting individual quotas) or the rate of tax on catches. Furthermore, when recruitment variability is naturally very high and individuals making up the stock have a short lifespan, TACs do little for resource conservation, and it is probably more advisable to manage fisheries using an effort-based system.
Such a system is vital if catches are beyond the regulator’s control. However, even in the very simple case envisaged above, regulating individual access to the resource by controlling fishing effort may pose problems. In the case of a licensing system, effective control of fishing effort means placing restrictions not only on the number of vessels and their individual fishing capacity but also on their fishing time. The problems this involves may lead the regulator to make drastic cuts in the legal duration of fishing campaigns (leading to “derby fishing”), which in turn may have major drawbacks in terms of safety at sea, product quality and marketing (e.g. risk of gluts, oversized land facilities).
The case described above is merely an initial, oversimplified approach to the problem of the basis on which to regulate access. Fishing effort and catch are often multidimensional (and therefore represented as vectors rather than scalars).
This is particularly clear in the case of fishing effort, which covers the use of a variety of inputs over a given period of time, namely labour, vessels and gear with varying characteristics. They are generally substitutable inputs, hence another choice to be faced regarding effort-based controls: (i) if the control concerns some inputs only, there is a strong likelihood that it will not be effective, since fishers normally have a tendency to compensate for rationed inputs by developing others that can be used freely (Clay and Revell, 1998); (ii) conversely, if the control covers all inputs, the system might be costly to administer and, what is more, could make fleets economically less flexible, trapping them in a technical structure that precludes any innovation (Christy, 1996).
In practice, in a fishery where access controls are based on fishing effort, the problem of effectively controlling the various parameters of fishing capacity increases the tendency, as mentioned above, to shorten the fishing season. This is because this management method is the only real means at the regulator’s disposal to maintain stock productivity. In the classic example of the north-east Pacific halibut fishery, the fishing season fell from 47 days in 1977 to two days in 1991 and 1993, with no significant fall in landings (International Pacific Halibut Commission Annual Reports). Resource conservation was ensured, without any enhancement in the economic performance of the fishery.
The dilemma posed by controls on fishing effort is a serious argument in favour of adopting catch-based control. However, complexity is not a problem confined to fishing effort. In many situations, the resource itself is heterogeneous (interspecies and/or intra-species heterogeneity, particularly across age classes). This raises a problem for fishery management inasmuch as gear selectivity is imperfect and results in by-catches that can vary in size depending on the type of fishery. So in a fishery where gear selectivity is low, controlling access to the resource with a system of individual quotas proves particularly complicated and the perverse effects may be considerable, in that it encourages an increase in discards: (i) discards of individuals from stocks for which fisher has no (or no more) catch quota; or (ii) discards of individuals from stocks for which a fisher does have quotas but which, owing to their characteristics (usually size), do not allow him to maximise the market value of those quotas (a practice known as “high grading”).
CHAPTER 1: ANALYSING THE USE OF MARKET MECHANISMS IN FISHERIES – 25
USING MARKET MECHANISMS TO MANAGE FISHERIES: SMOOTHING THE PATH – ISBN-92-64-03657-1 © OECD 2006
The place of market-like instruments in the regulator’s toolkit
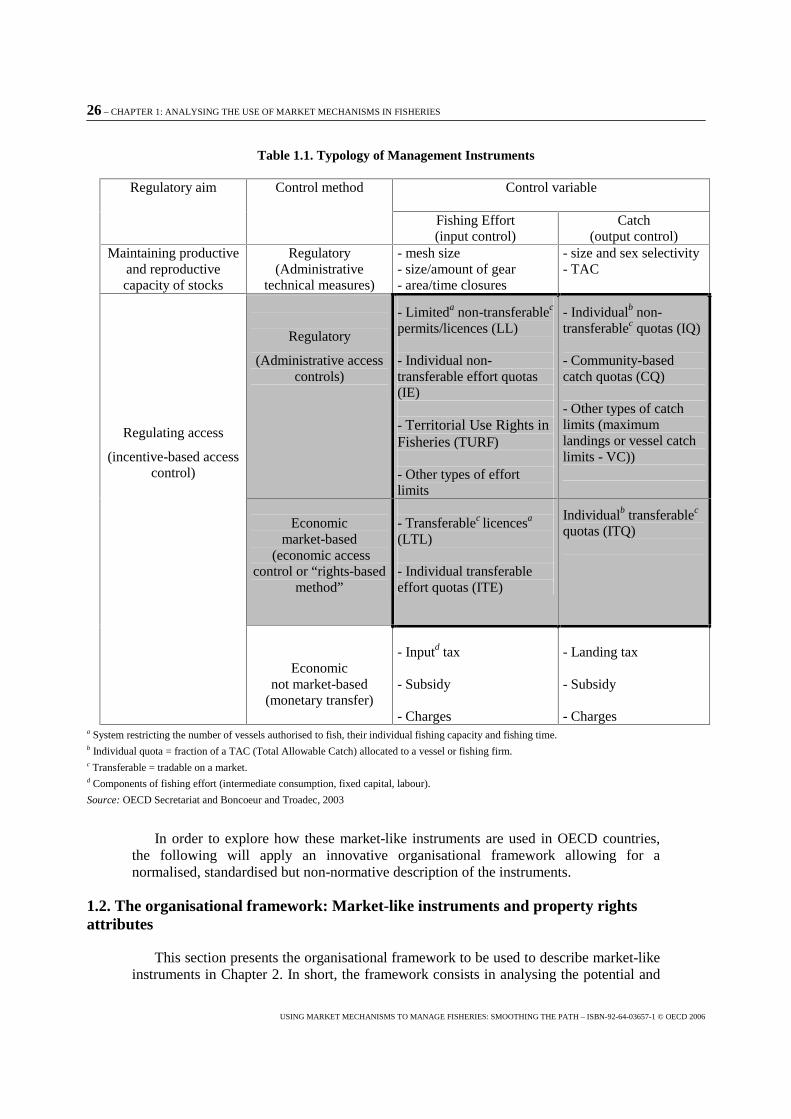
Based on the above discussion, the typology of management instruments can be presented as in Table 1.1 below. The shaded area indicates the “market-like” instruments.
Box 1.2. Tax measures
Tax measures, which may target fishing effort or landings, are driven by the same rationale as the polluter-pays principle in environmental management. They are based on social cost theory (Pigou, 1920), whereby producers of externalities can be made to integrate them into their economic calculations by taxing activities that produce negative externalities and subsidising ones that produce positive externalities.
In the fisheries sector, taxes on fishing effort or landings increase the unit cost of fishing effort in real terms, which should act as an incentive for firms to reduce their fishing effort. So by adjusting the rate of tax, the hope is to restrict fishing effort to the point at which its social marginal product equals its unit cost in real terms (excluding tax), i.e. the point at which the rent derived from harvesting the stock is at its highest. In this system, rent is derived from the proceeds of the tax, leaving open the question of how that revenue is to be allocated.
Up to now, the use of tax measures has been relatively limited in fisheries management. This can be due to both practical (tax collection process and associated risk of misreporting) and political reasons (unwillingness to “charge” fishers). Nevertheless, at least two notable exceptions can be referred to. In Mauritania, soon after the creation of an EEZ in 1978, the government set up an original system of taxation. The tax ranged from 3% to 17. 5 %. In 1992, the SMCP was reported to have collected USD20 million. So by establishing a monopsony, the government managed to extract much of the maximum potential resource rent obtainable from resources in the national EEZ (Troadec and Boncoeur, 2003).
The second example concerns EU agreements to access third countries waters. As part of these agreements, financial compensations are in general granted to third countries. In some case, compensations are expressed in terms of euros per tonne. While such arrangements are similar to tax systems from the owner of the resource point of view, it should be noted that this is not always necessary the case from the right holders side.
Market-like instruments encompass both those administrative regulations that influence fishers’ incentives to race for fish and to overcapitalise and those economic instruments based on market interplay. This excludes monetary transfers. While some monetary transfers have the potential to address some fisheries management challenges (see Box 1.2.), four reasons are cited below for not considering it as part of this study:
� First, such economic incentives are by definition not based on market interplay;
� Second, taxes and resource fees are hardly used as economic incentives (they are mostly used for recovery of management costs);
� Third, subsidies are explored in-depth in the project “Fisheries Subsidies and Sustainable Development”.
� Fourth, the main expected economic effects may be captured when input (e.g. vessel licences) or output (e.g. catch quota) based access rights are charged to rights holders.
26 – CHAPTER 1: ANALYSING THE USE OF MARKET MECHANISMS IN FISHERIES
USING MARKET MECHANISMS TO MANAGE FISHERIES: SMOOTHING THE PATH – ISBN-92-64-03657-1 © OECD 2006
Table 1.1. Typology of Management Instruments
Control variable
Regulatory aim Control method
Fishing Effort (input control)
Catch (output control)
Maintaining productive and reproductive capacity of stocks
Regulatory (Administrative
technical measures)
- mesh size - size/amount of gear - area/time closures
- size and sex selectivity - TAC
Regulatory
(Administrative access controls)
- Limiteda non-transferablec permits/licences (LL) - Individual non-transferable effort quotas (IE) - Territorial Use Rights in Fisheries (TURF) - Other types of effort limits
- Individualb non-transferablec quotas (IQ) - Community-based catch quotas (CQ) - Other types of catch limits (maximum landings or vessel catch limits - VC))
Economic
market-based (economic access
control or “rights-based method”
- Transferablec licencesa
(LTL) - Individual transferable effort quotas (ITE)
Individualb transferablec quotas (ITQ)
Regulating access
(incentive-based access control)
Economic not market-based
(monetary transfer)
- Inputd tax - Subsidy - Charges
- Landing tax - Subsidy - Charges
a System restricting the number of vessels authorised to fish, their individual fishing capacity and fishing time. b Individual quota = fraction of a TAC (Total Allowable Catch) allocated to a vessel or fishing firm. c Transferable = tradable on a market. d Components of fishing effort (intermediate consumption, fixed capital, labour).
Source: OECD Secretariat and Boncoeur and Troadec, 2003
In order to explore how these market-like instruments are used in OECD countries, the following will apply an innovative organisational framework allowing for a normalised, standardised but non-normative description of the instruments.
1.2. The organisational framework: Market-like instruments and property rights attributes
This section presents the organisational framework to be used to describe market-like instruments in Chapter 2. In short, the framework consists in analysing the potential and
CHAPTER 1: ANALYSING THE USE OF MARKET MECHANISMS IN FISHERIES – 27
USING MARKET MECHANISMS TO MANAGE FISHERIES: SMOOTHING THE PATH – ISBN-92-64-03657-1 © OECD 2006
actual effects of market-like instruments using six characteristics borrowed from property rights theory: exclusivity, duration, quality of the title, transferability, divisibility and flexibility. The implications of these characteristics, in the context of fisheries management, will be addressed first. Secondly, the measurement and representation of the characteristics will be discussed.
While drawing on property rights theory, it should be noted that the analysis does not discuss whether or not a given instrument constitutes a property right per se6.
Definitions of property-rights and implications for fisheries management
Scott (1988, 2000) defines six characteristics that can be referred to in comparing any form of property rights: exclusivity, duration, quality of title, transferability, flexibility and divisibility. The following definitions are mainly derived from Scott (2000), Lane (1999) and Harte and Bess (2000).
Exclusivity concerns whether others are prevented from damaging or interfering with an owner’s rights. It refers to the extent that a person’s property rights overlap with the rights of others. Every kind of property right has some exclusivity, but few, if any, are completely exclusive. The greater the possibility for excluding a property right, the lower the common nature of the resource. In the fisheries context, high exclusivity is considered valuable because, by “closing the commons” (Hersoug, 2002), it reduces one of the key incentives to race for fish. In the long run, high exclusivity allows fishers to adjust their investment decision to the quantity of rights for which they have an exclusive use. In the short run, high exclusivity allows for efficient use of existing fishing capacity.
Duration is the length of time the owner of a right may exercise his ownership. A short duration leads to uncertainty. A longer duration allows the right holder to get better returns from investments. In a fishery, longer duration encourages the right-holders to make costly changes (or invest) in the size and age structure of the fish stock that may result in larger and more profitable catches even if there may be an extended waiting period before the benefits can be realised.
Quality of title refers to certainty, security and enforceability of the property right.7 The more predictable the entitlement, the higher the quality of their title. If property rights holders can expect little change over time to their entitlements, the more certain and secure are their rights. High quality of title is valuable because it increases the likelihood that rights holders will invest in the management of their fishery. Quality of title is also valued because it makes the right generally valid in disputes about rights of possession and use against third parties and indeed society as a whole or for banking purposes. Security refers to the strength of the entitlement of the right with regard to how susceptible it might be to being undermined by other users or by new arrangements and regulations that could arbitrarily reduce the characteristics of the right. Security depends on the explicit or implicit nature of the right and on the way it may be considered under legal cases. To protect the right from other users, some form of enforceability is needed. The higher the level of enforceability, the greater the quality of the title. In the context of fisheries, the “sovereign risk”8, i.e. the right of the government to change the rules (unexpected closure of a fishery) for environmental, safety (e.g. pollution) or social
6 This issue, which depends on institutional arrangements, is addressed later on.
7 In some cases the incentive to self enforce the property right may be strong.
8 Sovereign risk may also be affected by international cooperation. This issue is addressed later in the study.
28 – CHAPTER 1: ANALYSING THE USE OF MARKET MECHANISMS IN FISHERIES
USING MARKET MECHANISMS TO MANAGE FISHERIES: SMOOTHING THE PATH – ISBN-92-64-03657-1 © OECD 2006
reasons (e.g. new allocation of rights) represent a challenge to the security aspect of this characteristic. Non compliance behaviours such as IUU fishing activities also strongly challenge enforceability9.
Transferability is the extent to which the entitlement to a right can be transferred by selling, leasing or trading. All degrees of transferability are possible. On land, most freehold rights are highly transferable and most leases are transferable with the permission of the landlord. But there are exceptions (e.g. some landlords will not allow their tenants to sub-let a house). Transferability is valued because it provides more efficient operators with the option to buy rights from less efficient operators and then allows the holder to make the best use of his time and capital.
Divisibility refers to the ability to divide (a) property rights more narrowly, producing new recognised rights specified perhaps by season, region, ground, species, age or other classification and (b), the amount of quota into smaller amounts and to transfer some quota to others.
Flexibility refers to the ability of property rights holders to “freely” structure operations to achieve their goals. Flexibility is valuable because it allows rights owners to both use their rights in the most efficient way given technical constraints (including through selling or leasing it) or to modify their production function in order to match their rights entitlements. In the fisheries context, flexibility is of particular interest due to natural fluctuations (in stock recruitment, weather, etc., i.e. the so called “stochastic nature” of fishing activities). Flexible management instruments may allow for increased efficiency in the use of fishing capacities through matching these natural fluctuations (e.g. banking of quotas from one period to another).
Each of these six characteristics has a role to play in the transition towards sustainable and responsible fisheries. Exclusivity can reduce incentives to race for fish; Duration can increase the time horizon; Quality of the title can increase certainty; Transferability can allow for efficient allocation of the rights; and divisibility and flexibility can improve adaptability to economic and environmental changes and thus providing more security.
These six characteristics are interrelated to a large extent. Combined, they generate a particular bundle of rights which will facilitate particular management outcomes. However, individual characteristics may have a stronger role to play in some areas. For example, it is often considered that some characteristics (exclusivity, duration, quality of the title and transferability) may be more likely to facilitate appropriate investment and structural fleet adjustment, while others may mostly facilitate the efficient use of existing fishing capacities (Scott, 1988). A graphic representation of these features is proposed in the following section.
Measurement and representation of the characteristics
The following analysis will assess the characteristics of each of the market-like instruments in terms of the six characteristics of property rights. The strength of each characteristic can be regarded as continuous (i.e. not discrete) and can be expressed numerically (e.g. it might run from 0 to 100 %; Scott, 1988). All characteristics can be “incomplete” or “attenuated”. This may be due for instance to the regulatory design of the
9 The use of institutional arrangement to reduce uncertainty and improve compliance (e.g. use of buffers; co- management processes) is further explored in chapter 3.
CHAPTER 1: ANALYSING THE USE OF MARKET MECHANISMS IN FISHERIES – 29
USING MARKET MECHANISMS TO MANAGE FISHERIES: SMOOTHING THE PATH – ISBN-92-64-03657-1 © OECD 2006
instrument (e.g. limitation on transferability) or to the nature of the right’s basis (e.g. a quota of catches is easier to divide than a vessel)10.
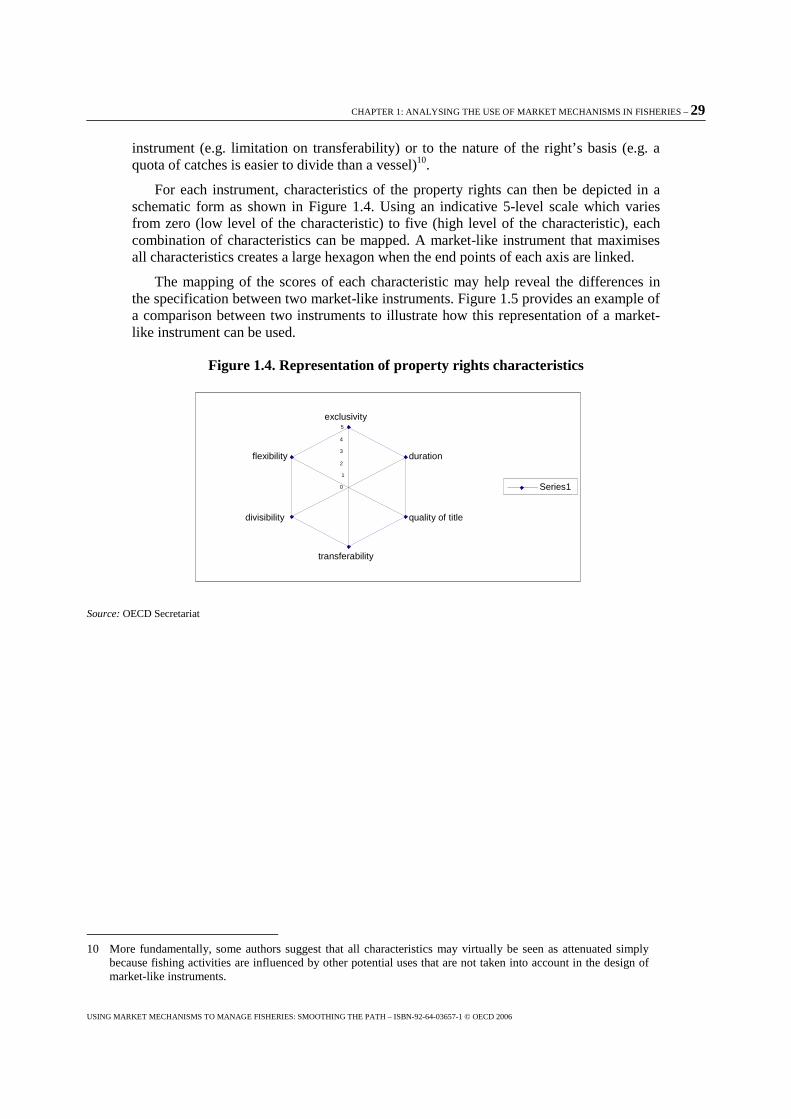
For each instrument, characteristics of the property rights can then be depicted in a schematic form as shown in Figure 1.4. Using an indicative 5-level scale which varies from zero (low level of the characteristic) to five (high level of the characteristic), each combination of characteristics can be mapped. A market-like instrument that maximises all characteristics creates a large hexagon when the end points of each axis are linked.
The mapping of the scores of each characteristic may help reveal the differences in the specification between two market-like instruments. Figure 1.5 provides an example of a comparison between two instruments to illustrate how this representation of a market-like instrument can be used.
Figure 1.4. Representation of property rights characteristics
Source: OECD Secretariat
10 More fundamentally, some authors suggest that all characteristics may virtually be seen as attenuated simply because fishing activities are influenced by other potential uses that are not taken into account in the design of market-like instruments.
0 1
2 3 4 5
exclusivity
duration
quality of title
transferability
divisibility
flexibility
Series1
30 – CHAPTER 1: ANALYSING THE USE OF MARKET MECHANISMS IN FISHERIES
USING MARKET MECHANISMS TO MANAGE FISHERIES: SMOOTHING THE PATH – ISBN-92-64-03657-1 © OECD 2006
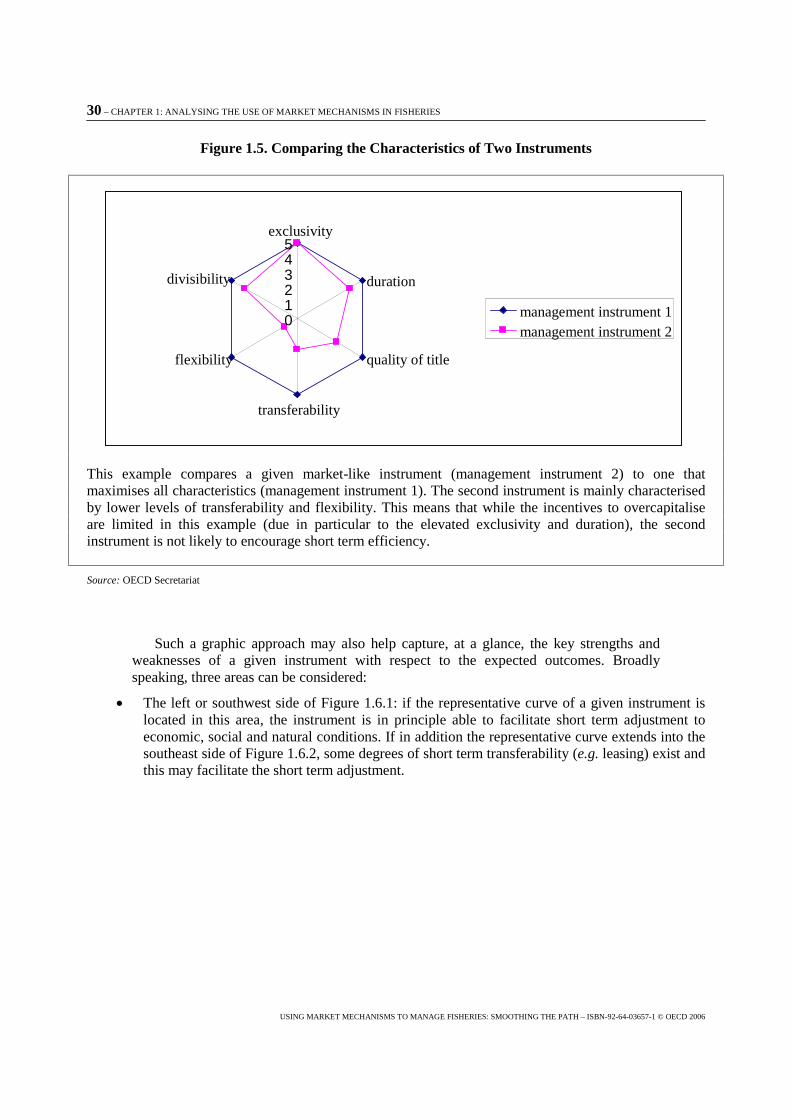
Figure 1.5. Comparing the Characteristics of Two Instruments
This example compares a given market-like instrument (management instrument 2) to one that maximises all characteristics (management instrument 1). The second instrument is mainly characterised by lower levels of transferability and flexibility. This means that while the incentives to overcapitalise are limited in this example (due in particular to the elevated exclusivity and duration), the second instrument is not likely to encourage short term efficiency.
Source: OECD Secretariat
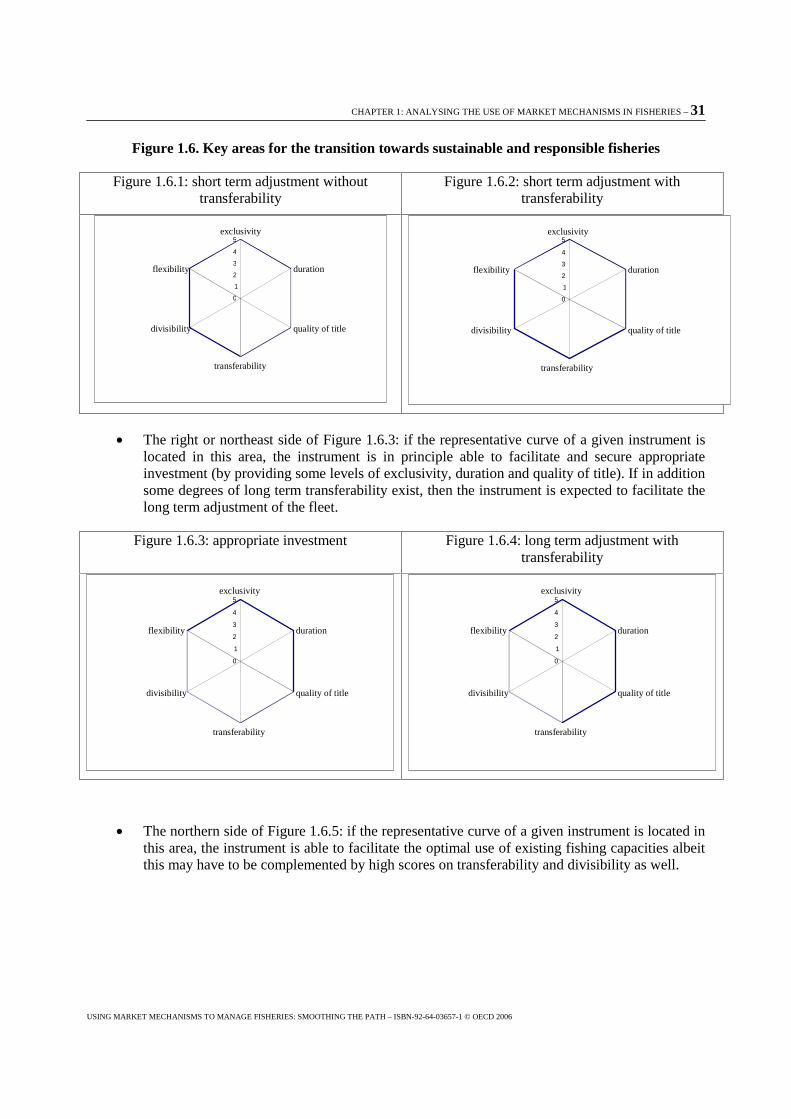
Such a graphic approach may also help capture, at a glance, the key strengths and weaknesses of a given instrument with respect to the expected outcomes. Broadly speaking, three areas can be considered:
� The left or southwest side of Figure 1.6.1: if the representative curve of a given instrument is located in this area, the instrument is in principle able to facilitate short term adjustment to economic, social and natural conditions. If in addition the representative curve extends into the southeast side of Figure 1.6.2, some degrees of short term transferability (e.g. leasing) exist and this may facilitate the short term adjustment.
0 1 2 3 4 5
exclusivity
duration
quality of title
transferability
flexibility
divisibility
management instrument 1 management instrument 2
CHAPTER 1: ANALYSING THE USE OF MARKET MECHANISMS IN FISHERIES – 31
USING MARKET MECHANISMS TO MANAGE FISHERIES: SMOOTHING THE PATH – ISBN-92-64-03657-1 © OECD 2006
Figure 1.6. Key areas for the transition towards sustainable and responsible fisheries
Figure 1.6.1: short term adjustment without transferability
Figure 1.6.2: short term adjustment with transferability
� The right or northeast side of Figure 1.6.3: if the representative curve of a given instrument is located in this area, the instrument is in principle able to facilitate and secure appropriate investment (by providing some levels of exclusivity, duration and quality of title). If in addition some degrees of long term transferability exist, then the instrument is expected to facilitate the long term adjustment of the fleet.
Figure 1.6.3: appropriate investment Figure 1.6.4: long term adjustment with transferability
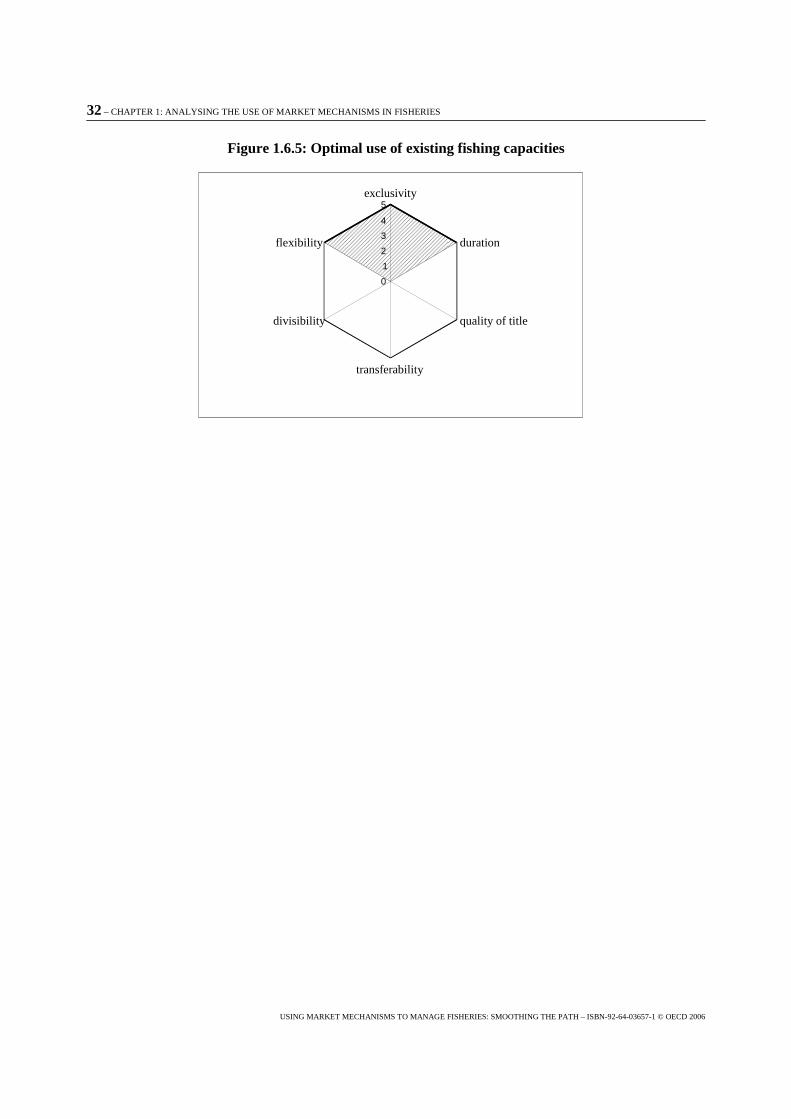
� The northern side of Figure 1.6.5: if the representative curve of a given instrument is located in
this area, the instrument is able to facilitate the optimal use of existing fishing capacities albeit this may have to be complemented by high scores on transferability and divisibility as well.
0 1 2 3 4 5 exclusivity
duration
quality of title
transferability
divisibility
flexibility
0 1 2 3 4 5 exclusivity
duration
quality of title
transferability
divisibility
flexibility
0 1 2 3 4 5
exclusivity
duration
quality of title
transferability
divisibility
flexibility
0 1 2 3 4 5
exclusivity
duration
quality of title
transferability
divisibility
flexibility
32 – CHAPTER 1: ANALYSING THE USE OF MARKET MECHANISMS IN FISHERIES
USING MARKET MECHANISMS TO MANAGE FISHERIES: SMOOTHING THE PATH – ISBN-92-64-03657-1 © OECD 2006
Figure 1.6.5: Optimal use of existing fishing capacities
0 1 2 3 4 5
exclusivity
duration
quality of title
transferability
divisibility
flexibility
CHAPTER 2 - CHARACTERISTICS AND EFFECTS OF MARKET MECHANISMS – 33
USING MARKET MECHANISMS TO MANAGE FISHERIES: SMOOTHING THE PATH– ISBN-92-64- 03657-1 © OECD 2006
Chapter 2
Characteristics and Effects of Market Mechanisms
Introduction
This chapter summarises the use, the key characteristics and the effects of each market-like instrument. In doing so, the section in particular clarifies how the reform towards sustainable and responsible fisheries can be constructed using different market-like instruments. The section is expected to benefit policy makers for at least three reasons:
� By summarising the use of market-like instruments in 16 OECD countries, the section will provide a “state-of-the-art” inventory of the fisheries management instruments available to policy makers, including those instruments characterised by “innovative variants”1. In doing so, the section is expected to broaden and deepen the regulator’s “tool-kit”.
� By clarifying how and where market-like instruments are implemented, the section will allow for the “demystification” of what is often perceived as a sensitive issue;
� By applying the non-normative organisational framework, the section will help clarifying the similarities and differences in design between a continuum of market-like instruments;
For presentation purposes, the section first addresses those market-like instruments that provide a direct access right to the resource (2.1.1): territorial use rights in fisheries (TURFs); community-based catch quotas (CQs); vessel catch limits (VCs); individual non-transferable quotas (IQs) and individual transferable quotas (ITQs). The section then considers those market-like instruments that have an indirect access right to the resource: limited non-transferable permits/licences (LLs); transferable permits/licences (LTLs); individual non-transferable effort quota (IEs); individual transferable effort quota (ITEs) (2.1.2). A mapping of the general characteristics is proposed for each market-like instrument, and a table summarising the results of the analysis is presented at the end of the section (Table 2.10). A summary of the mappings is also proposed in Figure 2.10.
1 The last inventory conducted by the OECD in this domain was published in 1997 (OECD, 1997) and was based on 1993-1995 data.
34 – CHAPTER 2 - CHARACTERISTICS AND EFFECTS OF MARKET MECHANISMS
USING MARKET MECHANISMS TO MANAGE FISHERIES: SMOOTHING THE PATH– ISBN-92-64- 03657-1 © OECD 2006
1. Direct access rights to the resource
Territorial use rights in fisheries (TURFs)
One particular way of limiting fishing capacity is the establishment of territorial use rights. TURF (Territorial Use Rights in Fisheries) consist of the allocation of a certain area of the ocean and the associated seabed to a single user (Arnason, 2001), where the user can either be an individual or a group (Christy, 1982). TURFs have been employed in several fisheries around the world, such as ocean quahog in Iceland, oyster in USA, mussels and scallops in New Zealand (Arnason, 2001) and abalone in Japan (Criddle, 1999). Updates of fisheries management systems show that forms of TURF are also in use in Sweden (where waters around the coast and in the lakes are privately owned up to 300 meters), Finland (where part of the territorial waters are privately owned), in Mexico (for aquaculture) and in Italy . In other countries, such as Korea, combined forms of TURF and community-based catch quotas (CQ, see below) are also in place.
Exclusivity: By definition, TURFs are exclusive rights to use a certain sea territory. With appropriate enforcement, outsiders can in principle be prevented from accessing the resource evolving within TURF limits. As far as exclusivity is concerned, an additional prominent factor is that the exclusivity can be comprehensive or “non-attenuated”, in a sense that TURFs may cover all potential uses of the fishing ground. Not only can the holder of the right regulate the access to a specific stock, but he can also control many of the environmental variables on which the fish stock depends (Arnason, 2001). Exclusivity also depends on the type of resource exploited. When the resource is relatively immobile, or when its location is predictable at a particular time, exclusivity is expected to be higher. Most examples of TURFs indeed concerns relatively sedentary species such as ocean quahog, oyster, scallops and abalone because exclusivity is easier to enforce. As it can be reasonable to assume that TURF are mainly used for this type of species, it is proposed to attribute the characteristic a high level (ranked 5 on the scale).
Duration: Where waters are privately owned (e.g. coastal waters in Sweden), TURFs are attributed on a permanent basis. TURFs can also be attributed on a relatively long term basis. For instance, concessions for aquaculture are granted in Mexico for up 50 years2. As noted in the fisheries management systems’ update (see country submission from Mexico available on the Fisheries public web site: www.oecd.org/agr/fish), the Mexican instrument was indeed explicitly designed to facilitate access to credit by providing long-term certainty. In Italy, licences are valid for eight years and are renewed on the request of the shipowner relatively automatically. Assuming that most of TURFs are designed for mid or long term purposes, this characteristic is high (ranked 5 on the scale).
Quality of the title: In principle, as the right is given to a single user, both security and enforceability are expected to be high. In addition, the Swedish update of fisheries management system suggests that it may also be possible for TURF holders to join and cooperate in order to improve enforcement and compliance. Yet, when a TURF is large, it may be difficult (or costly) to enforce it in practice. Information available from the survey however suggests that the level of the characteristic can be considered high (ranked 5 on the scale).
2 TURFs are indeed likely to be widely used in aquaculture. While only few Member countries have up to now reported on aquaculture, the Committee may considered it for further in-depth analysis.
CHAPTER 2 - CHARACTERISTICS AND EFFECTS OF MARKET MECHANISMS – 35
USING MARKET MECHANISMS TO MANAGE FISHERIES: SMOOTHING THE PATH– ISBN-92-64- 03657-1 © OECD 2006
Transferability: Depending of the legal nature of the TURF, transferability may vary. When waters are privately owned (e.g. in Sweden), transferability can be full. In other cases (e.g. in Mexico), transfers of concessions can also be allowed. In Italy, while transfer of rights between owners is in principle forbidden in the long run, transferability is in practice allowed to a certain extent. When associated with a system of community quota, as it is the case in the Italian example of TURF, short run transferability can also take place de facto. As a result, the level of the characteristic may be considered relatively high (ranked 4-5 on the scale).
Divisibility: In principle, a single user (or sole owner) could be able to divide a TURF into “sub-TURFs”. Notwithstanding the transferability issue, this characteristic is thus considered as high (ranked 5 on the scale).
Flexibility: As the right holder is in principle free to choose the best way to manage his TURF, this characteristic is considered as high, although it might be limited (as in Italy) by general regulations (ranked 5 on the scale).
In sum, a TURF is characterised by relatively high level for all characteristics. The table (2.1) summarises the information provided in the survey for the two countries that documented this instrument.
Table 2.1. Summary scoring of the characteristics of TURFs in place in OECD countries
Italy Sweden exclusivity 5 5 duration 4 5 quality of title 5 5 transferability 3 5 divisibility 4 5 flexibility 4 5
By providing the holder(s) with a situation of “sole ownerships” (Gordon, 1954), TURF eliminate most of the externalities that are central to fishery management issues. In this regard, Arnason (2001) even suggests that TURF may be parallel to a farm property on land, creating all conditions for efficient exploitation.
Depending on the species exploited (sedentary or not) and the size of the territory, this market-like instrument seems able to provide strong incentives for appropriate investment and relatively high scope for short term adjustments. This is reflected in Figure 2.1 below.
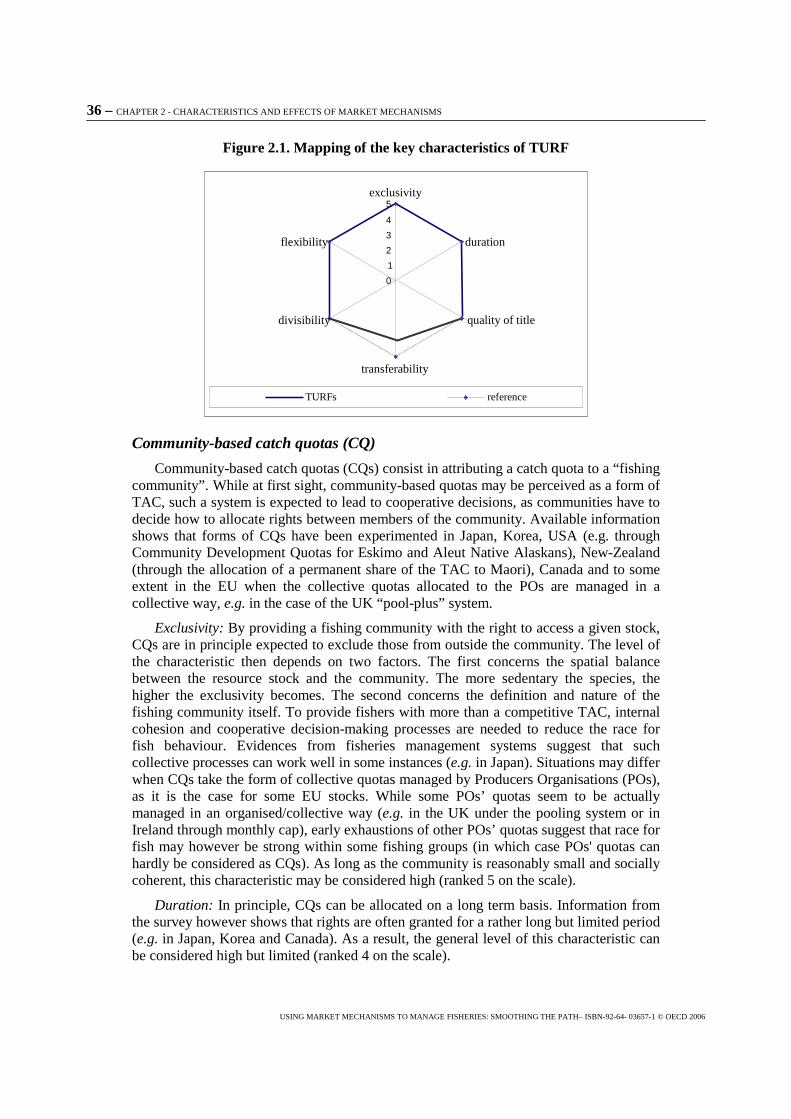
36 – CHAPTER 2 - CHARACTERISTICS AND EFFECTS OF MARKET MECHANISMS
USING MARKET MECHANISMS TO MANAGE FISHERIES: SMOOTHING THE PATH– ISBN-92-64- 03657-1 © OECD 2006
Figure 2.1. Mapping of the key characteristics of TURF
Community-based catch quotas (CQ)
Community-based catch quotas (CQs) consist in attributing a catch quota to a “fishing community”. While at first sight, community-based quotas may be perceived as a form of TAC, such a system is expected to lead to cooperative decisions, as communities have to decide how to allocate rights between members of the community. Available information shows that forms of CQs have been experimented in Japan, Korea, USA (e.g. through Community Development Quotas for Eskimo and Aleut Native Alaskans), New-Zealand (through the allocation of a permanent share of the TAC to Maori), Canada and to some extent in the EU when the collective quotas allocated to the POs are managed in a collective way, e.g. in the case of the UK “pool-plus” system.
Exclusivity: By providing a fishing community with the right to access a given stock, CQs are in principle expected to exclude those from outside the community. The level of the characteristic then depends on two factors. The first concerns the spatial balance between the resource stock and the community. The more sedentary the species, the higher the exclusivity becomes. The second concerns the definition and nature of the fishing community itself. To provide fishers with more than a competitive TAC, internal cohesion and cooperative decision-making processes are needed to reduce the race for fish behaviour. Evidences from fisheries management systems suggest that such collective processes can work well in some instances (e.g. in Japan). Situations may differ when CQs take the form of collective quotas managed by Producers Organisations (POs), as it is the case for some EU stocks. While some POs’ quotas seem to be actually managed in an organised/collective way (e.g. in the UK under the pooling system or in Ireland through monthly cap), early exhaustions of other POs’ quotas suggest that race for fish may however be strong within some fishing groups (in which case POs' quotas can hardly be considered as CQs). As long as the community is reasonably small and socially coherent, this characteristic may be considered high (ranked 5 on the scale).
Duration: In principle, CQs can be allocated on a long term basis. Information from the survey however shows that rights are often granted for a rather long but limited period (e.g. in Japan, Korea and Canada). As a result, the general level of this characteristic can be considered high but limited (ranked 4 on the scale).
0 1 2 3 4 5
exclusivity
duration
quality of title
transferability
divisibility
flexibility
TURFs reference
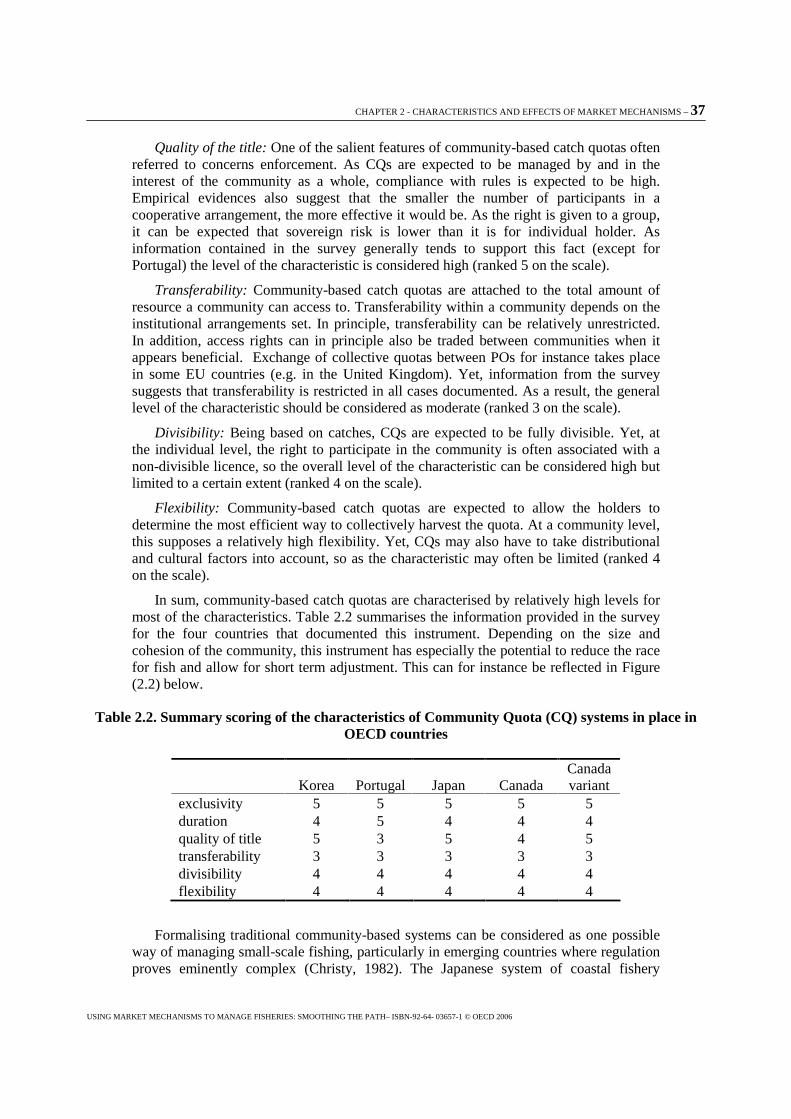
CHAPTER 2 - CHARACTERISTICS AND EFFECTS OF MARKET MECHANISMS – 37
USING MARKET MECHANISMS TO MANAGE FISHERIES: SMOOTHING THE PATH– ISBN-92-64- 03657-1 © OECD 2006
Quality of the title: One of the salient features of community-based catch quotas often referred to concerns enforcement. As CQs are expected to be managed by and in the interest of the community as a whole, compliance with rules is expected to be high. Empirical evidences also suggest that the smaller the number of participants in a cooperative arrangement, the more effective it would be. As the right is given to a group, it can be expected that sovereign risk is lower than it is for individual holder. As information contained in the survey generally tends to support this fact (except for Portugal) the level of the characteristic is considered high (ranked 5 on the scale).
Transferability: Community-based catch quotas are attached to the total amount of resource a community can access to. Transferability within a community depends on the institutional arrangements set. In principle, transferability can be relatively unrestricted. In addition, access rights can in principle also be traded between communities when it appears beneficial. Exchange of collective quotas between POs for instance takes place in some EU countries (e.g. in the United Kingdom). Yet, information from the survey suggests that transferability is restricted in all cases documented. As a result, the general level of the characteristic should be considered as moderate (ranked 3 on the scale).
Divisibility: Being based on catches, CQs are expected to be fully divisible. Yet, at the individual level, the right to participate in the community is often associated with a non-divisible licence, so the overall level of the characteristic can be considered high but limited to a certain extent (ranked 4 on the scale).
Flexibility: Community-based catch quotas are expected to allow the holders to determine the most efficient way to collectively harvest the quota. At a community level, this supposes a relatively high flexibility. Yet, CQs may also have to take distributional and cultural factors into account, so as the characteristic may often be limited (ranked 4 on the scale).
In sum, community-based catch quotas are characterised by relatively high levels for most of the characteristics. Table 2.2 summarises the information provided in the survey for the four countries that documented this instrument. Depending on the size and cohesion of the community, this instrument has especially the potential to reduce the race for fish and allow for short term adjustment. This can for instance be reflected in Figure (2.2) below.
Table 2.2. Summary scoring of the characteristics of Community Quota (CQ) systems in place in OECD countries
Korea Portugal Japan Canada Canada variant
exclusivity 5 5 5 5 5 duration 4 5 4 4 4 quality of title 5 3 5 4 5 transferability 3 3 3 3 3 divisibility 4 4 4 4 4 flexibility 4 4 4 4 4
Formalising traditional community-based systems can be considered as one possible way of managing small-scale fishing, particularly in emerging countries where regulation proves eminently complex (Christy, 1982). The Japanese system of coastal fishery
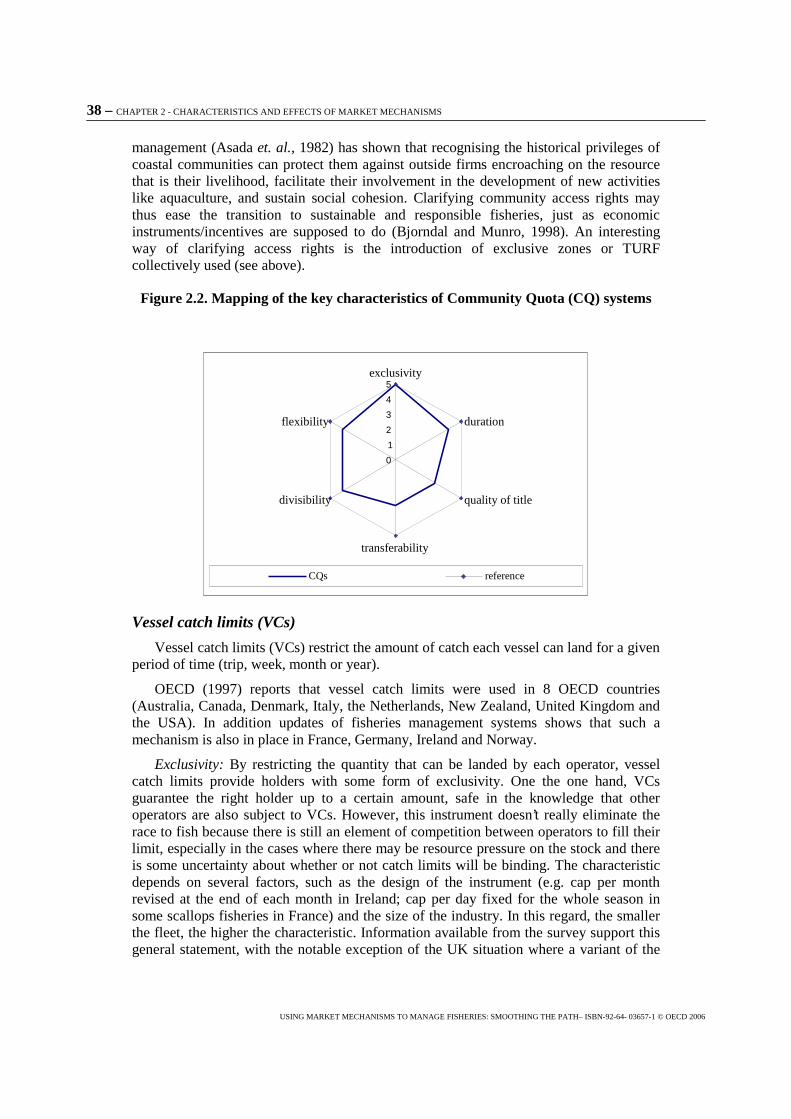
38 – CHAPTER 2 - CHARACTERISTICS AND EFFECTS OF MARKET MECHANISMS
USING MARKET MECHANISMS TO MANAGE FISHERIES: SMOOTHING THE PATH– ISBN-92-64- 03657-1 © OECD 2006
management (Asada et. al., 1982) has shown that recognising the historical privileges of coastal communities can protect them against outside firms encroaching on the resource that is their livelihood, facilitate their involvement in the development of new activities like aquaculture, and sustain social cohesion. Clarifying community access rights may thus ease the transition to sustainable and responsible fisheries, just as economic instruments/incentives are supposed to do (Bjorndal and Munro, 1998). An interesting way of clarifying access rights is the introduction of exclusive zones or TURF collectively used (see above).
Figure 2.2. Mapping of the key characteristics of Community Quota (CQ) systems
Vessel catch limits (VCs)
Vessel catch limits (VCs) restrict the amount of catch each vessel can land for a given period of time (trip, week, month or year).
OECD (1997) reports that vessel catch limits were used in 8 OECD countries (Australia, Canada, Denmark, Italy, the Netherlands, New Zealand, United Kingdom and the USA). In addition updates of fisheries management systems shows that such a mechanism is also in place in France, Germany, Ireland and Norway.
Exclusivity: By restricting the quantity that can be landed by each operator, vessel catch limits provide holders with some form of exclusivity. One the one hand, VCs guarantee the right holder up to a certain amount, safe in the knowledge that other operators are also subject to VCs. However, this instrument doesn’t really eliminate the race to fish because there is still an element of competition between operators to fill their limit, especially in the cases where there may be resource pressure on the stock and there is some uncertainty about whether or not catch limits will be binding. The characteristic depends on several factors, such as the design of the instrument (e.g. cap per month revised at the end of each month in Ireland; cap per day fixed for the whole season in some scallops fisheries in France) and the size of the industry. In this regard, the smaller the fleet, the higher the characteristic. Information available from the survey support this general statement, with the notable exception of the UK situation where a variant of the
0 1 2 3 4 5
exclusivity
duration
quality of title
transferability
divisibility
flexibility
CQs reference
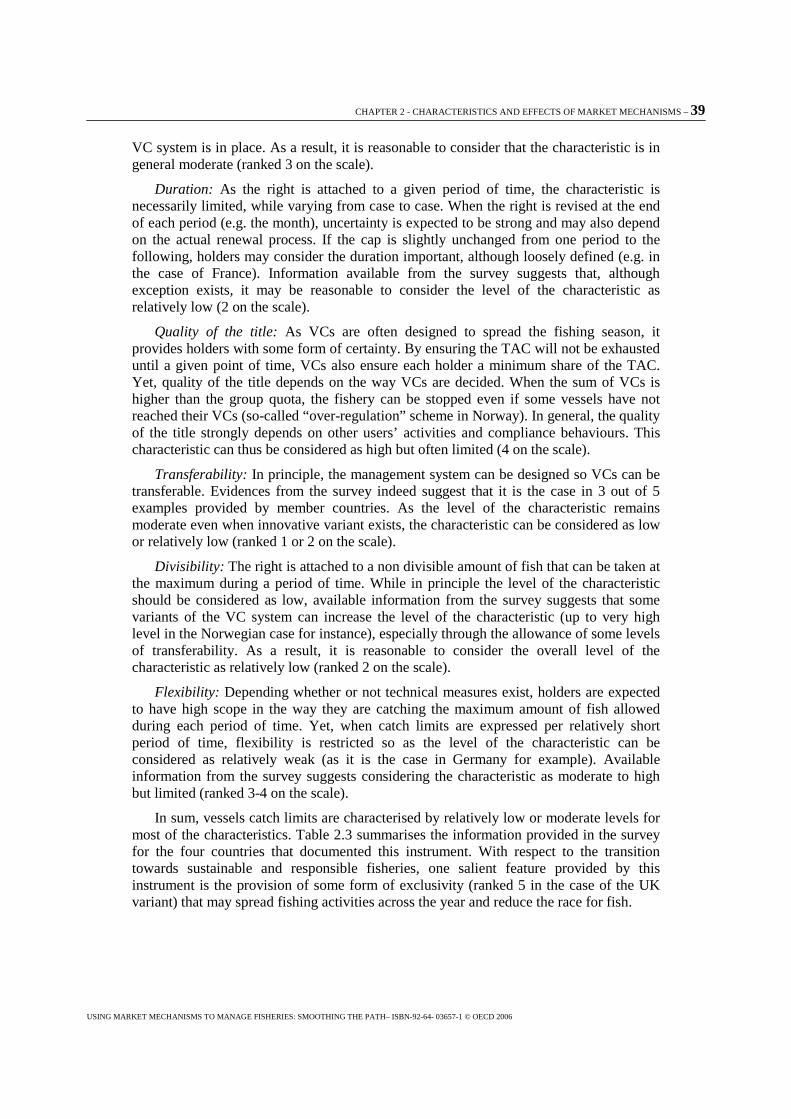
CHAPTER 2 - CHARACTERISTICS AND EFFECTS OF MARKET MECHANISMS – 39
USING MARKET MECHANISMS TO MANAGE FISHERIES: SMOOTHING THE PATH– ISBN-92-64- 03657-1 © OECD 2006
VC system is in place. As a result, it is reasonable to consider that the characteristic is in general moderate (ranked 3 on the scale).
Duration: As the right is attached to a given period of time, the characteristic is necessarily limited, while varying from case to case. When the right is revised at the end of each period (e.g. the month), uncertainty is expected to be strong and may also depend on the actual renewal process. If the cap is slightly unchanged from one period to the following, holders may consider the duration important, although loosely defined (e.g. in the case of France). Information available from the survey suggests that, although exception exists, it may be reasonable to consider the level of the characteristic as relatively low (2 on the scale).
Quality of the title: As VCs are often designed to spread the fishing season, it provides holders with some form of certainty. By ensuring the TAC will not be exhausted until a given point of time, VCs also ensure each holder a minimum share of the TAC. Yet, quality of the title depends on the way VCs are decided. When the sum of VCs is higher than the group quota, the fishery can be stopped even if some vessels have not reached their VCs (so-called “over-regulation” scheme in Norway). In general, the quality of the title strongly depends on other users’ activities and compliance behaviours. This characteristic can thus be considered as high but often limited (4 on the scale).
Transferability: In principle, the management system can be designed so VCs can be transferable. Evidences from the survey indeed suggest that it is the case in 3 out of 5 examples provided by member countries. As the level of the characteristic remains moderate even when innovative variant exists, the characteristic can be considered as low or relatively low (ranked 1 or 2 on the scale).
Divisibility: The right is attached to a non divisible amount of fish that can be taken at the maximum during a period of time. While in principle the level of the characteristic should be considered as low, available information from the survey suggests that some variants of the VC system can increase the level of the characteristic (up to very high level in the Norwegian case for instance), especially through the allowance of some levels of transferability. As a result, it is reasonable to consider the overall level of the characteristic as relatively low (ranked 2 on the scale).
Flexibility: Depending whether or not technical measures exist, holders are expected to have high scope in the way they are catching the maximum amount of fish allowed during each period of time. Yet, when catch limits are expressed per relatively short period of time, flexibility is restricted so as the level of the characteristic can be considered as relatively weak (as it is the case in Germany for example). Available information from the survey suggests considering the characteristic as moderate to high but limited (ranked 3-4 on the scale).
In sum, vessels catch limits are characterised by relatively low or moderate levels for most of the characteristics. Table 2.3 summarises the information provided in the survey for the four countries that documented this instrument. With respect to the transition towards sustainable and responsible fisheries, one salient feature provided by this instrument is the provision of some form of exclusivity (ranked 5 in the case of the UK variant) that may spread fishing activities across the year and reduce the race for fish.
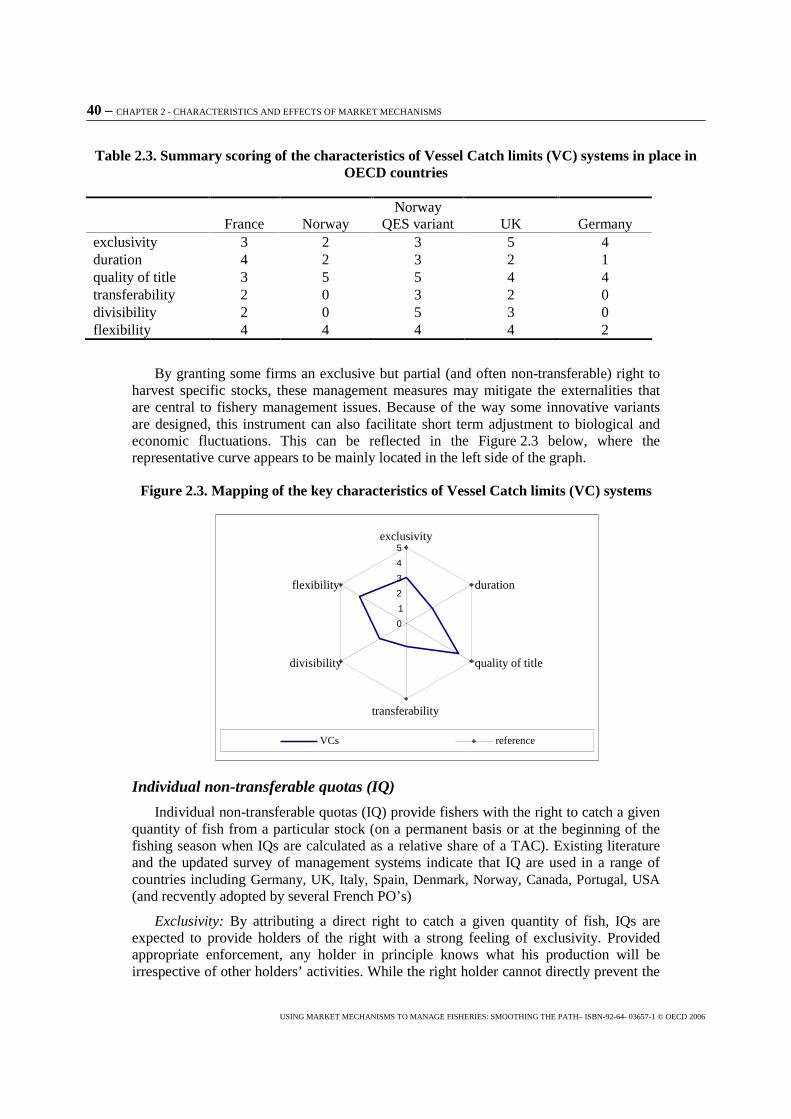
40 – CHAPTER 2 - CHARACTERISTICS AND EFFECTS OF MARKET MECHANISMS
USING MARKET MECHANISMS TO MANAGE FISHERIES: SMOOTHING THE PATH– ISBN-92-64- 03657-1 © OECD 2006
Table 2.3. Summary scoring of the characteristics of Vessel Catch limits (VC) systems in place in OECD countries
France Norway Norway
QES variant UK Germany exclusivity 3 2 3 5 4 duration 4 2 3 2 1 quality of title 3 5 5 4 4 transferability 2 0 3 2 0 divisibility 2 0 5 3 0 flexibility 4 4 4 4 2
By granting some firms an exclusive but partial (and often non-transferable) right to harvest specific stocks, these management measures may mitigate the externalities that are central to fishery management issues. Because of the way some innovative variants are designed, this instrument can also facilitate short term adjustment to biological and economic fluctuations. This can be reflected in the Figure 2.3 below, where the representative curve appears to be mainly located in the left side of the graph.
Figure 2.3. Mapping of the key characteristics of Vessel Catch limits (VC) systems
Individual non-transferable quotas (IQ)
Individual non-transferable quotas (IQ) provide fishers with the right to catch a given quantity of fish from a particular stock (on a permanent basis or at the beginning of the fishing season when IQs are calculated as a relative share of a TAC). Existing literature and the updated survey of management systems indicate that IQ are used in a range of countries including Germany, UK, Italy, Spain, Denmark, Norway, Canada, Portugal, USA (and recvently adopted by several French PO’s)
Exclusivity: By attributing a direct right to catch a given quantity of fish, IQs are expected to provide holders of the right with a strong feeling of exclusivity. Provided appropriate enforcement, any holder in principle knows what his production will be irrespective of other holders’ activities. While the right holder cannot directly prevent the
0 1 2 3 4 5
exclusivity
duration
quality of title
transferability
divisibility
flexibility
VCs reference
CHAPTER 2 - CHARACTERISTICS AND EFFECTS OF MARKET MECHANISMS – 41
USING MARKET MECHANISMS TO MANAGE FISHERIES: SMOOTHING THE PATH– ISBN-92-64- 03657-1 © OECD 2006
others to catch the fish before him, he also knows that none of them would damage his right by exceeding their own quotas. As a result, the characteristic can be considered as high (ranked 5 on the scale).
Duration: In principle, IQs can be allocated on a permanent basis. In practice however, IQs are often attributed on an annual basis and renewed at the beginning of each period. Available examples from fisheries management systems’ updates show that this takes place for instance in Germany, through the distribution of the annual Baltic cod and saithe TAC, as well as in some EU countries for the distribution of fishing quotas in third-country waters. When the renewal of IQs is conditioned to objective criteria, such as the compliance with rules, the time-horizon can be considered as long, but loosely defined. In the absence of clear rules on the renewal and the attribution of IQs, the time-horizon may be too short to incite holders of the right to modify their investment and operational behaviour. In this regard, it is worth noting that the German report suggests that the move towards multi-annual quotas would increase the duration and give the fishers more flexibility in managing their allocated resources (http://www.oecd.org/dataoecd/10/57/34429370.pdf). When IQs are attributed on a permanent basis (e.g. in Portugal), the level of duration is high. Between the two extreme cases, some innovative variants can provide relatively high level of duration (e.g. in Norway). Evidences from available country reports suggest that in practice the characteristic may be in general considered as moderate to relatively high (ranked 3-4 on the scale).
Quality of the title: The quality of the title first depends on the security of the title, i.e. on the way IQs can be attenuated by the regulator. In principle, the right to access the resource is relatively secure in OECD countries. In practice, the security of the right can be attenuated by sovereign risk, e.g. when the regulator decides to close a fishery due to high level of IUU fishing even if some vessels have not reached their IQs. Second, quality of the title also depends on the way IQs are enforced. As the right is based on catches, it may be relatively difficult to control and monitor. The enforceability issue is indeed one of the salient challenges faced by IQs systems. It depends on Monitoring, Control and Surveillance (MCS) capacities, the size and mobility of the stock concerned and compliance behaviour. This latter factor is mainly influenced by the size and cohesion of the fleet. A small and homogeneous fleet is expected to provide the holder with a higher certainty. It may also be influenced by the allocation process (especially when rights are evenly distributed) and the lack of flexibility of the instrument which may generate gaps between fishing capacities and IQs and subsequently lead to some forms of IUU fishing. While the quality of the title may be high (e.g. in the Norwegian case), the survey however shows that in most cases it is limited due to enforceability issues (ranked 4 on the scale).
Transferability: By definition, individual quotas are not transferable. Yet, available from the survey shows that in most cases, there are allowances for some degree of transferability, whether informally (e.g. in Italy) or in the short run (e.g. in Germany and Portugal). In Norway, innovative variants also allow for some forms of long run transferability (e.g. through the UQS and SQS systems). As a result, while the level of the characteristic may significantly differ across countries, information available from the survey suggests that the overall level of the characteristic can be considered as as relatively low to moderate (ranked 2-3 on the scale).
Divisibility: As the right is attached to a given, non-tradable quantity of catch, it appears difficult to divide. In principle however, at least two possible ways of dividing
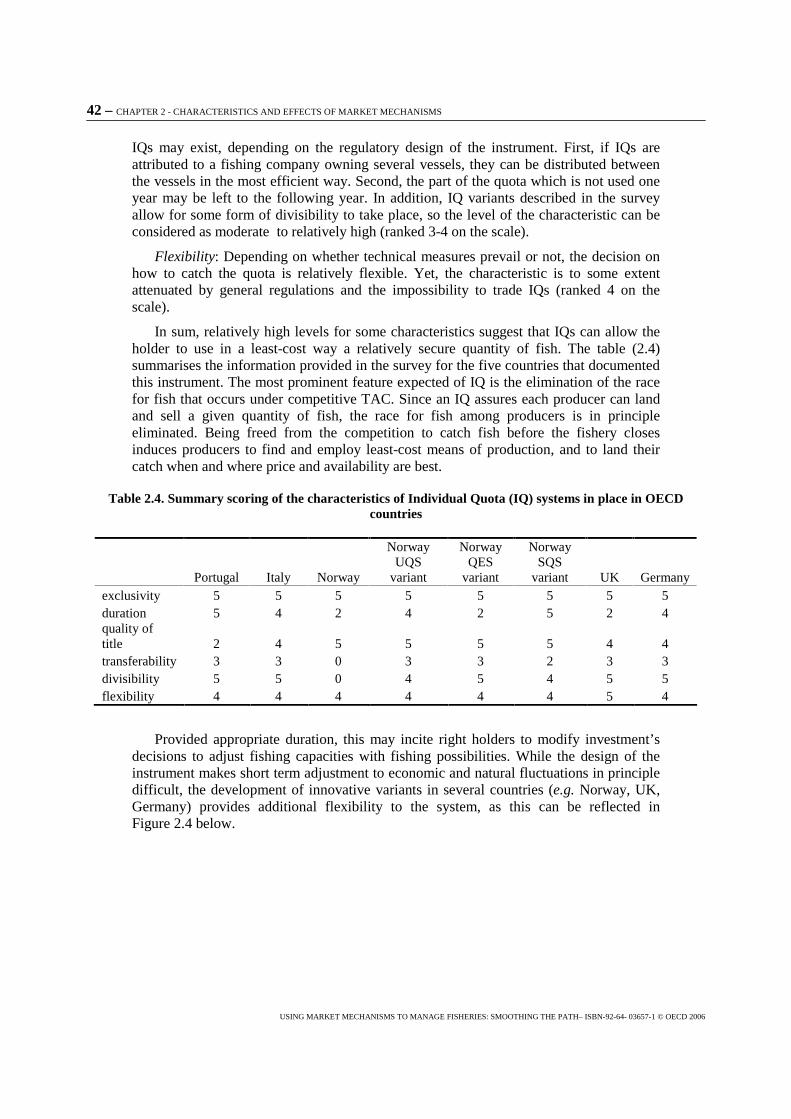
42 – CHAPTER 2 - CHARACTERISTICS AND EFFECTS OF MARKET MECHANISMS
USING MARKET MECHANISMS TO MANAGE FISHERIES: SMOOTHING THE PATH– ISBN-92-64- 03657-1 © OECD 2006
IQs may exist, depending on the regulatory design of the instrument. First, if IQs are attributed to a fishing company owning several vessels, they can be distributed between the vessels in the most efficient way. Second, the part of the quota which is not used one year may be left to the following year. In addition, IQ variants described in the survey allow for some form of divisibility to take place, so the level of the characteristic can be considered as moderate to relatively high (ranked 3-4 on the scale).
Flexibility: Depending on whether technical measures prevail or not, the decision on how to catch the quota is relatively flexible. Yet, the characteristic is to some extent attenuated by general regulations and the impossibility to trade IQs (ranked 4 on the scale).
In sum, relatively high levels for some characteristics suggest that IQs can allow the holder to use in a least-cost way a relatively secure quantity of fish. The table (2.4) summarises the information provided in the survey for the five countries that documented this instrument. The most prominent feature expected of IQ is the elimination of the race for fish that occurs under competitive TAC. Since an IQ assures each producer can land and sell a given quantity of fish, the race for fish among producers is in principle eliminated. Being freed from the competition to catch fish before the fishery closes induces producers to find and employ least-cost means of production, and to land their catch when and where price and availability are best.
Table 2.4. Summary scoring of the characteristics of Individual Quota (IQ) systems in place in OECD countries
Portugal Italy Norway
Norway UQS
variant
Norway QES
variant
Norway SQS
variant UK Germany exclusivity 5 5 5 5 5 5 5 5 duration 5 4 2 4 2 5 2 4 quality of title 2 4 5 5 5 5 4 4 transferability 3 3 0 3 3 2 3 3 divisibility 5 5 0 4 5 4 5 5 flexibility 4 4 4 4 4 4 5 4
Provided appropriate duration, this may incite right holders to modify investment’s decisions to adjust fishing capacities with fishing possibilities. While the design of the instrument makes short term adjustment to economic and natural fluctuations in principle difficult, the development of innovative variants in several countries (e.g. Norway, UK, Germany) provides additional flexibility to the system, as this can be reflected in Figure 2.4 below.
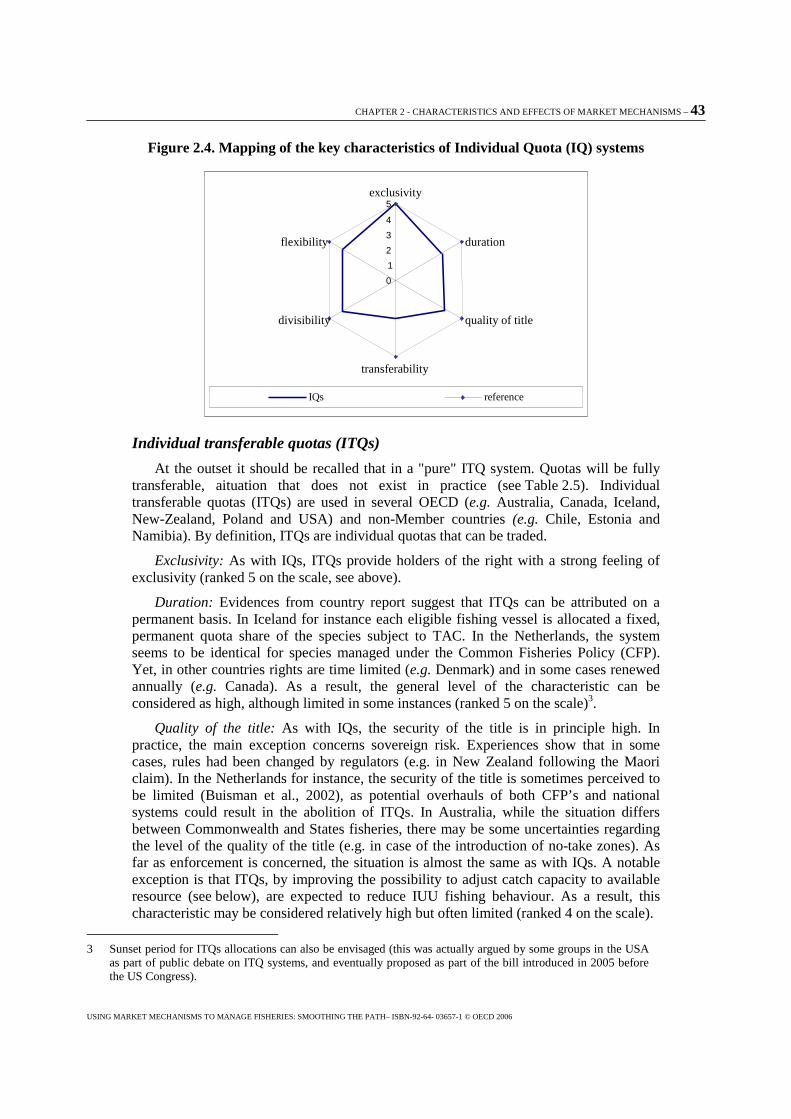
CHAPTER 2 - CHARACTERISTICS AND EFFECTS OF MARKET MECHANISMS – 43
USING MARKET MECHANISMS TO MANAGE FISHERIES: SMOOTHING THE PATH– ISBN-92-64- 03657-1 © OECD 2006
Figure 2.4. Mapping of the key characteristics of Individual Quota (IQ) systems
Individual transferable quotas (ITQs)
At the outset it should be recalled that in a "pure" ITQ system. Quotas will be fully transferable, aituation that does not exist in practice (see Table 2.5). Individual transferable quotas (ITQs) are used in several OECD (e.g. Australia, Canada, Iceland, New-Zealand, Poland and USA) and non-Member countries (e.g. Chile, Estonia and Namibia). By definition, ITQs are individual quotas that can be traded.
Exclusivity: As with IQs, ITQs provide holders of the right with a strong feeling of exclusivity (ranked 5 on the scale, see above).
Duration: Evidences from country report suggest that ITQs can be attributed on a permanent basis. In Iceland for instance each eligible fishing vessel is allocated a fixed, permanent quota share of the species subject to TAC. In the Netherlands, the system seems to be identical for species managed under the Common Fisheries Policy (CFP). Yet, in other countries rights are time limited (e.g. Denmark) and in some cases renewed annually (e.g. Canada). As a result, the general level of the characteristic can be considered as high, although limited in some instances (ranked 5 on the scale)3.
Quality of the title: As with IQs, the security of the title is in principle high. In practice, the main exception concerns sovereign risk. Experiences show that in some cases, rules had been changed by regulators (e.g. in New Zealand following the Maori claim). In the Netherlands for instance, the security of the title is sometimes perceived to be limited (Buisman et al., 2002), as potential overhauls of both CFP’s and national systems could result in the abolition of ITQs. In Australia, while the situation differs between Commonwealth and States fisheries, there may be some uncertainties regarding the level of the quality of the title (e.g. in case of the introduction of no-take zones). As far as enforcement is concerned, the situation is almost the same as with IQs. A notable exception is that ITQs, by improving the possibility to adjust catch capacity to available resource (see below), are expected to reduce IUU fishing behaviour. As a result, this characteristic may be considered relatively high but often limited (ranked 4 on the scale).
3 Sunset period for ITQs allocations can also be envisaged (this was actually argued by some groups in the USA as part of public debate on ITQ systems, and eventually proposed as part of the bill introduced in 2005 before the US Congress).
0 1 2 3 4 5
exclusivity
duration
quality of title
transferability
divisibility
flexibility
IQs reference
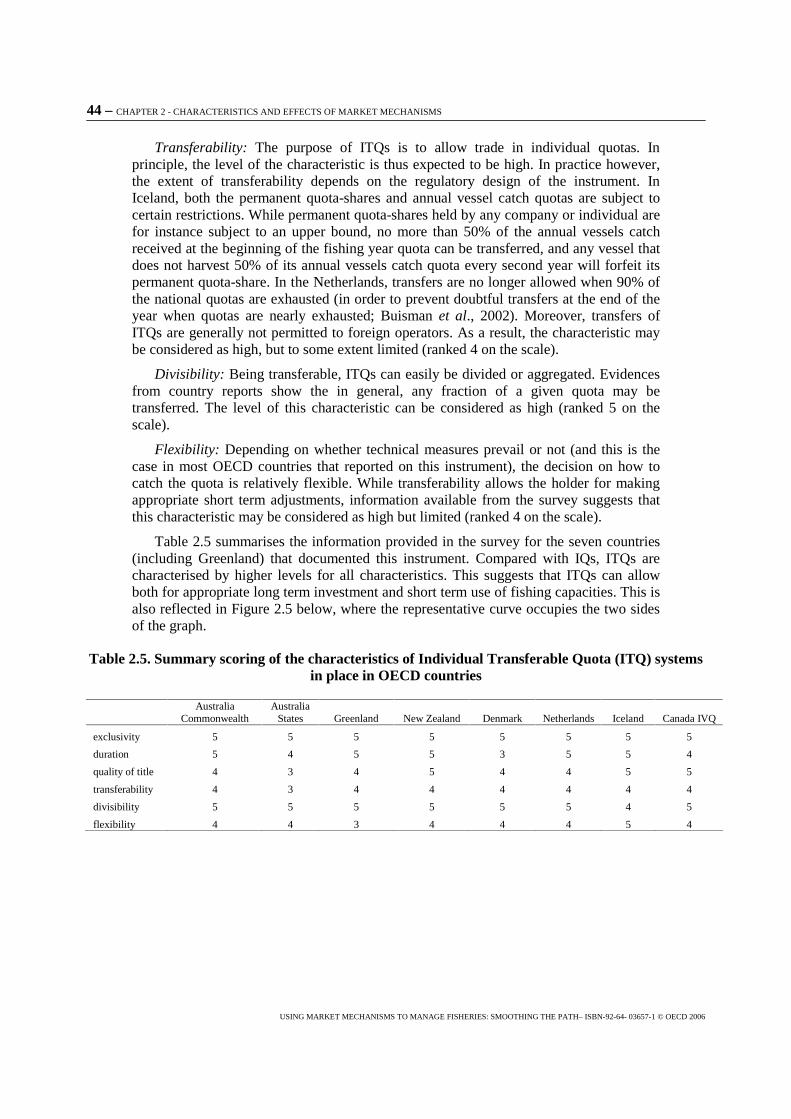
44 – CHAPTER 2 - CHARACTERISTICS AND EFFECTS OF MARKET MECHANISMS
USING MARKET MECHANISMS TO MANAGE FISHERIES: SMOOTHING THE PATH– ISBN-92-64- 03657-1 © OECD 2006
Transferability: The purpose of ITQs is to allow trade in individual quotas. In principle, the level of the characteristic is thus expected to be high. In practice however, the extent of transferability depends on the regulatory design of the instrument. In Iceland, both the permanent quota-shares and annual vessel catch quotas are subject to certain restrictions. While permanent quota-shares held by any company or individual are for instance subject to an upper bound, no more than 50% of the annual vessels catch received at the beginning of the fishing year quota can be transferred, and any vessel that does not harvest 50% of its annual vessels catch quota every second year will forfeit its permanent quota-share. In the Netherlands, transfers are no longer allowed when 90% of the national quotas are exhausted (in order to prevent doubtful transfers at the end of the year when quotas are nearly exhausted; Buisman et al., 2002). Moreover, transfers of ITQs are generally not permitted to foreign operators. As a result, the characteristic may be considered as high, but to some extent limited (ranked 4 on the scale).
Divisibility: Being transferable, ITQs can easily be divided or aggregated. Evidences from country reports show the in general, any fraction of a given quota may be transferred. The level of this characteristic can be considered as high (ranked 5 on the scale).
Flexibility: Depending on whether technical measures prevail or not (and this is the case in most OECD countries that reported on this instrument), the decision on how to catch the quota is relatively flexible. While transferability allows the holder for making appropriate short term adjustments, information available from the survey suggests that this characteristic may be considered as high but limited (ranked 4 on the scale).
Table 2.5 summarises the information provided in the survey for the seven countries (including Greenland) that documented this instrument. Compared with IQs, ITQs are characterised by higher levels for all characteristics. This suggests that ITQs can allow both for appropriate long term investment and short term use of fishing capacities. This is also reflected in Figure 2.5 below, where the representative curve occupies the two sides of the graph.
Table 2.5. Summary scoring of the characteristics of Individual Transferable Quota (ITQ) systems in place in OECD countries
Australia
Commonwealth Australia
States Greenland New Zealand Denmark Netherlands Iceland Canada IVQ
exclusivity 5 5 5 5 5 5 5 5
duration 5 4 5 5 3 5 5 4
quality of title 4 3 4 5 4 4 5 5
transferability 4 3 4 4 4 4 4 4
divisibility 5 5 5 5 5 5 4 5
flexibility 4 4 3 4 4 4 5 4
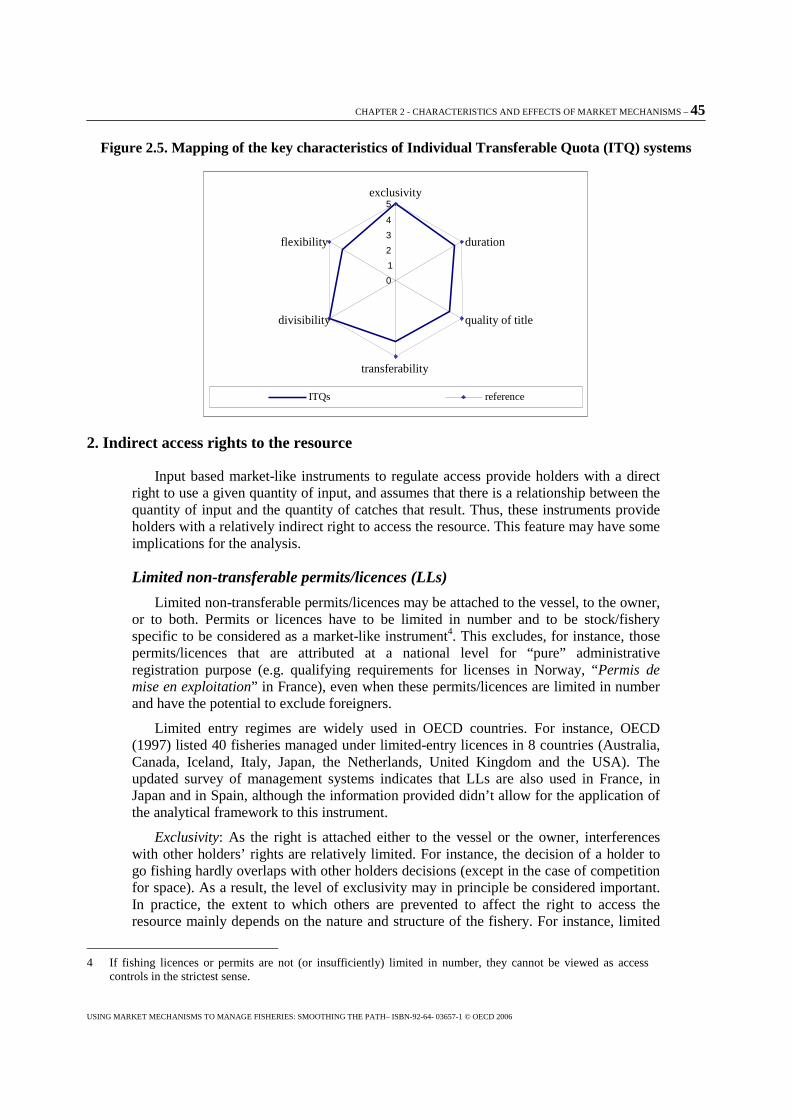
CHAPTER 2 - CHARACTERISTICS AND EFFECTS OF MARKET MECHANISMS – 45
USING MARKET MECHANISMS TO MANAGE FISHERIES: SMOOTHING THE PATH– ISBN-92-64- 03657-1 © OECD 2006
Figure 2.5. Mapping of the key characteristics of Individual Transferable Quota (ITQ) systems
2. Indirect access rights to the resource
Input based market-like instruments to regulate access provide holders with a direct right to use a given quantity of input, and assumes that there is a relationship between the quantity of input and the quantity of catches that result. Thus, these instruments provide holders with a relatively indirect right to access the resource. This feature may have some implications for the analysis.
Limited non-transferable permits/licences (LLs)
Limited non-transferable permits/licences may be attached to the vessel, to the owner, or to both. Permits or licences have to be limited in number and to be stock/fishery specific to be considered as a market-like instrument4. This excludes, for instance, those permits/licences that are attributed at a national level for “pure” administrative registration purpose (e.g. qualifying requirements for licenses in Norway, “Permis de mise en exploitation” in France), even when these permits/licences are limited in number and have the potential to exclude foreigners.
Limited entry regimes are widely used in OECD countries. For instance, OECD (1997) listed 40 fisheries managed under limited-entry licences in 8 countries (Australia, Canada, Iceland, Italy, Japan, the Netherlands, United Kingdom and the USA). The updated survey of management systems indicates that LLs are also used in France, in Japan and in Spain, although the information provided didn’t allow for the application of the analytical framework to this instrument.
Exclusivity: As the right is attached either to the vessel or the owner, interferences with other holders’ rights are relatively limited. For instance, the decision of a holder to go fishing hardly overlaps with other holders decisions (except in the case of competition for space). As a result, the level of exclusivity may in principle be considered important. In practice, the extent to which others are prevented to affect the right to access the resource mainly depends on the nature and structure of the fishery. For instance, limited
4 If fishing licences or permits are not (or insufficiently) limited in number, they cannot be viewed as access controls in the strictest sense.
0 1 2 3 4 5
exclusivity
duration
quality of title
transferability
divisibility
flexibility
ITQs reference
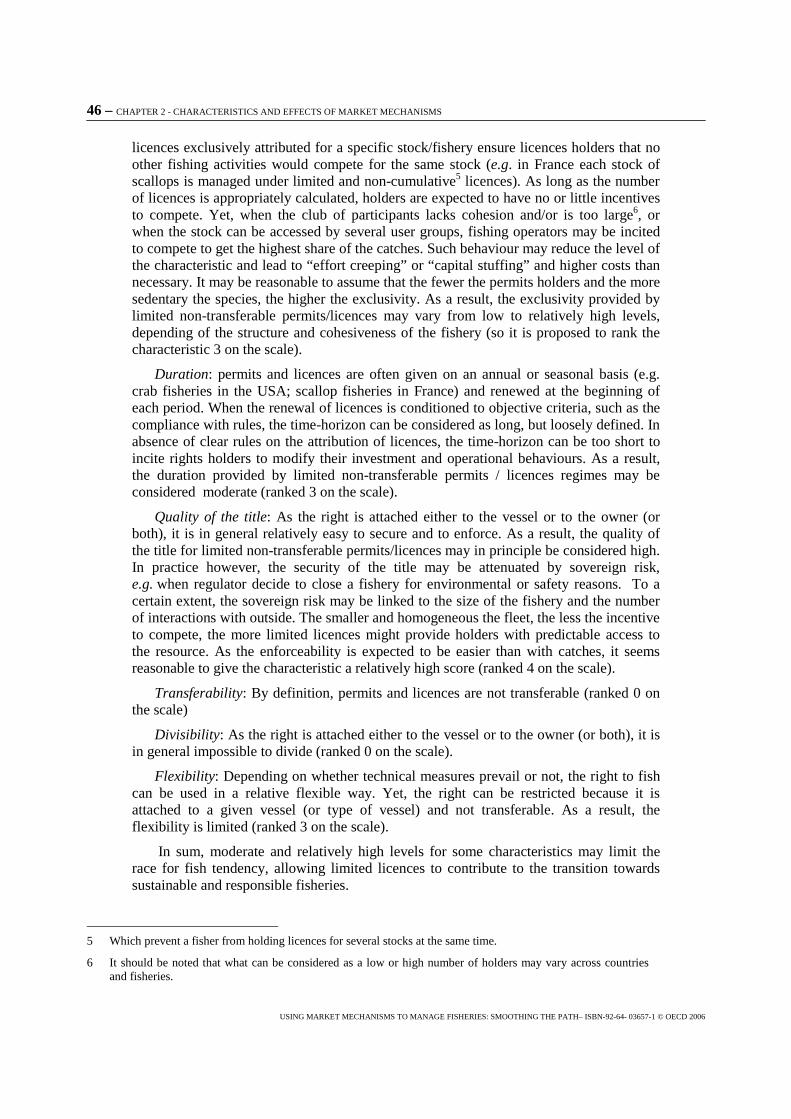
46 – CHAPTER 2 - CHARACTERISTICS AND EFFECTS OF MARKET MECHANISMS
USING MARKET MECHANISMS TO MANAGE FISHERIES: SMOOTHING THE PATH– ISBN-92-64- 03657-1 © OECD 2006
licences exclusively attributed for a specific stock/fishery ensure licences holders that no other fishing activities would compete for the same stock (e.g. in France each stock of scallops is managed under limited and non-cumulative5 licences). As long as the number of licences is appropriately calculated, holders are expected to have no or little incentives to compete. Yet, when the club of participants lacks cohesion and/or is too large6, or when the stock can be accessed by several user groups, fishing operators may be incited to compete to get the highest share of the catches. Such behaviour may reduce the level of the characteristic and lead to “effort creeping” or “capital stuffing” and higher costs than necessary. It may be reasonable to assume that the fewer the permits holders and the more sedentary the species, the higher the exclusivity. As a result, the exclusivity provided by limited non-transferable permits/licences may vary from low to relatively high levels, depending of the structure and cohesiveness of the fishery (so it is proposed to rank the characteristic 3 on the scale).
Duration: permits and licences are often given on an annual or seasonal basis (e.g. crab fisheries in the USA; scallop fisheries in France) and renewed at the beginning of each period. When the renewal of licences is conditioned to objective criteria, such as the compliance with rules, the time-horizon can be considered as long, but loosely defined. In absence of clear rules on the attribution of licences, the time-horizon can be too short to incite rights holders to modify their investment and operational behaviours. As a result, the duration provided by limited non-transferable permits / licences regimes may be considered moderate (ranked 3 on the scale).
Quality of the title: As the right is attached either to the vessel or to the owner (or both), it is in general relatively easy to secure and to enforce. As a result, the quality of the title for limited non-transferable permits/licences may in principle be considered high. In practice however, the security of the title may be attenuated by sovereign risk, e.g. when regulator decide to close a fishery for environmental or safety reasons. To a certain extent, the sovereign risk may be linked to the size of the fishery and the number of interactions with outside. The smaller and homogeneous the fleet, the less the incentive to compete, the more limited licences might provide holders with predictable access to the resource. As the enforceability is expected to be easier than with catches, it seems reasonable to give the characteristic a relatively high score (ranked 4 on the scale).
Transferability: By definition, permits and licences are not transferable (ranked 0 on the scale)
Divisibility: As the right is attached either to the vessel or to the owner (or both), it is in general impossible to divide (ranked 0 on the scale).
Flexibility: Depending on whether technical measures prevail or not, the right to fish can be used in a relative flexible way. Yet, the right can be restricted because it is attached to a given vessel (or type of vessel) and not transferable. As a result, the flexibility is limited (ranked 3 on the scale).
In sum, moderate and relatively high levels for some characteristics may limit the race for fish tendency, allowing limited licences to contribute to the transition towards sustainable and responsible fisheries.
5 Which prevent a fisher from holding licences for several stocks at the same time.
6 It should be noted that what can be considered as a low or high number of holders may vary across countries and fisheries.
CHAPTER 2 - CHARACTERISTICS AND EFFECTS OF MARKET MECHANISMS – 47
USING MARKET MECHANISMS TO MANAGE FISHERIES: SMOOTHING THE PATH– ISBN-92-64- 03657-1 © OECD 2006
By allocating a limited number of non-transferable fishing licences to vessels authorised to harvest a specific stock, such a mechanism is expected to prevent the rent dissipation by forbidding “excess” vessels to access a specific stock even if they would have be incited to do so in the absence of regulations. By doing so, it also incites “insiders” or “club members” to reduce the race for fish.
Yet, the situation mainly depends on the size of the industry, and low levels for some characteristics (namely transferability and divisibility) may limit the optimal use of exiting fishing capacities. This can be reflected in Figure 2.6 below, where the representative curve is located on the northeast side of the graph.
Figure 2.6. Mapping of the key characteristics of limited licences (LL) systems
Limited transferable licences (LTLs)
Consider now those licences that can be traded. As previously, tradable licences can be attached to the vessel, to the owner, or to both. Updates of fisheries management systems show that some forms of transferable licences are used in Mexico and in the United Kingdom. In some instance, “quasi-transferable” licences systems have been observed (e.g. in the case of implicit tradability as in Norway and in France).
Exclusivity: Limited licences, whether transferable or not, have some potential to exclude outsiders. The level of exclusivity obtained by the holder may in principle be considered high, although restricted by internal and external competition in some instances. Yet, transferable licences may have an advantage on LLs with respect to this latter limitation. By improving the adaptability to economic and environmental changes (see below), transferable licences are expected to facilitate the fleet adjustment and to reduce competition tendency. Information available from the survey tends to support these statements, so the level of the characteristic can be considered as high but to a certain extent limited (ranked 3-4 in the scale).
Duration: Available examples suggest that transferable licences may be attributed on a medium/long term basis (e.g. up to 20 years in Mexico for extraction) and sometimes in perpetuity (e.g. in the United Kingdom). As a result, the characteristic can be considered as relatively high (ranked 5 in the scale).
0 1 2 3 4 5
exclusivity
duration
quality of title
transferability
divisibility
flexibility
LLs reference
48 – CHAPTER 2 - CHARACTERISTICS AND EFFECTS OF MARKET MECHANISMS
USING MARKET MECHANISMS TO MANAGE FISHERIES: SMOOTHING THE PATH– ISBN-92-64- 03657-1 © OECD 2006
Quality of the title: As with LLs, the level of the characteristic for transferable licences is in principle relatively high. Evidences from the survey in addition suggest that transferability has positive effects in reducing the incentives to circumvent the rules, because operators can adjust more easily. The level of the characteristic can be considered as high (ranked 5 on the scale).
Transferability: The purpose of LTLs is to allow trade in individual licences. In principle, the level of the characteristic is thus expected to be high. In practice however the extent of transferability depends on the regulatory design of the instrument. In Mexico, concessions for extraction are fully transferable, while in the UK some restrictions exist to avoid concentration and foreign ownership. In Norway, licenses as such are not transferable, but are implicitly transferable together with the vessel. As a result, this characteristic can be considered as high, but to some extent limited (ranked 4 on the scale).
Divisibility: In general, licences can not be divided (ranked 0 on the scale).
Flexibility: Transferable licences increase the level of flexibility, as they allow the owner to decide whether using its right or leasing it. As the choice however remains restricted, the level of the characteristic can be considered as high but limited (ranked 4 on the scale).
Compared to limited licences (LLs), transferable licences are characterised by higher levels for most of the characteristics. Table 2.6 summarises the information provided in the survey for the two countries that documented this instrument. In particular, long term adjustment to economic conditions is expected to be facilitated.
Table 2.6. Summary scoring of the characteristics of Limited Transferable Licences (LTL) systems in place in OECD countries
Norway UK exclusivity 4 3 duration 5 5 quality of title 5 5 transferability 4 4 divisibility 0 0 flexibility 3 3
While this suggests that LTLs can better contribute than LLs to the transition towards sustainable and responsible fisheries, it should yet be noted that the absence of divisibility restricts the possibilities to realise short term adjustments to economic and natural fluctuations. This can be reflected in Figure 2.7 below.
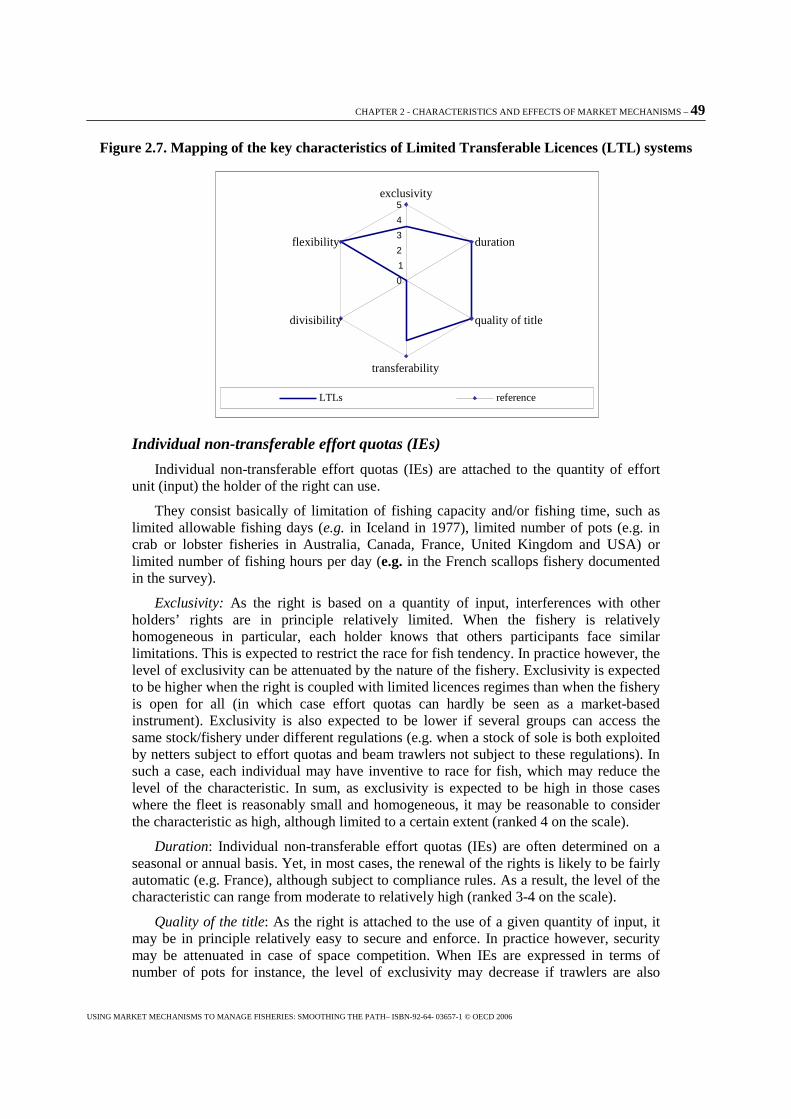
CHAPTER 2 - CHARACTERISTICS AND EFFECTS OF MARKET MECHANISMS – 49
USING MARKET MECHANISMS TO MANAGE FISHERIES: SMOOTHING THE PATH– ISBN-92-64- 03657-1 © OECD 2006
Figure 2.7. Mapping of the key characteristics of Limited Transferable Licences (LTL) systems
Individual non-transferable effort quotas (IEs)
Individual non-transferable effort quotas (IEs) are attached to the quantity of effort unit (input) the holder of the right can use.
They consist basically of limitation of fishing capacity and/or fishing time, such as limited allowable fishing days (e.g. in Iceland in 1977), limited number of pots (e.g. in crab or lobster fisheries in Australia, Canada, France, United Kingdom and USA) or limited number of fishing hours per day (e.g. in the French scallops fishery documented in the survey).
Exclusivity: As the right is based on a quantity of input, interferences with other holders’ rights are in principle relatively limited. When the fishery is relatively homogeneous in particular, each holder knows that others participants face similar limitations. This is expected to restrict the race for fish tendency. In practice however, the level of exclusivity can be attenuated by the nature of the fishery. Exclusivity is expected to be higher when the right is coupled with limited licences regimes than when the fishery is open for all (in which case effort quotas can hardly be seen as a market-based instrument). Exclusivity is also expected to be lower if several groups can access the same stock/fishery under different regulations (e.g. when a stock of sole is both exploited by netters subject to effort quotas and beam trawlers not subject to these regulations). In such a case, each individual may have inventive to race for fish, which may reduce the level of the characteristic. In sum, as exclusivity is expected to be high in those cases where the fleet is reasonably small and homogeneous, it may be reasonable to consider the characteristic as high, although limited to a certain extent (ranked 4 on the scale).
Duration: Individual non-transferable effort quotas (IEs) are often determined on a seasonal or annual basis. Yet, in most cases, the renewal of the rights is likely to be fairly automatic (e.g. France), although subject to compliance rules. As a result, the level of the characteristic can range from moderate to relatively high (ranked 3-4 on the scale).
Quality of the title: As the right is attached to the use of a given quantity of input, it may be in principle relatively easy to secure and enforce. In practice however, security may be attenuated in case of space competition. When IEs are expressed in terms of number of pots for instance, the level of exclusivity may decrease if trawlers are also
0 1 2 3 4 5
exclusivity
duration
quality of title
transferability
divisibility
flexibility
LTLs reference
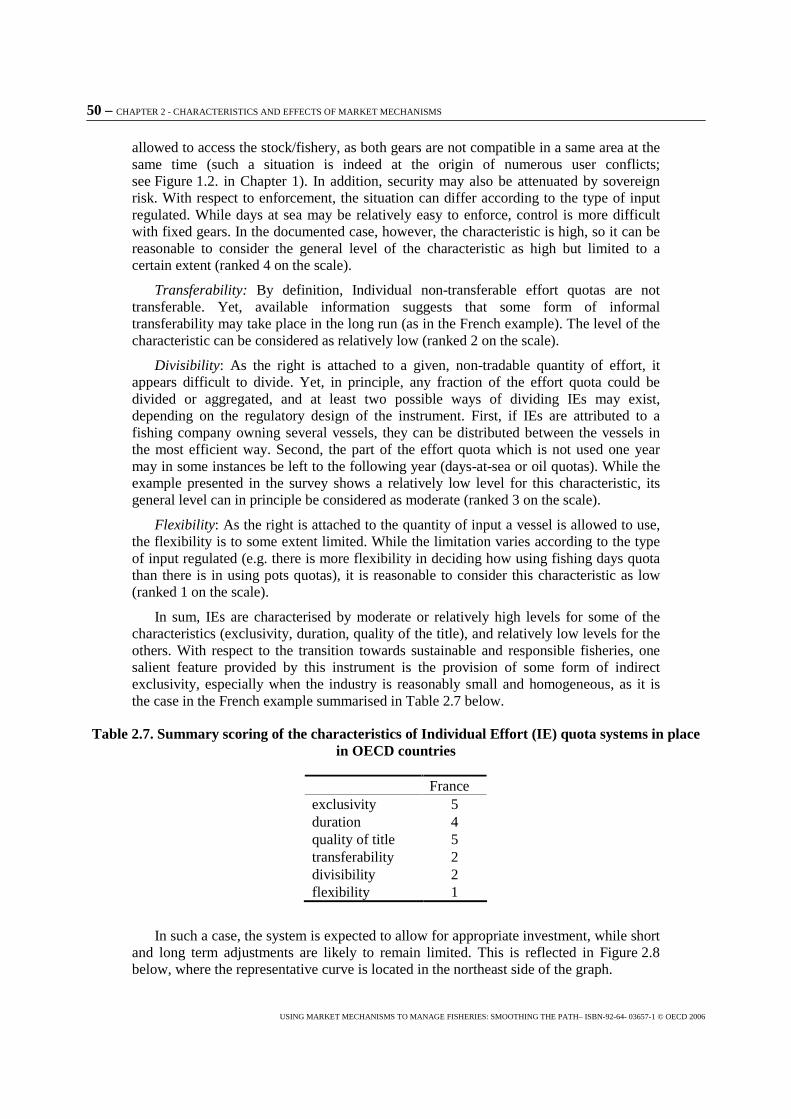
50 – CHAPTER 2 - CHARACTERISTICS AND EFFECTS OF MARKET MECHANISMS
USING MARKET MECHANISMS TO MANAGE FISHERIES: SMOOTHING THE PATH– ISBN-92-64- 03657-1 © OECD 2006
allowed to access the stock/fishery, as both gears are not compatible in a same area at the same time (such a situation is indeed at the origin of numerous user conflicts; see Figure 1.2. in Chapter 1). In addition, security may also be attenuated by sovereign risk. With respect to enforcement, the situation can differ according to the type of input regulated. While days at sea may be relatively easy to enforce, control is more difficult with fixed gears. In the documented case, however, the characteristic is high, so it can be reasonable to consider the general level of the characteristic as high but limited to a certain extent (ranked 4 on the scale).
Transferability: By definition, Individual non-transferable effort quotas are not transferable. Yet, available information suggests that some form of informal transferability may take place in the long run (as in the French example). The level of the characteristic can be considered as relatively low (ranked 2 on the scale).
Divisibility: As the right is attached to a given, non-tradable quantity of effort, it appears difficult to divide. Yet, in principle, any fraction of the effort quota could be divided or aggregated, and at least two possible ways of dividing IEs may exist, depending on the regulatory design of the instrument. First, if IEs are attributed to a fishing company owning several vessels, they can be distributed between the vessels in the most efficient way. Second, the part of the effort quota which is not used one year may in some instances be left to the following year (days-at-sea or oil quotas). While the example presented in the survey shows a relatively low level for this characteristic, its general level can in principle be considered as moderate (ranked 3 on the scale).
Flexibility: As the right is attached to the quantity of input a vessel is allowed to use, the flexibility is to some extent limited. While the limitation varies according to the type of input regulated (e.g. there is more flexibility in deciding how using fishing days quota than there is in using pots quotas), it is reasonable to consider this characteristic as low (ranked 1 on the scale).
In sum, IEs are characterised by moderate or relatively high levels for some of the characteristics (exclusivity, duration, quality of the title), and relatively low levels for the others. With respect to the transition towards sustainable and responsible fisheries, one salient feature provided by this instrument is the provision of some form of indirect exclusivity, especially when the industry is reasonably small and homogeneous, as it is the case in the French example summarised in Table 2.7 below.
Table 2.7. Summary scoring of the characteristics of Individual Effort (IE) quota systems in place in OECD countries
France exclusivity 5 duration 4 quality of title 5 transferability 2 divisibility 2 flexibility 1
In such a case, the system is expected to allow for appropriate investment, while short and long term adjustments are likely to remain limited. This is reflected in Figure 2.8 below, where the representative curve is located in the northeast side of the graph.
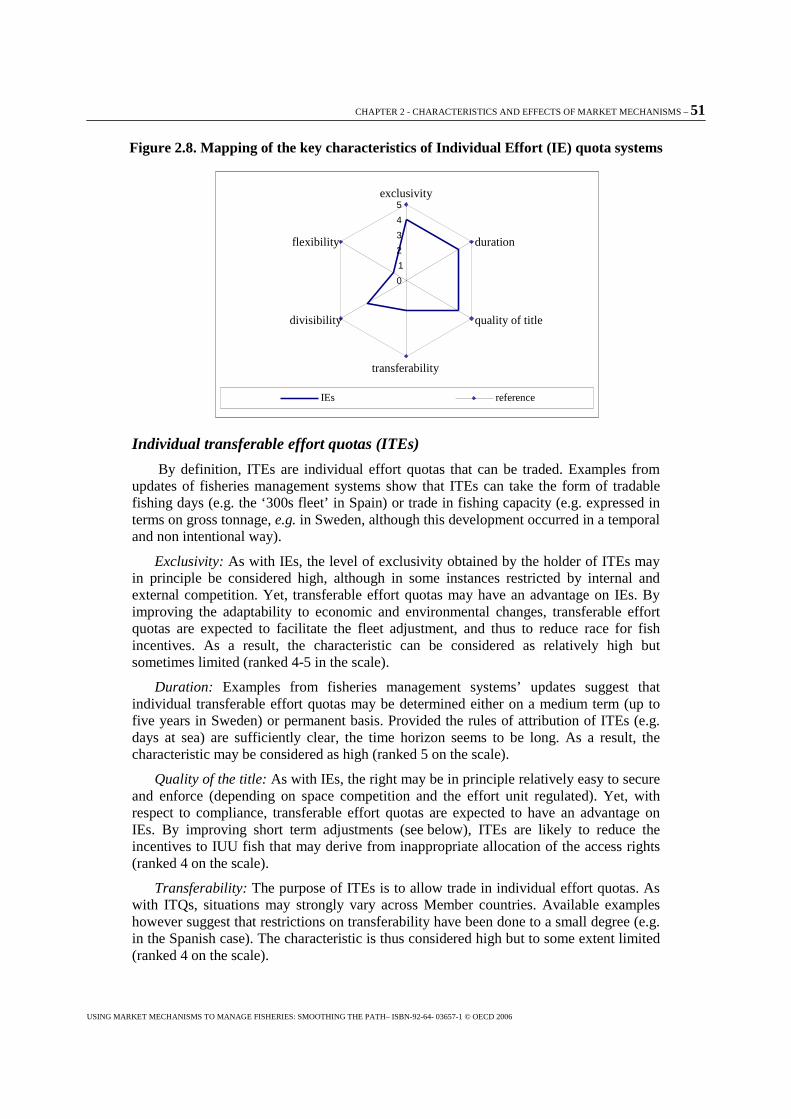
CHAPTER 2 - CHARACTERISTICS AND EFFECTS OF MARKET MECHANISMS – 51
USING MARKET MECHANISMS TO MANAGE FISHERIES: SMOOTHING THE PATH– ISBN-92-64- 03657-1 © OECD 2006
Figure 2.8. Mapping of the key characteristics of Individual Effort (IE) quota systems
Individual transferable effort quotas (ITEs)
By definition, ITEs are individual effort quotas that can be traded. Examples from updates of fisheries management systems show that ITEs can take the form of tradable fishing days (e.g. the ‘300s fleet’ in Spain) or trade in fishing capacity (e.g. expressed in terms on gross tonnage, e.g. in Sweden, although this development occurred in a temporal and non intentional way).
Exclusivity: As with IEs, the level of exclusivity obtained by the holder of ITEs may in principle be considered high, although in some instances restricted by internal and external competition. Yet, transferable effort quotas may have an advantage on IEs. By improving the adaptability to economic and environmental changes, transferable effort quotas are expected to facilitate the fleet adjustment, and thus to reduce race for fish incentives. As a result, the characteristic can be considered as relatively high but sometimes limited (ranked 4-5 in the scale).
Duration: Examples from fisheries management systems’ updates suggest that individual transferable effort quotas may be determined either on a medium term (up to five years in Sweden) or permanent basis. Provided the rules of attribution of ITEs (e.g. days at sea) are sufficiently clear, the time horizon seems to be long. As a result, the characteristic may be considered as high (ranked 5 on the scale).
Quality of the title: As with IEs, the right may be in principle relatively easy to secure and enforce (depending on space competition and the effort unit regulated). Yet, with respect to compliance, transferable effort quotas are expected to have an advantage on IEs. By improving short term adjustments (see below), ITEs are likely to reduce the incentives to IUU fish that may derive from inappropriate allocation of the access rights (ranked 4 on the scale).
Transferability: The purpose of ITEs is to allow trade in individual effort quotas. As with ITQs, situations may strongly vary across Member countries. Available examples however suggest that restrictions on transferability have been done to a small degree (e.g. in the Spanish case). The characteristic is thus considered high but to some extent limited (ranked 4 on the scale).
0 1 2 3 4 5
exclusivity
duration
quality of title
transferability
divisibility
flexibility
IEs reference
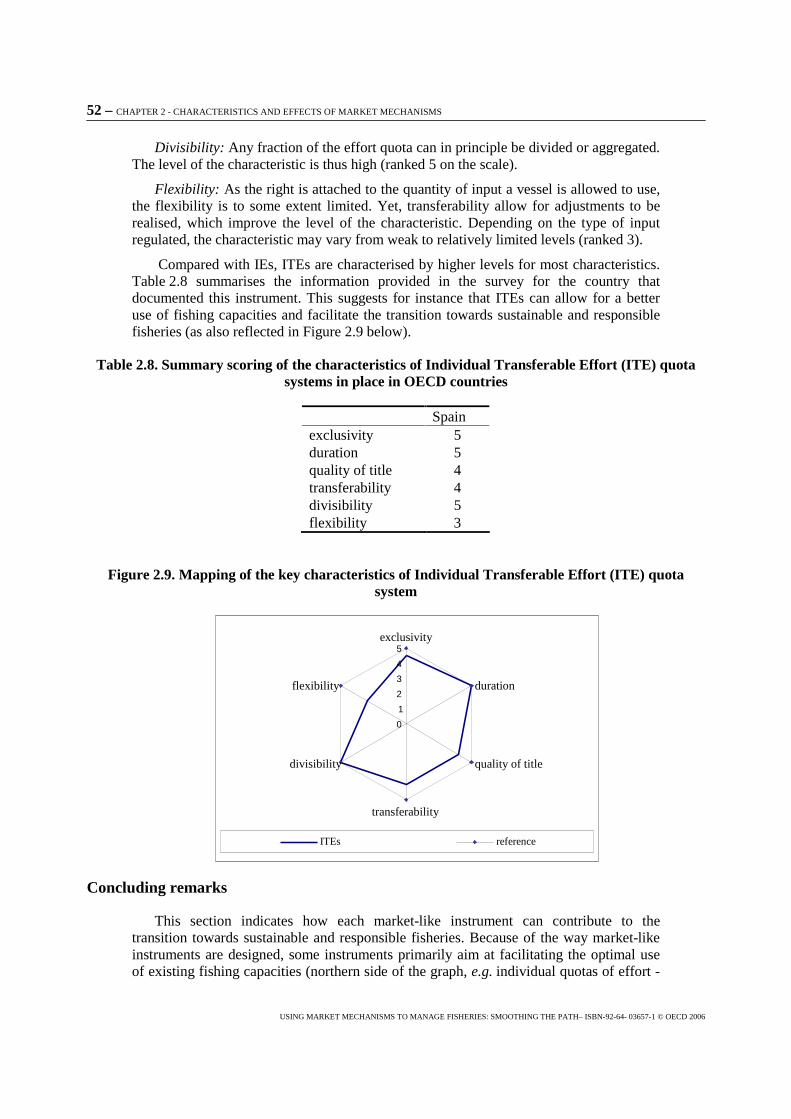
52 – CHAPTER 2 - CHARACTERISTICS AND EFFECTS OF MARKET MECHANISMS
USING MARKET MECHANISMS TO MANAGE FISHERIES: SMOOTHING THE PATH– ISBN-92-64- 03657-1 © OECD 2006
Divisibility: Any fraction of the effort quota can in principle be divided or aggregated. The level of the characteristic is thus high (ranked 5 on the scale).
Flexibility: As the right is attached to the quantity of input a vessel is allowed to use, the flexibility is to some extent limited. Yet, transferability allow for adjustments to be realised, which improve the level of the characteristic. Depending on the type of input regulated, the characteristic may vary from weak to relatively limited levels (ranked 3).
Compared with IEs, ITEs are characterised by higher levels for most characteristics. Table 2.8 summarises the information provided in the survey for the country that documented this instrument. This suggests for instance that ITEs can allow for a better use of fishing capacities and facilitate the transition towards sustainable and responsible fisheries (as also reflected in Figure 2.9 below).
Table 2.8. Summary scoring of the characteristics of Individual Transferable Effort (ITE) quota systems in place in OECD countries
Spain exclusivity 5 duration 5 quality of title 4 transferability 4 divisibility 5 flexibility 3
Figure 2.9. Mapping of the key characteristics of Individual Transferable Effort (ITE) quota system
Concluding remarks
This section indicates how each market-like instrument can contribute to the transition towards sustainable and responsible fisheries. Because of the way market-like instruments are designed, some instruments primarily aim at facilitating the optimal use of existing fishing capacities (northern side of the graph, e.g. individual quotas of effort -
0 1 2 3 4 5
exclusivity
duration
quality of title
transferability
divisibility
flexibility
ITEs reference
CHAPTER 2 - CHARACTERISTICS AND EFFECTS OF MARKET MECHANISMS – 53
USING MARKET MECHANISMS TO MANAGE FISHERIES: SMOOTHING THE PATH– ISBN-92-64- 03657-1 © OECD 2006
IE - and catches -IQ). Other instruments are more likely to allow for the short term adjustment to biological and economic variations (left side of the mapping, e.g. community quotas and to a certain extent some vessel catch limit systems). Other instruments are especially designed to facilitate long term adjustment and appropriate investment (right side of the mapping, e.g. TURF, individual quotas of effort (ITE) and catches (ITQ) and limited transferable licences).
It should however be noted that the expected characteristics of most market-like instruments are situation dependant. In most of fisheries managed with input regulations (e.g. individual effort quota, whether transferable or not - IE, ITE; transferable licences), the outcomes of the management system depend on the size and structure of the industry. While in the examples documented in the Study the levels of most characteristics are relatively high, this may not be always the case.
On the other hand, fisheries managed through output regulations (e.g. IQ and ITQ) may face situations that are likely to undermine some of the expected characteristics. For example, discarding, highgrading and underreporting are frequently pointed out in the case of ITQ systems (e.g. OECD, 1997). When such phenomena occur, this may have negative effects on stock assessments and reduce the expected level of the quality of the title. Although ITQ systems in general mark relatively high score at the property right characteristics, their overall effectiveness may thus be attenuated in some cases.
More generally, all market-like instruments can be affected by the “international quality of the title”7. This means that when stocks are shared by several parties, the level of the quality of the title partly depends on the level and effectiveness of cooperation between parties. In the case of the EU for instance, it was suggested in the survey that the level of the characteristic provided by national management scheme (e.g. ITQ in the Netherlands, vessel catch limits in France) can be attenuated by the actions of outsiders from other parties. Similar situations are also likely to apply to most of the areas managed under RFMOs (e.g. NAFO, NEAFC). In cases where the level of international cooperation is low, i.e. when operators from an external party can access a fishery regulated by a market-like instruments (IUU fishing), two types of problems can arise. First, the so called sovereign risk in the country regulating the fishery can increase (e.g. a fishery can be closed before the quotas are exhausted because of suspected IUU catches). Second, this may have negative effects on the compliance behaviours of rights holders facing “unfair” competition.
7 For some fisheries the issue at stake is of high importance. While the information submitted to this Study has not allowed for a fully detailed examination of the “international quality of the title”, this issue could be subject to further exploration as part of a future programme of work of the Committee.
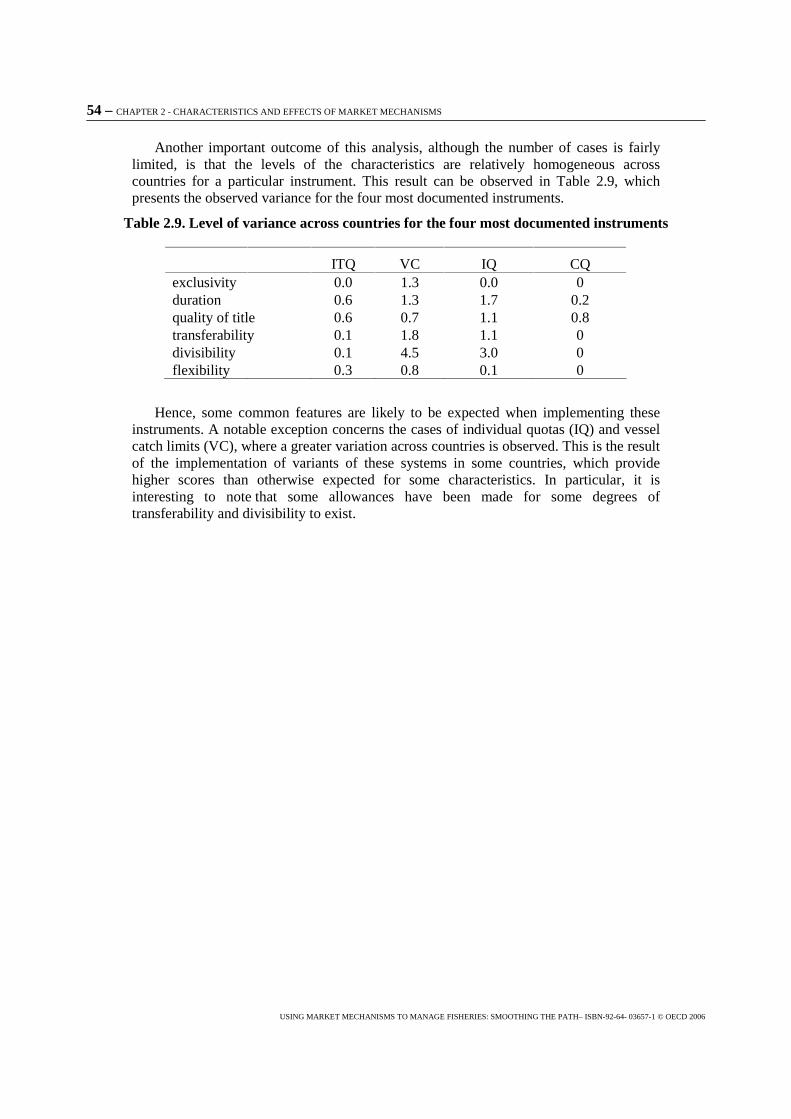
54 – CHAPTER 2 - CHARACTERISTICS AND EFFECTS OF MARKET MECHANISMS
USING MARKET MECHANISMS TO MANAGE FISHERIES: SMOOTHING THE PATH– ISBN-92-64- 03657-1 © OECD 2006
Another important outcome of this analysis, although the number of cases is fairly limited, is that the levels of the characteristics are relatively homogeneous across countries for a particular instrument. This result can be observed in Table 2.9, which presents the observed variance for the four most documented instruments.
Table 2.9. Level of variance across countries for the four most documented instruments
ITQ VC IQ CQ exclusivity 0.0 1.3 0.0 0 duration 0.6 1.3 1.7 0.2 quality of title 0.6 0.7 1.1 0.8 transferability 0.1 1.8 1.1 0 divisibility 0.1 4.5 3.0 0 flexibility 0.3 0.8 0.1 0
Hence, some common features are likely to be expected when implementing these instruments. A notable exception concerns the cases of individual quotas (IQ) and vessel catch limits (VC), where a greater variation across countries is observed. This is the result of the implementation of variants of these systems in some countries, which provide higher scores than otherwise expected for some characteristics. In particular, it is interesting to note that some allowances have been made for some degrees of transferability and divisibility to exist.
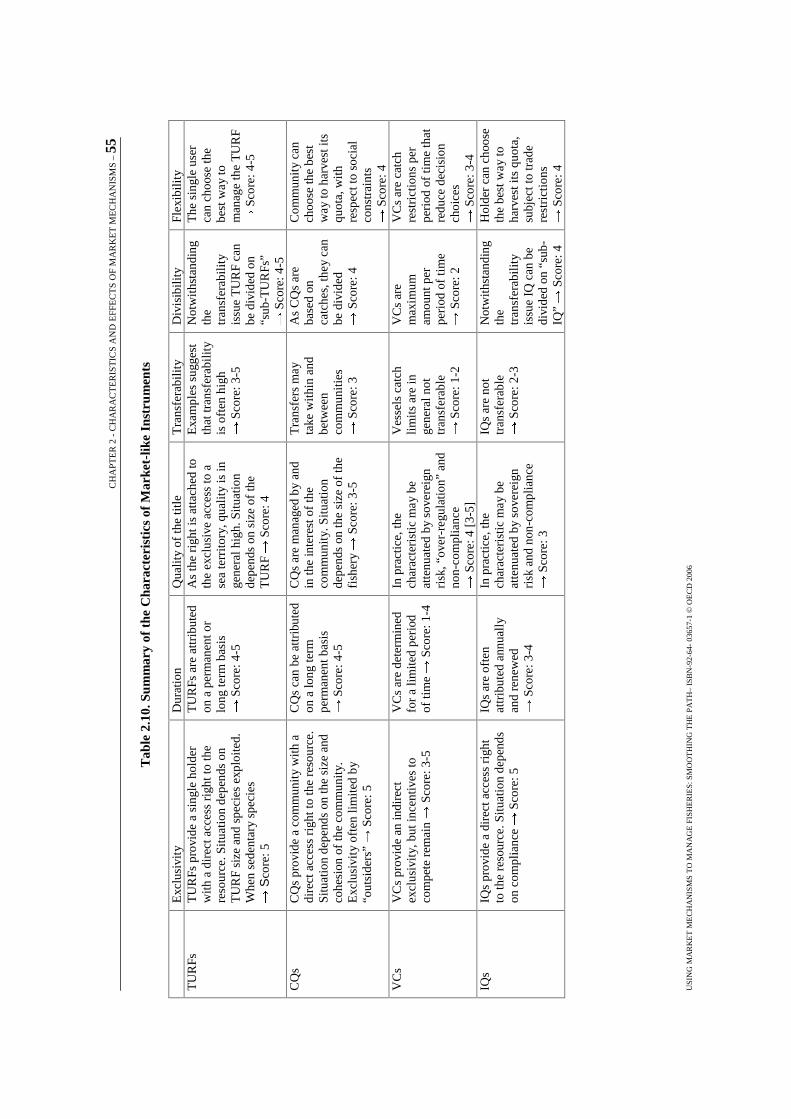
CH
APT
ER
2 -
CH
AR
AC
TE
RIS
TIC
S A
ND
EFF
EC
TS
OF
MA
RK
ET
ME
CH
AN
ISM
S – 55
U
SIN
G M
AR
KE
T M
EC
HA
NIS
MS
TO
MA
NA
GE
FIS
HE
RIE
S: S
MO
OT
HIN
G T
HE
PA
TH
– IS
BN
-92-
64-
0365
7-1
© O
EC
D 2
006
Tab
le 2
.10.
Sum
mar
y of
the
Cha
ract
eris
tics
of
Mar
ket-
like
Inst
rum
ents
E
xclu
sivi
ty
Dur
atio
n
Qua
lity
of th
e tit
le
Tra
nsfe
rabi
lity
Div
isib
ility
Fl
exib
ility
T
UR
Fs
TU
RFs
pro
vide
a s
ingl
e ho
lder
w
ith a
dir
ect a
cces
s ri
ght t
o th
e re
sour
ce. S
ituat
ion
depe
nds
on
TU
RF
size
and
spe
cies
exp
loite
d.
Whe
n se
dent
ary
spec
ies
Sco
re: 5
TU
RFs
are
attr
ibut
ed
on a
per
man
ent o
r lo
ng te
rm b
asis
S
core
: 4-5
As
the
righ
t is
atta
ched
to
the
excl
usiv
e ac
cess
to a
se
a te
rrito
ry, q
ualit
y is
in
gene
ral h
igh.
Situ
atio
n de
pend
s on
siz
e of
the
TU
RF
Sco
re: 4
Exa
mpl
es s
ugge
st
that
tran
sfer
abili
ty
is o
ften
hig
h S
core
: 3-5
Not
with
stan
ding
th
e tr
ansf
erab
ility
is
sue
TU
RF
can
be d
ivid
ed o
n “s
ub-T
UR
Fs”
Sco
re: 4
-5
The
sin
gle
user
ca
n ch
oose
the
best
way
to
man
age
the
TU
RF
Sco
re: 4
-5
CQ
s C
Qs
prov
ide
a co
mm
unit
y w
ith a
di
rect
acc
ess
righ
t to
the
reso
urce
. Si
tuat
ion
depe
nds
on th
e si
ze a
nd
cohe
sion
of
the
com
mun
ity.
E
xclu
sivi
ty o
ften
lim
ited
by
“out
side
rs”
�Sco
re: 5
CQ
s ca
n be
attr
ibut
ed
on a
long
term
pe
rman
ent b
asis
S
core
: 4-5
CQ
s ar
e m
anag
ed b
y an
d in
the
inte
rest
of
the
com
mun
ity.
Situ
atio
n de
pend
s on
the
size
of
the
fish
ery
Sco
re: 3
-5
Tra
nsfe
rs m
ay
take
with
in a
nd
betw
een
com
mun
ities
S
core
: 3
As
CQ
s ar
e ba
sed
on
catc
hes,
they
can
be
div
ided
S
core
: 4
Com
mun
ity
can
choo
se th
e be
st
way
to h
arve
st it
s qu
ota,
with
re
spec
t to
soci
al
cons
trai
nts
Sco
re: 4
V
Cs
VC
s pr
ovid
e an
indi
rect
ex
clus
ivit
y, b
ut in
cent
ives
to
com
pete
rem
ain
Sco
re: 3
-5
VC
s ar
e de
term
ined
fo
r a
limite
d pe
riod
of
tim
e S
core
: 1-4
In p
ract
ice,
the
char
acte
rist
ic m
ay b
e at
tenu
ated
by
sove
reig
n ri
sk, “
over
-reg
ulat
ion”
and
no
n-co
mpl
ianc
e S
core
: 4 [
3-5]
Ves
sels
cat
ch
limits
are
in
gene
ral n
ot
tran
sfer
able
S
core
: 1-2
VC
s ar
e m
axim
um
amou
nt p
er
peri
od o
f tim
e S
core
: 2
VC
s ar
e ca
tch
rest
rict
ions
per
pe
riod
of
time
that
re
duce
dec
isio
n ch
oice
s S
core
: 3-4
IQ
s IQ
s pr
ovid
e a
dire
ct a
cces
s ri
ght
to th
e re
sour
ce. S
ituat
ion
depe
nds
on c
ompl
ianc
e S
core
: 5
IQs
are
ofte
n at
trib
uted
ann
uall
y an
d re
new
ed
Sco
re: 3
-4
In p
ract
ice,
the
char
acte
rist
ic m
ay b
e at
tenu
ated
by
sove
reig
n ri
sk a
nd n
on-c
ompl
ianc
e S
core
: 3
IQs
are
not
tran
sfer
able
S
core
: 2-3
Not
with
stan
ding
th
e tr
ansf
erab
ility
is
sue
IQ c
an b
e di
vide
d on
“su
b-IQ
” S
core
: 4
Hol
der
can
choo
se
the
best
way
to
harv
est i
ts q
uota
, su
bjec
t to
trad
e re
stri
ctio
ns
Sco
re: 4
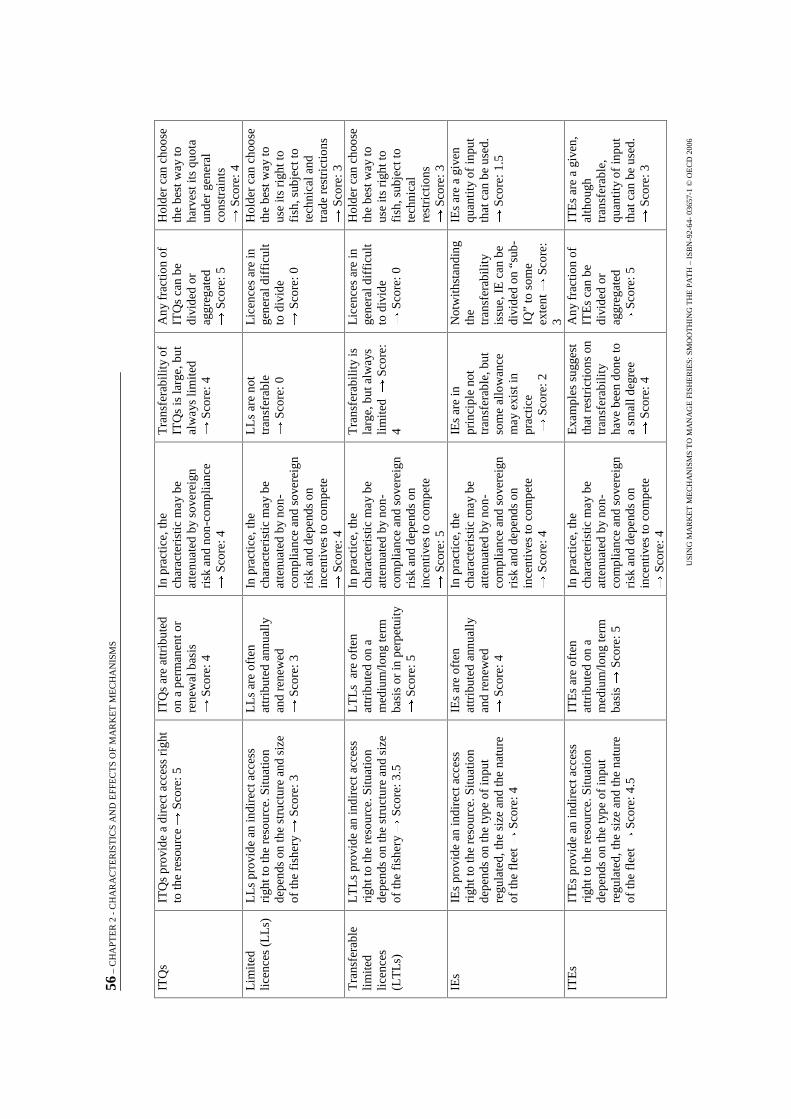
56 –
CH
APT
ER
2 -
CH
AR
AC
TE
RIS
TIC
S A
ND
EFF
EC
TS
OF
MA
RK
ET
ME
CH
AN
ISM
S
USI
NG
MA
RK
ET
ME
CH
AN
ISM
S T
O M
AN
AG
E F
ISH
ER
IES:
SM
OO
TH
ING
TH
E P
AT
H –
IS
BN
-92-
64-
0365
7-1
© O
EC
D 2
006
ITQ
s IT
Qs
prov
ide
a di
rect
acc
ess
righ
t to
the
reso
urce
S
core
: 5
ITQ
s ar
e at
trib
uted
on
a p
erm
anen
t or
rene
wal
bas
is
Sco
re: 4
In p
ract
ice,
the
char
acte
rist
ic m
ay b
e at
tenu
ated
by
sove
reig
n ri
sk a
nd n
on-c
ompl
ianc
e S
core
: 4
Tra
nsfe
rabi
lity
of
ITQ
s is
larg
e, b
ut
alw
ays
limite
d
Sco
re: 4
Any
fra
ctio
n of
IT
Qs
can
be
divi
ded
or
aggr
egat
ed
Sco
re: 5
Hol
der
can
choo
se
the
best
way
to
harv
est i
ts q
uota
un
der
gene
ral
cons
trai
nts
Sco
re: 4
L
imite
d lic
ence
s (L
Ls)
L
Ls
prov
ide
an in
dire
ct a
cces
s ri
ght t
o th
e re
sour
ce. S
ituat
ion
depe
nds
on th
e st
ruct
ure
and
size
of
the
fish
ery
Sco
re: 3
LL
s ar
e of
ten
attr
ibut
ed a
nnua
lly
and
rene
wed
S
core
: 3
In p
ract
ice,
the
char
acte
rist
ic m
ay b
e at
tenu
ated
by
non-
com
plia
nce
and
sove
reig
n ri
sk a
nd d
epen
ds o
n in
cent
ives
to c
ompe
te
Sco
re: 4
LL
s ar
e no
t tr
ansf
erab
le
Sco
re: 0
Lic
ence
s ar
e in
ge
nera
l dif
ficu
lt to
div
ide
Sco
re: 0
Hol
der
can
choo
se
the
best
way
to
use
its r
ight
to
fish
, sub
ject
to
tech
nica
l and
tr
ade
rest
rict
ions
S
core
: 3
Tra
nsfe
rabl
e lim
ited
licen
ces
(LT
Ls)
LT
Ls
prov
ide
an in
dire
ct a
cces
s ri
ght t
o th
e re
sour
ce. S
ituat
ion
depe
nds
on th
e st
ruct
ure
and
size
of
the
fish
ery
Sco
re: 3
.5
LT
Ls
are
oft
en
attr
ibut
ed o
n a
med
ium
/long
term
ba
sis
or in
per
petu
ity
Sco
re: 5
In p
ract
ice,
the
char
acte
rist
ic m
ay b
e at
tenu
ated
by
non-
com
plia
nce
and
sove
reig
n ri
sk a
nd d
epen
ds o
n in
cent
ives
to c
ompe
te
Sco
re: 5
Tra
nsfe
rabi
lity
is
larg
e, b
ut a
lway
s lim
ited
S
core
: 4
Lic
ence
s ar
e in
ge
nera
l dif
ficu
lt to
div
ide
Sco
re: 0
Hol
der
can
choo
se
the
best
way
to
use
its r
ight
to
fish
, sub
ject
to
tech
nica
l re
stri
ctio
ns
Sco
re: 3
IE
s IE
s pr
ovid
e an
indi
rect
acc
ess
righ
t to
the
reso
urce
. Situ
atio
n de
pend
s on
the
type
of
inpu
t re
gula
ted,
the
size
and
the
natu
re
of th
e fl
eet
Sco
re: 4
IEs
are
ofte
n at
trib
uted
ann
uall
y an
d re
new
ed
Sco
re: 4
In p
ract
ice,
the
char
acte
rist
ic m
ay b
e at
tenu
ated
by
non-
com
plia
nce
and
sove
reig
n ri
sk a
nd d
epen
ds o
n in
cent
ives
to c
ompe
te
Sco
re: 4
IEs
are
in
prin
cipl
e no
t tr
ansf
erab
le, b
ut
som
e al
low
ance
m
ay e
xist
in
prac
tice
S
core
: 2
Not
with
stan
ding
th
e tr
ansf
erab
ility
is
sue,
IE
can
be
divi
ded
on “
sub-
IQ”
to s
ome
exte
nt
Sco
re:
3
IEs
are
a gi
ven
quan
tity
of
inpu
t th
at c
an b
e us
ed.
Sco
re: 1
.5
ITE
s IT
Es
prov
ide
an in
dire
ct a
cces
s ri
ght t
o th
e re
sour
ce. S
ituat
ion
depe
nds
on th
e ty
pe o
f in
put
regu
late
d, th
e si
ze a
nd th
e na
ture
of
the
flee
t S
core
: 4.5
ITE
s ar
e of
ten
attr
ibut
ed o
n a
med
ium
/long
term
ba
sis
Sco
re: 5
In p
ract
ice,
the
char
acte
rist
ic m
ay b
e at
tenu
ated
by
non-
com
plia
nce
and
sove
reig
n ri
sk a
nd d
epen
ds o
n in
cent
ives
to c
ompe
te
Sco
re: 4
Exa
mpl
es s
ugge
st
that
res
tric
tions
on
tran
sfer
abili
ty
have
bee
n do
ne to
a
smal
l deg
ree
Sco
re: 4
Any
fra
ctio
n of
IT
Es
can
be
divi
ded
or
aggr
egat
ed
Sco
re: 5
ITE
s ar
e a
give
n,
alth
ough
tr
ansf
erab
le,
quan
tity
of
inpu
t th
at c
an b
e us
ed.
Sco
re: 3
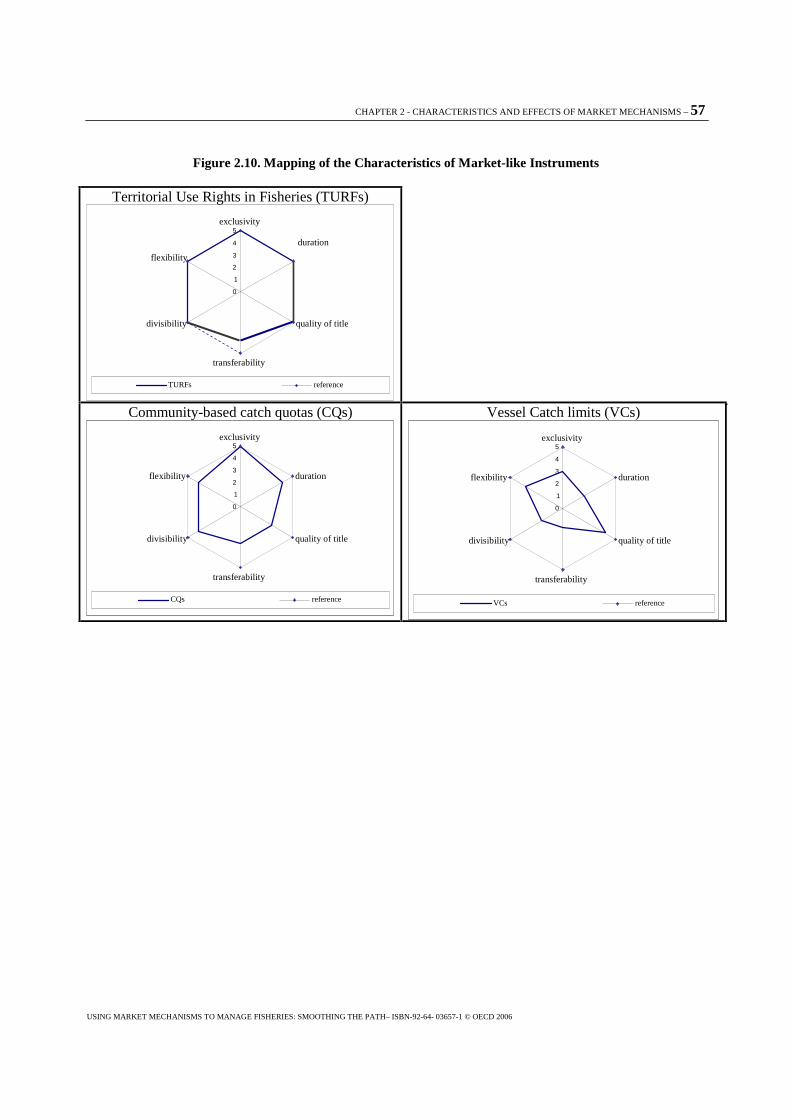
CHAPTER 2 - CHARACTERISTICS AND EFFECTS OF MARKET MECHANISMS – 57
USING MARKET MECHANISMS TO MANAGE FISHERIES: SMOOTHING THE PATH– ISBN-92-64- 03657-1 © OECD 2006
Figure 2.10. Mapping of the Characteristics of Market-like Instruments
Territorial Use Rights in Fisheries (TURFs)
Community-based catch quotas (CQs)
Vessel Catch limits (VCs)
0 1 2 3 4 5
exclusivity
quality of title
transferability
divisibility
flexibility
TURFs reference
duration
0 1 2 3 4 5 exclusivity
duration
quality of title
transferability
divisibility
flexibility
CQs reference
0 1 2 3 4 5
exclusivity
duration
quality of title
transferability
divisibility
flexibility
VCs reference
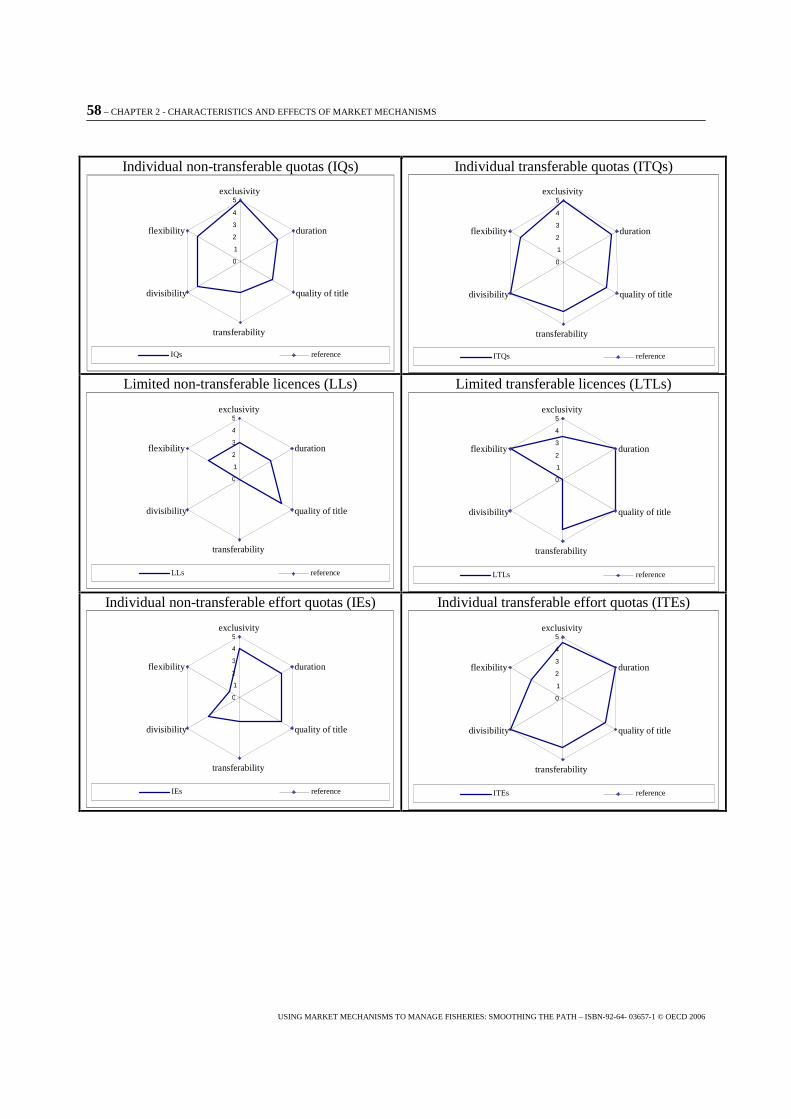
58 – CHAPTER 2 - CHARACTERISTICS AND EFFECTS OF MARKET MECHANISMS
USING MARKET MECHANISMS TO MANAGE FISHERIES: SMOOTHING THE PATH – ISBN-92-64- 03657-1 © OECD 2006
Individual non-transferable quotas (IQs)
Individual transferable quotas (ITQs)
Limited non-transferable licences (LLs)
Limited transferable licences (LTLs)
Individual non-transferable effort quotas (IEs)
Individual transferable effort quotas (ITEs)
0 1 2 3 4 5 exclusivity
duration
quality of title
transferability
divisibility
flexibility
IQs reference
0 1 2 3 4 5
exclusivity
duration
quality of title
transferability
divisibility
flexibility
ITQs reference
0 1 2 3 4 5 exclusivity
duration
quality of title
transferability
divisibility
flexibility
LLs reference
0 1 2 3 4 5
exclusivity
duration
quality of title
transferability
divisibility
flexibility
LTLs reference
0 1 2 3 4 5 exclusivity
duration
quality of title
transferability
divisibility
flexibility
IEs reference
0 1 2 3 4 5 exclusivity
duration
quality of title
transferability
divisibility
flexibility
ITEs reference
CHAPTER 3 - TEN TRACKS TOWARDS IMPLEMENTING MARKET MECHANISMS– 59
USING MARKET MECHANISMS TO MANAGE FISHERIES: SMOOTHING THE PATH – ISBN-92-64-03657-1 © OECD 2006
Chapter 3
Ten Tracks Towards Implementing Market Mechanisms
When discussing its 2003-2005 Program of Work during its 89th Session, the Committee decided that this study:
“…will discuss how reform towards the shared objective of sustainable and responsible fisheries of fisheries management can be constructed using market-like instruments/incentives. The study will explore the different ways member countries have used such instruments and are dealing, or have dealt, with the inevitable tradeoffs between competing interests of stakeholders in the fishery during the reform process. Obstacles and incentives to the achievement of (the reform towards) sustainable fisheries, including how different fishing/non-fishing interests are treated in the process, will also be subject of further analysis”.
While the section (2.1) mainly addressed the first set of concerns (i.e. the “how” question), the overall aim of this section is to help fisheries managers and policy makers make better use of market-like instruments in fisheries management (i.e. the “how to” question, in accordance with the policy recommendations endorsed at the 2001 OECD Ministerial meeting), and provide some guidelines for their implementation.
In order to successfully develop and implement new market-like instruments systems, experiences from Member countries and the specialised literature suggest that fisheries managers need to address an array of technical, social and administrative challenges. In a forward-looking approach, this section is organised around 10 operational paths or “tracks” that can be followed to address these challenges and ease the introduction and better use of market-like instruments in the future.
The ten tracks are in general not mutually exclusive, each providing practical evidences on which policy makers can draw on in designing the “reform strategy”. The ten tracks are expected to cover/encapsulate the main challenges faced by policy makers.
An issue that may require additional attention is the extent to which management reform, including the introduction of market mechanisms, may be affected by international commitments and constraints. In the cases of straddling stocks and stocks of highly migratory species, a country's domestic fisheries may be forced into a particular pattern of fishing or mode of management that may make it difficult to introduce reform. This could occur as a result of competitive pressures or from international obligations that place restrictions on domestic fisheries.
60 - CHAPTER 3 - TEN TRACKS TOWARDS IMPLEMENTING MARKET MECHANISMS
USING MARKET MECHANISMS TO MANAGE FISHERIES: SMOOTHING THE PATH – ISBN-92-64-03657-1 © OECD 2006
For each of the ten tracks, the issue is clarified, key findings are identified, and preliminary discussion points are presented. The ten tracks are:
� Track 1: Making stakeholders comfortable with the concept of market-like instruments
� Track 2: Preferring an incremental/gradual implementation
� Track 3: Not necessarily adopting a “one-size-fits-all” strategy
� Track 4: Carefully designing the allocation process (distributional issue)
� Track 5: Using pragmatically market forces
� Track 6: Overcoming the “excessive consolidation” question
� Track 7: Using the “demonstration effect” (drawing on experience)
� Track 8: Involving stakeholders in the reform process
� Track 9: Integrating fisheries characteristics
� Track 10: Dealing pragmatically with trade-offs
CHAPTER 3 - TEN TRACKS TOWARDS IMPLEMENTING MARKET MECHANISMS – 61
USING MARKET MECHANISMS TO MANAGE FISHERIES: SMOOTHING THE PATH – ISBN-92-64-03657-1 © OECD 2006 61
Track 1: Making all stakeholders comfortable with the concept of market-like instruments
There are two major obstacles to reform efforts focusing on increasing the use of market-like instruments in OECD fisheries sectors. These relate to false perceptions about the nature of market-like instruments and concerns about “privatising” publicly owned fisheries resources1. In relation to the first of these issues, information from various industry, NGO and official sources suggests that the concept of “market-like instruments” is often poorly understood, and is frequently restricted to comprise theoretical Individual Transferable Quotas systems. To help address this, this study has sought to provide policy makers with information allowing them to explain and clarify the broad range of market mechanisms that are actually in use in OECD countries. This will provide policy makers with a broader range of policy tools and will help to improve the acceptability of such instruments by the broader community.
As evidenced in this study market-like instruments can take various forms. Drawing on the typology Table 1.1, Table 3.1 summarises the different forms of market-like instruments in use in OECD and selected non-OECD countries.
One of the key points from the review of market-like instruments carried out as part of this study is that each market-like instrument encompasses the six property-rights characteristics (exclusivity, duration, quality of the title, transferability, divisibility and flexibility), but each to a varying degree. Market-like instruments should thus be considered as a continuum of management instruments, characterised by different levels of characteristics, which may be applied in different combinations to reach different societal objectives
Market-like instruments are widely used across OECD countries (Table 3.2). While the use of market-like instruments remains, in some ways, a politically sensitive issue in some OECD countries, experience suggests that almost all Member countries have implemented them to various degrees. There is, however, a wide range of variations in the design and implementation of instruments within the same broad category, across countries. For example, ITQ schemes are widely used in the OECD, although there are differences in their design in each country. These differences relate to issues such as who can hold quota, limits on quota concentration, allocation mechanisms, and so on. Such differences usually reflect differences in the social, legal, economic and historical background to the introduction of ITQs in each country. Similar national variations occur in the other categories of market-like instruments.
1 See for example the Draft synthesis report on environmentally harmful subsidies; SG/SD(2004)3.
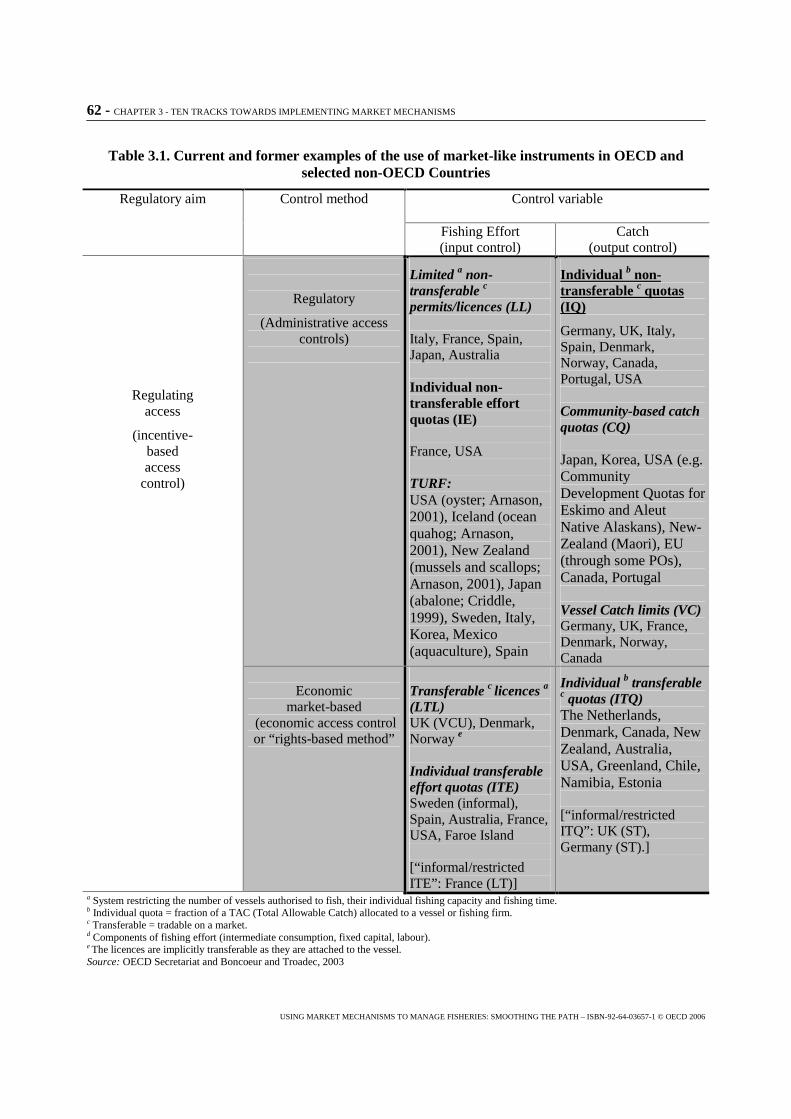
62 - CHAPTER 3 - TEN TRACKS TOWARDS IMPLEMENTING MARKET MECHANISMS
USING MARKET MECHANISMS TO MANAGE FISHERIES: SMOOTHING THE PATH – ISBN-92-64-03657-1 © OECD 2006
Table 3.1. Current and former examples of the use of market-like instruments in OECD and selected non-OECD Countries
Control variable
Regulatory aim Control method
Fishing Effort (input control)
Catch (output control)
Regulatory
(Administrative access controls)
Limited a non-transferable c permits/licences (LL) Italy, France, Spain, Japan, Australia Individual non-transferable effort quotas (IE) France, USA TURF: USA (oyster; Arnason, 2001), Iceland (ocean quahog; Arnason, 2001), New Zealand (mussels and scallops; Arnason, 2001), Japan (abalone; Criddle, 1999), Sweden, Italy, Korea, Mexico (aquaculture), Spain
Individual b non-transferable c quotas (IQ)
Germany, UK, Italy, Spain, Denmark, Norway, Canada, Portugal, USA Community-based catch quotas (CQ) Japan, Korea, USA (e.g. Community Development Quotas for Eskimo and Aleut Native Alaskans), New-Zealand (Maori), EU (through some POs), Canada, Portugal Vessel Catch limits (VC) Germany, UK, France, Denmark, Norway, Canada
Regulating
access
(incentive-based access
control)
Economic
market-based (economic access control or “rights-based method”
Transferable c licences a
(LTL) UK (VCU), Denmark, Norway e Individual transferable effort quotas (ITE) Sweden (informal), Spain, Australia, France, USA, Faroe Island [“informal/restricted ITE”: France (LT)]
Individual b transferable c quotas (ITQ) The Netherlands, Denmark, Canada, New Zealand, Australia, USA, Greenland, Chile, Namibia, Estonia [“informal/restricted ITQ”: UK (ST), Germany (ST).]
a System restricting the number of vessels authorised to fish, their individual fishing capacity and fishing time. b Individual quota = fraction of a TAC (Total Allowable Catch) allocated to a vessel or fishing firm. c Transferable = tradable on a market. d Components of fishing effort (intermediate consumption, fixed capital, labour). e The licences are implicitly transferable as they are attached to the vessel. Source: OECD Secretariat and Boncoeur and Troadec, 2003
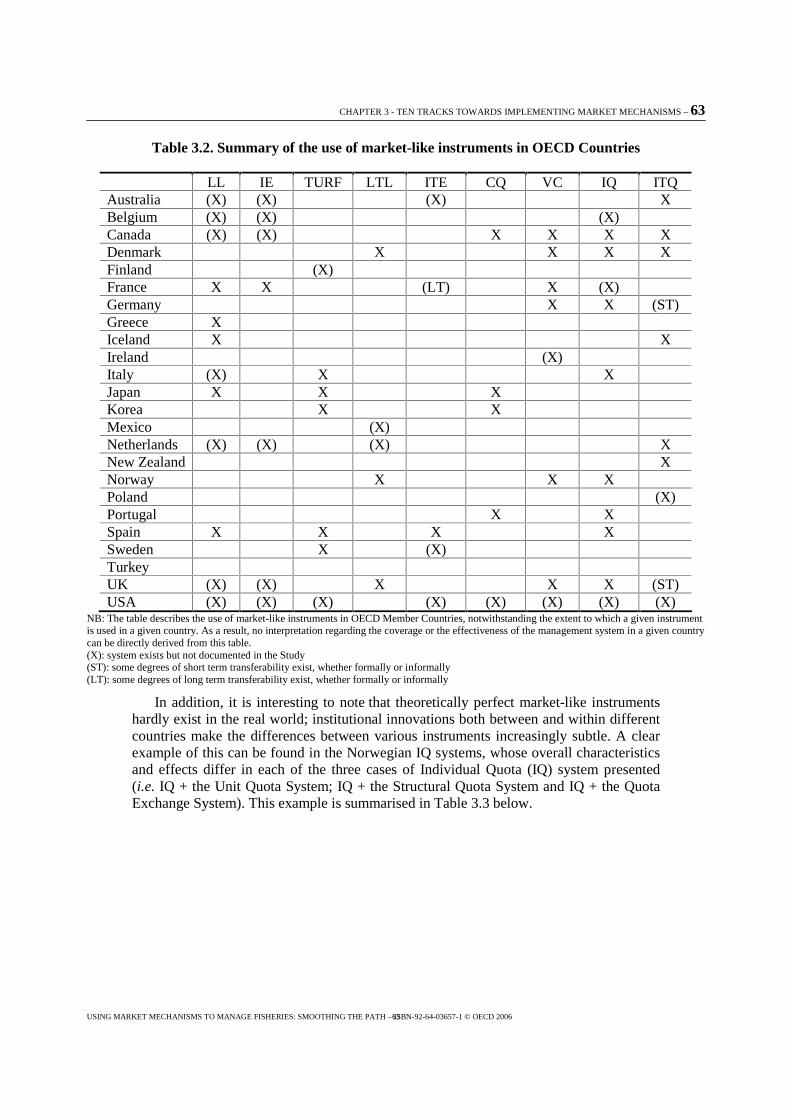
CHAPTER 3 - TEN TRACKS TOWARDS IMPLEMENTING MARKET MECHANISMS – 63
USING MARKET MECHANISMS TO MANAGE FISHERIES: SMOOTHING THE PATH – ISBN-92-64-03657-1 © OECD 2006 63
Table 3.2. Summary of the use of market-like instruments in OECD Countries
LL IE TURF LTL ITE CQ VC IQ ITQ Australia (X) (X) (X) X Belgium (X) (X) (X) Canada (X) (X) X X X X Denmark X X X X Finland (X) France X X (LT) X (X) Germany X X (ST) Greece X Iceland X X Ireland (X) Italy (X) X X Japan X X X Korea X X Mexico (X) Netherlands (X) (X) (X) X New Zealand X Norway X X X Poland (X) Portugal X X Spain X X X X Sweden X (X) Turkey UK (X) (X) X X X (ST) USA (X) (X) (X) (X) (X) (X) (X) (X)
NB: The table describes the use of market-like instruments in OECD Member Countries, notwithstanding the extent to which a given instrument is used in a given country. As a result, no interpretation regarding the coverage or the effectiveness of the management system in a given country can be directly derived from this table. (X): system exists but not documented in the Study (ST): some degrees of short term transferability exist, whether formally or informally (LT): some degrees of long term transferability exist, whether formally or informally
In addition, it is interesting to note that theoretically perfect market-like instruments hardly exist in the real world; institutional innovations both between and within different countries make the differences between various instruments increasingly subtle. A clear example of this can be found in the Norwegian IQ systems, whose overall characteristics and effects differ in each of the three cases of Individual Quota (IQ) system presented (i.e. IQ + the Unit Quota System; IQ + the Structural Quota System and IQ + the Quota Exchange System). This example is summarised in Table 3.3 below.
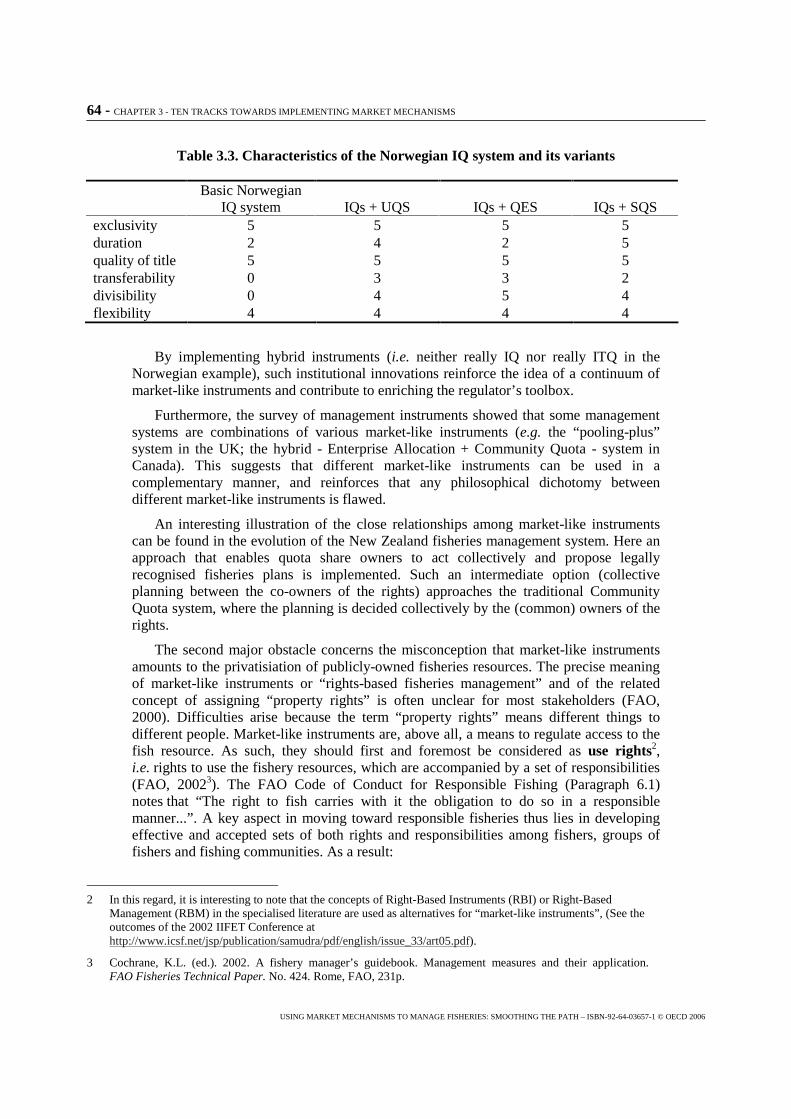
64 - CHAPTER 3 - TEN TRACKS TOWARDS IMPLEMENTING MARKET MECHANISMS
USING MARKET MECHANISMS TO MANAGE FISHERIES: SMOOTHING THE PATH – ISBN-92-64-03657-1 © OECD 2006
Table 3.3. Characteristics of the Norwegian IQ system and its variants
Basic Norwegian
IQ system IQs + UQS IQs + QES IQs + SQS exclusivity 5 5 5 5 duration 2 4 2 5 quality of title 5 5 5 5 transferability 0 3 3 2 divisibility 0 4 5 4 flexibility 4 4 4 4
By implementing hybrid instruments (i.e. neither really IQ nor really ITQ in the Norwegian example), such institutional innovations reinforce the idea of a continuum of market-like instruments and contribute to enriching the regulator’s toolbox.
Furthermore, the survey of management instruments showed that some management systems are combinations of various market-like instruments (e.g. the “pooling-plus” system in the UK; the hybrid - Enterprise Allocation + Community Quota - system in Canada). This suggests that different market-like instruments can be used in a complementary manner, and reinforces that any philosophical dichotomy between different market-like instruments is flawed.
An interesting illustration of the close relationships among market-like instruments can be found in the evolution of the New Zealand fisheries management system. Here an approach that enables quota share owners to act collectively and propose legally recognised fisheries plans is implemented. Such an intermediate option (collective planning between the co-owners of the rights) approaches the traditional Community Quota system, where the planning is decided collectively by the (common) owners of the rights.
The second major obstacle concerns the misconception that market-like instruments amounts to the privatisiation of publicly-owned fisheries resources. The precise meaning of market-like instruments or “rights-based fisheries management” and of the related concept of assigning “property rights” is often unclear for most stakeholders (FAO, 2000). Difficulties arise because the term “property rights” means different things to different people. Market-like instruments are, above all, a means to regulate access to the fish resource. As such, they should first and foremost be considered as use rights2, i.e. rights to use the fishery resources, which are accompanied by a set of responsibilities (FAO, 20023). The FAO Code of Conduct for Responsible Fishing (Paragraph 6.1) notes that “The right to fish carries with it the obligation to do so in a responsible manner...”. A key aspect in moving toward responsible fisheries thus lies in developing effective and accepted sets of both rights and responsibilities among fishers, groups of fishers and fishing communities. As a result:
2 In this regard, it is interesting to note that the concepts of Right-Based Instruments (RBI) or Right-Based Management (RBM) in the specialised literature are used as alternatives for “market-like instruments”, (See the outcomes of the 2002 IIFET Conference at http://www.icsf.net/jsp/publication/samudra/pdf/english/issue_33/art05.pdf).
3 Cochrane, K.L. (ed.). 2002. A fishery manager’s guidebook. Management measures and their application. FAO Fisheries Technical Paper. No. 424. Rome, FAO, 231p.
CHAPTER 3 - TEN TRACKS TOWARDS IMPLEMENTING MARKET MECHANISMS – 65
USING MARKET MECHANISMS TO MANAGE FISHERIES: SMOOTHING THE PATH – ISBN-92-64-03657-1 © OECD 2006 65
� the assets created under market-like instruments are almost never considered legally as property rights on the resource itself, but as access rights to the resource4. Even ITQs are generally considered as an entitlement to harvest a given share of the stock only.5
� This status of market-like instruments is reinforced in most OECD countries regulatory framework (e.g. licences and quotas are “annual privileges” in Canada; ITQ and IFQ are “privileges” respectively in Australia and USA6) while the functions relating to resource ownership (i.e. mainly management functions) remain with government (Schlager and Ostrom, 1992)7.
Clarifying and communicating this important distinction between property rights and use rights will help policy makers in countries or fisheries where the use of market-like instruments is opposed because of concerns related to what can be perceived as the “full privatisation” of a common resource8.
4 In this regard, FAO (2002) notes that “it is crucial to recognise that a fisher holding use rights has the right to access the fishery, but the fisher does not own the fish per se until those fish are actually caught. Thus use rights do not imply ownership of the resource itself. Unfortunately, this crucial distinction has been confused at times, with use rights (such as individual quotas) promoted by suggesting that fishers holding these rights will in fact ‘own’ fish in the sea, just as one may own their fishing boat. This idea has been at the root of much recent conflict in fisheries, often between users and non-users, but is not at all what is meant by use rights.”
5 A parallel example is the timber or cutting rights granted by governments and private forest owners to forestry companies, The forestry companies do not own the forests, but they purchase the right to use (harvest) the resources, often subject to conditions so as to ensure sustainability (e.g. that reforestation accompanies harvesting). Similarly, in the air, oil and gas sector, the focus is more on the use right to a particular oil field.
6 In the US, a bill aiming at clarifying that quota shares are not property rights was under consideration in July 2005.
7 This does not prevent governments from recovering costs for the management services, nor to devolve management services to the private sector.
8 In this regard, Boncoeur and Troadec (2003) note that even with a ITQ system, the government still has major responsibilities, for instance, to define such rights, tailor the overall volume of rights to resource productivity, adjust their issuance in space and time, enforce compliance and regulate the market created by the new system.
66 - CHAPTER 3 - TEN TRACKS TOWARDS IMPLEMENTING MARKET MECHANISMS
USING MARKET MECHANISMS TO MANAGE FISHERIES: SMOOTHING THE PATH – ISBN-92-64-03657-1 © OECD 2006
Track 2: Preferring an incremental/gradual implementation
As highlighted in the OECD study, “Transition to Responsible Fisheries” (OECD, 2000, p. 12), government decisions regarding the pace of change of management reforms, the duration of transition periods, the rate of stock rebuilding, the general strategy of reform (e.g. gradual vs. “one-off” reform), and so on often appear to be sensitive issues to many stakeholders in the sector. Gaining stakeholder acceptance of management reforms will require obtaining consensus about the rate at which change can proceed, often based on perceptions about how quickly fishers and their communities will be able to adapt and adjust their operations and livelihoods to a changing set of circumstances.
Based on Member countries experiences, it is clear that OECD policy makers have generally preferred an incremental implementation of new market-like instruments. Such a strategy may reduce the immediate benefits of reform, but has generally been necessary to enable the industry to make an orderly transition to the new management regime. It has also provided an opportunity for managers to further develop and refine the instruments (although there is clearly a limit to the length of time that this can occur due to potential issues of policy credibility if constant change is undertaken). In the meantime, trade-offs between the pace of implementation and, for example, budgetary constraints may have strong implications for the global effectiveness of the management program (see Track 10 below on trade-offs for further discussions on this issue). In particular, resource crisis may require rapid changes and implementation of reform may need to be quite swift.
The evidence in this Study shows that, in most OECD countries the introduction of new market-like instruments has followed a gradual or step-by-step approach (i.e. gradually closing the commons). This can be seen in Table 3.4 which traces the evolution of the use of market-like instruments in four selected OECD countries: Iceland, New Zealand, UK and Norway.
Experience also suggests that the implementation of market-like instruments follows a general pattern (although different market-like instruments can coexist at some times):
� Phase 1: Technical measures aimed primarily at protecting juveniles and then at limiting the overall catch;
� Phase 2: Non-transferable use rights (limited non transferable licences, IQs, etc.);
� Phase 3: Partial, informal or full transferability (ITQ in fisheries suited to their use, otherwise transferable licences).
Available information also suggests that policy shifts towards market-like instruments are generally not reversed. For example, once transferability is allowed for a given instrument, it rarely returns to a status of non-transferable.
Pursuing such a strategy may contain several important considerations for policy makers. First, the incremental or gradual implementation of market-like instruments allows for a manageable “workload”. It may be a successful strategy to first concentrate the administrative resources on a specific part of the fleet (e.g. the part of the fleet which is the most ready to accept changes, and where transaction costs are likely to be limited due to the small number and homogeneity of stakeholders). Such a strategy was used in demersal fishery in Iceland, flatfish fishery in the Netherlands, the ‘300s fleet’ in Spain, the cod trawlers above 28 meters in Norway (and the vessels above 28 meters in general), Pressure Stock Licences (PSL) for vessels 40ft and over in the UK, to name but a few examples.
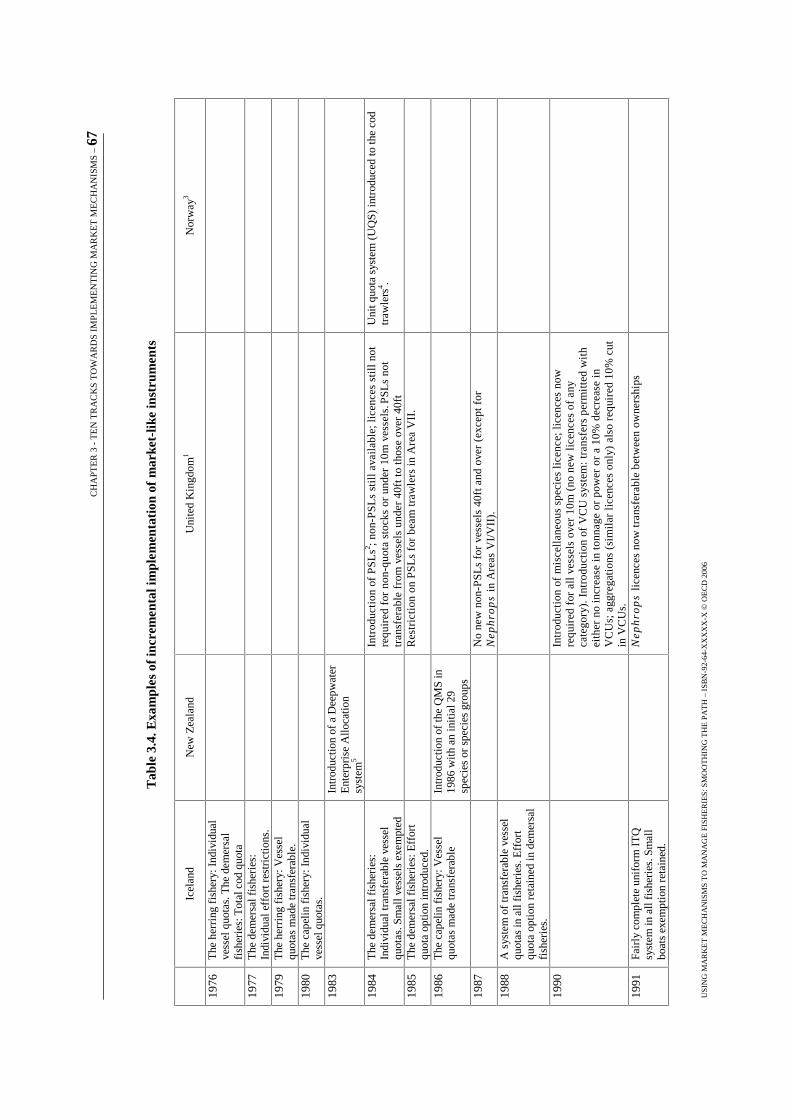
CH
APT
ER
3 -
TE
N T
RA
CK
S T
OW
AR
DS
IM
PL
EM
EN
TIN
G M
AR
KE
T M
EC
HA
NIS
MS
– 67
USI
NG
MA
RK
ET
ME
CH
AN
ISM
S T
O M
AN
AG
E F
ISH
ER
IES:
SM
OO
TH
ING
TH
E P
AT
H –
IS
BN
-92-
64-X
XX
XX
-X ©
OE
CD
200
6
Tab
le 3
.4. E
xam
ples
of
incr
emen
tal i
mpl
emen
tati
on o
f m
arke
t-lik
e in
stru
men
ts
Ic
elan
d N
ew Z
eala
nd
Uni
ted
Kin
gdom
1 N
orw
ay3
1976
T
he h
erri
ng f
ishe
ry: I
ndiv
idua
l ve
ssel
quo
tas.
The
dem
ersa
l fi
sher
ies:
Tot
al c
od q
uota
1977
T
he d
emer
sal f
ishe
ries
: In
divi
dual
eff
ort r
estr
ictio
ns.
1979
T
he h
erri
ng f
ishe
ry: V
esse
l qu
otas
mad
e tr
ansf
erab
le.
1980
T
he c
apel
in f
ishe
ry: I
ndiv
idua
l ve
ssel
quo
tas.
1983
Intr
oduc
tion
of
a D
eepw
ater
E
nter
pris
e A
lloca
tion
sy
stem
5
1984
T
he d
emer
sal f
ishe
ries
: In
divi
dual
tran
sfer
able
ves
sel
quot
as. S
mal
l ves
sels
exe
mpt
ed
In
trod
ucti
on o
f P
SL
s2 ; no
n-P
SL
s st
ill a
vail
able
; lic
ence
s st
ill n
ot
requ
ired
for
non
-quo
ta s
tock
s or
und
er 1
0m v
esse
ls. P
SL
s no
t tr
ansf
erab
le f
rom
ves
sels
und
er 4
0ft t
o th
ose
over
40f
t
Uni
t quo
ta s
yste
m (
UQ
S) in
trod
uced
to th
e co
d tr
awle
rs4 .
1985
T
he d
emer
sal f
ishe
ries
: Eff
ort
quot
a op
tion
intr
oduc
ed.
R
estr
icti
on o
n P
SL
s fo
r be
am tr
awle
rs i
n A
rea
VII
.
1986
T
he c
apel
in f
ishe
ry: V
esse
l qu
otas
mad
e tr
ansf
erab
le
Intr
oduc
tion
of
the
QM
S in
19
86 w
ith
an in
itia
l 29
spec
ies
or s
peci
es g
roup
s
1987
N
o ne
w n
on-P
SL
s fo
r ve
ssel
s 40
ft a
nd o
ver
(exc
ept f
or
Nep
hro
ps
in A
reas
VI/
VII
).
1988
A
sys
tem
of
tran
sfer
able
ves
sel
quot
as in
all
fish
erie
s. E
ffor
t qu
ota
optio
n re
tain
ed in
dem
ersa
l fi
sher
ies.
1990
In
trod
ucti
on o
f m
isce
llan
eous
spe
cies
lice
nce;
lice
nces
now
re
quir
ed f
or a
ll v
esse
ls o
ver
10m
(no
new
lic
ence
s of
any
ca
tego
ry).
Int
rodu
ctio
n of
VC
U s
yste
m:
tran
sfer
s pe
rmit
ted
wit
h ei
ther
no
incr
ease
in
tonn
age
or p
ower
or
a 10
% d
ecre
ase
in
VC
Us;
agg
rega
tion
s (s
imil
ar li
cenc
es o
nly)
als
o re
quir
ed 1
0% c
ut
in V
CU
s.
1991
Fa
irly
com
plet
e un
ifor
m I
TQ
sy
stem
in a
ll f
ishe
ries
. Sm
all
boat
s ex
empt
ion
reta
ined
.
N
eph
rop
s li
cenc
es n
ow tr
ansf
erab
le b
etw
een
owne
rshi
ps
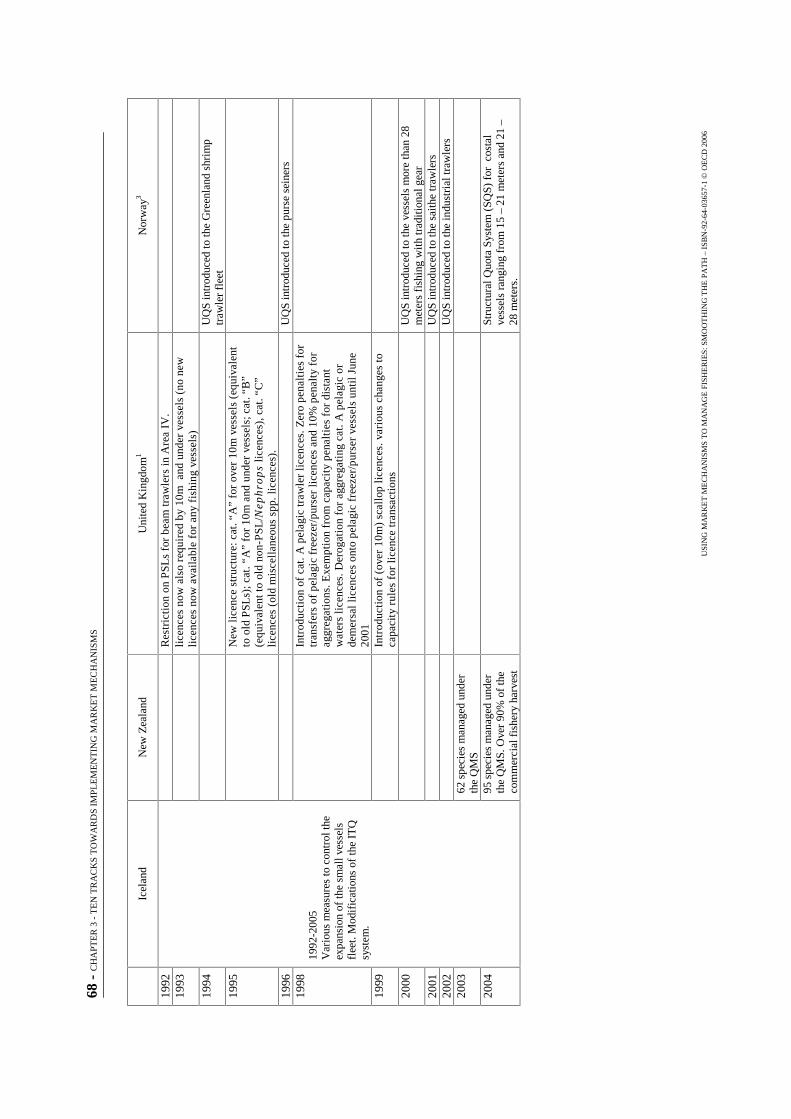
68 -
CH
APT
ER
3 -
TE
N T
RA
CK
S T
OW
AR
DS
IMP
LE
ME
NT
ING
MA
RK
ET
ME
CH
AN
ISM
S
USI
NG
MA
RK
ET
ME
CH
AN
ISM
S T
O M
AN
AG
E F
ISH
ER
IES:
SM
OO
TH
ING
TH
E P
AT
H –
IS
BN
-92-
64-0
3657
-1 ©
OE
CD
200
6
Ic
elan
d N
ew Z
eala
nd
Uni
ted
Kin
gdom
1 N
orw
ay3
1992
Res
tric
tion
on
PS
Ls
for
beam
traw
lers
in
Are
a IV
.
1993
lice
nces
now
als
o re
quir
ed b
y 10
m a
nd u
nder
ves
sels
(no
new
li
cenc
es n
ow a
vail
able
for
any
fis
hing
ves
sels
)
1994
U
QS
intr
oduc
ed to
the
Gre
enla
nd s
hrim
p tr
awle
r fl
eet
1995
New
lic
ence
str
uctu
re: c
at. “
A”
for
over
10m
ves
sels
(eq
uiva
lent
to
old
PS
Ls)
; cat
. “A
” fo
r 10
m a
nd u
nder
ves
sels
; cat
. “B
” (e
quiv
alen
t to
old
non-
PS
L/N
eph
rop
s li
cenc
es),
cat
. “C
” li
cenc
es (
old
mis
cell
aneo
us s
pp. l
icen
ces)
.
1996
U
QS
intr
oduc
ed to
the
purs
e se
iner
s 19
98
In
trod
ucti
on o
f ca
t. A
pel
agic
traw
ler
lice
nces
. Zer
o pe
nalt
ies
for
tran
sfer
s of
pel
agic
fre
ezer
/pur
ser
lice
nces
and
10%
pen
alty
for
ag
greg
atio
ns. E
xem
ptio
n fr
om c
apac
ity
pena
ltie
s fo
r di
stan
t w
ater
s li
cenc
es. D
erog
atio
n fo
r ag
greg
atin
g ca
t. A
pel
agic
or
dem
ersa
l lic
ence
s on
to p
elag
ic f
reez
er/p
urse
r ve
ssel
s un
til J
une
2001
1999
Intr
oduc
tion
of
(ove
r 10
m)
scal
lop
lice
nces
. var
ious
cha
nges
to
capa
city
rul
es f
or li
cenc
e tr
ansa
ctio
ns
2000
U
QS
intr
oduc
ed to
the
vess
els
mor
e th
an 2
8 m
eter
s fi
shin
g w
ith
trad
itio
nal g
ear
2001
U
QS
intr
oduc
ed to
the
sait
he tr
awle
rs
2002
U
QS
intr
oduc
ed to
the
indu
stri
al tr
awle
rs
2003
62
spe
cies
man
aged
und
er
the
QM
S
2004
1992
-200
5 V
ario
us m
easu
res
to c
ontr
ol th
e ex
pans
ion
of th
e sm
all v
esse
ls
flee
t. M
odif
icat
ions
of
the
ITQ
sy
stem
.
95 s
peci
es m
anag
ed u
nder
th
e Q
MS.
Ove
r 90
% o
f th
e co
mm
erci
al f
ishe
ry h
arve
st
St
ruct
ural
Quo
ta S
yste
m (
SQS)
for
cos
tal
vess
els
rang
ing
from
15
– 21
met
ers
and
21 –
28
met
ers.
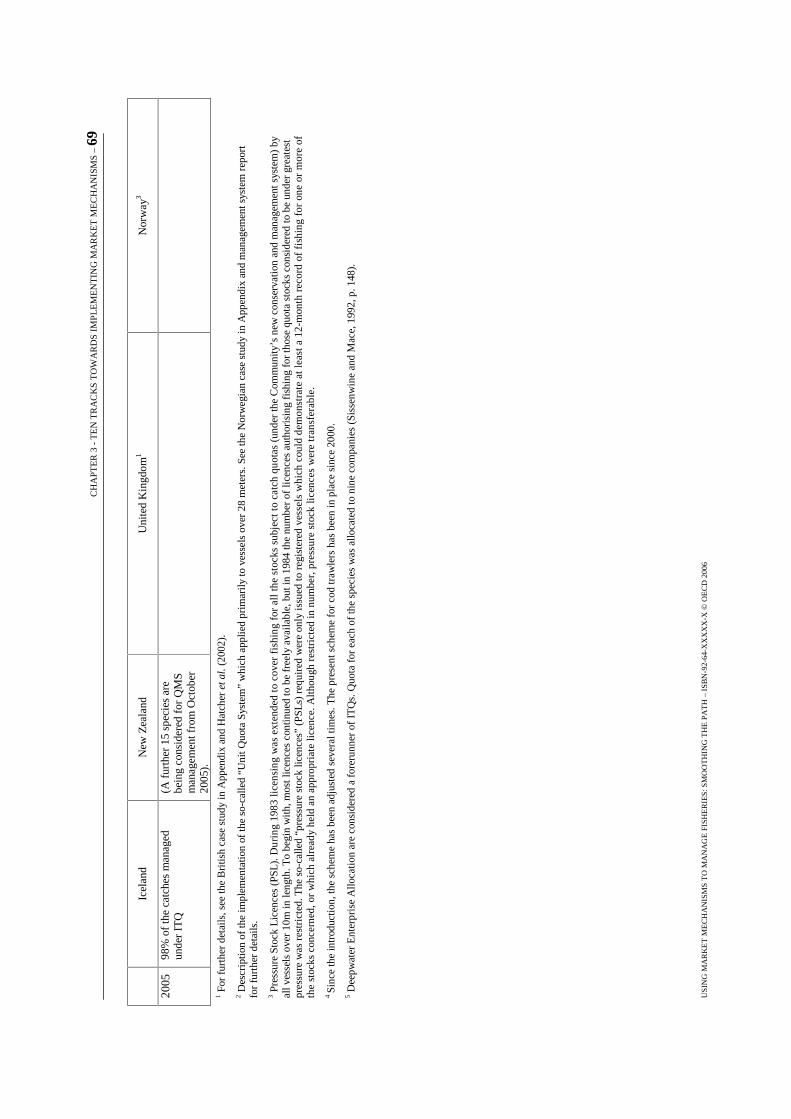
CH
APT
ER
3 -
TE
N T
RA
CK
S T
OW
AR
DS
IM
PL
EM
EN
TIN
G M
AR
KE
T M
EC
HA
NIS
MS
– 69
USI
NG
MA
RK
ET
ME
CH
AN
ISM
S T
O M
AN
AG
E F
ISH
ER
IES:
SM
OO
TH
ING
TH
E P
AT
H –
IS
BN
-92-
64-X
XX
XX
-X ©
OE
CD
200
6
Ic
elan
d N
ew Z
eala
nd
Uni
ted
Kin
gdom
1 N
orw
ay3
2005
98
% o
f th
e ca
tche
s m
anag
ed
unde
r IT
Q
(A f
urth
er 1
5 sp
ecie
s ar
e be
ing
cons
ider
ed f
or Q
MS
man
agem
ent f
rom
Oct
ober
20
05).
1 For
fur
ther
det
ails
, see
the
Bri
tish
case
stu
dy in
App
endi
x an
d H
atch
er e
t al.
(200
2).
2 Des
crip
tion
of
the
impl
emen
tatio
n of
the
so-c
alle
d “U
nit Q
uota
Sys
tem
” w
hich
app
lied
prim
arily
to v
esse
ls o
ver
28 m
eter
s. S
ee th
e N
orw
egia
n ca
se s
tudy
in A
ppen
dix
and
man
agem
ent s
yste
m r
epor
t fo
r fu
rthe
r de
tails
.
3 Pre
ssur
e St
ock
Lic
ence
s (P
SL).
Dur
ing
1983
lice
nsin
g w
as e
xten
ded
to c
over
fis
hing
for
all
the
stoc
ks s
ubje
ct t
o ca
tch
quot
as (
unde
r th
e C
omm
unity
’s n
ew c
onse
rvat
ion
and
man
agem
ent s
yste
m)
by
all v
esse
ls o
ver
10m
in le
ngth
. To
begi
n w
ith, m
ost l
icen
ces
cont
inue
d to
be
free
ly a
vaila
ble,
but
in 1
984
the
num
ber
of li
cenc
es a
utho
risi
ng f
ishi
ng f
or th
ose
quot
a st
ocks
con
side
red
to b
e un
der
grea
test
pr
essu
re w
as r
estr
icte
d. T
he s
o-ca
lled
“pre
ssur
e st
ock
licen
ces”
(PS
Ls)
req
uire
d w
ere
only
issu
ed to
reg
iste
red
vess
els
whi
ch c
ould
dem
onst
rate
at
leas
t a 1
2-m
onth
rec
ord
of f
ishi
ng f
or o
ne o
r m
ore
of
the
stoc
ks c
once
rned
, or
whi
ch a
lrea
dy h
eld
an a
ppro
pria
te li
cenc
e. A
ltho
ugh
rest
rict
ed in
num
ber,
pre
ssur
e st
ock
lice
nces
wer
e tr
ansf
erab
le.
4 Si
nce
the
intr
oduc
tion,
the
sche
me
has
been
adj
uste
d se
vera
l tim
es. T
he p
rese
nt s
chem
e fo
r co
d tr
awle
rs h
as b
een
in p
lace
sin
ce 2
000.
5 Dee
pwat
er E
nter
pris
e A
lloca
tion
are
con
side
red
a fo
reru
nner
of
ITQ
s. Q
uota
for
eac
h of
the
spec
ies
was
allo
cate
d to
nin
e co
mpa
nies
(Si
ssen
win
e an
d M
ace,
199
2, p
. 148
).
70 – CHAPTER 3 - TEN TRACKS TOWARDS IMPLEMENTING MARKET MECHANISMS
USING MARKET MECHANISMS TO MANAGE FISHERIES: SMOOTHING THE PATH – ISBN-92-64-03657-1 © OECD 2006
Second, it may then be easier for the policy maker to apply the market-like instrument to the rest of the system. Policy makers may have learnt from the first experience (learning by doing) such that, after the first trial, it is usually possible to improve the design of the instrument. The US case study presented in Chapter 10 underlines the fact that “change requires learning”.
Third, the social acceptability can be improved as stakeholders become more comfortable with existing instruments and as policy makers are able to refer to success stories both domestically and internationally9. This may have played a positive role in the expansion of the market-like instruments implemented in the 1980’s in New Zealand, Iceland and The Netherlands, where the systems in place now apply to more than 90% of the catches in those countries. This may also explain the successful transfer of the UQS system in Norway to similar SQS system for vessels between 15 and 28 meters in 2004.
Finally, in countries where fishing operators can operate in different fisheries and target different species, a gradual implementation of a new management system may contribute to maintaining short term economic performances, whereas a “one-off” and comprehensive implementation may result in large short term losses and rapid income redistribution. A gradual implementation may thus contribute to minimise the economic and social impacts of the transition.
9 In this context, it should be noted that a recent publication from the World Bank focus on this issue: Cunningham and Bostock (Eds) (2005) Successful Fisheries Management. Eburon Academic Publishers. The Netherlands.
CHAPTER 3 - TEN TRACKS TOWARDS IMPLEMENTING MARKET MECHANISMS – 71
USING MARKET MECHANISMS TO MANAGE FISHERIES: SMOOTHING THE PATH – ISBN-92-64-03657-1 © OECD 2006
Track 3: Not necessarily adopting a “one-size-fits-all” strategy
The variety of market-like instruments, coupled with the variations in their implementation between and within OECD countries, suggests that a “one-size-fits-all” approach is not necessarily appropriate or optimal. Indeed, even within the “stronger” market-like instruments such as ITQs, there is considerable variation in the details of their design and implementation between countries. Such variations reflect differences in the economic, social, historical and cultural aspects of fisheries in particular countries and highlight the need for managers to be flexible and adaptable in the design of market-like instruments.
There are, without doubt, benefits to having a relatively consistent and homogeneous approach to management instruments. There are likely to be economies of scale and benefits from “learning by doing” associated with a more homogenous system. This will help to make monitoring and management easier and more efficient. It will also facilitate the understanding of stakeholders and regulators, which may be particularly important when two or more market-like instruments may overlap but follow different rules. Finally, general fisheries management within a country is likely to benefit from a more homogeneous and comprehensive regime of market-like instruments. In particular, this could reduce problems related to the “transfer of capacity” between fisheries managed under different market-like instruments.
Experiences from Member countries suggest that in some instances, some (specific) fishing groups are not included in the “general” system (e.g. small-scale operators in the UK and in Iceland up to very recently, see Table 3.4. In other cases, the co-existence of several systems to regulate access has been observed, for example in Canada, the USA, Australia and in France (see Table 3.2). In other cases, several variants of a particular market-like instrument can co-exist in a given country. This is for instance the case in Norway, where different variants of IQ system apply to different fleets.
Several factors can contribute to explain such a situation. Heterogeneity in management systems does not necessarily complicate fisheries management. The most important management objective is to make sure that the commons are closed, i.e. that the access in each and every fishery is regulated in a consistent manner. For example, this is evident in Norway, where several market-like instruments are used for different fleets, but result in no or little “open access” situations occurring.
In some instances, it may be rational to keep the access to some fisheries “unregulated”, at least on a temporary basis (although technical measures prevail in most cases). One illustration of such a situation can be found in the English Channel bass fishery, where the greater share of the catch is realised by a small number of large operators (pelagic trawlers) and the remainder by a large number of small-scale fishers (commercial and recreational long-liners). In such cases, it may be worthwhile to concentrate on the fleet that has the bigger impact on the resource and which is the easiest to monitor. In the bass fishery, the costs of closely managing and monitoring the small scale fleet may exceed the benefits from doing so, particularly if this segment has little impact in terms of catches. Another example is the German General fishing licences, where (limited) open access is allowed for those stocks for which the quota is not likely to be exhausted (i.e. those stocks for which there is no risk of overexploitation). Yet, such situations should be kept as exceptional and short as possible.
72 – CHAPTER 3 - TEN TRACKS TOWARDS IMPLEMENTING MARKET MECHANISMS
USING MARKET MECHANISMS TO MANAGE FISHERIES: SMOOTHING THE PATH – ISBN-92-64-03657-1 © OECD 2006
More fundamentally, the co-existence of different market-like instruments can be explained by the fact that different societal objectives may be sought for different fisheries. Fisheries are multi-objective activities which serve a variety of social, cultural, political, economic and ecological goals. In any given situation, the multiplicity of objectives to be pursued will depend on societal policy decisions, and in turn, the choice of fisheries institutions and management approaches will depend on those objectives and the priorities attached to each one (Crutchfield, 1973; FAO, 1997; OECD, 199710, 2000; Charles, 2001). For instance, in some countries, the main objective for coastal fisheries may be to keep the level of employment as stable as possible, subject to resource sustainability constraints. It may therefore be rational for the public authorities to prefer those market-like instruments that ensure the stability and cohesion of the fishing community, such as limited non-transferable licences (LLs) or non-transferable catch (IQ) and effort (IE) quotas, while using different market-like instruments in other fisheries (e.g. large-scale fisheries). Examples of such co-existence of instruments are found in Canada, France, Japan, Portugal, Spain, UK, etc.
10 The OECD Committee for Fisheries recognised this feature in 1997, when stating that “there are no universal solutions to the fisheries management problems. The right solution will be different in different countries and at different points in time due to differences in circumstances and differences in political objectives. To find the right solutions requires complex and bold political decisions” (in “Towards Sustainable Fisheries”, OECD 1997, p.21).
CHAPTER 3 - TEN TRACKS TOWARDS IMPLEMENTING MARKET MECHANISMS – 73
USING MARKET MECHANISMS TO MANAGE FISHERIES: SMOOTHING THE PATH – ISBN-92-64-03657-1 © OECD 2006
Track 4: Carefully designing the allocation process
The issue of who should hold use rights, and in what quantity, is a very politically sensitive issue due to two key questions:
� How should the initial allocation of rights be carried out?
� How should the allocation of rights evolve in the future? (This is addressed in the Tracks 5 and 6 related to market forces and excessive concentration, respectively).
� To ease the implementation of any market-like instrument, the allocation rules need to be as clear as possible and should be agreed upon early in the process of designing the policy regime. This will help to:
� Avoid legal actions (e.g. in Australia, Iceland, France, New Zealand11 and USA, litigations have been a feature of many allocation processes).
� Avoid adverse effects on resource management (e.g. strategic behaviour prior to the implementation of a market-like instrument to increase historical catches, including so-called “fish for quota” behaviour).
� Get stakeholders’ support, by clarifying how they are going to be affected by the reform and minimising potential distributional conflicts.
The evidence in this study suggests that most Member countries first allocate use rights free of charge and base the allocations on historic catches. This can be explained by acceptability constraints, political objectives and the low or zero value of access rights that normally exist in overexploited fisheries. Free or gratis “grandfathering” allocation is common in most ITQ systems12, but also occurs in the case of licences in the UK. Other OECD countries have allocated use rights through formulas that take into account fishing capital or any other indicator of investment, for example related to the length or power of vessels (e.g. in Poland and Norway), and sometimes employment (e.g. in France in the case of vessel catch limits).
Some Member countries distribute use rights evenly among existing participants, but hybrid schemes combining catch history and equal distribution (e.g. in the Tasmanian rock lobster and abalone fisheries in Australia or in France in the case of individual effort quota regulation) are also in use.
According to available information, auction systems have rarely been used in OECD countries as a means of allocating access rights. The exception is Mexico where a partial competitive bidding13 is in place to allocate fishing licences (the “concessions”). However, it should be noted that several non-OECD countries use auctions to allocate fishing rights (e.g. Russia, Estonia). In some cases, a partial auction is undertaken (for
11 When the fixed quota rights system initially introduced switched to a variable quota rights system; Sissenwine and Mace, 1992.
12 For a review of initial allocation processes, e.g. see FAO (2001) Case studies on the allocation of transferable quota rights in fisheries. FAO. Rome.
13 In other words, only a part of the rights is allocated through direct market interplay and the remaining through “grandfathering” or direct planning. Such “hybrid” situation is not restricted to the fisheries sector. The new EU emission trading system for CO2 provides the auction option to a limited extent, whereas 95% of the initial allowances being required to be “grandfathered”.
74 – CHAPTER 3 - TEN TRACKS TOWARDS IMPLEMENTING MARKET MECHANISMS
USING MARKET MECHANISMS TO MANAGE FISHERIES: SMOOTHING THE PATH – ISBN-92-64-03657-1 © OECD 2006
example,10% of the TAC is reauctioned each year in Chile, and a partial system applies also in Estonia). In the meantime, some Member countries are considering using similar approaches in the future (Australia is looking into systems whereby temporary fishing rights are sold by public auction, (Morgan, 1997); New-Zealand is also considering such an evolution14).
While the use of auction remains limited, it should be noted that even partial competitive bidding may be useful for policy makers, as this helps reflecting the “true/right” value of the fishing right (e.g. see Bohm, 1999)15. This in turn can be used to estimate the value of the fishery and also serve to set basis/benchmark for the calculation of access fees.
There is no simple or universally ‘agreed’ way to allocate rights. This mainly depends on the objectives followed and the associated perceptions of equity or fairness. The challenge for policy makers is to identify a process that seeks to minimise conflicts and costs. In this regard, any allocation process should be accompanied by some form of appeals process. Another possible way forward to minimise conflicts is to use a combination of approaches in a 2-step process. Rights could be allocated initially solely on a collective basis, directly to communities, fishing sectors or other identifiable groups. The second step in the process is then devolved to each community or grouping, involving the determination of exactly which individuals are to obtain rights (FAO, 2002). As for the latter it should be kept in mind that the bargaining power of communities/sectors of the industry may influence the outcome.
Possible problems associated with the allocation of rights include:
� An initial allocation of rights free of charge offers no guarantees in terms of equity of access between members of society (i.e. it doesn’t answer the societal question of who should have access to the resource)16. In Iceland or in the United States, political parties and individuals who feel they have lost out have contested the allocations. Such opposition may be strong in coastal zones with a variety of competing uses and interests.
� Basing initial allocation on historical catches may also raise another equity issue, especially if the period over which the ‘history’ is calculated is one of over-fishing and stock depletion. Those who receive the lowest quotas may be those who contributed least to the over-fishing.
14 This can be interpreted as a move towards a hybrid allocation system, where “grandfathering” is first applied for existing fishers to facilitate social acceptability, and auctioning gradually introduced to improve both governmental revenues and efficiency. While there may be concerns about the sovereign risk impacts of such a hybrid system, these may be reduced significantly if the features of the proposed system are transparent and known in advance, thereby allowing fishers to make their investment decisions on an informed basis (see discussions on tracks 4 and 8).
15 Partial bidding for rights is not unique to the fisheries sector. In the case of the SO2 scheme in the US, a limited amount of auction for instance exist (2.8% of the SO2 permit volume). Gosseries and Van Steenberghe (2004) indeed stated that “the primary aim of this sale was to give the market a price signal, if needed” from Bohm, P. (2000). “International Gas Emission Trading - With special reference to the Kyoto Protocol”, in Efficiency and Equity in Climate Change Policy Carrano C. (Ed.), Kluwer.
16 In the Australian lobster fishery, for instance, recreational fishing associations have contested the allocation of exclusive rights to industrial fishers, as decided by the government when an ITQ system was established (Edwards Smallridge, 2002).
CHAPTER 3 - TEN TRACKS TOWARDS IMPLEMENTING MARKET MECHANISMS – 75
USING MARKET MECHANISMS TO MANAGE FISHERIES: SMOOTHING THE PATH – ISBN-92-64-03657-1 © OECD 2006
Meanwhile, shifting to a system of individual rights is an opportunity to exchange insecure and ill-defined rights for explicit, guaranteed rights; the latter may make it easier for fishing operators to get financial compensation. Recognised rights can also be used as an asset to be taken into account by financial institutions.
A key factor for the successful introduction of market-like instruments relates to the duration issue. As underlined earlier, duration is important for investments decisions. Duration also has a role to play for the social acceptability of reform. Uncertainty regarding duration (the validity period of fishing rights) may make fishing firms less willing to shoulder short-term costs in order to make long-term profits. For example, in Australia, a decisive factor in the acceptance of individual rights systems has been the explicit commitment by the government that the legislation recognise the perpetuity of existing privileges and that allocated rights will not be re-allocated by public auction.
When the initial allocation of exclusive rights is free of charge, the first generation will receive a share of the rent (windfall effect). Subsequent generations will have to purchase their rights on the market. This may be a source of resistance from some stakeholders
In several countries, the introduction of market-like instruments (especially ITQ systems) has gone hand in hand with the recognition of aboriginal access rights. In New Zealand, Maori organisations went before the courts and claimed that the allocation of individual fishing rights ran counter to the terms of the Waitangi Treaty, signed on behalf of the Queen of England in 1840 and giving Maori tribes full and exclusive ownership of their lands, forests and fisheries. Although the Maori claims had never come to count under the previous open access regime, the individual fishing rights system gave them new grounds. The Court recognised that by allocating individual fishing rights to non-Maoris, the new system was in breach of existing collective property rights. This ruling prompted the government to help the tribes acquire shares in fishing and processing firms, making them a major partner in New Zealand fisheries (O’Regan, 1997). On the Pacific coast of Canada, conflicts between indigenous and commercial and recreational fishers led the courts to recognise that the indigenous people had been granted special rights, and that these rights and conservation needs took precedence over those of commercial fishers. The court decisions do not make it clear, however, whether the indigenous people are entitled to sell the catch by virtue of their special rights (Braker, 1997).
76 – CHAPTER 3 - TEN TRACKS TOWARDS IMPLEMENTING MARKET MECHANISMS
USING MARKET MECHANISMS TO MANAGE FISHERIES: SMOOTHING THE PATH – ISBN-92-64-03657-1 © OECD 2006
Track 5: Pragmatically using market forces
Market based mechanisms are increasingly used in the management of natural resources (e.g. air and water pollution, biodiversity conservation, etc.). Examples in particular include emission trading or tradable permits scheme, such as the well-known RECLAIM programme in the USA17 and the recent EU-ETS CO2 system which was developed as part of the Kyoto protocol. Both ex-ante and ex post analysis of tradable permits and other market-based schemes show that several criteria have to be taken into account when considering the introduction (and the assessment) of a new market-like instrument. These include, the level of transferability, the structure and size of the market and associated issues such as the operating/running costs of the market (including transaction costs), and the “banking” possibility (i.e. the possibility to bank carryover or quotas overrun)18.
This section primarily concerns those market-like instruments that are transferable (ITE, ITQ). They may nevertheless be of interest for all policy makers considering the introduction of some degrees of transferability in those instruments that are in principle not transferable (e.g. IE and IQ).
Transferability:
As discussed in Chapter 1, transferability is important in the design of market mechanisms for at least three reasons:
� Long term transferability can facilitate structural adjustment, by allowing market forces to select the most profitable fishing operators.
� Short term transferability allows for the flexibility of the system (i.e. ensure the most appropriate use of the rights). For example, short term transferability is useful when a fisher happens to become sick or whose vessel breaks down for a short period but can still obtain some income or compensation by renting out the use rights for a short period.
� Transferability allows for the revelation of the true/right value of the fishing right to be revealed in the market place (even if strategic behaviours can occur and affect the price as in any market). When the information is monitored and recorded by the management authorities, this provides indications on both the shadow value and the state of the resource, which can be particularly useful for the fishery manager. In addition, by providing the use right an explicit/official price, transferability allows the value of the right to be included in the fishing company asset (providing legal prescription), as it is the case in Australia, UK and New Zealand for examples. In such cases, transferability allows for improving the level of transparency needed for appropriate management decisions. Otherwise, i.e. when the right is implicit, its value can be capitalised in the price of the fishing vessel (e.g. in France).
17 The Regional Clean Air Incentives Market (“RECLAIM”) is one of the most complex experiences of emissions trading programmes. It was developed for the Los Angeles air basin and began in 1994. For further details see (ref. EPETP).
18 Other frequent aspects such as the overall efficiency of the market or the creation of market-power (see Track 6 below) are not discussed in this section.
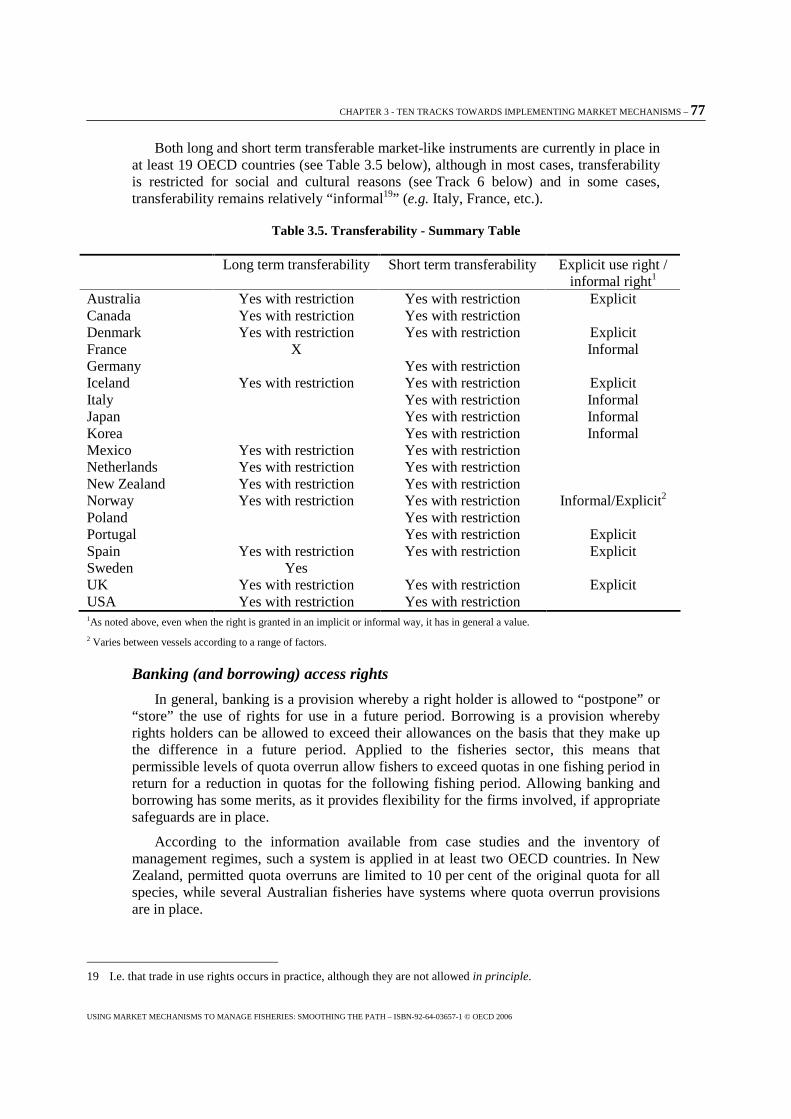
CHAPTER 3 - TEN TRACKS TOWARDS IMPLEMENTING MARKET MECHANISMS – 77
USING MARKET MECHANISMS TO MANAGE FISHERIES: SMOOTHING THE PATH – ISBN-92-64-03657-1 © OECD 2006
Both long and short term transferable market-like instruments are currently in place in at least 19 OECD countries (see Table 3.5 below), although in most cases, transferability is restricted for social and cultural reasons (see Track 6 below) and in some cases, transferability remains relatively “informal19” (e.g. Italy, France, etc.).
Table 3.5. Transferability - Summary Table
Long term transferability Short term transferability
Explicit use right / informal right1
Australia Yes with restriction Yes with restriction Explicit Canada Yes with restriction Yes with restriction Denmark Yes with restriction Yes with restriction Explicit France X Informal Germany Yes with restriction Iceland Yes with restriction Yes with restriction Explicit Italy Yes with restriction Informal Japan Yes with restriction Informal Korea Yes with restriction Informal Mexico Yes with restriction Yes with restriction Netherlands Yes with restriction Yes with restriction New Zealand Yes with restriction Yes with restriction Norway Yes with restriction Yes with restriction Informal/Explicit2 Poland Yes with restriction Portugal Yes with restriction Explicit Spain Yes with restriction Yes with restriction Explicit Sweden Yes UK Yes with restriction Yes with restriction Explicit USA Yes with restriction Yes with restriction 1As noted above, even when the right is granted in an implicit or informal way, it has in general a value.
2 Varies between vessels according to a range of factors.
Banking (and borrowing) access rights
In general, banking is a provision whereby a right holder is allowed to “postpone” or “store” the use of rights for use in a future period. Borrowing is a provision whereby rights holders can be allowed to exceed their allowances on the basis that they make up the difference in a future period. Applied to the fisheries sector, this means that permissible levels of quota overrun allow fishers to exceed quotas in one fishing period in return for a reduction in quotas for the following fishing period. Allowing banking and borrowing has some merits, as it provides flexibility for the firms involved, if appropriate safeguards are in place.
According to the information available from case studies and the inventory of management regimes, such a system is applied in at least two OECD countries. In New Zealand, permitted quota overruns are limited to 10 per cent of the original quota for all species, while several Australian fisheries have systems where quota overrun provisions are in place.
19 I.e. that trade in use rights occurs in practice, although they are not allowed in principle.
78 – CHAPTER 3 - TEN TRACKS TOWARDS IMPLEMENTING MARKET MECHANISMS
USING MARKET MECHANISMS TO MANAGE FISHERIES: SMOOTHING THE PATH – ISBN-92-64-03657-1 © OECD 2006
Operating/running costs of the market-like systems:
One important issue when introducing a new market-like instrument is to consider the associated costs. In short, both administrative and transaction costs are involved and the aim for policy makers is to minimise both.
Tradable permit schemes based on output regulation (e.g. ITQ system in the fisheries case) can result in an increase of costs of the monitoring and control of the activity of fishers (see for instance the Canadian and Spanish contributions). This possibility needs to be balanced against the potential benefits flowing from the increase in resource rents resulting from the use of tradable quotas. In principle, policy makers need to ensure that the expected net benefits from the policy change will be positive. An additional question relates to who should pay for the extra costs of enforcement. Several countries (including Australia, Iceland and New Zealand) have instituted cost recovery schemes to help offset the costs of such administering and enforcing ITQ systems, while recognising that ITQs results in increased resource rents to the industry.
In some fisheries, alternative tradable systems based on input regulation may be less costly to implement. This is particularly the case for sedentary species (such as crab and lobster) but has also been used for some pelagic fisheries (such as the Spanish transferable days-at-sea system for the 300s fleet). Such systems basically consist in converting fishing possibilities (individual catch quotas) into fishing capacities (individual effort quotas).
CHAPTER 3 - TEN TRACKS TOWARDS IMPLEMENTING MARKET MECHANISMS – 79
USING MARKET MECHANISMS TO MANAGE FISHERIES: SMOOTHING THE PATH – ISBN-92-64-03657-1 © OECD 2006
Track 6: Overcoming the “excessive consolidation” question
The potential for the concentration of fishing rights as a result of the introduction of market-like instruments is often a concern and a source of resistance to the reform of fisheries management systems. The key issues relate to concerns that:
� Concentration of market power may lead to anti-competitive behaviour and resulting net societal losses (as described, for example, in the US antitrust law);
� Concentration of rights in the hands of the biggest operators will have adverse impacts on smaller operators;
� Employment and income will be reduced in small-scale fishing communities; and that
� “Tenant fishing” systems may emerge, where fishers pay rights holders for access (this has been the subject for discussion in several OECD countries, including Iceland, New Zealand, UK20 and Canada.21).
However, as shown in Figure 3.1 a reduction in fisheries employment has been observed in almost all OECD countries during the past decade, irrespective of the management systems in place. Reduction in employment primarily results from ageing and “natural attrition”22, so that the potential impact on employment of the introduction of market-like instruments is not easy to isolate. While longer time series may help clarifying the issue, it suggests that no single market-like instrument should be feared for its negative effects on employment. When discussing the introduction of market-like instruments, the “employment argument” can thus easily be refuted by looking at the fisheries employment statistics.
With respect to concerns over concentration, it should be underlined that economic concentration is a phenomenon not confined to fisheries alone, but is generally accepted, within certain limits, throughout the economy. In this regard, the US case study concludes that “consolidation is comprehensive and manageable”, and underlines that “unless the potential for market power exists in the harvesting sector of a fishery, rational management should result in an improvement in economic efficiency”. However, the US case study also recognises that “with the existence of market power, consolidation of shares could result in losses in net benefits to society”.
20 In the UK, and especially in Scotland, the so-called “slipper skippers” issue is particularly sensitive (Watson, 2004).
21 As an indicator of the sensitivity of this issue in the US, it should be noted that a bill proposing to prevent such a separation between the two functions (by preventing fishermen from holding shares in perpetuity and excluding other participants by determining that quotas share are not property rights and may be renewed every seven years) was under consideration in July 2005.
22 For example, in Japan, the proportion of those 60+ years was 42% in 1998, 8% higher than in 1993 (OECD Review of Fisheries, 2003).
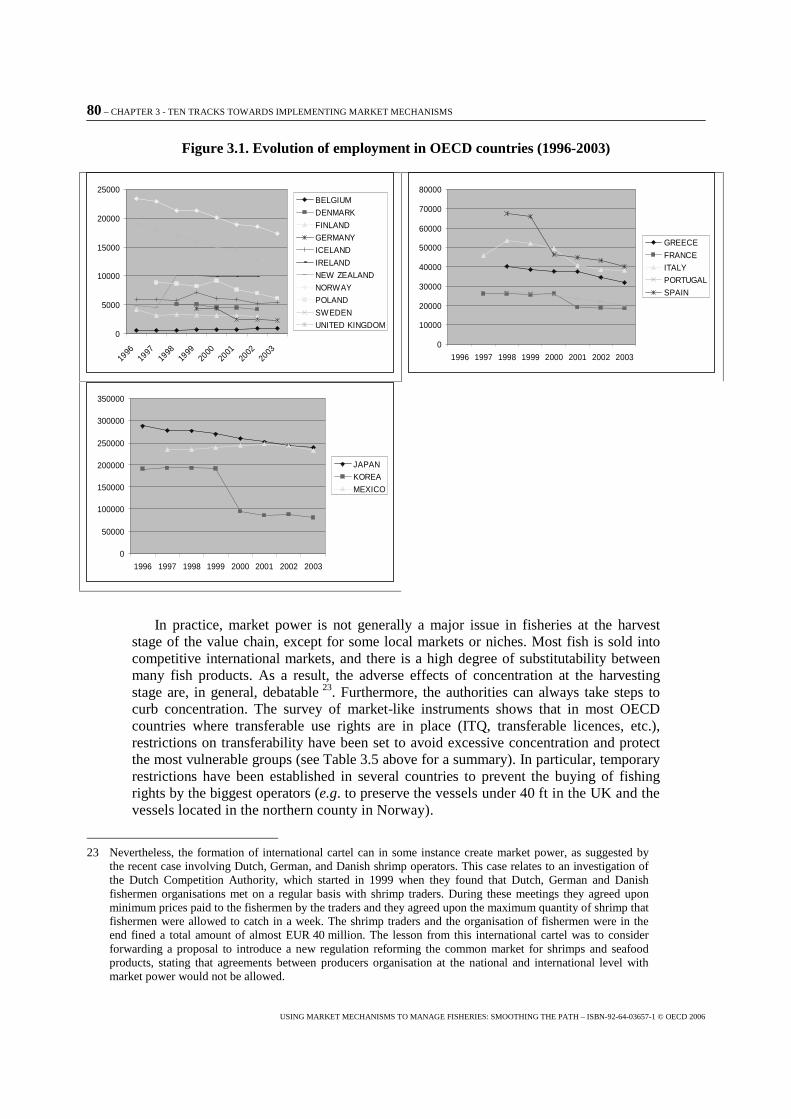
80 – CHAPTER 3 - TEN TRACKS TOWARDS IMPLEMENTING MARKET MECHANISMS
USING MARKET MECHANISMS TO MANAGE FISHERIES: SMOOTHING THE PATH – ISBN-92-64-03657-1 © OECD 2006
Figure 3.1. Evolution of employment in OECD countries (1996-2003)
0
5000
10000
15000
20000
25000
1996
1997
1998
1999
2000
2001
2002
2003
BELGIUM
DENMARK
FINLAND
GERMANY
ICELAND
IRELAND
NEW ZEALAND
NORWAY
POLAND
SWEDEN
UNITED KINGDOM
0
10000
20000
30000
40000
50000
60000
70000
80000
1996 1997 1998 1999 2000 2001 2002 2003
GREECE
FRANCE
ITALY
PORTUGAL
SPAIN
0
50000
100000
150000
200000
250000
300000
350000
1996 1997 1998 1999 2000 2001 2002 2003
JAPAN
KOREA
MEXICO
In practice, market power is not generally a major issue in fisheries at the harvest stage of the value chain, except for some local markets or niches. Most fish is sold into competitive international markets, and there is a high degree of substitutability between many fish products. As a result, the adverse effects of concentration at the harvesting stage are, in general, debatable 23. Furthermore, the authorities can always take steps to curb concentration. The survey of market-like instruments shows that in most OECD countries where transferable use rights are in place (ITQ, transferable licences, etc.), restrictions on transferability have been set to avoid excessive concentration and protect the most vulnerable groups (see Table 3.5 above for a summary). In particular, temporary restrictions have been established in several countries to prevent the buying of fishing rights by the biggest operators (e.g. to preserve the vessels under 40 ft in the UK and the vessels located in the northern county in Norway).
23 Nevertheless, the formation of international cartel can in some instance create market power, as suggested by the recent case involving Dutch, German, and Danish shrimp operators. This case relates to an investigation of the Dutch Competition Authority, which started in 1999 when they found that Dutch, German and Danish fishermen organisations met on a regular basis with shrimp traders. During these meetings they agreed upon minimum prices paid to the fishermen by the traders and they agreed upon the maximum quantity of shrimp that fishermen were allowed to catch in a week. The shrimp traders and the organisation of fishermen were in the end fined a total amount of almost EUR 40 million. The lesson from this international cartel was to consider forwarding a proposal to introduce a new regulation reforming the common market for shrimps and seafood products, stating that agreements between producers organisation at the national and international level with market power would not be allowed.
CHAPTER 3 - TEN TRACKS TOWARDS IMPLEMENTING MARKET MECHANISMS – 81
USING MARKET MECHANISMS TO MANAGE FISHERIES: SMOOTHING THE PATH – ISBN-92-64-03657-1 © OECD 2006
Under tenant fishing systems, fishers have to pay a fee to use the fishing rights hold by the right holders. This may be seen by some as “unfair” although it should be recalled that paying for the use of a resource is a necessary condition for its efficient use as market value of the fisheries resource can be established. Subsequently this may also serve to benchmark the calculation of access fees.
82 – CHAPTER 3 - TEN TRACKS TOWARDS IMPLEMENTING MARKET MECHANISMS
USING MARKET MECHANISMS TO MANAGE FISHERIES: SMOOTHING THE PATH – ISBN-92-64-03657-1 © OECD 2006
Track 7: Using the “demonstration effect” (drawing on experience)
The fear of change is often an obstacle to policy reform. The use of market mechanisms may present a challenge to stakeholders in the sector (including fisheries managers, fishers and environmental groups) who may have had no direct experience with the use of such policy instruments. Unlike other sectors, some degree of uncertainty about the outcomes of policy reform often prevails in the fisheries sector as a result of a lack of ex-ante and ex post information available to fisheries managers (Le Gallic, 2003). Uncertainty can be reduced by the conduct of ex-ante impact assessments, in order to identify the potential welfare gain and the potential beneficiaries and losers of the reform. However, proper impact assessments have a cost that may be considered too high.
An alternative and cheaper way forward to reduce fear and overcome this obstacle can consist in providing evidence of successful implementation of market-like instruments in other jurisdictions. In this respect, several Member countries have based the (gradual) implementation of market-like instruments on such a “demonstration” strategy. This is reflected, for example, in the report on Canadian management system (http://www.oecd.org/dataoecd/11/27/34427924.pdf). Sissenwine and Mace (1992, p. 149) report that in New Zealand, “the success of the Deepwater Enterprise Allocation system contributed to the decision to use ITQs to solve the perceived problems in the inshore fisheries”.
The challenge for policy makers when considering the implementation of a given market-like instrument in a particular fishery is to find examples of success stories of comparable fisheries situation. For example, instruments that have proven successful in the management of sedentary shellfish stocks in one country are likely to be transferable to another country.
Some examples of success stories can be found in previous OECD work (e.g. OECD, 1997). Table 3.6 summarises some of the positive outcomes reported in the case of I(T)Q and limited entry (LL and LTL) systems. The table indicates, among other things, a clear improvement in profitability.
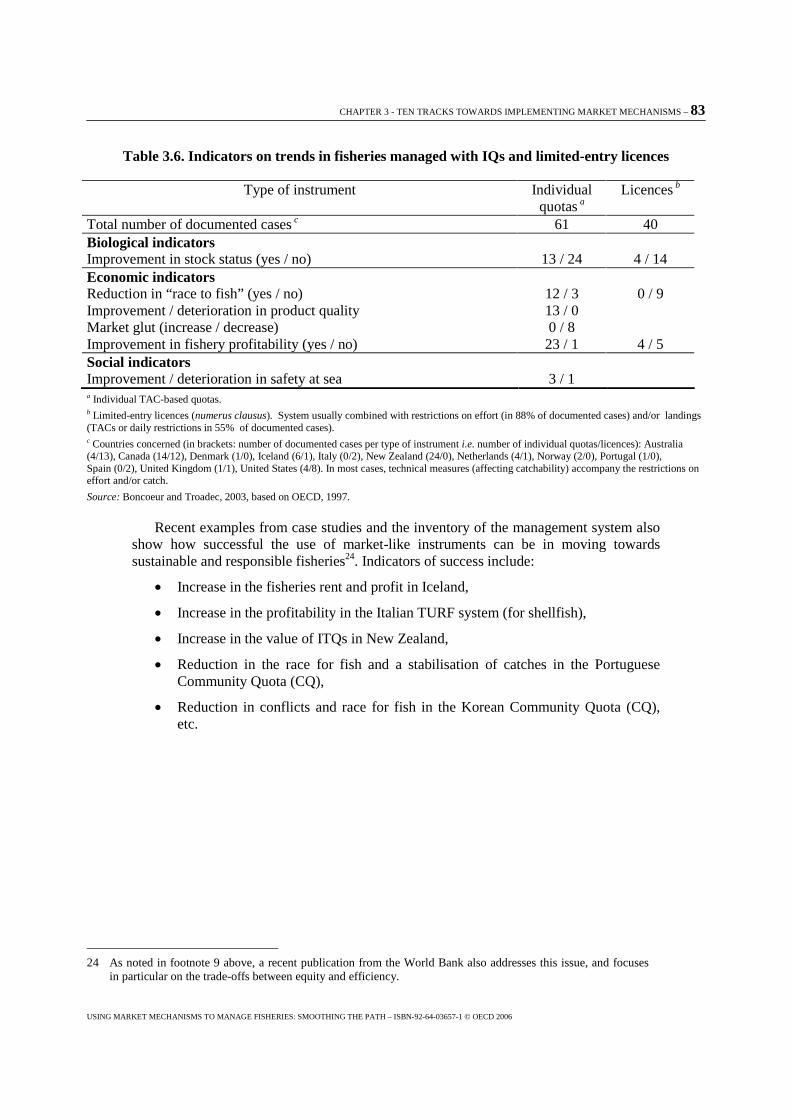
CHAPTER 3 - TEN TRACKS TOWARDS IMPLEMENTING MARKET MECHANISMS – 83
USING MARKET MECHANISMS TO MANAGE FISHERIES: SMOOTHING THE PATH – ISBN-92-64-03657-1 © OECD 2006
Table 3.6. Indicators on trends in fisheries managed with IQs and limited-entry licences
Type of instrument Individual quotas a
Licences b
Total number of documented cases c 61 40 Biological indicators Improvement in stock status (yes / no) 13 / 24 4 / 14 Economic indicators Reduction in “race to fish” (yes / no) 12 / 3 0 / 9 Improvement / deterioration in product quality 13 / 0 Market glut (increase / decrease) 0 / 8 Improvement in fishery profitability (yes / no) 23 / 1 4 / 5 Social indicators Improvement / deterioration in safety at sea 3 / 1 a Individual TAC-based quotas. b Limited-entry licences (numerus clausus). System usually combined with restrictions on effort (in 88% of documented cases) and/or landings (TACs or daily restrictions in 55% of documented cases). c Countries concerned (in brackets: number of documented cases per type of instrument i.e. number of individual quotas/licences): Australia (4/13), Canada (14/12), Denmark (1/0), Iceland (6/1), Italy (0/2), New Zealand (24/0), Netherlands (4/1), Norway (2/0), Portugal (1/0), Spain (0/2), United Kingdom (1/1), United States (4/8). In most cases, technical measures (affecting catchability) accompany the restrictions on effort and/or catch.
Source: Boncoeur and Troadec, 2003, based on OECD, 1997.
Recent examples from case studies and the inventory of the management system also show how successful the use of market-like instruments can be in moving towards sustainable and responsible fisheries24. Indicators of success include:
� Increase in the fisheries rent and profit in Iceland,
� Increase in the profitability in the Italian TURF system (for shellfish),
� Increase in the value of ITQs in New Zealand,
� Reduction in the race for fish and a stabilisation of catches in the Portuguese Community Quota (CQ),
� Reduction in conflicts and race for fish in the Korean Community Quota (CQ), etc.
24 As noted in footnote 9 above, a recent publication from the World Bank also addresses this issue, and focuses in particular on the trade-offs between equity and efficiency.
84 – CHAPTER 3 - TEN TRACKS TOWARDS IMPLEMENTING MARKET MECHANISMS
USING MARKET MECHANISMS TO MANAGE FISHERIES: SMOOTHING THE PATH – ISBN-92-64-03657-1 © OECD 2006
Track 8: Involving stakeholders in the reform process
As discussed above, the fishing industry may be opposed to changes in the economic and social organisation of fisheries for a variety of economic, social and cultural reasons, although the degree of opposition will vary from one fishery to another. The close involvement of the fishing industry and other stakeholders throughout the process of institutional reform is needed to ensure buy-in to policy changes. The involvement of stakeholder groups in the process can improve the chances that a shared “ownership” of both the process and the outcome can be achieved. This may have two clear benefits:
� Drawing stakeholders into the initial allocation process (see above track 4) can contribute to minimising conflicts related to distributional and equity issues; and
� Involving stakeholders in the management process can help to reduce long term compliance costs25 .
The inventory of fisheries management systems and evidence from the case studies reveals that the industry participates in different steps of the implementation process in most jurisdictions. In Norway, for example, cooperation between the government and the different interest groups is an embedded feature of all policy making. This applies to the fishing sector as well, where the government consults the industry on a regular basis through formalised interactions and involves the industry in the design and implementation of changes. In the USA, France and Iceland, it is compulsory to consult fishers and other stakeholders prior to the modification of management systems, while in Australia, industry is involved in the development of management plans through a formal consultative process that makes recommendations directly to the Board of the Australian Fisheries Management Authority.
The involvement of industry stakeholders is made much easier if the industry themselves are actively pushing for reforms to occur. This has been the case in Canada, The Netherlands, Iceland and New Zealand where it was observed that the industry acted as a driving force for change. Going a step further, right holders in New Zealand grouped together in companies in order to finance some research activities (e.g. in the case of the rock lobster and hoki fisheries).
The survey also indicated that accompanying mechanisms have been used to facilitate the social acceptability of reform. These include the provision of compensation to those affected by reform through the buy-back of newly introduced fishing rights, either:
� through “industry-funded” capacity reduction schemes, as is the case in Norway under the UQS and SQS variants of the IQ system,26 and more generally under transferable schemes when the use rights are explicitly recognised (e.g. ITQ and ITE systems); or
25 See for example the OECD Committee for Fisheries work on management costs. (OECD, 2003).
26 In the case of Norway, no new fishing rights have been issued as a result of the UQS or SQS. The time limit of the UQS, the deduction rules of SQS and geographical and concentration limitations to both systems are partly included for social acceptability purposes, but not because someone is expected to be negatively affected by them.
CHAPTER 3 - TEN TRACKS TOWARDS IMPLEMENTING MARKET MECHANISMS – 85
USING MARKET MECHANISMS TO MANAGE FISHERIES: SMOOTHING THE PATH – ISBN-92-64-03657-1 © OECD 2006
� by governments in order to facilitate and accelerate the adjustment process, as happened for example in New Zealand27 and in Canada for indigenous fisheries. The EU decommissioning schemes can be considered as a way of buying back informal use rights.
Additional actions have also been implemented to facilitate the social acceptability of new management schemes, such as training, diversification of the activity and capacity building initiatives (see, for example, the discussion of social capital in OECD 2006).
While the involvement of stakeholders in the reform process is considered necessary by most observers, several issues need to be taken into account. First, it is important to ensure that a clearly articulated vision of the range of possible outcomes of the reform is given to stakeholders. As reform is likely to produce some losers, it is important to clarify how negative short-term economic and social effects will be mitigated (if at all). Hence, for the policy makers steering or driving the reform, it is important to invest time and effort up-front to ensure successful implementation. This will require the conduct of impact scenarios as discussed in Track 7.
Second, involving stakeholders in the reform process will carry a cost depending on the social, organisational and geographical characteristics of the fisheries. For example, reform involving less than 2 000 fishing operators (e.g. in Iceland and New Zealand) is likely to be easier and less costly than when more than 100 000 fishing operators are concerned (e.g. in Korea, Japan and Mexico). In most countries, the reform situation is likely to be fisheries specific with a wide variation on the number of fishing operators. This may also explain why different market-like instruments can coexist in a given country (see Track 3).
Finally, the buy-back of fishing rights introduced by governments in order to facilitate and accelerate the adjustment process may have positive effects in improving the social acceptability of adjustment. However, it also carries a cost for the society as a whole as the buy-back will have to be funded from general revenues. There may also be a longer term issue as the expectations of ongoing government assistance become embedded in the expectations of fishers, distorting the short-term incentive structure.
27 Where a quota “buyback” of NZD 42.4 million was bought by the Government in 1986 (Sissenwine and Mace, 1992).
86 – CHAPTER 3 - TEN TRACKS TOWARDS IMPLEMENTING MARKET MECHANISMS
USING MARKET MECHANISMS TO MANAGE FISHERIES: SMOOTHING THE PATH – ISBN-92-64-03657-1 © OECD 2006
Track 9: Integrating fisheries characteristics
The choice of market-like instrument will also depend on the particular fisheries characteristics, including (a) the extent of natural fluctuation, (b) the degree of biological and technical interactions (single-species vs. multi-species fisheries), (c) the nature of the resource exploited (migratory vs. sedentary), as well as (d) the trade characteristics of the fishery (export led vs. local consumption).
a) Natural fluctuations
In general, natural fluctuations in resources make it rather difficult for policy makers to decide on permanent, fixed quantity of use rights.28 Consequently, the majority of systems analysed for this study allocate fixed percentages of a TAC or TAE which are subject to periodical review. Depending on the duration characteristic, these formulae can enable rights to be allocated to fishing firms for an indefinite period of time. Other possible formulae include allocating fixed individual rights for a set period and adjusting the volume according to year-on-year stock variability, either by re-issuing rights as they expire or by buying back surplus rights and issuing additional rights (IQ and ITQ in Australia, Canada, Iceland, Italy, the Netherlands, Portugal, USA; effort (capacity units) quotas in the UK, days-at-seas quotas in Spain, France).
In addition to such formulas, some mechanisms can usefully be introduced to limit the impact of natural stock variability on fishing operators, thus improving the stability and the social acceptability of the scheme. An interesting example is the “buffer” factor introduced in Iceland in 2000, stipulating that fluctuations in annual cod TAC shall not exceed 30 000 tonnes from one year to the next. Another example of a “buffer” can be found in the EU as part of the recovery plan for cod and hake. Other examples relate to the establishment of a “reserve” quota, i.e. a part of the national TAC that is not directly allocated and that can be drawn on in case of necessity. Such “reserve” mechanisms exist under different forms in Iceland29, in the UK (Producer Organisation schemes), in Italy (bluefin tuna quotas earmarked for possible compensations - UNCL). In the quota negotiations between Norway and Russia on TAC of North-east Arctic cod, the TAC level is set for a 3-year period to eliminate some of the natural fluctuations and provide more stability for fishers.
b) Multispecies fisheries
Due to the multispecies nature of most fisheries, some market-like instruments are difficult to use for technical reasons (e.g. the by-catch problem in IQ and IRQ systems). Available information shows that several mechanisms can be introduced into the design of market-like instruments to address the problem of multispecies fisheries, including:
28 The problem is not the natural fluctuation in itself, but rather the difficulty of anticipating it or associating probability to it.
29 A provision was introduced in 2002 in Iceland into the Fisheries Management Act providing for demersal harvest rights amounting to 12 000 cod-equivalent tonnes of ungutted fish to be available each fishing year to offset major disturbances which are anticipated due to sizeable fluctuations in the catch quotas of individual species. Of these 12 000 tonnes, the Minister may allocate as much as 1 500 cod-equivalent tonnes of ungutted demersal species to areas which have suffered setbacks due to downturns in their fisheries.
CHAPTER 3 - TEN TRACKS TOWARDS IMPLEMENTING MARKET MECHANISMS – 87
USING MARKET MECHANISMS TO MANAGE FISHERIES: SMOOTHING THE PATH – ISBN-92-64-03657-1 © OECD 2006
� Converting all catches into a standard unit (e.g. cod-equivalent in Iceland). Such a strategy may however only work in some circumstances (e.g. when relatively fixed relationships exist between species).
� Introduce “by-catch quotas”, as in the EU industrial sprat fisheries that have a high by-catch of juvenile herring. In the US, Individual Bycatch Quotas (IBQs) are expressly permitted under the Magnuson-Stevens Act, although it seems that such programs have not yet been implemented.
� Apply a special fee on bycatch species, following the example of “deemed” value used in New Zealand for all species.30
� When dealing with “sequential” fisheries (i.e. fisheries that target the same stock at different time, in different places and at different stage of growth), institutional arrangements can be found to maximise the overall use of the resource (e.g. in the case of crab fisheries in France). While not a multispecies fishery, the Australian southern bluefin tuna fishery provides an example where the introduction of an ITQ system has enabled commercial fishers to move from the west coast, where they had been harvesting small juveniles for sale at a low price to the canning industry, over to the south and east coasts, where they now harvest large specimens for sale to the Japanese sashimi market at a much higher price (Lilburn, 1986; Robinson, 1986).
� Combining several management tools (policy mix), in particular access regulation and technical measures, may also be a way forward.
c) Nature of the resource
The nature of the resource exploited (e.g. migratory vs. sedentary) can influence the choice of market-like instrument. As revealed in the survey, the more sedentary a resource is, the higher the characteristics of some market-like instruments are expected to be. This is for instance the case for TURF, limited (transferable) licences and individual (transferable) effort quotas. When the resource moves across different management areas (migratory), the level of exclusivity in particular decrease.
On the other hand, information available from the survey suggests that individual (transferable) quotas systems are widely used for migratory species, especially those managed under RFMO (see for example the Canadian, Italian and Portuguese IQ systems and the Australian ITQ system for southern bluefin tuna). This demonstrates that domestic fishers can obtain the economic benefits from the use of market mechanisms even when TACs are determined outside the domestic fisheries management arrangements.
d) Trade characteristics
Trade characteristics can also play a role in considering which market-like instrument may best suit a given fishery. This has mainly to do with the enforceability side of the problem (and associated quality of the title). In a fishery which is supplying local markets and characterised by a large number of landing sites, output control may be difficult to effectively enforce. This might plead for the adoption of input based mechanisms such as
30 In New Zealand, fishers may sell the above-quota catch in the normal manner, but must pay the "deemed" value (the value realised in excess of the cost of landing) to the management authority.
88 – CHAPTER 3 - TEN TRACKS TOWARDS IMPLEMENTING MARKET MECHANISMS
USING MARKET MECHANISMS TO MANAGE FISHERIES: SMOOTHING THE PATH – ISBN-92-64-03657-1 © OECD 2006
individual (transferable) effort quotas. However, evidence from the survey suggests that collective management (e.g. CQ) may be more appropriate as the whole community is interested in, and has an economic stake in, the effectiveness of the system (e.g. the case of pooling system in Japan).
On the other hand, when the fishing industry is geographically concentrated and the landing sites are limited in number, output based market-like instruments may constitute the most appropriate alternative. Daily, weekly or monthly vessel catch limits (e.g. in Ireland, UK, Germany and in France) may for instance have some interest, although the survey indicate that such systems restrict the level of flexibility. In this context, a particular attention should be paid to export led fisheries (e.g. in Iceland, The Netherlands and New Zealand). As international trade flows are in general easier to monitor than catches, the use of individual (transferable) quotas in such fisheries may be most appropriate.
CHAPTER 3 - TEN TRACKS TOWARDS IMPLEMENTING MARKET MECHANISMS – 89
USING MARKET MECHANISMS TO MANAGE FISHERIES: SMOOTHING THE PATH – ISBN-92-64-03657-1 © OECD 2006
Track 10: Dealing pragmatically with trade-offs
Fisheries are multi-objective activities, serving a variety of social, cultural, political, economic and ecological goals. This nature of fisheries is reinforced in much, if not all, OECD Member country legislation structuring fisheries policy. Based on the evidence presented to this study, this section discusses how policy makers can ease the introduction of new market-like instruments by drawing on the trade-offs. Because the trade off decisions is affected by fisheries settings, resource sustainability and budget constraints, different choices may be made for different fisheries, even in a single given country. In particular, small-scale fisheries are likely to be treated different than large-scale, industrial fisheries (at least on a temporary basis).
Case studies and other available information suggest that the following trade-offs have been considered when considering introducing new market-like instruments:
� Gradual implementation, i.e. the trade-off between the efficiency of the reform (e.g. rebuilding of stocks) and both social acceptability and administrative capacities (including limited resources). This was observed in most countries (see Table 3.4 for selected examples).
� Limits on transferability, i.e. the trade-off between economic efficiency and the social objectives (protection of vulnerable groups, human settlement, and cultural rights)31. This was observed in most countries, although to different extent (see Track 5 and Table 3.5).
� Limits on flexibility, i.e. the trade-off between short-term, private, economic efficiency and long term environmental and biologic objectives (e.g. TED, MPA, etc.), and administrative constraints (e.g. concentration of the number of days at sea for control and monitoring purpose). This was observed in most countries, although to different extent.
� Limits on duration, i.e. the trade-off between economic efficiency and management flexibility. The issue for policy makers is to balance the two factors, based on the economic and social characteristics of the fishery. This explains why the use of sunset provision is considered in several countries. In this regard, it may be interesting to explore the conditioning of the renewal of the rights to compliance or conservation performance criteria.
� Input or output basis of the right (e.g. transferable days at sea vs. ITQ), i.e. the trade-off between the economic efficiency resulting from the “fineness” of a system (e.g. better theoretical divisibility and flexibility of output management) and administrative constraints (e.g. monitoring and control easier for input based management).
� Integrated or top-down decision making, i.e. the trade-off between an upfront involvement of stakeholders in the reform process (more costly in the short run but facilitate the social acceptability and ensures higher levels of compliance in the long run) and a direct command of the reform by the fisheries authorities (in
31 Limits on transferability also apply to processing operators, in order to prevent the development of vertically integrated operations. While such a decision allows for the separation of activities and the stabilization of the harvesting sector, it also prevent economies of scale to occur (e.g. the so-called “fleet separation policy” in Canada).
90 – CHAPTER 3 - TEN TRACKS TOWARDS IMPLEMENTING MARKET MECHANISMS
USING MARKET MECHANISMS TO MANAGE FISHERIES: SMOOTHING THE PATH – ISBN-92-64-03657-1 © OECD 2006
general easier to implement in the short run, but generating higher compliance costs in the long run).
Concluding remarks
The ten tracks have highlighted a number of issues that fisheries managers and policy makers are confronted with when considering introducing market like instruments. Based on the inventory of fisheries management systems and case studies, the discussion of each of the ten tracks has evidenced that many OECD countries follow a pragmatic approach when implementing market like instruments. For those countries that have not yet introduced such instruments, or where there is scope for improved usage, the analysis is rich in examples of how successful reform may come underway.
The ten track method has revealed that the "fear of change" is possibly one of the most important impediments to the introduction of market like instruments. In the meantime, the Study shows that the "fear" factor mainly resides in a lack of understanding of what is, and what is not market like instruments. To this end, this Study has added transparency to the debate regarding market like instruments and shown that such instruments are more commonly in use than it is generally recognised to be the case.
The discussion has been largely based on an analysis of market like instruments using the characteristics of property rights. That methodology has several advantages, including that it is a useful way of organising the information base. Furthermore, the methodology allows for a non-normative, numerical and systematic treatment of diverse management instruments.
If a more comprehensive or systematic study, based on the model explored in the present work, were to be undertaken, it could be used to ascertain if fisheries policies are becoming more responsible and sustainable. It should be noted in this regard that the Committee for Fisheries in its future programme of work will continue to address issues of fisheries policy reform. The analysis in the present study is a useful basis for the future work. In most cases of fisheries reform one outcome will be a reduction of capacity. To ensure that “idle” capacity does not spill over into IUU fishing activities it is important to concurrently have provisions for scrapping in place.
BIBLIOGRAPHY – 91
USING MARKET MECHANISMS FOR MANAGING FISHERIES: SMOOTHING THE PATH– ISBN-92-64- 03657-1 © OECD 2006
Bibliography
Antoine, L. (1995), “Quand la controverse tourne à l’impasse : la guerre du thon”. Nature-Sciences-Sociétés, Vol. 3(1), pp. 6-15.
Angel, J.R. et al., (1994) Report of the Workshop on Scotia-Fundy Groundfish Management from 1977 to 1993’. Canadian Technical report of Fisheries and Aquatic Sciences, 1979; Department of Fisheries and Oceans, Canada, 175 p.
Annala, J.H., (1996) ‘New Zealand’s ITQ system : Have the first eight years been a success or a failure ?’ Reviews in Fish Biology and Fisheries, 6 : 43-62.
Anon, (1994) "The IFQ Program : Insights and Updates". NMFS, February, unpublished paper.
Arnason, R. (1995) “The Icelandic Fisheries : Evolution and Management of a Fishing Industry”. Fishing News Books, Blackwell Science, London.
Arnason, R. (2001), “Modern Fisheries Management”, Paper presented at Seminar on Fisheries Management, Brussels, Jan. 25.
Arnason, R., pers. comm., "Summary Information on the Icelandic Fisheries and Fisheries Management System"
Asada Y., Hirasawa Y. and Nagasaki F. (1983) “Fishery Management in Japan”. FAO, Fisheries Technical Papers, No. 238, 32 p.
Barbara R. et al., (1995) "Scotia-Fundy Inshore Mobile Gear Groundfish ITQ Program". Department of Fisheries and Oceans, unpublished paper, 29 p.
Bergin A. and Haward M., (1994) "Southern Bluefin Tuna Fishery : Recent Developments in International Management", Marine Policy, Vol. 18, n°4 : 263-273.
Beverton R.J.H. and Holt S.J., (1957) “On the dynamics of exploited fish populations”, Fishery Investigations, Series II, vol. 19. HMSO, London.
Bjorndal T. and Munro G. (1998) “The Economics of Fisheries Management: a Survey”. International Yearbook of Environmental and Resource Economics, pp. 153-188.
Boncoeur J. and Mesnil B., (1999) “Surexploitation des stocks et conflits dans le secteur des pêches. Une discussion du « triangle des paradigmes » d’Anthony Charles dans le contexte européen”, Informations et Commentaires n°107, pp.10-17.
Boncoeur, J. and Mesnil, B., (2000) "Quelle politique de la pêche ? L’exemple de l’Union européenne". Problèmes économiques n°2650 : 5-9.
Braker, H., (1997) "How Many Fish can a Sparrow Eat ? – Litigating Aboriginal Rights to Fisheries – The Canadian Experience". Proceedings of the 2nd World Fisheries Congress – ‘Developing and Sustaining World Fisheries Resources : the State of Science and Management’ : 320-324; Brisbane, Australia.
92 – BIBLIOGRAPHY
USING MARKET MECHANISMS TO MANAGE FISHERIES: SMOOTHING THE PATH – ISBN-92-64-03657-1 © OECD 2006
Buisman et al. (2002) "The Management of Fisheries through systems of Transferable Rights", report to the European Parliament, Brussels (2002).
Caddy, J.F. and R. Mahon, (1997) "Reference points for Fishery management". FAO Technical Paper, 347.
Casey, K.E. et al., (1995) "The Effects of Individual Vessel Quotas on the British Columbia Halibut fishery". Marine Resource Economics, 10, 3 : 211-230.
Chapman, D.G., (1973) "Management of International Whaling and North Sea Pacific Fur Seals : Implications for Fisheries Management". Journ. Fish. Res. Board Canada, 30, 12, part 2 : 2419-2426.
Charles A.T., (1992) “Fisheries conflicts : a unified framework”, Marine policy, Sept. 1992, pp.379-393.
Charles A.T., (2001) “Sustainable Fishery Systems”, Fish and Aquatic Resources Series n°5, Blackwell Science, 370 p.
Christy F.T. (1982), “Territorial Use Rights in Marine Fisheries : Definitions and Conditions”. FAO Fish Technical Paper 227.
Christy F.T., (1996) " Paradigms lost: the death rattle of open access and the advent of property rights regimes in fisheries". 8th Biannanual Conference of IIFET (International Institute of Fisheries Economies and Trade), 14-16 July 1996, Marrakech, Morocco, 26 p.
Ciriacy-Wantrup, S.V., (1952) "Resource Conservation : Objectives and Policy". Berkeley, Division of Agricultural Sciences, Univ. California, 395 p.
Clark I. et al., (1989) "The development and implementation of New Zealand’s ITQ management system" in Neher P.A. et al. (eds) Rights based Fishing, NATO ASI Series E : Applied Sci. vol 169, Kluwer Acad. Publ. : 117-145.
Clay P.L. and Revell B.J., (1998) ‘'Input substitution and conservation : a case study of the effects of policy on fishing effort in the Scottish inshore fishery". in Eide A. and Vassdal T. (eds) IIFET’98-Tromsø Proceedings, The Norwegian College of Fishery Science, Tromsø University, Norway, vol. 2 : 492-496.
Coase, R. (1960), “The Problem of the Social Cost”. The Journal of Laws and Economics, Vol. 3(1), pp. 1-44.
Cochrane, K.L. (ed), (2002) "A fishery manager’s guidebook. Management measures and their application". Fish. Techn. Pap. 424; FAO, Rome, 231 p.
Copes P., (1997) "Alternatives in fisheries management". Proceedings of the IXth Annual Conference of the European Association of Fisheries Economists, UBO-CEDEM / ENSAR, Quimper, France : 10-35.
Crothers S., (1986) "Individual Transferable Quotas: the New Zealand Experience" Fisheries, 13 (1) : 10-15.
Crutchfield J.A., (1973) “Economic and Political Objectives in Fishery Management”. Transactions of the American Fisheries Society, n°102(2), pp.481-91.
Cunningham S., Dunn M. R. and Whitmarsh D., (1985) “Fisheries Economics: An Introduction”, Mansell Publishing, London.
BIBLIOGRAPHY – 93
USING MARKET MECHANISMS TO MANAGE FISHERIES: SMOOTHING THE PATH – ISBN-92-64-03657-1 © OECD 2006
Cunningham, S., A. N’Guer and I. Thiam, (1994) "Monopsonic fisheries management : the case of Mauritania". CEMARE Research Paper 68.
Davidse W., (2000) "The development towards co-management in the Dutch demersal North Sea fisheries" in Shotton R. (ed.) Use of property rights in fisheries management. FAO Fisheries Technical Paper 404/1 : 198-202.
Davidse W., (2001) "The effects of transferable property rights on the fleet capacity and ownership of harvesting rights in the Dutch demersal North Sea fisheries" in Shotton R. (ed.) Case studies on the effects of transferable quota rights on fleet capacity and concentration of quota ownership, FAO Fisheries Technical Paper 412 : 15-25.
Doucet F.J., Pearse P.H. and Troadec J.P., (1981) "Mauritanie : Politique de développement et d’aménagement des pêches dans la zone d’économie exclusive" (French version only), FAO, Technical Co-operation Programme. Document FI : TCP/MAU/001, 135 p.
Duncan L., (1995) "Closed competition: fish quotas in New Zealand", The Ecologist, 25 (2/3): 97-104.
EC, (1990) "Report of an independent group of experts on guidelines for the preparation of Multiannual Guidance Programmes in relation to the fishing fleet for the period 1992-1996". DG XIV, Brussels, 37 p.
EC, (1998) "Report of the group of independent experts to advise European Commission on the Fourth Generation of Multiannual Guidance Programmes". DG XIV, Brussels.
EC, (2001) " Green Paper on the Future of the Common Fisheries Policy". Office for Official Publications of the European Communities, Luxembourg, volume I, 53 p.; volume II, 131 p.
EC (2002) "Communication from the Commission on the reform of the Common Fisheries Policy". COM(2002)0181, EC, Brussels.
Edwards R. and Smallbridge M., (2002) "Overcoming the ‘new tragedy of the commons : a commercial framework is inevitable" in Falque M. et al. (eds) Marine resources : property rights, economics and environment, JAI Press : 147-157.
FAO, (1994) "Marine Fisheries and the Law of the Sea: a decade of change". Fisheries Circular No. 853. Rome, 66 p.
FAO (1997) “Fisheries management”. FAO Technical Guidelines for Responsible Fisheries, N°4. Fishery Resources Division and Fishery Policy and Planning Division, FAO, Rome.
FAO (2000), “The state of World Fisheries and Aquaculture”. FAO. Rome.
Francis, M.P., A.D. Langley and D.J. Gilbert, (1997) "Prediction of Snapper (Pagrus auratus) Recruitment from Sea-Surface Temperature". in Proceedings of the 2nd World Fisheries Congress – ‘Developing and Sustaining World Fisheries Resources : the State of Science and Management’ : 67-71; Brisbane, Australia.
French Ministry of Agriculture and Fisheries, (2000) "Les concours publics aux pêches maritimes et aux cultures marines 1994-1999". Paris, 109 p.
Geen G. and Nayar M., (1989) "Individual Transferable Quotas in the Southern Bluefin Tuna Fishery : an economic appraisal". in Neher P.A. et al. (eds) Rights based Fishing, NATO ASI Series E : Applied Sci. vol 169, Kluwer Acad. Publ. : 355-381.
94 – BIBLIOGRAPHY
USING MARKET MECHANISMS TO MANAGE FISHERIES: SMOOTHING THE PATH – ISBN-92-64-03657-1 © OECD 2006
Gertenbach, L.P.D., (1973) "Licence Limitation Regulations : The South African System". Journal of the Fisheries Research Board of Canada, 30, 12 : 2077- 2084.
Gordon H.S., (1954) “The Economic Theory of a Common Property Resource : The Fishery”, Journal of Political Economy, vol. 62, p.124-143.
Guldberg, Mette (eds.). (2000) Fishing for Sandeels. Fiskeri- og Søfartsmuseet og Jens Chr. Top.
Gulland, J.A. (ed.), (1971) "The Fish Resources of the Ocean". Fishing News Books, West Byfleet, UK.
Guyader, O., (2000) Évaluation économique de la régulation de la pêche. Le cas du thon germon de l’Atlantique NE. L’Harmattan, Paris .
Guyader O. and Fifas S., (1999) "Modélisation bioéconomique de la pêcherie de coquille St-Jacques de la baie de St-Brieuc", Rapports scientifiques DRV/RH/IFREMER, 113 p.
Guyader, O. and Thébaud O. (2001) “Distributional Issues in the Operation of Rights-based Fisheries Management Systems”, Marine Policy 25, pp. 103-112.
Hannesson, R., (1983) "Bioeconomic Production Function in Fisheries. Theoretical and Empirical Analysis". Canadian Journal of Fisheries and Aquatic Sciences, 40 : 968-982.
Hannesson, R., (1993) "Bioeconomic Analysis of Fisheries". Fishing News Books, Blackwell Science, London.
Hannesson, R., (1996) "Fisheries Mismanagement : the Case of the North Atlantic Cod". Fishing News Books, Blackwell Science, London.
Hardin, G., (1968) "The Tragedy of the Commons". Science, 62 : 1243-1248.
Harte M. and Bess R. (2000) “The Role of Property Rights in the Development of New Zealand’s Marine Farming Industry”, in Use of Property Right in Fisheries Management, Proceedings of the FishRights99 Conference, Fremantle, Western Australia, 11 - 19 November 1999, FAO 2000.
Hatcher A., Pascoe, S., Banks R. and Arnason R. (2002) "Future options for UK fish quota management". Report 58. CEMARE. Portsmouth.
Hatcher, A. and Robinson, K. (eds), (1999) "Overcapacity, overcapitalisation and subsidies in European fisheries". Proceedings of the first Concerted Action workshop on Economics and the Common Fisheries Policy. Portsmouth (UK), 18-30 October 1998. CEMARE Miscellaneous Publication No. 44 1999: 282 p.
Heen K., (1988) “Norwegian Fishermen Labour Market behaviour and analysis”, Marine policy, Vol. 12 (4), pp. 396 – 407.
Hénaff P., Mettling B., Ménanteau J.P. and Mingasson A., (1995)‘"Rapport d’audit sur la situation financière des navires de pêche artisanale et des organismes d’intervention". French Ministry of Agriculture and Fisheries, Paris, 31 p. + annexes.
Henry, C. and Tubiana, L., (2000)"Instruments économiques dans la perspective du changement climatique". Economie et prévision, 2-3/ 2000, n°143-144 : 1-14.
Hersoug, B. (2002) “The closing of the Norwegian commons”, Paper presented at the 11th biennial conference of the IIFET, August 19-22, Wellington, New Zealand.
BIBLIOGRAPHY – 95
USING MARKET MECHANISMS TO MANAGE FISHERIES: SMOOTHING THE PATH – ISBN-92-64-03657-1 © OECD 2006
Hoefnagel E., (1996) ‘Trade in fishing rights in the Netherlands : a maritime environment market’ in Crean K. and Symes D. (eds) ‘Fisheries management in crisis’, Fishing News Books, Oxford : 61-70.
Hoefnagel, E. and J. Smit, (1997) "Co-Management and Property Rights in the Netherlands". In G. Petursdottir (Ed.), Property Rights in the Fishing Industry. Fisheries Research Industry, University of Iceland Press : 11-24.
Holden, M., (1994) "The Common Fisheries Policy : origin, evolution and future". The Buckland Foundation, Fishing News Books, Oxford.
ICES, (1997) "Report of the ICES Advisory Committee on Fisheries Management, 1996". ICES Coop. Res. Rep. 221.
IFREMER, (2000) "Données économiques maritimes françaises 1999". Plouzané, 95 p.
Jennings S., Kayser M.J. and Reynolds J.D., (2001) Marine Fisheries Biology. Blackwell Sciences, Oxford.
Koslow, J.A., N.J. Bax, C.M. Balman, R.J. Kloser, A.D.M. Smith and A. Williams, (1997) "Managing the Fishdown of the Australian Orange Roughy Resource". in Proceedings of the 2nd World Fisheries Congress – ‘Developing and Sustaining World Fisheries Resources : the State of Science and Management’ : 558-562; Brisbane, Australia.
Lane D.E. (1999), “Applications of Rights-based Fisheries: Experiences and Consequences”. The Definition and Allocation of Use Rights in European Fisheries. Proceedings of the second workshop held in Brest, France, 5-7 May 1999
Lassen, K. and R. Halliday, (1997) "Biological Advice on Fishery Management in the North Atlantic 1970-1995". Proceedings of the 2nd World Fisheries Congress : The State of Fisheries Science and Management, Brisbane, Australia : 273-281.
Laurec A. and Le Guen J.C., (1981) "Dynamique des populations marines exploitées. Volume I, Concepts et méthodes". CNEXO, Rapports scientifiques et techniques n°45-1981, Brest, France.
Le Gallic B. (2001) "Modélisation bioéconomique et gestion durable d’un système complexe de ressources communes renouvelables. Application au cas des pêcheries de la Manche ”. Doctoral thesis, Université de Bretagne Occidentale, 362 pp.
Le Gallic B. (2003): “Why is it difficult for governments to move towards using market-based instruments in fisheries?” XVth Annual EAFE Conference, Brest, 14-16 May 2003.
Leung P., Muraoka J., Nakamoto S.T. and Pooley S. (1998) “Evaluating fisheries management options in Hawaï using analytical hierarchy process (AHP)”, Fisheries Research 36, pp. 171-183;
Lillburn, B., (1986) "Management of Australian Fisheries : broad developments and alternative strategies". in N. Mollet (ed.) Fisheries Access Control Worldwide. Alaska Sea Grant College Program, Fairbanks : 141-187.
Lindner, R.K., H.F. Campbell, and G.F. Bevin, (1992) "Rent Generation during the Transition to a Managed Fishery : the Case of the New Zealand ITQ System". Marine Resource Economics, 7, 4 : 229-248.
96 – BIBLIOGRAPHY
USING MARKET MECHANISMS TO MANAGE FISHERIES: SMOOTHING THE PATH – ISBN-92-64-03657-1 © OECD 2006
Mardle S. and Pascoe S., (1999) “A review of applications of multiple criteria decision-making techniques to fisheries”, Marine Resource Economics, vol.14, pp.41-63.
McCay, B.J., (1995) "Social and Ecological Implication of ITQs : an Overview". Ocean and Coastal Management, 28, 1-3 : 3-22.
McCay, B.J., C.F. Creed, A.C. Finlayson, R. Apostle and K. Mikalsen, (1995) "Individual Transferable Quotas (ITQs) in Canadian and US Fisheries". Ocean and Coastal Management, 28, 1-3 : 85-115.
McColl J.C. and Stevens R.A., (1996) "Australian fisheries management authority : organisational structure and management philosophy" in Hancock D.A., Smith D.C., Grant A. and Beumer J.P. (eds) Developing and sustaining world fisheries resources : the state of science and management, 2nd World Fisheries Congress Proceedings, CSIRO Australia.
Miller K., Allegrety M.H., Johnson N. and Jonsson B., (1995) "Measures for conservation of biodiversity and sustainable use of its components" in Heywood V.H.and Watson R.T. Global Biodiversity Assessment. Cambridge University Press : 1915 -..
Morgan, G.R., (1997) "Optimal Allocation of Fisheries Quotas". Proceedings of the 2nd Fisheries Congress ‘Developing and Sustaining World Fisheries Resources : The State of Science and Management, 363-369. Brisbane, Australia.
Morizur Y., Pouvreau S. and Guénolé A., (1996) "Les rejets dans la pêche artisanale française de la Manche occidentale". Ifremer, 127 p.
Murasawski S.A. (2000) “Definition of Overfishing from an Ecosystem Perspective”. ICES Journal of Marine Science 57 : 649-658.
Muse B., (1991) "Survey of Individual Quota Programs", Alaska Commercial Fisheries Entry Commission, Juneau, Alaska.
O’Boyle R. and Zwanenburg K.C.T., (1997) "A comparison of the benefits and costs of quota versus effort-based fisheries management" in Hancock D.A., Smith D.C., Grant A. and Beumer J.P. (eds) Developing and sustaining world fisheries resources : the state of science and management, 2nd World Fisheries Congress Proceedings, CSIRO Australia.
OECD, (1989) Renewable natural resources. Economic incentives for improved management. Paris, 158 p.
OECD (1993) The Use of Individual Quotas in Fisheries Management, Paris, 222 p.
OECD, (1994) Project and policy appraisal: integrating economics and environment. Paris.
OECD, (1997)‘Towards Sustainable Fisheries. Economic Aspects of the Management of Marine Living Resources. Paris, 268 p.
OECD, (2000) Transition to Responsible Fisheries. Paris, 272 p.
OECD, (2003) Review of Fisheries in OECD Countries, Policies and Summary Statistics.
O’Regan, Sir Tipene, (1997) "Maori Fisheries Rights and the Quota Management System". Proceedings of the 2nd World Fisheries Congress – Developing and Sustaining World Fisheries Resources: the State of Science and Management, 325-328; Brisbane, Australia.
BIBLIOGRAPHY – 97
USING MARKET MECHANISMS TO MANAGE FISHERIES: SMOOTHING THE PATH – ISBN-92-64-03657-1 © OECD 2006
Palsson, G. and A. Helgason, (1995) ‘Figuring Fish and Measuring Men : The Individual Transferable Quota System in the Icelandic Cod Fishery’. Ocean &Coastal Management, 28, 1-3 : 117-146.
Pauly, D., V. Christensen, J. Dalsgaard, R. Froese and F. Tores Jr, (1998) "Fishing down marine food webs". Science, 279 : 860-863.
Pascoe S. (ed.), (2000) "Bioeconomic Modelling of the Fisheries of the English Channel". European research programme FAIR CT 96-1993, Final Report. CEMARE, University of Portsmouth, 162 p.
Pearse P.H., (1991) "Building on Progress : Fisheries Policy Development in New-Zealand", Ministry of Agriculture and Fisheries, Wellington, New-Zealand, 28 p.
Pigou, A.C., (1920) Economics of Welfare, McMillan, London.
Robinson, W.L., (1986) "Individual Transferable Quotas in the Southern Bluefin Tuna Fishery". in N. Mollet (ed.) Fisheries Access Control Worldwide. Alaska Sea Grant College Program, Fairbanks: 189-205.
Ross, D.M. and D.C. Smith, (1997) "The Australian Orange Roughy Fishery : A Process of Better Resource Management". Proceedings of the 2nd Fisheries Congress on ‘Developing and sustaining world Fisheries resources : the state of science and management: 256-260; Brisbane, Australia.
Schlager, E.and E. Ostrom, (1992) "Property Rights Regimes and Natural Resources : A Conceptual Analysis". Land Economics, 68, 3: 249-262.
Schmidt C.C. (2003) "Fisheries and Japan: A case of multiple roles?" Paper presented at the International Symposium on Multiple Roles and Functions of Fisheries and Fishing Communities, Aomori, Japan, 13 Feb. 2003, 18 p.
Schaefer M.B., (1957) “Some considerations of population dynamics and economics in relation to the management of commercial marine fisheries”, Journal of the Fisheries Research Board of Canada, n°14, pp.669-681.
Scott, A., (1955) "The Objectives of Sole Ownership". Journal of Political Economics, 63, 2 : 116-124.
Scott A. (1988) “Development of Property in the Fishery”, Marine Resource Economics, vol.5, pp. 289-311
Scott (2000) “Introducing Property in Fishery Management”, in Use of Property Right in Fisheries Management, Proceedings of the FishRights99 Conference, Fremantle, Western Australia, 11-19 November 1999, FAO 2000.
Sinclair, M., R. Boyle, D.L. Burke and G. Peacock, (1997) "Why Do Some Fisheries Survive and Others Collapse?". In D.A. Hancock, D.C. Smith, A. Grant and J.P. Beumer – Developing and Sustaining World Fisheries Resources. The State of Science and Management’. Proceedings of the 2nd World Fisheries Congress, Brisbane, Australia, 1996:23-35.
Sissenwine, M.P. and P.M. Mace, (1992) "ITQs in New Zealand: The Era of Fixed Quota in Perpetuity". Fishery Bulletin, US, 92: 147-160.
Slotte, A. and A. Johannessen, (1997) "Exploitation of Norwegian Spring-Spawning Herring (Clupea harengus L.) Before and After the Stock Decline : Towards a Size-Selective Fishery". Proceedings of the 2nd World Fisheries Congress – ‘Developing
98 – BIBLIOGRAPHY
USING MARKET MECHANISMS TO MANAGE FISHERIES: SMOOTHING THE PATH – ISBN-92-64-03657-1 © OECD 2006
and Sustaining World Fisheries Resources: the State of Science and Management: 103-108; Brisbane, Australia.
Smit, J., (1996) "The Economics of Fisheries Management. A Case Study: the Dutch Co-Management System". EAFE Conference, Barcelona, 1-3 April, 12 p.
Song, Y.H., (1997) “The Canadian-European Union Turbot Dispute in the Northwest Atlantic: an Application of the Incident Approach”. Ocean Development and International Law, 28: 269-311.
Squires, D., (1987) "Fishing Effort: Its Testing, Specification and Internal Structure in Fisheries Economics and Management" Journal of Environmental Economics and Management, 14: 268-282.
Stephenson, R.L., (1997) "Successes and Failures in the Management of Atlantic Herring Fisheries: Do We Know Why Some have Collapse and Others Survive?" in Proceedings of the 2nd World Fisheries Congress – Developing and Sustaining World Fisheries Resources : the State of Science and Management : 49-54; Brisbane, Australia.
Terry, J.M., (1993) "Individual Transferable Quotas for the fixed-gear sablefish and halibut fisheries of Alaska" in The Use of Individual Quotas in Fisheries Management, OECD, Paris: 101-130.
Troadec and Boncoeur, (2003) “Economic Instruments for Fisheries Management”, unpublished report to the OECD.
van Bueren M.S., Lindner R.K. and McLeod P.B., (1997) 'An economic assessment of reallocating salmon and herring stocks from the commercial sector to the recreational sector in Western Australia’ in Hancock D.A., Smith D.C., Grant A. and Beumer J.P. (eds) Developing and sustaining world fisheries resources : the state of science and management, 2nd World Fisheries Congress Proceedings, CSIRO Australia : 358-362.
van Ginkel, R., (1991) "The Musselmen of Yerseke: an Ethno-Historical Perspective". In J.R. Durand, J. Lemoalle and J. Weber (eds.) La recherche face à la pêche artisanale. IRD, Paris: 852-867.
Wang, S., (1995) "The Surf Clam ITQ Management: an Évaluation". Thalassorama, Marine Resources Economics, 10, 1 : 93-98.
PART II - SURVEY OF THE USE OF MARKET MECHANISMS IN OECD COUNTRIES – 99
USING MARKET MECHANISMS TO MANAGE FISHERIES: SMOOTHING THE PATH – ISBN-92-64-03657-1 © OECD 2006
PART II
SURVEY OF THE USE OF MARKET MECHANISMS IN OECD COUNTRIES1
1 When referring to this chapter from now on in the text, the author uses the term "the survey".

PART II - SURVEY OF THE USE OF MARKET MECHANISMS IN OECD COUNTRIES – 101
USING MARKET MECHANISMS TO MANAGE FISHERIES: SMOOTHING THE PATH – ISBN-92-64-03657-1 © OECD 2006
Introduction
This chapter provides a review of the use of market-like instruments in OECD countries. The objectives pursued are threefold. First, the chapter aims at understanding the extent to which market-like instruments are used in OECD countries. Second, the chapter clarifies the way market-like instruments are designed in selected Member countries, in order to identify both common features across countries’ experiences and highlight recent innovations that may contribute to the regulator’s tool box. Third, the chapter seeks at helping policy makers to understand how different fisheries management systems can in principle contribute to the transition towards sustainable and responsible fisheries. By doing so, it also allows policy makers to identify areas where further progress may still be achieved.
Sixteen selected countries are dealt with in this chapter: Iceland, Norway, eight EU Countries (Germany, the Netherlands, Sweden, United Kingdom, Italy, France, Denmark and Spain), Japan and Canada. A review of the Greenland fisheries management system is also included. The survey will subsequently be enlarged to take into account both outstanding countries and complementary information2.
II.1. Iceland3
Technical measures to maintain fish stocks productivity
To maintain stocks’ productive and reproductive capacity, Total Allowable Catch (TAC) represents the cornerstone of the management system. Currently, 24 species (and well over 30 sub-stocks) that are found primarily within the Icelandic EEZ are subject to TAC. These species account for over 97% of the value of harvest taken within the EEZ. The Minister of Fisheries determines the Total Allowable Catch (TAC) for each species for which the Marine Research Institute feels a TAC is necessary. The TAC decision is made on the basis of recommendations from the Marine Research Institute. In recent years the Ministry of Fisheries has followed the recommendations of the Marine Research Institute quite closely. Stocks not currently subject to TAC can be fished without any restriction (open access).
Several commercially important species are straddling stocks evolving both inside and outside the EEZ. Other stocks can be found outside the EEZ and in few cases in distant waters. When an international agreement exists for the utilization of these species, a TAC for Iceland is determined. Even in cases where no international agreement concerning the utilization of the shared stock exists, Iceland frequently decides to impose a TAC on Icelandic vessels.
In addition to the TAC system, there are a number of other measures designed to improve the sustainable yield of the stocks. This includes the type of fishing gear permitted (e.g. the minimum and maximum mesh size; the prohibition of bottom trawl in spawning and nursery areas), the mandatory use of sorting grids in certain fisheries to
2 Several countries that have submitted information related to their management systems are not yet included in this chapter because available information does not allow application of the organisational framework.
3 See country submission for further details on the OECD Fisheries public web site: www.oecd.org/agr/fish
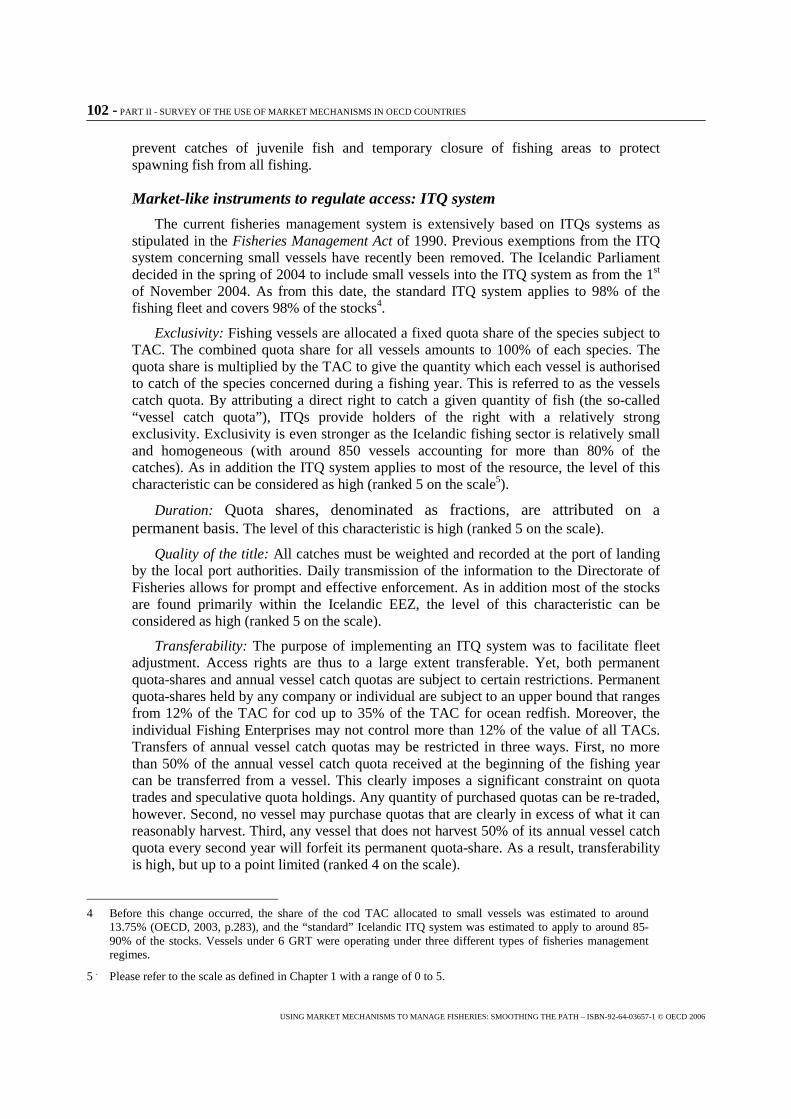
102 - PART II - SURVEY OF THE USE OF MARKET MECHANISMS IN OECD COUNTRIES
USING MARKET MECHANISMS TO MANAGE FISHERIES: SMOOTHING THE PATH – ISBN-92-64-03657-1 © OECD 2006
prevent catches of juvenile fish and temporary closure of fishing areas to protect spawning fish from all fishing.
Market-like instruments to regulate access: ITQ system
The current fisheries management system is extensively based on ITQs systems as stipulated in the Fisheries Management Act of 1990. Previous exemptions from the ITQ system concerning small vessels have recently been removed. The Icelandic Parliament decided in the spring of 2004 to include small vessels into the ITQ system as from the 1st of November 2004. As from this date, the standard ITQ system applies to 98% of the fishing fleet and covers 98% of the stocks4.
Exclusivity: Fishing vessels are allocated a fixed quota share of the species subject to TAC. The combined quota share for all vessels amounts to 100% of each species. The quota share is multiplied by the TAC to give the quantity which each vessel is authorised to catch of the species concerned during a fishing year. This is referred to as the vessels catch quota. By attributing a direct right to catch a given quantity of fish (the so-called “vessel catch quota”), ITQs provide holders of the right with a relatively strong exclusivity. Exclusivity is even stronger as the Icelandic fishing sector is relatively small and homogeneous (with around 850 vessels accounting for more than 80% of the catches). As in addition the ITQ system applies to most of the resource, the level of this characteristic can be considered as high (ranked 5 on the scale5).
Duration: Quota shares, denominated as fractions, are attributed on a permanent basis. The level of this characteristic is high (ranked 5 on the scale).
Quality of the title: All catches must be weighted and recorded at the port of landing by the local port authorities. Daily transmission of the information to the Directorate of Fisheries allows for prompt and effective enforcement. As in addition most of the stocks are found primarily within the Icelandic EEZ, the level of this characteristic can be considered as high (ranked 5 on the scale).
Transferability: The purpose of implementing an ITQ system was to facilitate fleet adjustment. Access rights are thus to a large extent transferable. Yet, both permanent quota-shares and annual vessel catch quotas are subject to certain restrictions. Permanent quota-shares held by any company or individual are subject to an upper bound that ranges from 12% of the TAC for cod up to 35% of the TAC for ocean redfish. Moreover, the individual Fishing Enterprises may not control more than 12% of the value of all TACs. Transfers of annual vessel catch quotas may be restricted in three ways. First, no more than 50% of the annual vessel catch quota received at the beginning of the fishing year can be transferred from a vessel. This clearly imposes a significant constraint on quota trades and speculative quota holdings. Any quantity of purchased quotas can be re-traded, however. Second, no vessel may purchase quotas that are clearly in excess of what it can reasonably harvest. Third, any vessel that does not harvest 50% of its annual vessel catch quota every second year will forfeit its permanent quota-share. As a result, transferability is high, but up to a point limited (ranked 4 on the scale).
4 Before this change occurred, the share of the cod TAC allocated to small vessels was estimated to around 13.75% (OECD, 2003, p.283), and the “standard” Icelandic ITQ system was estimated to apply to around 85- 90% of the stocks. Vessels under 6 GRT were operating under three different types of fisheries management regimes.
5 . Please refer to the scale as defined in Chapter 1 with a range of 0 to 5.
PART II - SURVEY OF THE USE OF MARKET MECHANISMS IN OECD COUNTRIES – 103
USING MARKET MECHANISMS TO MANAGE FISHERIES: SMOOTHING THE PATH – ISBN-92-64-03657-1 © OECD 2006
Divisibility: Both the permanent quota-shares and the annual vessel catch quotas are perfectly divisible. Perfect divisibility means that any fraction of a given quota may be transferred. The level of this characteristic is high (ranked 5 on the scale).
Flexibility: Except when technical measures are in place, ITQ holders have large scope to determine the least-cost way of using their access right to the resource. As the Icelandic report suggests that some technical measures are used extensively (e.g. temporary closure of fishing areas), the level of this characteristic can be considered as high but limited (ranked 4 on the scale).
Synthesis: The fisheries sector in Iceland is characterised by some particular features, such as the relative concentration and homogeneity of the fishing industry and the prevalence of large stocks within the national EEZ. The ITQ system is designed in such a way that it is relatively comprehensive and allows for the level of all characteristics to be high. High level of the quality of the title, associated with high levels of duration and exclusivity, allows fishers to take into account long term effects in their business decisions and may act as an incentive to invest in the fishery. Relatively high level of transferability and full divisibility has the potential to facilitate the fleet adjustment process. Last, the relatively high level of flexibility, associated with the possibility to rent annual vessel catch quota and high divisibility, is expected to facilitate adaptation to unpredictable economic and environmental events. While this may allow for the efficient use of existing fishing capacities, this may also maintain some incentives to engage in illicit practices (e.g. misreporting, discarding) at relatively low levels. The Icelandic situation is illustrated in Figure II.1.
Figure II.1. Characteristics of the Icelandic ITQ System (98% of the stocks)
II.2. European Community6
Within the European Community, several technical measures to maintain stocks’ productive and reproductive capacity are taken at a supranational level.
6 See country submission on the European Union on the OECD Fisheries public web site www.oecd.org/agr/fish for further details.
0 1 2 3 4 5
exclusivity
duration
quality of title
transferability
divisibility
flexibility
ITQs reference
104 - PART II - SURVEY OF THE USE OF MARKET MECHANISMS IN OECD COUNTRIES
USING MARKET MECHANISMS TO MANAGE FISHERIES: SMOOTHING THE PATH – ISBN-92-64-03657-1 © OECD 2006
Annually, the European Council, acting by qualified majority on a proposal from the European Commission, decides on catch limits (TAC) for around 60 major EC species (divided in sub-stocks). It also decides on the allocation of fishing opportunities among Member States (quotas) as well as the conditions associated with those limits. Fishing opportunities are distributed among Member States in such a way as to assure relative stability of fishing activities for each stock or fishery for each Member State.
Some additional technical measures can be taken to achieve a sustainable exploitation of living aquatic resources, whether or not as part of recovery and management plans. This includes catches limitations, type and number of fishing gear permitted, limitation of fishing effort, temporary closure or restriction of fishing areas to protect spawning and nursery areas and minimum size of fish that may be retained on board and/or landed.
Each Member State decides, for vessels flying its flag, on the method of allocating the fishing opportunities assigned to that Member State in accordance with Community law.
II.2.1. Germany7
Technical measures to maintain fish stocks productivity
In Germany, most of the species commercially caught are subject to EC regulations. The main instrument to maintain fish stocks productivity is thus the German quota decided each year by the EC Council. In addition, a number of other measures designed to improve the sustainable yield of the stocks are used, including closure of fishing areas.
Market-like instruments to regulate access
The most important market-like instrument used in Germany to regulate access to the resource (i.e. the national quota) is a system of individual quotas (IQs) that are partly transferable. Besides these other secondary instruments are used to address specific situations, e.g. vessels catch limits (VCs). Before describing these instruments, a general feature of the German situation may be useful to point out.
Once the national quota has been decided, fishing quotas are distributed by the Federal Office for Agriculture and Food on the basis of the Sea Fisheries Act. In the first step, the quotas are divided among the cutter fleets (2 226 vessels) and the deep-sea fleets (12 vessels). The criteria according to which the fishing quotas are to be divided among the fleet categories are laid down in consultation with the professional association and the Länder involved. As a rule, enterprises active in deep-sea trawler fisheries obtained individual catch licences to fish individual stocks in different sea areas and/or joint catch licences for several enterprises. Enterprises engaged in cutter deep-sea and coastal fisheries are allowed to fish those species whose full quota utilisation was not expected, without any quantity restrictions. In order to manage the small quotas of plaice, saithe, sole, hake, haddock, anglerfish and cod both individual catch licences and catch licences for certain groups of vessels were granted or maximum catch levels over certain periods established. Due to the high quota utilisation in previous years, the herring quota in the Baltic Sea was distributed among the fishing associations of the Länder for the first time in 2003.
7 See country submission on Germany now available on the OECD public web site www.oecd.org/agr/fish for further details.
PART II - SURVEY OF THE USE OF MARKET MECHANISMS IN OECD COUNTRIES – 105
USING MARKET MECHANISMS TO MANAGE FISHERIES: SMOOTHING THE PATH – ISBN-92-64-03657-1 © OECD 2006
The individual quotas (IQs) system:
Individual quotas are mainly used under fishing agreements to access third-country waters, for quotas under the regime of regional fisheries organisations, and for national quotas that are likely to be fully used. This included the Baltic cod and saithe fisheries. Information regarding the relative importance of these fisheries is not yet available.
Exclusivity: IQs give individual enterprises or associations of enterprises permission to fish and land a set amount of a specific stock or group of stocks within a fishing area. The level of the characteristic is high (ranked 5 on the scale).
Duration: IQs are allocated each year applying the principle of relative stability, i.e. that the German quota is in practice distributed to previous recipients in more or less the same proportion. This increases informally fishers’ planning horizon, so the level of the characteristic can be considered high but limited to a certain extent (ranked 4 on the scale).
Quality of the title: IQs depend both on EC and German fisheries management systems. Available information suggests that the level of security of the title can be considered as relatively high. With respect to enforceability, the German country report suggests that illicit fishing may arise from the use of this market-like instrument, because unbalances between fishing possibilities and fishing capacity may exist. Indeed, half of the behaviour seriously infringing the rules of the CFP in Germany in 2000 consisted in misreporting data (COM, 2001). Yet, due to the relatively small number of such behaviour observed (98 occurrences in 2000) compared to the number of fishing operations, the overall level of the characteristic can be considered as relatively high (ranked 4 on the scale).
Transferability: To allow flexibility, annual IQs can be transferred or exchanged freely among fishers during a fishing year8. As a result, the German IQs system appears to be close to traditional ITQs system. However, the permanent sale of an IQ is not possible as it is not considered a property right. The overall level of the characteristic can thus be considered moderate (ranked 3 on the scale).
Divisibility: Any fraction of the IQ can be exchanged, divided or aggregated, so the level of the characteristic is high (ranked 5 on the scale).
Flexibility: In general, IQs’ holders can decide rather freely on the way they can use their quota, subject to technical constraints that apply to most stocks. Yet, the German report underlines that IQs system is considered as a stringent method, which dictates to the individual fisher precisely what quantity he may fish in which area and does not allow for considering differences in efficiency between them. While this may affect the level of the characteristic, it should be noted that the extent of this “unbalance” problem mainly depends on the allocation process and the difficulty for the regulator to be entirely familiar with how firms operate. To soften the rigour of the allocation process, fishers can in practice exchange their annual IQs9. As a result, the level of this characteristic can be considered as high but limited (ranked 4 on the scale).
Synthesis: Available information suggests that the German IQs system, by providing high level of exclusivity, can allow fishers to plan their fishing activities during the year.
8 Information regarding the market value for IQs is not currently available.
9 In this context, a move towards multi-annual quota management is nevertheless welcomed in the German country report.
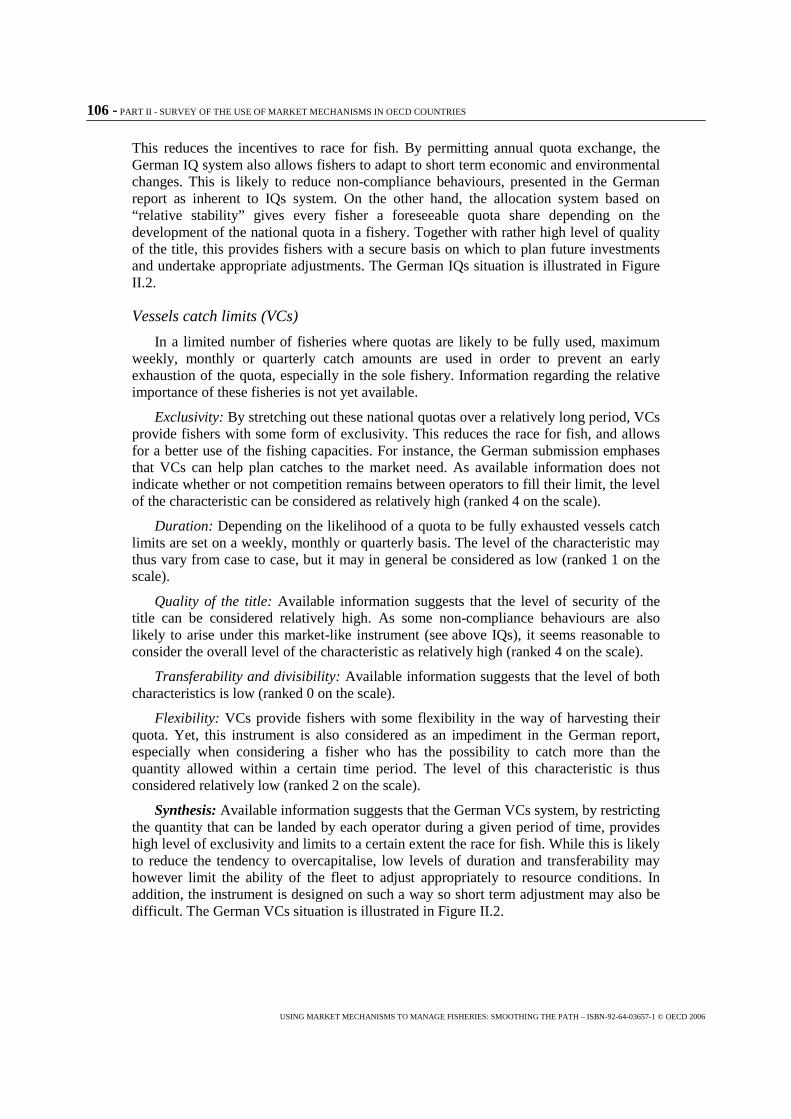
106 - PART II - SURVEY OF THE USE OF MARKET MECHANISMS IN OECD COUNTRIES
USING MARKET MECHANISMS TO MANAGE FISHERIES: SMOOTHING THE PATH – ISBN-92-64-03657-1 © OECD 2006
This reduces the incentives to race for fish. By permitting annual quota exchange, the German IQ system also allows fishers to adapt to short term economic and environmental changes. This is likely to reduce non-compliance behaviours, presented in the German report as inherent to IQs system. On the other hand, the allocation system based on “relative stability” gives every fisher a foreseeable quota share depending on the development of the national quota in a fishery. Together with rather high level of quality of the title, this provides fishers with a secure basis on which to plan future investments and undertake appropriate adjustments. The German IQs situation is illustrated in Figure II.2.
Vessels catch limits (VCs)
In a limited number of fisheries where quotas are likely to be fully used, maximum weekly, monthly or quarterly catch amounts are used in order to prevent an early exhaustion of the quota, especially in the sole fishery. Information regarding the relative importance of these fisheries is not yet available.
Exclusivity: By stretching out these national quotas over a relatively long period, VCs provide fishers with some form of exclusivity. This reduces the race for fish, and allows for a better use of the fishing capacities. For instance, the German submission emphases that VCs can help plan catches to the market need. As available information does not indicate whether or not competition remains between operators to fill their limit, the level of the characteristic can be considered as relatively high (ranked 4 on the scale).
Duration: Depending on the likelihood of a quota to be fully exhausted vessels catch limits are set on a weekly, monthly or quarterly basis. The level of the characteristic may thus vary from case to case, but it may in general be considered as low (ranked 1 on the scale).
Quality of the title: Available information suggests that the level of security of the title can be considered relatively high. As some non-compliance behaviours are also likely to arise under this market-like instrument (see above IQs), it seems reasonable to consider the overall level of the characteristic as relatively high (ranked 4 on the scale).
Transferability and divisibility: Available information suggests that the level of both characteristics is low (ranked 0 on the scale).
Flexibility: VCs provide fishers with some flexibility in the way of harvesting their quota. Yet, this instrument is also considered as an impediment in the German report, especially when considering a fisher who has the possibility to catch more than the quantity allowed within a certain time period. The level of this characteristic is thus considered relatively low (ranked 2 on the scale).
Synthesis: Available information suggests that the German VCs system, by restricting the quantity that can be landed by each operator during a given period of time, provides high level of exclusivity and limits to a certain extent the race for fish. While this is likely to reduce the tendency to overcapitalise, low levels of duration and transferability may however limit the ability of the fleet to adjust appropriately to resource conditions. In addition, the instrument is designed on such a way so short term adjustment may also be difficult. The German VCs situation is illustrated in Figure II.2.
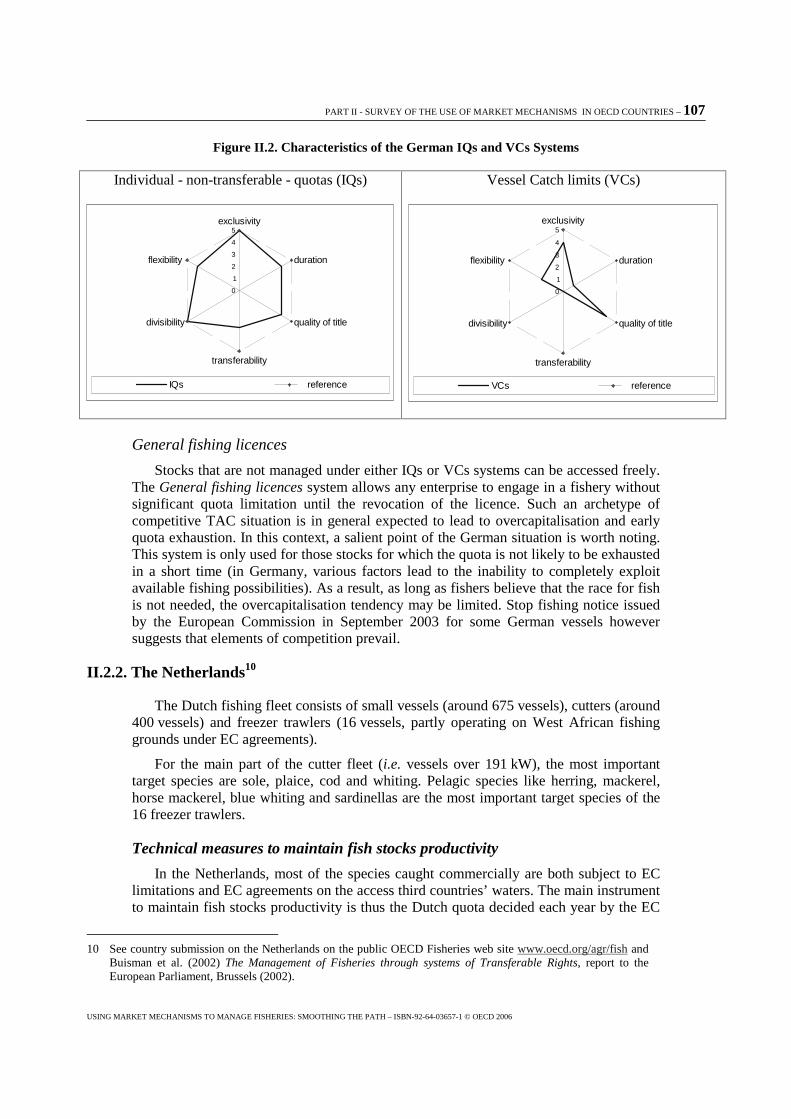
PART II - SURVEY OF THE USE OF MARKET MECHANISMS IN OECD COUNTRIES – 107
USING MARKET MECHANISMS TO MANAGE FISHERIES: SMOOTHING THE PATH – ISBN-92-64-03657-1 © OECD 2006
Figure II.2. Characteristics of the German IQs and VCs Systems
Individual - non-transferable - quotas (IQs)
0
1
2
3
4
5exclusivity
duration
quality of title
transferability
divisibility
flexibility
IQs reference
Vessel Catch limits (VCs)
0
1
2
3
4
5exclusivity
duration
quality of title
transferability
divisibility
flexibility
VCs reference
General fishing licences
Stocks that are not managed under either IQs or VCs systems can be accessed freely. The General fishing licences system allows any enterprise to engage in a fishery without significant quota limitation until the revocation of the licence. Such an archetype of competitive TAC situation is in general expected to lead to overcapitalisation and early quota exhaustion. In this context, a salient point of the German situation is worth noting. This system is only used for those stocks for which the quota is not likely to be exhausted in a short time (in Germany, various factors lead to the inability to completely exploit available fishing possibilities). As a result, as long as fishers believe that the race for fish is not needed, the overcapitalisation tendency may be limited. Stop fishing notice issued by the European Commission in September 2003 for some German vessels however suggests that elements of competition prevail.
II.2.2. The Netherlands10
The Dutch fishing fleet consists of small vessels (around 675 vessels), cutters (around 400 vessels) and freezer trawlers (16 vessels, partly operating on West African fishing grounds under EC agreements).
For the main part of the cutter fleet (i.e. vessels over 191 kW), the most important target species are sole, plaice, cod and whiting. Pelagic species like herring, mackerel, horse mackerel, blue whiting and sardinellas are the most important target species of the 16 freezer trawlers.
Technical measures to maintain fish stocks productivity
In the Netherlands, most of the species caught commercially are both subject to EC limitations and EC agreements on the access third countries’ waters. The main instrument to maintain fish stocks productivity is thus the Dutch quota decided each year by the EC
10 See country submission on the Netherlands on the public OECD Fisheries web site www.oecd.org/agr/fish and Buisman et al. (2002) The Management of Fisheries through systems of Transferable Rights, report to the European Parliament, Brussels (2002).
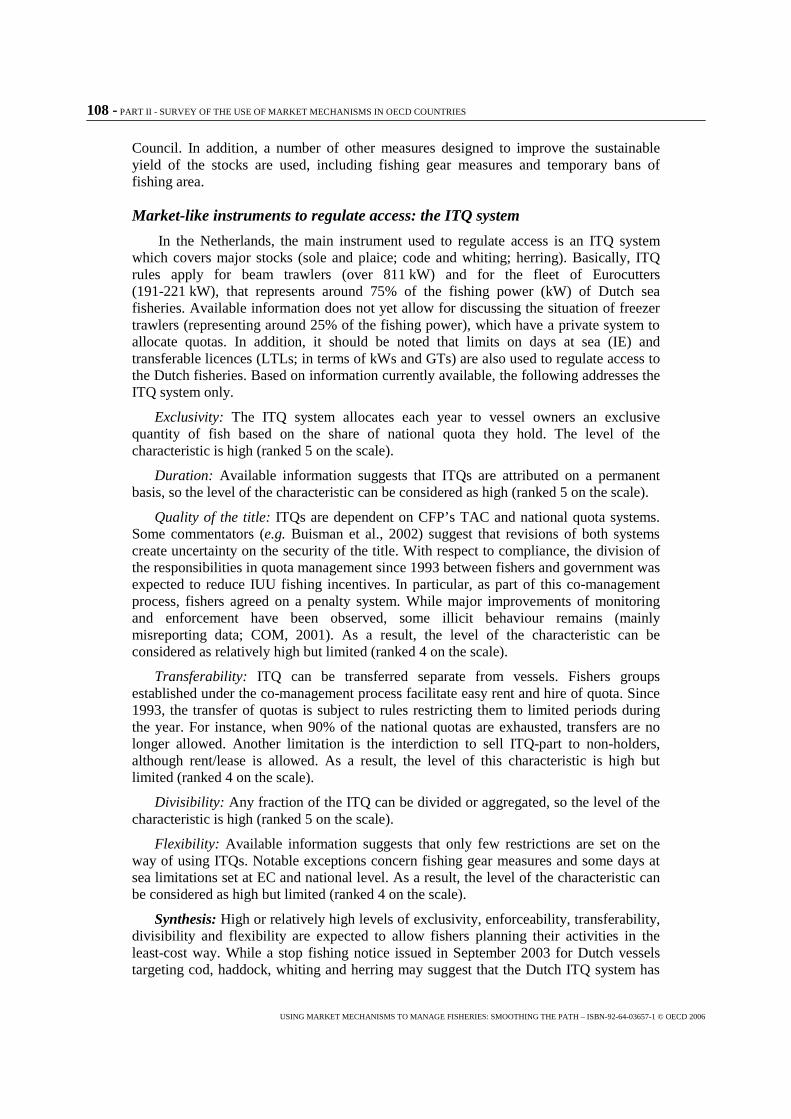
108 - PART II - SURVEY OF THE USE OF MARKET MECHANISMS IN OECD COUNTRIES
USING MARKET MECHANISMS TO MANAGE FISHERIES: SMOOTHING THE PATH – ISBN-92-64-03657-1 © OECD 2006
Council. In addition, a number of other measures designed to improve the sustainable yield of the stocks are used, including fishing gear measures and temporary bans of fishing area.
Market-like instruments to regulate access: the ITQ system
In the Netherlands, the main instrument used to regulate access is an ITQ system which covers major stocks (sole and plaice; code and whiting; herring). Basically, ITQ rules apply for beam trawlers (over 811 kW) and for the fleet of Eurocutters (191-221 kW), that represents around 75% of the fishing power (kW) of Dutch sea fisheries. Available information does not yet allow for discussing the situation of freezer trawlers (representing around 25% of the fishing power), which have a private system to allocate quotas. In addition, it should be noted that limits on days at sea (IE) and transferable licences (LTLs; in terms of kWs and GTs) are also used to regulate access to the Dutch fisheries. Based on information currently available, the following addresses the ITQ system only.
Exclusivity: The ITQ system allocates each year to vessel owners an exclusive quantity of fish based on the share of national quota they hold. The level of the characteristic is high (ranked 5 on the scale).
Duration: Available information suggests that ITQs are attributed on a permanent basis, so the level of the characteristic can be considered as high (ranked 5 on the scale).
Quality of the title: ITQs are dependent on CFP’s TAC and national quota systems. Some commentators (e.g. Buisman et al., 2002) suggest that revisions of both systems create uncertainty on the security of the title. With respect to compliance, the division of the responsibilities in quota management since 1993 between fishers and government was expected to reduce IUU fishing incentives. In particular, as part of this co-management process, fishers agreed on a penalty system. While major improvements of monitoring and enforcement have been observed, some illicit behaviour remains (mainly misreporting data; COM, 2001). As a result, the level of the characteristic can be considered as relatively high but limited (ranked 4 on the scale).
Transferability: ITQ can be transferred separate from vessels. Fishers groups established under the co-management process facilitate easy rent and hire of quota. Since 1993, the transfer of quotas is subject to rules restricting them to limited periods during the year. For instance, when 90% of the national quotas are exhausted, transfers are no longer allowed. Another limitation is the interdiction to sell ITQ-part to non-holders, although rent/lease is allowed. As a result, the level of this characteristic is high but limited (ranked 4 on the scale).
Divisibility: Any fraction of the ITQ can be divided or aggregated, so the level of the characteristic is high (ranked 5 on the scale).
Flexibility: Available information suggests that only few restrictions are set on the way of using ITQs. Notable exceptions concern fishing gear measures and some days at sea limitations set at EC and national level. As a result, the level of the characteristic can be considered as high but limited (ranked 4 on the scale).
Synthesis: High or relatively high levels of exclusivity, enforceability, transferability, divisibility and flexibility are expected to allow fishers planning their activities in the least-cost way. While a stop fishing notice issued in September 2003 for Dutch vessels targeting cod, haddock, whiting and herring may suggest that the Dutch ITQ system has
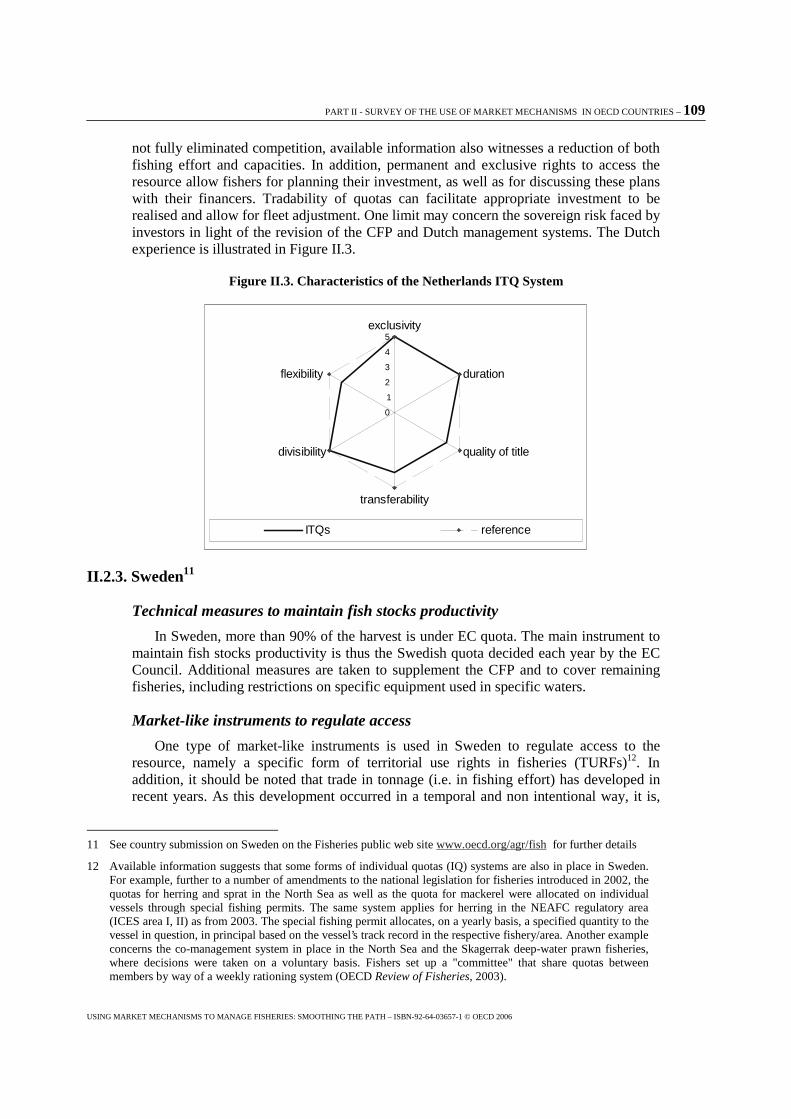
PART II - SURVEY OF THE USE OF MARKET MECHANISMS IN OECD COUNTRIES – 109
USING MARKET MECHANISMS TO MANAGE FISHERIES: SMOOTHING THE PATH – ISBN-92-64-03657-1 © OECD 2006
not fully eliminated competition, available information also witnesses a reduction of both fishing effort and capacities. In addition, permanent and exclusive rights to access the resource allow fishers for planning their investment, as well as for discussing these plans with their financers. Tradability of quotas can facilitate appropriate investment to be realised and allow for fleet adjustment. One limit may concern the sovereign risk faced by investors in light of the revision of the CFP and Dutch management systems. The Dutch experience is illustrated in Figure II.3.
Figure II.3. Characteristics of the Netherlands ITQ System
0
1
2
3
4
5exclusivity
duration
quality of title
transferability
divisibility
flexibility
ITQs reference
II.2.3. Sweden11
Technical measures to maintain fish stocks productivity
In Sweden, more than 90% of the harvest is under EC quota. The main instrument to maintain fish stocks productivity is thus the Swedish quota decided each year by the EC Council. Additional measures are taken to supplement the CFP and to cover remaining fisheries, including restrictions on specific equipment used in specific waters.
Market-like instruments to regulate access
One type of market-like instruments is used in Sweden to regulate access to the resource, namely a specific form of territorial use rights in fisheries (TURFs)12. In addition, it should be noted that trade in tonnage (i.e. in fishing effort) has developed in recent years. As this development occurred in a temporal and non intentional way, it is,
11 See country submission on Sweden on the Fisheries public web site www.oecd.org/agr/fish for further details
12 Available information suggests that some forms of individual quotas (IQ) systems are also in place in Sweden. For example, further to a number of amendments to the national legislation for fisheries introduced in 2002, the quotas for herring and sprat in the North Sea as well as the quota for mackerel were allocated on individual vessels through special fishing permits. The same system applies for herring in the NEAFC regulatory area (ICES area I, II) as from 2003. The special fishing permit allocates, on a yearly basis, a specified quantity to the vessel in question, in principal based on the vessel’s track record in the respective fishery/area. Another example concerns the co-management system in place in the North Sea and the Skagerrak deep-water prawn fisheries, where decisions were taken on a voluntary basis. Fishers set up a "committee" that share quotas between members by way of a weekly rationing system (OECD Review of Fisheries, 2003).
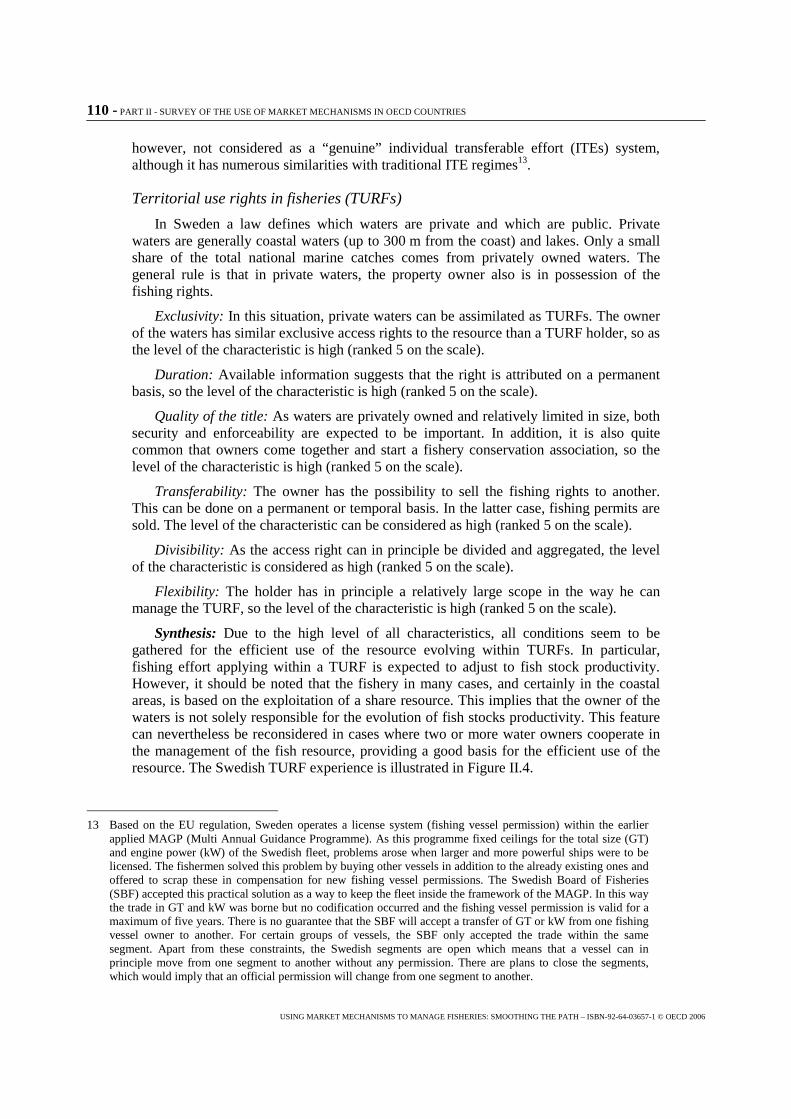
110 - PART II - SURVEY OF THE USE OF MARKET MECHANISMS IN OECD COUNTRIES
USING MARKET MECHANISMS TO MANAGE FISHERIES: SMOOTHING THE PATH – ISBN-92-64-03657-1 © OECD 2006
however, not considered as a “genuine” individual transferable effort (ITEs) system, although it has numerous similarities with traditional ITE regimes13.
Territorial use rights in fisheries (TURFs)
In Sweden a law defines which waters are private and which are public. Private waters are generally coastal waters (up to 300 m from the coast) and lakes. Only a small share of the total national marine catches comes from privately owned waters. The general rule is that in private waters, the property owner also is in possession of the fishing rights.
Exclusivity: In this situation, private waters can be assimilated as TURFs. The owner of the waters has similar exclusive access rights to the resource than a TURF holder, so as the level of the characteristic is high (ranked 5 on the scale).
Duration: Available information suggests that the right is attributed on a permanent basis, so the level of the characteristic is high (ranked 5 on the scale).
Quality of the title: As waters are privately owned and relatively limited in size, both security and enforceability are expected to be important. In addition, it is also quite common that owners come together and start a fishery conservation association, so the level of the characteristic is high (ranked 5 on the scale).
Transferability: The owner has the possibility to sell the fishing rights to another. This can be done on a permanent or temporal basis. In the latter case, fishing permits are sold. The level of the characteristic can be considered as high (ranked 5 on the scale).
Divisibility: As the access right can in principle be divided and aggregated, the level of the characteristic is considered as high (ranked 5 on the scale).
Flexibility: The holder has in principle a relatively large scope in the way he can manage the TURF, so the level of the characteristic is high (ranked 5 on the scale).
Synthesis: Due to the high level of all characteristics, all conditions seem to be gathered for the efficient use of the resource evolving within TURFs. In particular, fishing effort applying within a TURF is expected to adjust to fish stock productivity. However, it should be noted that the fishery in many cases, and certainly in the coastal areas, is based on the exploitation of a share resource. This implies that the owner of the waters is not solely responsible for the evolution of fish stocks productivity. This feature can nevertheless be reconsidered in cases where two or more water owners cooperate in the management of the fish resource, providing a good basis for the efficient use of the resource. The Swedish TURF experience is illustrated in Figure II.4.
13 Based on the EU regulation, Sweden operates a license system (fishing vessel permission) within the earlier applied MAGP (Multi Annual Guidance Programme). As this programme fixed ceilings for the total size (GT) and engine power (kW) of the Swedish fleet, problems arose when larger and more powerful ships were to be licensed. The fishermen solved this problem by buying other vessels in addition to the already existing ones and offered to scrap these in compensation for new fishing vessel permissions. The Swedish Board of Fisheries (SBF) accepted this practical solution as a way to keep the fleet inside the framework of the MAGP. In this way the trade in GT and kW was borne but no codification occurred and the fishing vessel permission is valid for a maximum of five years. There is no guarantee that the SBF will accept a transfer of GT or kW from one fishing vessel owner to another. For certain groups of vessels, the SBF only accepted the trade within the same segment. Apart from these constraints, the Swedish segments are open which means that a vessel can in principle move from one segment to another without any permission. There are plans to close the segments, which would imply that an official permission will change from one segment to another.
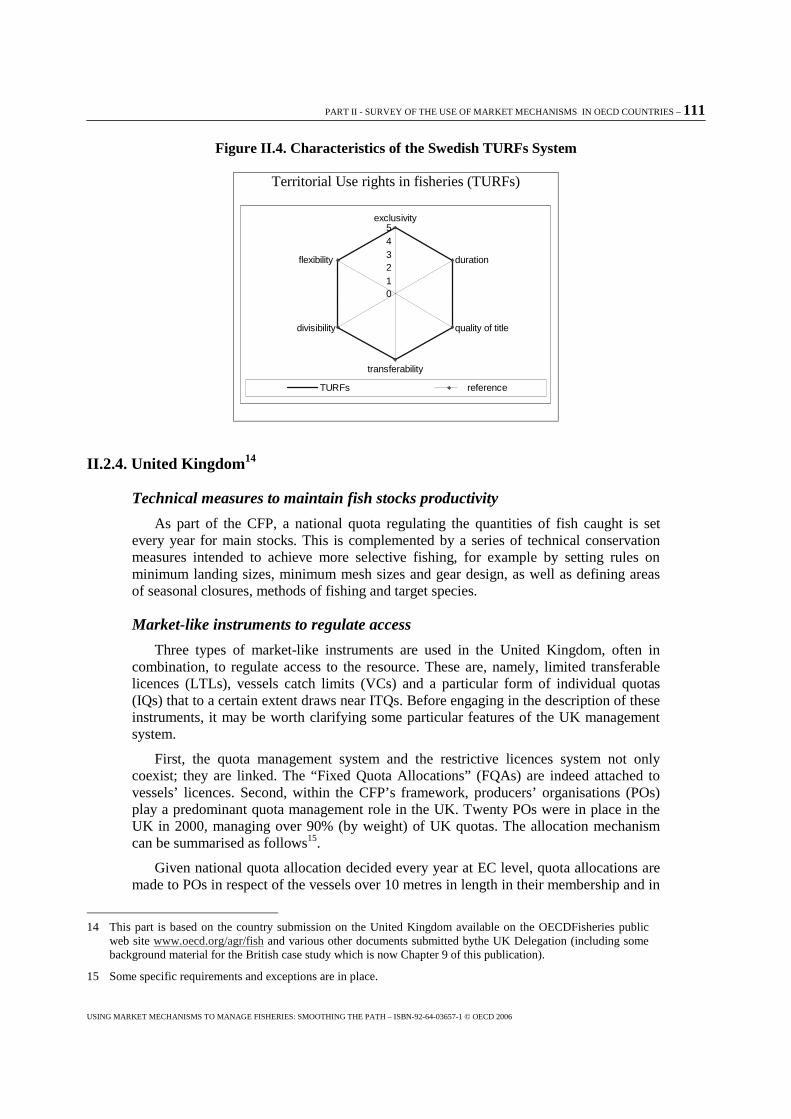
PART II - SURVEY OF THE USE OF MARKET MECHANISMS IN OECD COUNTRIES – 111
USING MARKET MECHANISMS TO MANAGE FISHERIES: SMOOTHING THE PATH – ISBN-92-64-03657-1 © OECD 2006
Figure II.4. Characteristics of the Swedish TURFs System
Territorial Use rights in fisheries (TURFs)
012345
exclusivity
duration
quality of title
transferability
divisibility
flexibility
TURFs reference
II.2.4. United Kingdom14
Technical measures to maintain fish stocks productivity
As part of the CFP, a national quota regulating the quantities of fish caught is set every year for main stocks. This is complemented by a series of technical conservation measures intended to achieve more selective fishing, for example by setting rules on minimum landing sizes, minimum mesh sizes and gear design, as well as defining areas of seasonal closures, methods of fishing and target species.
Market-like instruments to regulate access
Three types of market-like instruments are used in the United Kingdom, often in combination, to regulate access to the resource. These are, namely, limited transferable licences (LTLs), vessels catch limits (VCs) and a particular form of individual quotas (IQs) that to a certain extent draws near ITQs. Before engaging in the description of these instruments, it may be worth clarifying some particular features of the UK management system.
First, the quota management system and the restrictive licences system not only coexist; they are linked. The “Fixed Quota Allocations” (FQAs) are indeed attached to vessels’ licences. Second, within the CFP’s framework, producers’ organisations (POs) play a predominant quota management role in the UK. Twenty POs were in place in the UK in 2000, managing over 90% (by weight) of UK quotas. The allocation mechanism can be summarised as follows15.
Given national quota allocation decided every year at EC level, quota allocations are made to POs in respect of the vessels over 10 metres in length in their membership and in
14 This part is based on the country submission on the United Kingdom available on the OECDFisheries public web site www.oecd.org/agr/fish and various other documents submitted bythe UK Delegation (including some background material for the British case study which is now Chapter 9 of this publication).
15 Some specific requirements and exceptions are in place.
112 - PART II - SURVEY OF THE USE OF MARKET MECHANISMS IN OECD COUNTRIES
USING MARKET MECHANISMS TO MANAGE FISHERIES: SMOOTHING THE PATH – ISBN-92-64-03657-1 © OECD 2006
proportion to the total number of units associated with those vessels’ licences. Each PO is relatively free to decide on the means by which they manage their quota allocation. Some choose to operate a common quota pool and set monthly limits (VCs). Some choose to allocate individual quotas (IQs) to member vessels or companies, normally based on each vessel Fixed Quota Allocations16.
For each stock a “non-sector” allocation is reserved for those over 10 meters vessels not in membership of a PO, in proportion to the total number of units associated with those vessels’ licences.
Allocations are set aside for the 10 meters and under fleet on the basis of the total number of units assigned to this group.
Limited transferable licences (LTLs): the VCU system.
Although transferable licences had existed since 1984 for so-called “pressure stocks”, a new licence system was introduced in 1990: the “vessel capacity units” (VCUs) system. Each licence is assigned a certain number of VCUs, calculated for the vessel to which the licence was attached according to a formula taking into account size and power. It is important to note that from 1995, track records have been formally associated with licences (i.e. with VCUs), rather than being associated with the vessel as before.
Exclusivity: These units of effort are needed to engage in commercial fishing activities. When licences concern relatively small and/or sedentary stocks (e.g. scallops entitlement17), they provide a relatively exclusive access to the resource. Yet, for large and mobile stocks, the exclusivity is attenuated, so it is proposed to consider the characteristic as moderate (ranked 3 on the scale).
Duration: As VCUs are attributed on a permanent basis, the level of the characteristic is high (ranked 5 on the scale).
Quality of the title: Available information suggests that both security and enforceability are important, so the level of the characteristic is considered as high (ranked 5 on the scale).
Transferability: VCUs can be traded relatively freely18. Major restrictions concern structural adjustments. For example, transfers were allowed at the origin provided that there was no increase in either tonnage or engine power, or that there was a 10% decrease in VCUs for the recipient vessel. In addition, under the “capacity aggregation” scheme, two or more licences (which had to be of similar type) could be transferred onto a single larger or more powerful vessel provided that the capacity of that vessel measured in VCUs was no more than 90% of the combined capacity of the “donor” vessels. Restrictions on tradability were also be established for social reasons (e.g. in 1992 restrictions on beam trawlers were set on beam trawlers licenced to fish in the North Sea to prevent foreign acquisitions; in 2001 aggregations of licences from under 8 meters vessels onto 8-10 meters vessels were forbidden, etc.). The level of the characteristic is thus considered as high but limited (ranked 4 on the scale).
16 Twelve POs also run a mixed system, operating a “pure” pool with monthly limits (VCs) for some stocks and allocating IQs for the remaining stocks
17 E.g. see the website www.findafishingboat.co.uk for description of licences supply and demand.
18 Tradability gives an explicit value to the licence, and VCUs are treated as an asset.
PART II - SURVEY OF THE USE OF MARKET MECHANISMS IN OECD COUNTRIES – 113
USING MARKET MECHANISMS TO MANAGE FISHERIES: SMOOTHING THE PATH – ISBN-92-64-03657-1 © OECD 2006
Divisibility: While expressed in terms of effort units, available information suggests that licences are not divisible per se. Thus, the level of the characteristic may be considered low (ranked 0 on the scale).
Flexibility: While units of effort are needed to engage in commercial fishing activities, they are often supplemented by technical measures that restrict the scope of decision, so the characteristic can be considered as moderate (ranked 3 on the scale).
Synthesis: This instrument is expected to facilitate the efficient use of existing access right, as less efficient fishers may have interest to sell VCUs to more efficient ones. By providing relatively durable and secure exclusivity, it is also expected to allow for appropriate fleet adjustment. The British LTLs experience is illustrated in Figure 5.
Vessels catch limits (VCs): the “pool-plus” system
A standard VCs system is in use for the non-sector (15% of the total VCUs, all limits being the same for all the vessels) and for some POs19, where landings for most stocks are restricted to monthly limits (or per trip limits in case of some pelagic stocks). However, the current analysis focuses on an innovative variant of VCs, the so-called “pool-plus” system (DEFRA, 2002).
Three POs, operating this so-called “pool-plus” system, decide on individual monthly limits from the pool, but allow their members to lease quota and fish against their own allocations once they have exhausted their monthly limits. By permitting members to “top up” their allowances under a “pool-plus” system with quotas bought or leased from other vessels, the UK VCs system improves some of the expected characteristics of vessel catch limits (see Chapter 2 on typology).
Exclusivity: By allowing each participant to adapt fishing possibilities to the fishing capacities, this instrument reduces the incentives to compete. As this is expected to increase the level of exclusivity, the level of characteristic is high (ranked 5 on the scale).
Duration: As VCs are decided for relatively short periods, the level of the characteristic is considered relatively weak (ranked 2 on the scale).
Quality of the title: Available information suggests that the security of the title is high. In addition, by reducing incentives to misreport catches, this instrument is expected to improve enforceability. The level of the characteristic is considered as relatively high (ranked 4 on the scale).
Transferability: While this instrument allows fishers to lease quotas, it is at this stage unclear whether these portions of quota are coming from individual monthly limits. For the time being, it is thus reasonable to consider this characteristic as relatively weak (ranked 2 on the scale).
Divisibility: Similarly, available information does not indicate the extent to which VCs can be divisible. Yet, this instrument allows for some access rights aggregation, so as the level of the characteristic may be considered as moderate (ranked 3 on the scale).
Flexibility: By permitting members to “top up” their allowances, this instrument is expected to improve flexibility. Yet, fishers remain subject to mandatory short term limits, so the level of the characteristic may be considered as high but limited (ranked 4 on the scale).
19 See contributions from the United Kingdom.
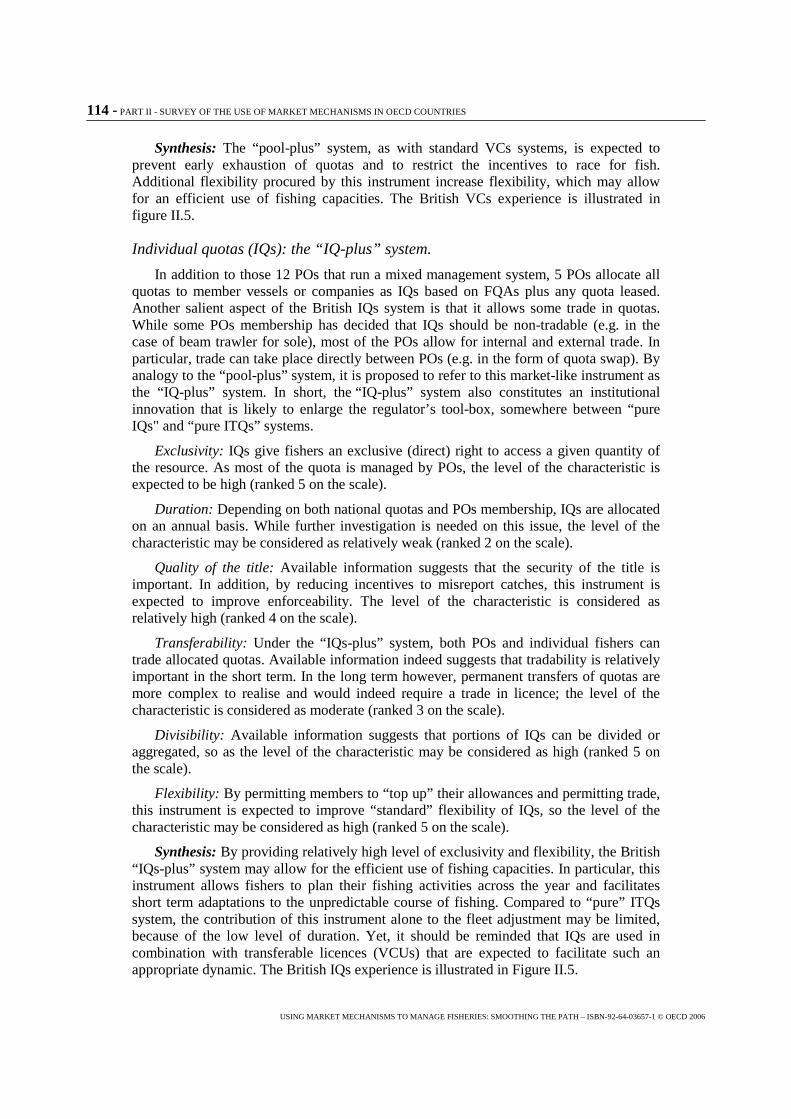
114 - PART II - SURVEY OF THE USE OF MARKET MECHANISMS IN OECD COUNTRIES
USING MARKET MECHANISMS TO MANAGE FISHERIES: SMOOTHING THE PATH – ISBN-92-64-03657-1 © OECD 2006
Synthesis: The “pool-plus” system, as with standard VCs systems, is expected to prevent early exhaustion of quotas and to restrict the incentives to race for fish. Additional flexibility procured by this instrument increase flexibility, which may allow for an efficient use of fishing capacities. The British VCs experience is illustrated in figure II.5.
Individual quotas (IQs): the “IQ-plus” system.
In addition to those 12 POs that run a mixed management system, 5 POs allocate all quotas to member vessels or companies as IQs based on FQAs plus any quota leased. Another salient aspect of the British IQs system is that it allows some trade in quotas. While some POs membership has decided that IQs should be non-tradable (e.g. in the case of beam trawler for sole), most of the POs allow for internal and external trade. In particular, trade can take place directly between POs (e.g. in the form of quota swap). By analogy to the “pool-plus” system, it is proposed to refer to this market-like instrument as the “IQ-plus” system. In short, the “IQ-plus” system also constitutes an institutional innovation that is likely to enlarge the regulator’s tool-box, somewhere between “pure IQs" and “pure ITQs” systems.
Exclusivity: IQs give fishers an exclusive (direct) right to access a given quantity of the resource. As most of the quota is managed by POs, the level of the characteristic is expected to be high (ranked 5 on the scale).
Duration: Depending on both national quotas and POs membership, IQs are allocated on an annual basis. While further investigation is needed on this issue, the level of the characteristic may be considered as relatively weak (ranked 2 on the scale).
Quality of the title: Available information suggests that the security of the title is important. In addition, by reducing incentives to misreport catches, this instrument is expected to improve enforceability. The level of the characteristic is considered as relatively high (ranked 4 on the scale).
Transferability: Under the “IQs-plus” system, both POs and individual fishers can trade allocated quotas. Available information indeed suggests that tradability is relatively important in the short term. In the long term however, permanent transfers of quotas are more complex to realise and would indeed require a trade in licence; the level of the characteristic is considered as moderate (ranked 3 on the scale).
Divisibility: Available information suggests that portions of IQs can be divided or aggregated, so as the level of the characteristic may be considered as high (ranked 5 on the scale).
Flexibility: By permitting members to “top up” their allowances and permitting trade, this instrument is expected to improve “standard” flexibility of IQs, so the level of the characteristic may be considered as high (ranked 5 on the scale).
Synthesis: By providing relatively high level of exclusivity and flexibility, the British “IQs-plus” system may allow for the efficient use of fishing capacities. In particular, this instrument allows fishers to plan their fishing activities across the year and facilitates short term adaptations to the unpredictable course of fishing. Compared to “pure” ITQs system, the contribution of this instrument alone to the fleet adjustment may be limited, because of the low level of duration. Yet, it should be reminded that IQs are used in combination with transferable licences (VCUs) that are expected to facilitate such an appropriate dynamic. The British IQs experience is illustrated in Figure II.5.
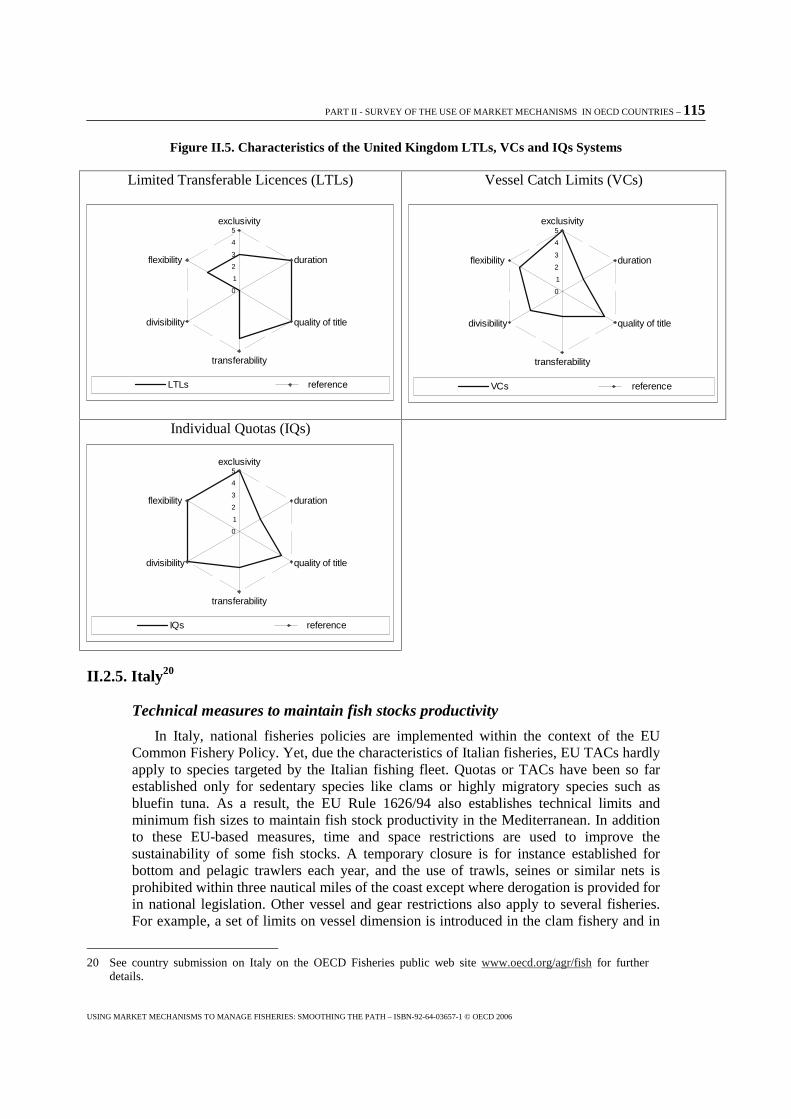
PART II - SURVEY OF THE USE OF MARKET MECHANISMS IN OECD COUNTRIES – 115
USING MARKET MECHANISMS TO MANAGE FISHERIES: SMOOTHING THE PATH – ISBN-92-64-03657-1 © OECD 2006
Figure II.5. Characteristics of the United Kingdom LTLs, VCs and IQs Systems
Limited Transferable Licences (LTLs)
0
1
2
3
4
5exclusivity
duration
quality of title
transferability
divisibility
flexibility
LTLs reference
Vessel Catch Limits (VCs)
0
1
2
3
4
5exclusivity
duration
quality of title
transferability
divisibility
flexibility
VCs reference
Individual Quotas (IQs)
0
1
2
3
4
5exclusivity
duration
quality of title
transferability
divisibility
flexibility
IQs reference
II.2.5. Italy20
Technical measures to maintain fish stocks productivity
In Italy, national fisheries policies are implemented within the context of the EU Common Fishery Policy. Yet, due the characteristics of Italian fisheries, EU TACs hardly apply to species targeted by the Italian fishing fleet. Quotas or TACs have been so far established only for sedentary species like clams or highly migratory species such as bluefin tuna. As a result, the EU Rule 1626/94 also establishes technical limits and minimum fish sizes to maintain fish stock productivity in the Mediterranean. In addition to these EU-based measures, time and space restrictions are used to improve the sustainability of some fish stocks. A temporary closure is for instance established for bottom and pelagic trawlers each year, and the use of trawls, seines or similar nets is prohibited within three nautical miles of the coast except where derogation is provided for in national legislation. Other vessel and gear restrictions also apply to several fisheries. For example, a set of limits on vessel dimension is introduced in the clam fishery and in
20 See country submission on Italy on the OECD Fisheries public web site www.oecd.org/agr/fish for further details.
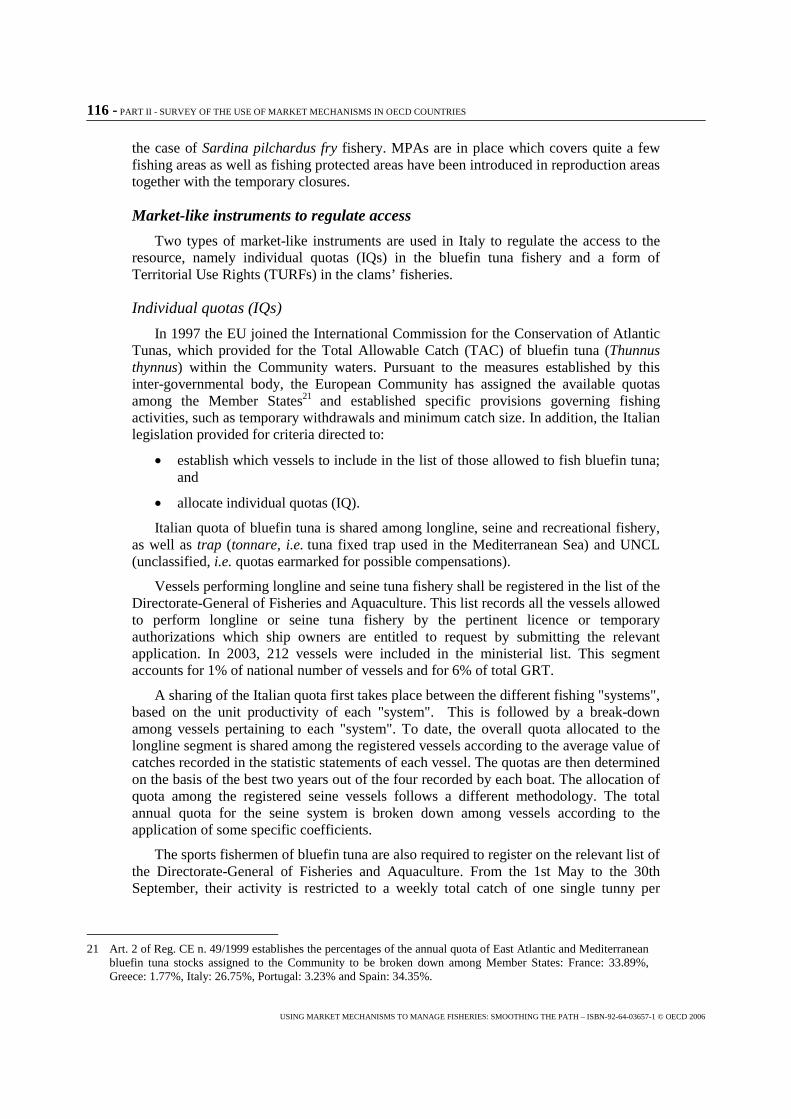
116 - PART II - SURVEY OF THE USE OF MARKET MECHANISMS IN OECD COUNTRIES
USING MARKET MECHANISMS TO MANAGE FISHERIES: SMOOTHING THE PATH – ISBN-92-64-03657-1 © OECD 2006
the case of Sardina pilchardus fry fishery. MPAs are in place which covers quite a few fishing areas as well as fishing protected areas have been introduced in reproduction areas together with the temporary closures.
Market-like instruments to regulate access
Two types of market-like instruments are used in Italy to regulate the access to the resource, namely individual quotas (IQs) in the bluefin tuna fishery and a form of Territorial Use Rights (TURFs) in the clams’ fisheries.
Individual quotas (IQs)
In 1997 the EU joined the International Commission for the Conservation of Atlantic Tunas, which provided for the Total Allowable Catch (TAC) of bluefin tuna (Thunnus thynnus) within the Community waters. Pursuant to the measures established by this inter-governmental body, the European Community has assigned the available quotas among the Member States21 and established specific provisions governing fishing activities, such as temporary withdrawals and minimum catch size. In addition, the Italian legislation provided for criteria directed to:
� establish which vessels to include in the list of those allowed to fish bluefin tuna; and
� allocate individual quotas (IQ).
Italian quota of bluefin tuna is shared among longline, seine and recreational fishery, as well as trap (tonnare, i.e. tuna fixed trap used in the Mediterranean Sea) and UNCL (unclassified, i.e. quotas earmarked for possible compensations).
Vessels performing longline and seine tuna fishery shall be registered in the list of the Directorate-General of Fisheries and Aquaculture. This list records all the vessels allowed to perform longline or seine tuna fishery by the pertinent licence or temporary authorizations which ship owners are entitled to request by submitting the relevant application. In 2003, 212 vessels were included in the ministerial list. This segment accounts for 1% of national number of vessels and for 6% of total GRT.
A sharing of the Italian quota first takes place between the different fishing "systems", based on the unit productivity of each "system". This is followed by a break-down among vessels pertaining to each "system". To date, the overall quota allocated to the longline segment is shared among the registered vessels according to the average value of catches recorded in the statistic statements of each vessel. The quotas are then determined on the basis of the best two years out of the four recorded by each boat. The allocation of quota among the registered seine vessels follows a different methodology. The total annual quota for the seine system is broken down among vessels according to the application of some specific coefficients.
The sports fishermen of bluefin tuna are also required to register on the relevant list of the Directorate-General of Fisheries and Aquaculture. From the 1st May to the 30th September, their activity is restricted to a weekly total catch of one single tunny per
21 Art. 2 of Reg. CE n. 49/1999 establishes the percentages of the annual quota of East Atlantic and Mediterranean bluefin tuna stocks assigned to the Community to be broken down among Member States: France: 33.89%, Greece: 1.77%, Italy: 26.75%, Portugal: 3.23% and Spain: 34.35%.
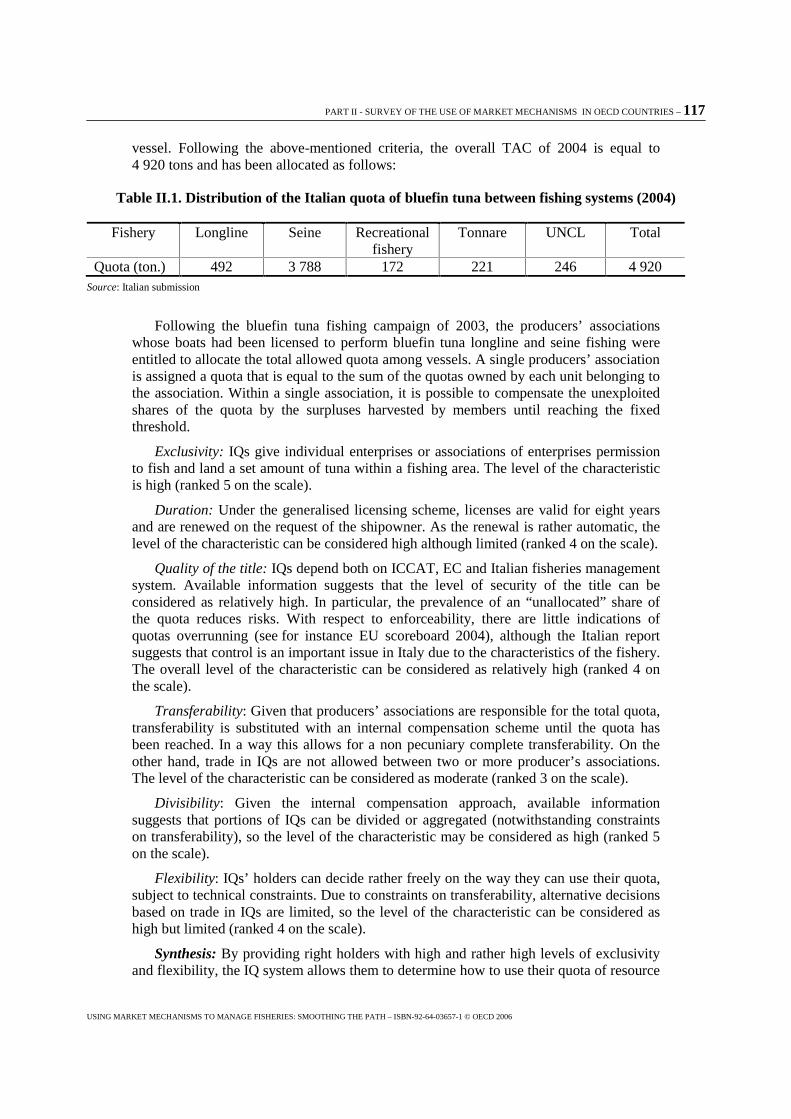
PART II - SURVEY OF THE USE OF MARKET MECHANISMS IN OECD COUNTRIES – 117
USING MARKET MECHANISMS TO MANAGE FISHERIES: SMOOTHING THE PATH – ISBN-92-64-03657-1 © OECD 2006
vessel. Following the above-mentioned criteria, the overall TAC of 2004 is equal to 4 920 tons and has been allocated as follows:
Table II.1. Distribution of the Italian quota of bluefin tuna between fishing systems (2004)
Fishery Longline Seine Recreational fishery
Tonnare UNCL Total
Quota (ton.) 492 3 788 172 221 246 4 920 Source: Italian submission
Following the bluefin tuna fishing campaign of 2003, the producers’ associations whose boats had been licensed to perform bluefin tuna longline and seine fishing were entitled to allocate the total allowed quota among vessels. A single producers’ association is assigned a quota that is equal to the sum of the quotas owned by each unit belonging to the association. Within a single association, it is possible to compensate the unexploited shares of the quota by the surpluses harvested by members until reaching the fixed threshold.
Exclusivity: IQs give individual enterprises or associations of enterprises permission to fish and land a set amount of tuna within a fishing area. The level of the characteristic is high (ranked 5 on the scale).
Duration: Under the generalised licensing scheme, licenses are valid for eight years and are renewed on the request of the shipowner. As the renewal is rather automatic, the level of the characteristic can be considered high although limited (ranked 4 on the scale).
Quality of the title: IQs depend both on ICCAT, EC and Italian fisheries management system. Available information suggests that the level of security of the title can be considered as relatively high. In particular, the prevalence of an “unallocated” share of the quota reduces risks. With respect to enforceability, there are little indications of quotas overrunning (see for instance EU scoreboard 2004), although the Italian report suggests that control is an important issue in Italy due to the characteristics of the fishery. The overall level of the characteristic can be considered as relatively high (ranked 4 on the scale).
Transferability: Given that producers’ associations are responsible for the total quota, transferability is substituted with an internal compensation scheme until the quota has been reached. In a way this allows for a non pecuniary complete transferability. On the other hand, trade in IQs are not allowed between two or more producer’s associations. The level of the characteristic can be considered as moderate (ranked 3 on the scale).
Divisibility: Given the internal compensation approach, available information suggests that portions of IQs can be divided or aggregated (notwithstanding constraints on transferability), so the level of the characteristic may be considered as high (ranked 5 on the scale).
Flexibility: IQs’ holders can decide rather freely on the way they can use their quota, subject to technical constraints. Due to constraints on transferability, alternative decisions based on trade in IQs are limited, so the level of the characteristic can be considered as high but limited (ranked 4 on the scale).
Synthesis: By providing right holders with high and rather high levels of exclusivity and flexibility, the IQ system allows them to determine how to use their quota of resource
118 - PART II - SURVEY OF THE USE OF MARKET MECHANISMS IN OECD COUNTRIES
USING MARKET MECHANISMS TO MANAGE FISHERIES: SMOOTHING THE PATH – ISBN-92-64-03657-1 © OECD 2006
in the least-cost way. In addition, the “collective” form of transferability and divisibility within producer’s association ensures that the resource allocated to a group is exploited in the most appropriate way. Yet, despite rather high levels of duration and quality of the title, limited transferability between groups hardly allows for further adjustment of the fleet. The Italian IQs experience is illustrated in Figure II.6.
Territorial Use Rights in fisheries (TURFs)
In Italy, the fishing of bivalve molluscs performed by means of hydraulic dredges is a relatively recent activity. Introduced in the first years of the 1970s, this type of fishing activity is mainly concentrated along the Adriatic coast of the country. Its target resource is the autochthonous Chamelea gallina (i.e., the clam) and consists of around 700 vessels, representing 4% of national total number of vessels and 4% of total GRT. This fishery is highly specialised.
The actual clam management system is the outcome of a long process that went from the early ‘90s (“trials and failures” development). It was initiated in order to shift responsibility from the central administration to ship owners. The cornerstones of this “self-management” approach are the Local Management Co-ordination Committees, or “local clam consortiums”. The powers granted to these committees were provided for by a central Regulation, which entitled them to determine daily catch quota (evenly among vessels), number of fishing days in a week, season closure, maximum landings, area rotation, allowed gears, periods, landing sites, restocking areas, and the like on the basis of the state of the resource and market.
While the right to access the clam fishery is linked to the licence, i.e. of an individual nature, each holder has to join the consortium to use its right. In this context, the progressive decentralisation of the decision level ends up with a self management regime where territorial use rights (TURFs) were introduced.
Exclusivity: Under the management system in force, territorial exclusive rights are assigned to local consortium. As there is a possibility to prevent outsiders from accessing assigned resource, the level of the characteristic can be considered as high (ranked 5 on the scale).
Duration: Under the generalised licensing scheme, licenses are valid for eight years and are renewed on the request of the shipowner. As the renewal is rather automatic, the level of the characteristic can be considered high although limited (ranked 4 on the scale).
Quality of the title: Powers granted to clam consortium are provided for by a central Regulation. As in addition no other clam licences shall be issued prior to January 1st 2009, a date on which reconsideration on the whole experience is foreseen, the risk is limited. As for the enforceability of the right, the level of compliance is considered as high. One reason for this relies on the sedentary nature of the resource, which makes the enforcement easier. One other (expected) reason is the prevalence of a co-management approach. In this regard, the Italian chapter reports that a command-and-control approach would never have been appropriate. Homogeneity of the fishery segment also plays an important role, as it allows the introduction of rules largely accepted by all fishermen. Lastly, to fix potential problems that can arise with neighbouring Local Management Committees when dredges pass their territorial limit (in the past, for example, in Venice lagoon between the Local Management Committees of Chioggia and Venice), an “inter-consortia” Committee was established at national level. The overall level of the characteristic can be considered as high (ranked 5 on the scale).
PART II - SURVEY OF THE USE OF MARKET MECHANISMS IN OECD COUNTRIES – 119
USING MARKET MECHANISMS TO MANAGE FISHERIES: SMOOTHING THE PATH – ISBN-92-64-03657-1 © OECD 2006
Transferability: Formally, the transfer of right between owners is forbidden. In practice however, indications suggested that transferability can be to a certain extent allowed, so the level of the characteristic can be considered as rather low in the long run. In addition, it should be noted that in the short run, there is no distribution (or individual allocation) of the community quota among members. There is thus no need for “formal” transferability within the group, as transferability de facto takes place when deciding how to harvest the community quota22. As a result, the overall level of the characteristic can be considered as moderate (ranked 3 on the scale).
Divisibility: At a community level, the right to access the resource concerns a quantity of fish that can be divided and aggregated. The level of the characteristic can thus be considered as high in the short term. Yet, at the individual fisher level, available information suggests that the right to access the community quota concerns the licence, which is not divisible per se. This restricts the “long term” divisibility of the right, and subsequently the individual ability to adjust. As a result, the level of the characteristic can be considered as high but limited (ranked 4 on the scale).
Flexibility: Local consortiums decide on numerous regulations that limit the freedom of operation of individual fishermen (see above). On the one hand, individual flexibility appears to be limited. However, it should be noted that those stringent measures are “self-restrictive”, i.e. decided collectively by members of the consortium. In this case, it can be considered that the “collective flexibility” is rather high, as fishers are free (with respect to some general limitations) to decide how they want harvesting their ground (ranked 4 on the scale).
Synthesis: The TURF system provides participants with high and rather high levels of exclusivity, duration and quality of the title, allowing for long term investment to be realised. This is partly reflected by the increase in licence price reported in the Italian chapter, although the level of transferability is in principle limited. In the short term, rather high levels of (de facto) transferability, divisibility and “collective flexibility” allow for the appropriate use of the resource. The Italian TURFs experience is illustrated in Figure II.6.
22 In practice, everything takes place just as if the members of the pool were allocated an individual share of the quota and subsequently decided to trade it freely in order to maximise their annual privilege. In this context, maximisation of individual profit derives from the maximisation of collective profit.
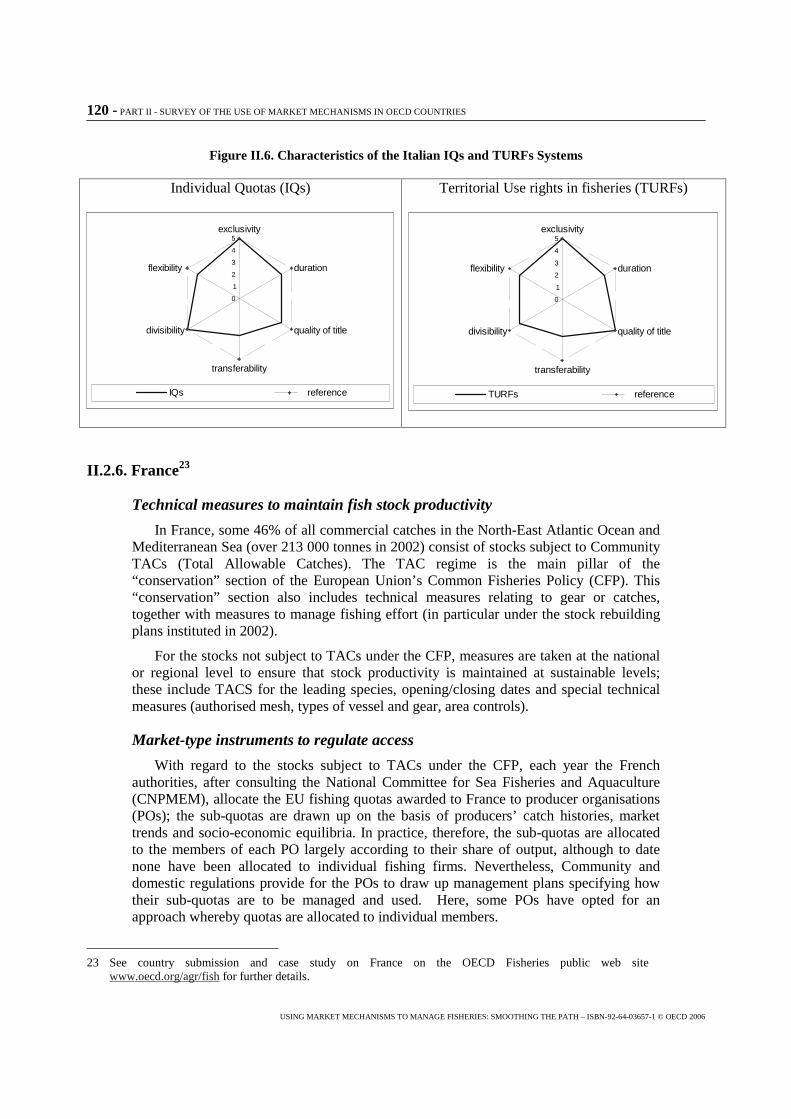
120 - PART II - SURVEY OF THE USE OF MARKET MECHANISMS IN OECD COUNTRIES
USING MARKET MECHANISMS TO MANAGE FISHERIES: SMOOTHING THE PATH – ISBN-92-64-03657-1 © OECD 2006
Figure II.6. Characteristics of the Italian IQs and TURFs Systems
Individual Quotas (IQs)
0
1
2
3
4
5exclusivity
duration
quality of title
transferability
divisibility
flexibility
IQs reference
Territorial Use rights in fisheries (TURFs)
0
1
2
3
4
5exclusivity
duration
quality of title
transferability
divisibility
flexibility
TURFs reference
II.2.6. France23
Technical measures to maintain fish stock productivity
In France, some 46% of all commercial catches in the North-East Atlantic Ocean and Mediterranean Sea (over 213 000 tonnes in 2002) consist of stocks subject to Community TACs (Total Allowable Catches). The TAC regime is the main pillar of the “conservation” section of the European Union’s Common Fisheries Policy (CFP). This “conservation” section also includes technical measures relating to gear or catches, together with measures to manage fishing effort (in particular under the stock rebuilding plans instituted in 2002).
For the stocks not subject to TACs under the CFP, measures are taken at the national or regional level to ensure that stock productivity is maintained at sustainable levels; these include TACS for the leading species, opening/closing dates and special technical measures (authorised mesh, types of vessel and gear, area controls).
Market-type instruments to regulate access
With regard to the stocks subject to TACs under the CFP, each year the French authorities, after consulting the National Committee for Sea Fisheries and Aquaculture (CNPMEM), allocate the EU fishing quotas awarded to France to producer organisations (POs); the sub-quotas are drawn up on the basis of producers’ catch histories, market trends and socio-economic equilibria. In practice, therefore, the sub-quotas are allocated to the members of each PO largely according to their share of output, although to date none have been allocated to individual fishing firms. Nevertheless, Community and domestic regulations provide for the POs to draw up management plans specifying how their sub-quotas are to be managed and used. Here, some POs have opted for an approach whereby quotas are allocated to individual members.
23 See country submission and case study on France on the OECD Fisheries public web site www.oecd.org/agr/fish for further details.
PART II - SURVEY OF THE USE OF MARKET MECHANISMS IN OECD COUNTRIES – 121
USING MARKET MECHANISMS TO MANAGE FISHERIES: SMOOTHING THE PATH – ISBN-92-64-03657-1 © OECD 2006
A number of stocks not covered by TACs under the CFP are subject to relatively strict access controls aimed at preventing overfishing and the development of excess capacity. The main market-type instruments among them are limited non-transferable licences (LNTL), individual non-transferable effort quotas (IEs, which limit hours spent fishing, for instance, or the number of traps per vessel) and catch limits per vessel/person (VCs). These measures mainly target stocks of shellfish (e.g. scallops, clams and whelks) and large crustaceans (e.g. spider and other crabs). To grasp their full scope, it is important to note that access to the vast majority of “non-Community” fisheries is closed, in particular by means of limited licences and special fishing permits (permis de pêche spéciaux, or PPS).
These instruments to regulate access are usually used in tandem in order to adjust to the specific conditions prevailing in each fishery. To illustrate this use of market-type instruments in France, this paper describes two scallop fisheries (the species ranked fourth in terms of value in 2002), one in the Baie de Saint-Brieuc (limited licences + quota of hours) and the other in the Baie de Seine (limited licences + daily and weekly catch quotas).
Scallop is mainly a seasonal, inshore fishery. It is also a targeted fishery based exclusively on dredging. The main scallop beds lie in two bays in the English Channel, namely the Baie de Seine in the Eastern Channel (worked by some 210 of the 380 vessels in that sea area) and the Baie de Saint-Brieuc in the Western Channel (worked by some 260 vessels registered mainly in Northern Brittany). In both cases, the following are decided at the national level:
� Number of licences allocated to each region,
� General requirements for the allocation of licences (one being that the vessel must already hold a permit known as the permis de mise en exploitation, or PME),
� General rules governing priority with regard to licence allocation,
� Harvesting constraints, including the national fishery closure from 15 May to 30 September,
� Technical measures (e.g. authorised types of gear; size of dredge rings).
� At the regional level, there are additional rules:
� Licence allocation rules, in particular a quota of licences per bed,
� Restrictions on access to beds, placing ceilings on vessel size and engine power,
� Rules governing priority with regard to allocation
� Access restrictions such as weekly closures, daily and weekly quotas and gear constraints (number and length of dredges).
As a prerogative conferred on the industry by the Act of 2 May 1991, these measures are agreed by a majority of commercial fishermen and their representatives, under the legal supervision of the authorities. Their aim is to maintain a balance between resource management and economic activity in terms of not only profitability, but also social, economic and local development (e.g. jobs, land/sea structures). These industry-generated measures supplement, of course, Community standards.
In both cases, licences are issued on a “paired” (owner-vessel) basis by the Regional Committee for Sea Fisheries and Aquaculture, acting on the advice of a board of
122 - PART II - SURVEY OF THE USE OF MARKET MECHANISMS IN OECD COUNTRIES
USING MARKET MECHANISMS TO MANAGE FISHERIES: SMOOTHING THE PATH – ISBN-92-64-03657-1 © OECD 2006
commercial fishermen supervised by the government, and are valid for a period not exceeding one season/year.
Any differences between the two fisheries lie in the nature of the fishing rights tied to the licence. In the case of the Baie de Saint-Brieuc, access to the fishery is limited to a specific number of hours per week, based on the annual TAC (an average of 1.5 hours per week in 2003, for instance). This makes it an individual non-transferable effort quota (IE). In the Baie de Seine, access is restricted by limits on daily and weekly catches per vessel/person. This is a variation on the system of regulation based on vessel catch limits (VCs).
Exclusivity: a system of fishing licences entitles a limited number of holders to fish for a limited volume of scallops and prohibits access to the fishing grounds by those without licences.
� Baie de Saint-Brieuc: access is regulated in terms of the number of hours fished per vessel. Each vessel is allocated the same number of hours. Given the nature of the fishery, the level of this characteristic can be considered very high (ranked 5 on the scale).
� Baie de Seine: access is regulated by ceilings on daily and weekly catches per vessel/person. The system gives licence-holders some exclusivity, in that each operator knows the others are subject to the same restrictions. However, as this is a relatively heterogeneous fishery in terms of vessel size and harvesting strategies, there may be some competition, as shown by the large catches landed early in the season. Moreover, a section of the regulated fishery lies outside French waters (beyond the 12-mile limit) where French management rules do not apply to foreign vessels. Finally, by virtue of the historic fishing rights enjoyed by some Member States, some foreign vessels are allowed to fish here (between the 6 and 12 mile limits) and, since the CFP reform, specific common rules now apply to them. The level of this characteristic can therefore be considered moderate (ranked 3 on the scale).
Duration: in both cases, licences are issued for one year/season, but the likelihood of renewal is strong in that those applicants with licences in any given year have priority the following year. The duration of these licences is theoretically short but in practice fairly long (ranked 4 on the scale).
Quality of title: fishing rights are granted for one year with a strong likelihood of renewal (see “Duration” above), except when a risk emerges of non-renewal of the resource (i.e. there is no TAC or one that is set too high). Any risks stemming from fishing are curbed by technical measures; only accidental factors (e.g. pollution) cannot be mitigated. The title can be considered relatively safe. As for the verifiability of these fishing rights, the situation varies according to the beds and fisheries concerned, although in principle catches must be declared at specified landing points. In the event of a dispute, commercial fishermen are entitled to bring their case before the French administrative courts.
� Baie de Saint-Brieuc: access to this fishery is regulated by specifying the days on which scallops may be harvested. This is an effective means of verifying landings, particularly since they are heavily concentrated geographically. Furthermore, monitoring and enforcement also feature an airborne surveillance system financed largely by the industry. Title quality can therefore be viewed as high (ranked 5 on the scale).
PART II - SURVEY OF THE USE OF MARKET MECHANISMS IN OECD COUNTRIES – 123
USING MARKET MECHANISMS TO MANAGE FISHERIES: SMOOTHING THE PATH – ISBN-92-64-03657-1 © OECD 2006
� Baie de Seine: given the size of the fishery and length of the season, the relatively large number of landing points and the presence of foreign vessels, monitoring and enforcement are harder in the Baie de Seine. As there may still be some fraudulent behaviour or under-reporting, quality is somewhat limited (ranked 3 on the scale).
Transferability/divisibility: licence holders are not allowed to transfer their licences, nor any of their catch/hour quotas, to a person of their choice. In theory, there is therefore zero transferability/divisibility (ranked 0 on the scale). In practice, however, quota-based licences add value to used vessels when they are sold on. This is because when a vessel that has operated in a specific type of fishery is sold by a vendor who is leaving the fishery, the new owner does have some priority with regard to a new license. With the application of that priority, the fishing right becomes informally transferable, via the sale of the vessel. By and large, it is therefore reasonable to view these characteristics as relatively low (ranked 2 on the scale).
Flexibility:
� Baie de Saint-Brieuc: owing to the technical constraints imposed on vessels and gear, and the closure dates, there is very little flexibility here, even though operators may “adjust” the number of crew members to make optimal use of their quota of hours. This characteristic should therefore be viewed as low (ranked 1 on the scale).
� Baie de Seine: there are also technical constraints in terms of fishing gear and vessel size. However, they are less stringent than in the Baie de Saint-Brieuc. And as catch quotas are partly linked to the size of the crew, operators do have room for manoeuvre in their harvesting strategies. Finally, the length of the season allows trade-offs between fisheries and alternative activities. This characteristic can accordingly be viewed as high but limited (ranked 4 on the scale).
Synthesis:
� Baie de Saint-Brieuc: By offering several levels of exclusivity, duration and quality in terms of property rights, the management system based on individual non-transferable effort quotas is designed to incite licence-holders to invest in the fishery. The type of system in place should in theory curb tendencies to overfish and overcapitalise. It is worth noting, however, that the scope for gearing the fishing fleet to resource productivity is somewhat restricted by the low (if any) transferability of fishing rights. In the short term, the lack of transferability of these rights, together with the constraints on their use, may make it hard to adapt to technical, economic or environmental change.
� Baie de Seine: By offering relatively high or moderate levels of exclusivity, duration and quality, the management system based on daily and weekly catch limits per vessel/person is designed to reduce tendencies to “race for fish” and overcapitalise, without eliminating them altogether. In the short term, relatively high flexibility allows licence-holders to exploit their catch limits effectively, although their freedom of action is still partly restricted by the fact that licences are not transferable. France’s experience of individual non-transferable effort quotas (IEs) and vessel catch limits (VCs) are illustrated in Figure II.7.
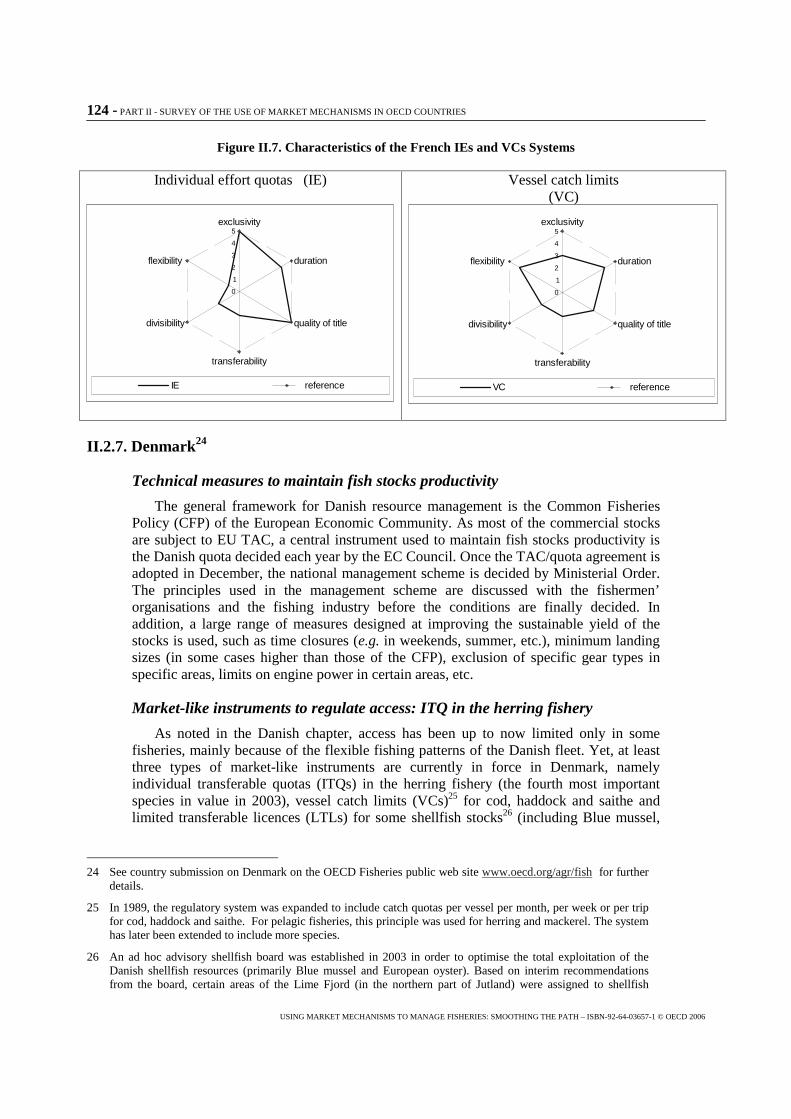
124 - PART II - SURVEY OF THE USE OF MARKET MECHANISMS IN OECD COUNTRIES
USING MARKET MECHANISMS TO MANAGE FISHERIES: SMOOTHING THE PATH – ISBN-92-64-03657-1 © OECD 2006
Figure II.7. Characteristics of the French IEs and VCs Systems
Individual effort quotas (IE)
0
1
2
3
4
5exclusivity
duration
quality of title
transferability
divisibility
flexibility
IE reference
Vessel catch limits (VC)
0
1
2
3
4
5exclusivity
duration
quality of title
transferability
divisibility
flexibility
VC reference
II.2.7. Denmark24
Technical measures to maintain fish stocks productivity
The general framework for Danish resource management is the Common Fisheries Policy (CFP) of the European Economic Community. As most of the commercial stocks are subject to EU TAC, a central instrument used to maintain fish stocks productivity is the Danish quota decided each year by the EC Council. Once the TAC/quota agreement is adopted in December, the national management scheme is decided by Ministerial Order. The principles used in the management scheme are discussed with the fishermen’ organisations and the fishing industry before the conditions are finally decided. In addition, a large range of measures designed at improving the sustainable yield of the stocks is used, such as time closures (e.g. in weekends, summer, etc.), minimum landing sizes (in some cases higher than those of the CFP), exclusion of specific gear types in specific areas, limits on engine power in certain areas, etc.
Market-like instruments to regulate access: ITQ in the herring fishery
As noted in the Danish chapter, access has been up to now limited only in some fisheries, mainly because of the flexible fishing patterns of the Danish fleet. Yet, at least three types of market-like instruments are currently in force in Denmark, namely individual transferable quotas (ITQs) in the herring fishery (the fourth most important species in value in 2003), vessel catch limits (VCs)25 for cod, haddock and saithe and limited transferable licences (LTLs) for some shellfish stocks26 (including Blue mussel,
24 See country submission on Denmark on the OECD Fisheries public web site www.oecd.org/agr/fish for further details.
25 In 1989, the regulatory system was expanded to include catch quotas per vessel per month, per week or per trip for cod, haddock and saithe. For pelagic fisheries, this principle was used for herring and mackerel. The system has later been extended to include more species.
26 An ad hoc advisory shellfish board was established in 2003 in order to optimise the total exploitation of the Danish shellfish resources (primarily Blue mussel and European oyster). Based on interim recommendations from the board, certain areas of the Lime Fjord (in the northern part of Jutland) were assigned to shellfish
PART II - SURVEY OF THE USE OF MARKET MECHANISMS IN OECD COUNTRIES – 125
USING MARKET MECHANISMS TO MANAGE FISHERIES: SMOOTHING THE PATH – ISBN-92-64-03657-1 © OECD 2006
the fifth most important species in value in 2003). In addition, it should be noted that the introduction of IQ schemes for mackerel and the industrial fishery is currently under consideration. In the demersal fishery a committee has also been looking into alternative management models – for example by pooling quotas and capacity. Based on information currently available, the following addresses the ITQ system in the herring fishery only.
Individual transferable quotas (ITQs)
In 2003, a system of Individual Transferable Quotas was introduced for herring in the North Sea, Skagerrak and Kattegat. ITQs constitute a share of the total quota and are distributed to vessels according to their historical catches.
Exclusivity: ITQs give individual enterprises or associations of enterprises permission to fish and land a set amount of herring within a fishing area. The level of the characteristic is high (ranked 5 on the scale).
Duration: For the moment, ITQs for herring is expected to run for 5 years until the end of 2007. As some uncertainty exists about the perpetuation of the system after this date, the level of the characteristic can be considered as moderate (ranked 3 on the scale).
Quality of the title: ITQ system depends on rules contained in both EC and Danish fisheries management system. As long as both schemes are unchanged, available information suggests that the level of security of the title can be considered as relatively high. Yet, possible revision of both systems creates some uncertainty. With respect to enforceability, there are little indications of quotas overrunning, and Denmark is reported to be the only EU Member State which complied fully with reporting rules (see for instance EU scoreboard 2004). The overall level of the characteristic can be considered as relatively high (ranked 4 on the scale).
Transferability: Available information suggests that the only restriction to transferability concerns the foreign participation to the system, so the level of the characteristic is high but limited to a point (ranked 4 on the scale).
Divisibility: Any fraction of the ITQ can be divided or aggregated, so the level of the characteristic is high (ranked 5 on the scale).
Flexibility: Available information suggests that few restrictions are set on the way of using ITQs. Notable exceptions concern fishing gear measures and days at sea limitations. As a result, the level of the characteristic can be considered as high but limited (ranked 4 on the scale).
Synthesis: Rather high levels for exclusivity and quality of the title are expected to incite rights owners to invest appropriately in the fishery, although this may be partly limited due to uncertainty on the perpetuation of the system. In the shorter term, by providing high and rather high levels for transferability, divisibility and flexibility, the Danish ITQ program provides an opportunity for the industry to make appropriate use of the Danish quota, although several restriction are in place. The Danish Individual Transferable Quota system (ITQ) is illustrated in Figure II.8.
production, and licensing began in early 2004. The recommendations of the board (2004) include transferable 5- year licenses.
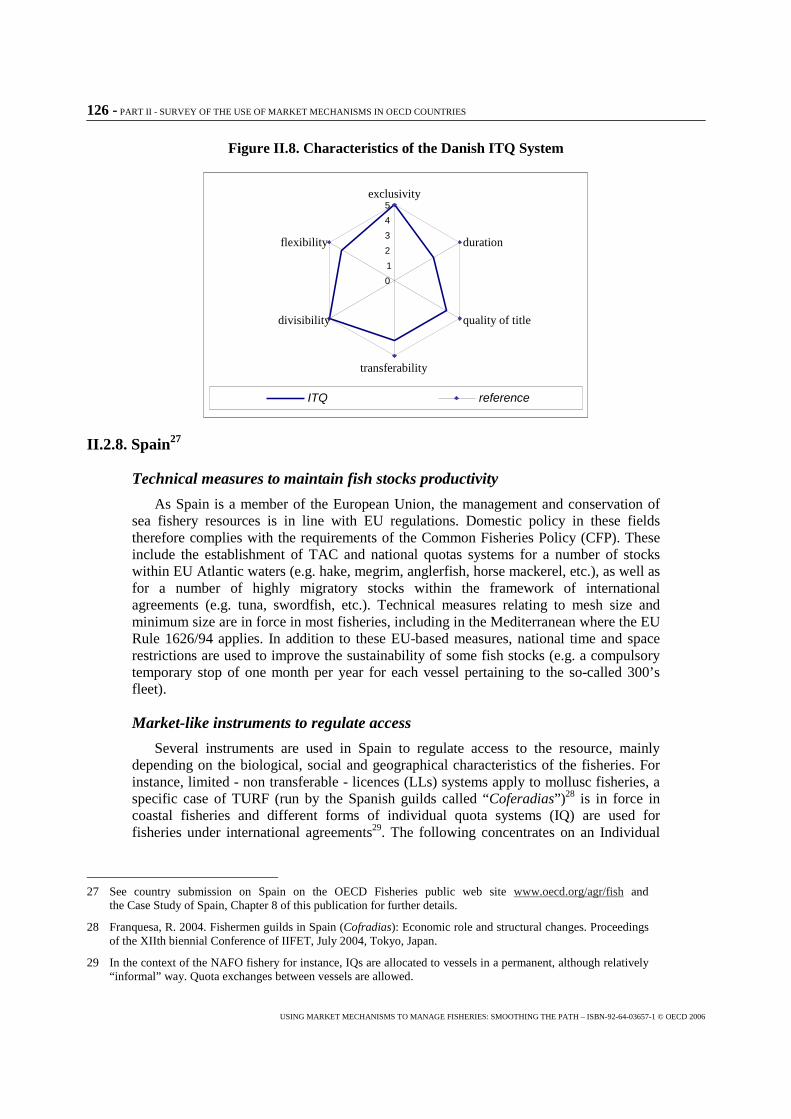
126 - PART II - SURVEY OF THE USE OF MARKET MECHANISMS IN OECD COUNTRIES
USING MARKET MECHANISMS TO MANAGE FISHERIES: SMOOTHING THE PATH – ISBN-92-64-03657-1 © OECD 2006
Figure II.8. Characteristics of the Danish ITQ System
II.2.8. Spain27
Technical measures to maintain fish stocks productivity
As Spain is a member of the European Union, the management and conservation of sea fishery resources is in line with EU regulations. Domestic policy in these fields therefore complies with the requirements of the Common Fisheries Policy (CFP). These include the establishment of TAC and national quotas systems for a number of stocks within EU Atlantic waters (e.g. hake, megrim, anglerfish, horse mackerel, etc.), as well as for a number of highly migratory stocks within the framework of international agreements (e.g. tuna, swordfish, etc.). Technical measures relating to mesh size and minimum size are in force in most fisheries, including in the Mediterranean where the EU Rule 1626/94 applies. In addition to these EU-based measures, national time and space restrictions are used to improve the sustainability of some fish stocks (e.g. a compulsory temporary stop of one month per year for each vessel pertaining to the so-called 300’s fleet).
Market-like instruments to regulate access
Several instruments are used in Spain to regulate access to the resource, mainly depending on the biological, social and geographical characteristics of the fisheries. For instance, limited - non transferable - licences (LLs) systems apply to mollusc fisheries, a specific case of TURF (run by the Spanish guilds called “Coferadias”)28 is in force in coastal fisheries and different forms of individual quota systems (IQ) are used for fisheries under international agreements29. The following concentrates on an Individual
27 See country submission on Spain on the OECD Fisheries public web site www.oecd.org/agr/fish and the Case Study of Spain, Chapter 8 of this publication for further details.
28 Franquesa, R. 2004. Fishermen guilds in Spain (Cofradias): Economic role and structural changes. Proceedings of the XIIth biennial Conference of IIFET, July 2004, Tokyo, Japan.
29 In the context of the NAFO fishery for instance, IQs are allocated to vessels in a permanent, although relatively “informal” way. Quota exchanges between vessels are allowed.
0 1 2 3 4 5
exclusivity
duration
quality of title
transferability
divisibility
flexibility
ITQ reference
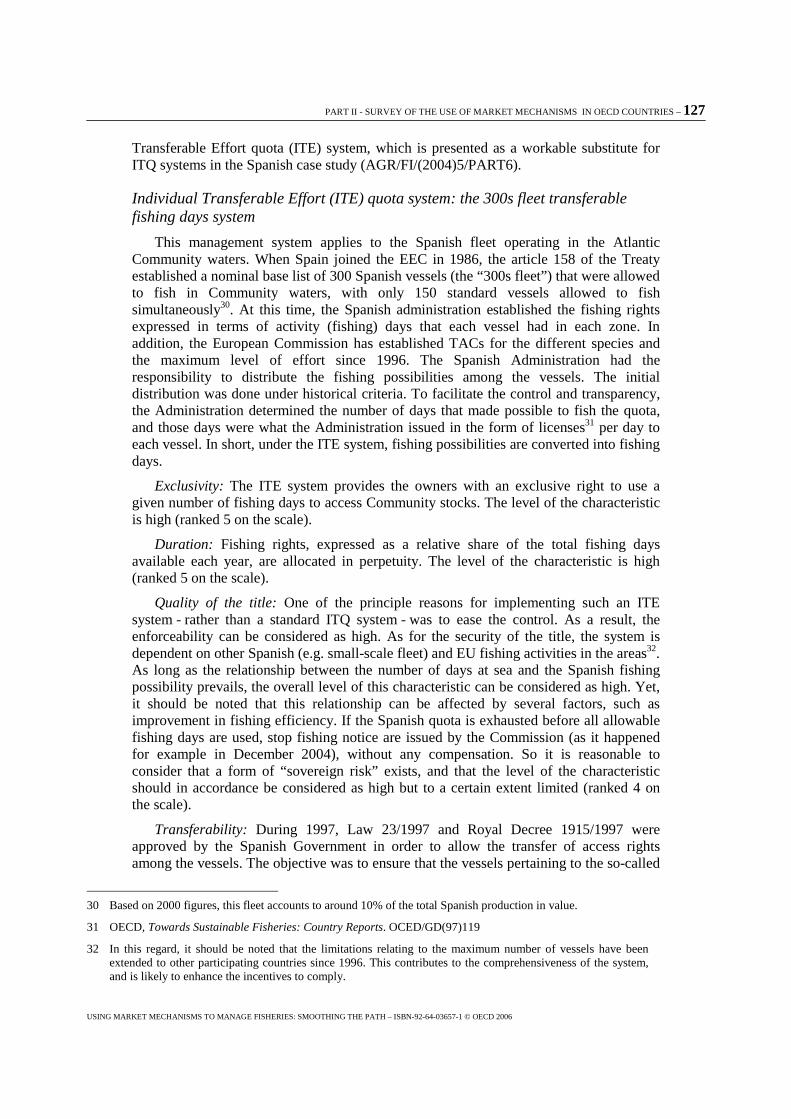
PART II - SURVEY OF THE USE OF MARKET MECHANISMS IN OECD COUNTRIES – 127
USING MARKET MECHANISMS TO MANAGE FISHERIES: SMOOTHING THE PATH – ISBN-92-64-03657-1 © OECD 2006
Transferable Effort quota (ITE) system, which is presented as a workable substitute for ITQ systems in the Spanish case study (AGR/FI/(2004)5/PART6).
Individual Transferable Effort (ITE) quota system: the 300s fleet transferable fishing days system
This management system applies to the Spanish fleet operating in the Atlantic Community waters. When Spain joined the EEC in 1986, the article 158 of the Treaty established a nominal base list of 300 Spanish vessels (the “300s fleet”) that were allowed to fish in Community waters, with only 150 standard vessels allowed to fish simultaneously30. At this time, the Spanish administration established the fishing rights expressed in terms of activity (fishing) days that each vessel had in each zone. In addition, the European Commission has established TACs for the different species and the maximum level of effort since 1996. The Spanish Administration had the responsibility to distribute the fishing possibilities among the vessels. The initial distribution was done under historical criteria. To facilitate the control and transparency, the Administration determined the number of days that made possible to fish the quota, and those days were what the Administration issued in the form of licenses31 per day to each vessel. In short, under the ITE system, fishing possibilities are converted into fishing days.
Exclusivity: The ITE system provides the owners with an exclusive right to use a given number of fishing days to access Community stocks. The level of the characteristic is high (ranked 5 on the scale).
Duration: Fishing rights, expressed as a relative share of the total fishing days available each year, are allocated in perpetuity. The level of the characteristic is high (ranked 5 on the scale).
Quality of the title: One of the principle reasons for implementing such an ITE system - rather than a standard ITQ system - was to ease the control. As a result, the enforceability can be considered as high. As for the security of the title, the system is dependent on other Spanish (e.g. small-scale fleet) and EU fishing activities in the areas32. As long as the relationship between the number of days at sea and the Spanish fishing possibility prevails, the overall level of this characteristic can be considered as high. Yet, it should be noted that this relationship can be affected by several factors, such as improvement in fishing efficiency. If the Spanish quota is exhausted before all allowable fishing days are used, stop fishing notice are issued by the Commission (as it happened for example in December 2004), without any compensation. So it is reasonable to consider that a form of “sovereign risk” exists, and that the level of the characteristic should in accordance be considered as high but to a certain extent limited (ranked 4 on the scale).
Transferability: During 1997, Law 23/1997 and Royal Decree 1915/1997 were approved by the Spanish Government in order to allow the transfer of access rights among the vessels. The objective was to ensure that the vessels pertaining to the so-called
30 Based on 2000 figures, this fleet accounts to around 10% of the total Spanish production in value.
31 OECD, Towards Sustainable Fisheries: Country Reports. OCED/GD(97)119
32 In this regard, it should be noted that the limitations relating to the maximum number of vessels have been extended to other participating countries since 1996. This contributes to the comprehensiveness of the system, and is likely to enhance the incentives to comply.
128 - PART II - SURVEY OF THE USE OF MARKET MECHANISMS IN OECD COUNTRIES
USING MARKET MECHANISMS TO MANAGE FISHERIES: SMOOTHING THE PATH – ISBN-92-64-03657-1 © OECD 2006
300s fleet could have enough days to fish in reasonable conditions. The owners of the vessels could transfer these days under private agreement (no data on cost of the transfer was required). When two vessels (old and new owner) communicate the change of their fishing rights, the administration accepted this license transfer. Then it was allowed to “acquire” (or “accumulate” within an association or firm) a vessels’ fishing rights. Transferability is yet restricted by the fact that Royal Decree 1596/2004, modifying RD 1915, has established a minimum of fishing possibilities that any vessel must own in order to be allowed to fish. The level of the characteristic can thus be considered as high, but limited (ranked 4 on the scale).
Divisibility: The fishing right is expressed in terms of fishing days. Fishing days can be aggregated without any restriction. It could be noted that it is not allowed to divide a day at sea into hours, which limits the intrinsic divisibility. Yet, in this fishery’s context, the day can be seen as the lowest workable unit of time. The level of the characteristic can be considered as high (ranked 5 on the scale).
Flexibility: Under this ITE system, fishing operators are in principle free to decide when and how they want to use their fishing days. Yet, due to the limitation regarding the number of standard vessels allowed to fish simultaneously in the same zone, operators can not decide to fish wherever they wanted. As the 300s fleet targets Community stocks, its activity is also subject to the technical measures set at EU levels (including in the framework of recovery plans). In addition, the Spanish Administration introduced a supplementary restriction at national level, consisting of a compulsory temporary stop of one month per year for each vessel, which can be divided into two periods of 15 days. While the need of establishing this measure is considered each year, depending on the TAC approved at the Community level, operators’ freedom of decision is further affected. The level of the characteristic can be considered as moderate (ranked 3 on the scale).
Synthesis: By providing relatively high level of long-term transferability, the system allowed the concentration of the fishing rights in the most efficient vessels. Doing so, technological innovation and intensive use of capital are encouraged, which may ease the structural adjustment of the fleet. By allowing for short term transferability (leasing) and providing high level of divisibility and some degrees of flexibility, the system is expected to ease the optimal use of limited fishing days. The Spanish transferable fishing days system (ITE) is illustrated in Figure II.9.
Figure II.9. Characteristics of the Spanish ITE System
0
1
2
3
4
5exclusivity
duration
quality of title
transferability
divisibility
flexibility
ITE reference
PART II - SURVEY OF THE USE OF MARKET MECHANISMS IN OECD COUNTRIES – 129
USING MARKET MECHANISMS TO MANAGE FISHERIES: SMOOTHING THE PATH – ISBN-92-64-03657-1 © OECD 2006
II.2.9. Portugal33
Technical measures to maintain fish stock productivity
In Portugal, restrictions on catch have been imposed in the form of TACs since 1986. Every year, TACs are set for individual species and fishing zones and published in EU Council Regulations which also specify how they are to be allocated among Member States. In Portuguese waters, the stocks subject to TACs include anchovy, megrim, anglerfish, whiting, hake, blue whiting, Norway lobster, plaice, Pollack, mackerel, sole and horse mackerel. At present some Portuguese quotas remain partially unused and are therefore traded with other Member States to ensure optimal use without affecting relative stability.
Supplementing catch limits and special conservation measures, the technical measures traditionally used to maintain stock productivity at sustainable levels include minimum landing sizes, minimum mesh sizes, allowable percentages for by-catch species and target species, area closures and bans on the use of specific gear.
Market-type instruments to regulate access
In addition to the general fishing licences regulating access to the industry, at least two market-type instruments are used in Portugal to regulate access: (1) a community quota system (CQ) for sardine fisheries (the leading species in terms of volume, accounting for some 36% of domestic landings), and (2) systems of individual quotas (IQ) that are partially transferable in the case of industrial deep-sea fisheries (NAFO, NEAFC, ICCAT).
Community quotas (CQ)
This means of regulating access is used to manage sardine fisheries. Sardine is the main Portuguese catch and the leading resource in Portuguese waters. It is managed under the “Action Plan for Sardine Fishing”, which is the first experiment in shared resource management in the Portuguese fishing industry. For the first time, fishery quotas have been allocated directly to the relevant Producer Organisations (POs). Although no TACs or community quotas have been set by the Council for this species, the Portuguese authorities have imposed a ceiling on catches for all POs and for individual POs, based on scientific advice. The authorities do not intervene in the allocation of quotas within each PO. The vessels (seine netters) authorised to fish for sardine must not exceed their daily catch limits set by each PO.
Exclusivity: The management system is based on the allocation of fishing rights to a clearly defined group of users. The quotas allocated to POs were initially based on the sardine catch history of their member vessels. In order to curb competition within the fishery, a system was introduced to limit the number of fishing days to 180. In theory, therefore, exclusivity can be viewed as high (ranked 5 on the scale).
Duration: Community quotas are allocated to POs on a permanent basis. The level of this characteristic is therefore high (ranked 5 on the scale).
33 See country submission on Portugal on the OECD Fisheries public web site www.oecd.org/agr/fish for further details.
130 - PART II - SURVEY OF THE USE OF MARKET MECHANISMS IN OECD COUNTRIES
USING MARKET MECHANISMS TO MANAGE FISHERIES: SMOOTHING THE PATH – ISBN-92-64-03657-1 © OECD 2006
Quality of title: Inasmuch as quota management decisions are made at the national level and some responsibility is delegated to local players, there is in theory little risk of a unilateral withdrawal of fishing rights. However, while these community quotas are allocated to POs on the basis of criteria such as catch history, they do not constitute acquired rights for POs and may be subject to adjustment.�This scope for change does limit security of title. Conversely, the fact that POs have been asked in recent years to monitor fishing effort and enforce quotas, fishery closures and measures affecting commercial information (product grading, consumer information) means that monitoring is more efficient, which in turn improves enforceability. The overall level of this characteristic can accordingly be viewed as moderate (ranked 3 on the scale).
Transferability: As management takes the form of collectively regulated access, there is no need for “formal” transferability within the group, since it exists de facto as soon as the group decides how it will harvest its community quota34. While this is not conducive to structural adjustment within the fleet, it should be noted that vessels may be transferred between POs. Consequently the overall level of this characteristic is relatively low (ranked 3 on the scale).
Divisibility: In individual POs, rights of access to the resource cover specific amounts of fish which can be subdivided and aggregated. The level of this characteristic can thus be viewed as high in the short term, as it enables the community concerned to adapt to possible environmental or economic developments. However, at the individual level, the information available tends to show that access to community quota is granted in the form of a licence which, by definition, is not divisible. This restricts the “long-term” divisibility of the right and hence the scope for adjustment on the part of individual members. This characteristic may accordingly be viewed as high but limited (ranked 4 on the scale).
Flexibility: By and large, flexibility at the individual level is restricted by decisions on authorised fishing periods (180 fishing days excluding weekends) or the setting of daily fishing quotas. However, it is worth noting that these strict measures are based on “self-discipline”, since decisions are taken collectively. The degree of “collective flexibility” can therefore be viewed as relatively high, as fishers are free (subject to some general limitations), to define how they will harvest the fishing grounds to which they have access (ranked 4 on the scale).
Synthesis: It has been estimated that the relatively high levels of exclusivity, duration and enforceability curb the incentives to “race for fish” and encourage the industry to restrict its fishing effort depending on the status of the resource in order to conserve stocks and stabilise catches. One advantage of the joint management of community quotas is that it regulates the market by limiting daily catch sizes, thereby avoiding discards and withdrawals. Portugal’s community quota system (CQ) is illustrated in Figure II.10.
Individual quotas
An individual quota system is used in Portugal for the deep-sea fisheries covered by regional fisheries organisations (RFOs). In 1992, individual quotas per vessel were set for the first time as a means of regulating the distant-water fleet in the North Atlantic (NAFO
34 See note 22. In practice, it is as if each member of the group were given an individual share of the quota and then decided to exchange it freely in order to derive the greatest possible benefit from their annual fishing right. Seen in this perspective, optimising individual benefits depends on first optimising collective benefits.
PART II - SURVEY OF THE USE OF MARKET MECHANISMS IN OECD COUNTRIES – 131
USING MARKET MECHANISMS TO MANAGE FISHERIES: SMOOTHING THE PATH – ISBN-92-64-03657-1 © OECD 2006
and Spitzberg). Portuguese quotas are allocated to individual vessels for various species in the NAFO, NEAFC, Norway and Spitzberg fisheries, but are confined to swordfish in the North Atlantic under the ICCAT regime.
As Portugal is a Member of the EU, individual quotas are generally defined as follows:
a. TACs are defined within each RPO, b. EU quotas are set, c. EU quotas are allocated to the relevant Member States, d. The Portuguese quota is allocated using various methods.
Under the NAFO regime, annual quotas are allocated using a formula (percentage of the overall Portuguese quota) based on economic criteria initially agreed upon by the authorities and ship-owners associations. The formula is permanent but subject to adjustment. However, the annual quotas do not belong to vessels or owners and may be cut or withdrawn by the authorities at any time.
Under the ICCAT regime (i.e. for swordfish), the quotas are permanent and were initially allocated on the basis of catch history35.
In spite of differences across the RPOs and species concerned, the leading characteristics of Portugal’s individual quota system (IQ) can be described as follows:
Exclusivity: participants in the IQ regime are allocated a specific share of the quota awarded to the zone/fleet. By directly granting the right to catch a specific amount of fish, IQs generally give holders relatively high exclusivity. Provided that quotas are not used competitively, the level of this characteristic can be viewed as high (ranked 5 on the scale).
Duration: The quotas are allocated using a formula that is usually permanent (see above). The level of this characteristic can therefore be viewed as high (ranked 5 on the scale).
Quality of title: This varies across RPOs. In all except ICCAT, however, the quotas can in theory be cut or withdrawn by the authorities at any time. This generates great uncertainty as to the permanency of fishing rights (risk of pre-emption by the State). And, as is often the case with RPOs, the quotas allocated to a country may be heavily contingent upon external factors (such as the arrival of a new member). Finally, the problems encountered by a large number of RPOs in combating IUU fishing (OECD, 2005) tend to limit enforceability in the relevant fisheries. Consequently, the overall level for this characteristic can be viewed as relatively low (ranked 2 on the scale).
Transferability: The individual quotas allocated by the authorities are transferable between vessels solely in the course of the campaign, and with the prior authorisation of the authorities subject to a formal declaration by the owners concerned. By and large, these exchanges do not give rise to financial transactions between private ship-owners and should accordingly be viewed more as reciprocal exchanges for the duration of the fishing campaign. Overall, the level for this characteristic can therefore be viewed as relatively low (ranked 3 on the scale).
35 Quotas for this species were also allocated to vessels affected by the end of the fisheries agreement with Morocco.
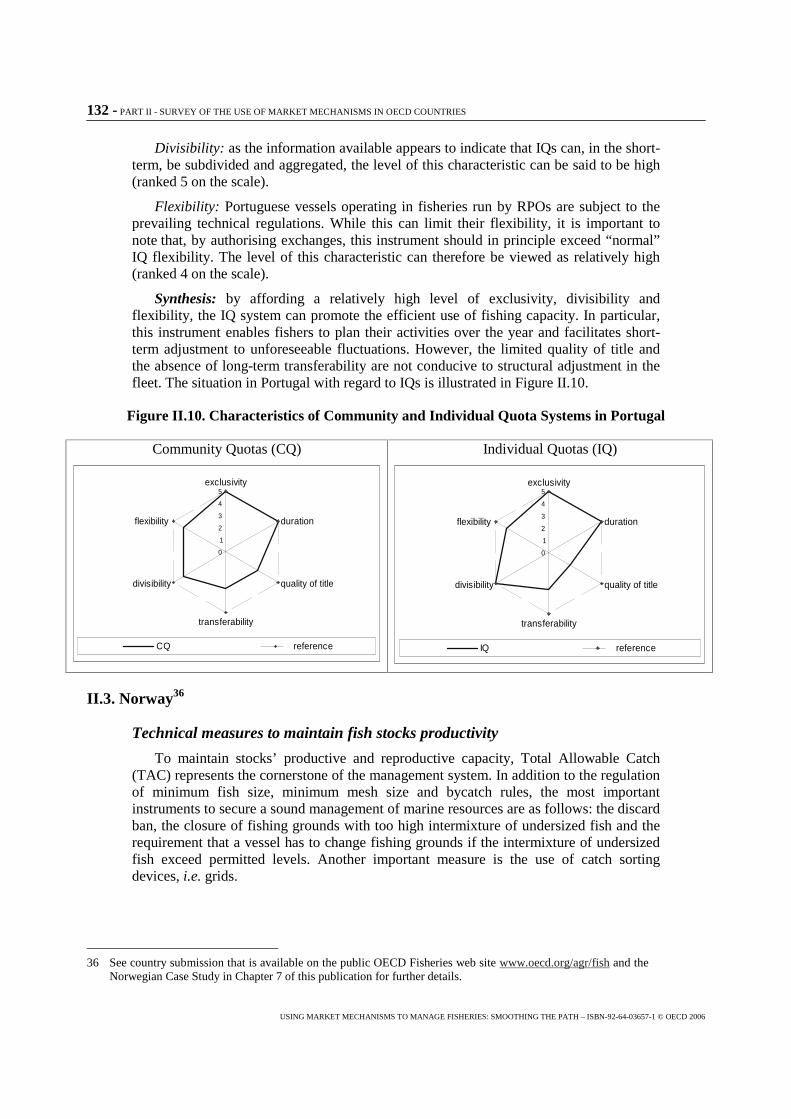
132 - PART II - SURVEY OF THE USE OF MARKET MECHANISMS IN OECD COUNTRIES
USING MARKET MECHANISMS TO MANAGE FISHERIES: SMOOTHING THE PATH – ISBN-92-64-03657-1 © OECD 2006
Divisibility: as the information available appears to indicate that IQs can, in the short-term, be subdivided and aggregated, the level of this characteristic can be said to be high (ranked 5 on the scale).
Flexibility: Portuguese vessels operating in fisheries run by RPOs are subject to the prevailing technical regulations. While this can limit their flexibility, it is important to note that, by authorising exchanges, this instrument should in principle exceed “normal” IQ flexibility. The level of this characteristic can therefore be viewed as relatively high (ranked 4 on the scale).
Synthesis: by affording a relatively high level of exclusivity, divisibility and flexibility, the IQ system can promote the efficient use of fishing capacity. In particular, this instrument enables fishers to plan their activities over the year and facilitates short-term adjustment to unforeseeable fluctuations. However, the limited quality of title and the absence of long-term transferability are not conducive to structural adjustment in the fleet. The situation in Portugal with regard to IQs is illustrated in Figure II.10.
Figure II.10. Characteristics of Community and Individual Quota Systems in Portugal
II.3. Norway36
Technical measures to maintain fish stocks productivity
To maintain stocks’ productive and reproductive capacity, Total Allowable Catch (TAC) represents the cornerstone of the management system. In addition to the regulation of minimum fish size, minimum mesh size and bycatch rules, the most important instruments to secure a sound management of marine resources are as follows: the discard ban, the closure of fishing grounds with too high intermixture of undersized fish and the requirement that a vessel has to change fishing grounds if the intermixture of undersized fish exceed permitted levels. Another important measure is the use of catch sorting devices, i.e. grids.
36 See country submission that is available on the public OECD Fisheries web site www.oecd.org/agr/fish and the Norwegian Case Study in Chapter 7 of this publication for further details.
Community Quotas (CQ)
0
1
2
3
4
5exclusivity
duration
quality of title
transferability
divisibility
flexibility
CQ reference
Individual Quotas (IQ)
0
1
2
3
4
5exclusivity
duration
quality of title
transferability
divisibility
flexibility
IQ reference
PART II - SURVEY OF THE USE OF MARKET MECHANISMS IN OECD COUNTRIES – 133
USING MARKET MECHANISMS TO MANAGE FISHERIES: SMOOTHING THE PATH – ISBN-92-64-03657-1 © OECD 2006
Market-like instruments to regulate access
Three types of market-like instruments are used, in combination, to regulate access to the resource. They are, namely, limited transferable licences (LTLs), individual quotas (IQs) and vessel catch limits (VCs). It is important to note that the latter instrument is only applicable to a marginal part of the economically important share of the Norwegian fishing industry. It is primarily described in this document for sharing information on how a given market-like instrument (here VC) can be designed to adjust better to fishing constraints.
Norwegian fisheries are regulated through annual sharing of the Norwegian TACs amongst the different groups and amongst the participating vessels. For some fisheries the group quotas are divided equally amongst the vessels, while for other fisheries the vessel quotas are differentiated by vessel-length, tonnage or other technical criteria. All major stocks are encompassed in the system, and access rights are defined for most of the fleet segments (e.g., only 6% of the TAC for cod was regulated in 2004 with a competitive open access quota). As an illustration, the allocation mechanism for the cod fishery can be summarised as follows.
First, the TAC is divided between the offshore fleet and the coastal fleet along a medium/long-term allocation key (the current allocation key is defined for six years). Within the offshore fleet, the share is then distributed among participants on the basis of fishing effort units. This leads to the so-called individual vessel quotas (IVQ). Within the inshore fleet, the share is first divided between 3 groups (also based on the allocation key). The main coastal fleet, which received 55% of the total cod quota, is divided in four length-groups (or fleet segments), each group being allocated a quota according to historical share. For two groups (15-21m and 21-28m), individual (vessel) quotas (IVQs) are attributed among participants on the basis of vessel length. For the two other groups (below 10m and 10-15m), vessel catch limits (VCs) are attributed among participants on the basis of vessel length.
In addition to these standard market-like instruments, innovative transferability mechanisms are also available for specific fleet segments. These three systems, designed to reduce overcapacity, are37:
� The Unit Quota System (UQS) for offshore vessels: The system allows the owner of two vessels to transfer the quota of one vessel to another. The owner of a vessel will then control more than one quota for a period of 13 years if the vessel withdrawn from the fishing fleet is sold, and for 18 years if the vessel is scrapped– the latter to contribute to the reduction of worldwide over-capacity38. In practice, the logic underlying the transfer is the following. When the owner of vessel A buy vessel B, he indeed buy the fishing effort unit of the vessel B, which gives him access to a greater share of the group quota (during 13 or 18 years).
� The Structural Quota System (SQS) for 15-28m coastal vessels: This new scheme, introduced in 2004, enables the owner of two vessels to transfer quota from one vessel to another if one vessel is scrapped. Twenty per cent of the quota
37 See the Norwegian Case Study in Chapter 7 for further details.
38 So far the unit quota system has been implemented for the offshore fishing fleet longer than 28 meters. One group, the longliners, has been reduced from 98 to 47 vessels since the scheme was introduced in July 2000. The number of cod trawlers and purse seiners has also been significantly reduced in recent years.
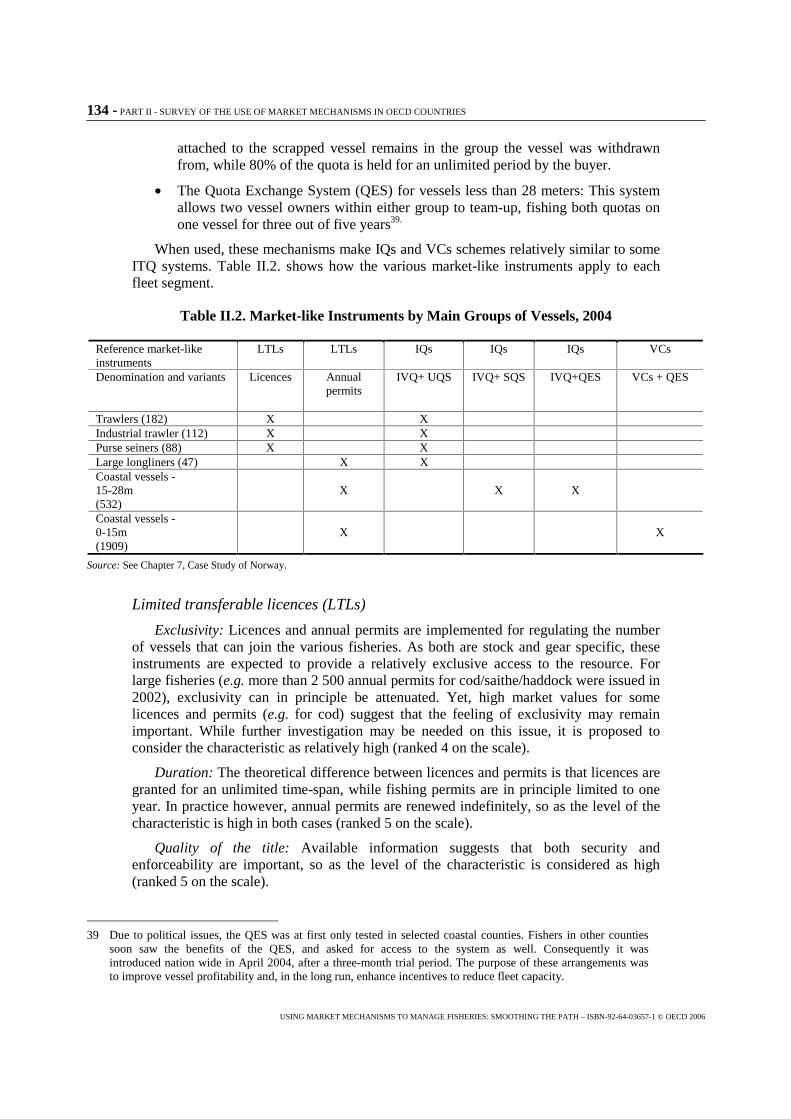
134 - PART II - SURVEY OF THE USE OF MARKET MECHANISMS IN OECD COUNTRIES
USING MARKET MECHANISMS TO MANAGE FISHERIES: SMOOTHING THE PATH – ISBN-92-64-03657-1 © OECD 2006
attached to the scrapped vessel remains in the group the vessel was withdrawn from, while 80% of the quota is held for an unlimited period by the buyer.
� The Quota Exchange System (QES) for vessels less than 28 meters: This system allows two vessel owners within either group to team-up, fishing both quotas on one vessel for three out of five years39.
When used, these mechanisms make IQs and VCs schemes relatively similar to some ITQ systems. Table II.2. shows how the various market-like instruments apply to each fleet segment.
Table II.2. Market-like Instruments by Main Groups of Vessels, 2004
Reference market-like instruments
LTLs LTLs IQs IQs IQs VCs
Denomination and variants Licences Annual permits
IVQ+ UQS
IVQ+ SQS
IVQ+QES
VCs + QES
Trawlers (182) X X Industrial trawler (112) X X Purse seiners (88) X X Large longliners (47) X X Coastal vessels - 15-28m (532)
X X X
Coastal vessels - 0-15m (1909)
X X
Source: See Chapter 7, Case Study of Norway.
Limited transferable licences (LTLs)
Exclusivity: Licences and annual permits are implemented for regulating the number of vessels that can join the various fisheries. As both are stock and gear specific, these instruments are expected to provide a relatively exclusive access to the resource. For large fisheries (e.g. more than 2 500 annual permits for cod/saithe/haddock were issued in 2002), exclusivity can in principle be attenuated. Yet, high market values for some licences and permits (e.g. for cod) suggest that the feeling of exclusivity may remain important. While further investigation may be needed on this issue, it is proposed to consider the characteristic as relatively high (ranked 4 on the scale).
Duration: The theoretical difference between licences and permits is that licences are granted for an unlimited time-span, while fishing permits are in principle limited to one year. In practice however, annual permits are renewed indefinitely, so as the level of the characteristic is high in both cases (ranked 5 on the scale).
Quality of the title: Available information suggests that both security and enforceability are important, so as the level of the characteristic is considered as high (ranked 5 on the scale).
39 Due to political issues, the QES was at first only tested in selected coastal counties. Fishers in other counties soon saw the benefits of the QES, and asked for access to the system as well. Consequently it was introduced nation wide in April 2004, after a three-month trial period. The purpose of these arrangements was to improve vessel profitability and, in the long run, enhance incentives to reduce fleet capacity.
PART II - SURVEY OF THE USE OF MARKET MECHANISMS IN OECD COUNTRIES – 135
USING MARKET MECHANISMS TO MANAGE FISHERIES: SMOOTHING THE PATH – ISBN-92-64-03657-1 © OECD 2006
Transferability: Both licences and annual permits are implicitly transferable together with the vessel. Available information yet suggests that some restriction are in place to avoid geographical concentration of licences and annual permits, so as the overall level of the characteristic may be considered as high but limited (ranked 3 on the scale)40.
Divisibility: licences and annual permits are not divisible, so the level of the characteristic is low (ranked 0 on the scale).
Flexibility: licences and annual permits are often supplemented by technical measures that restrict the scope of decision, so the characteristic can be considered as relatively weak (ranked 3 on the scale).
Synthesis: This instrument is expected to facilitate the efficient use of existing access right, as less efficient fishers may have interest to sell licences and permits to more efficient ones. By providing relatively durable and secure exclusivity, it is also expected to allow for appropriate fleet adjustment. The Norwegian LTLs experience is illustrated in Figure II.11.
Individual quotas (IQs): “IQ-plus systems”
As noted above, individual quotas (IQs) are allocated to vessels belonging to the offshore fleet and to coastal vessels above 15 meters. As standard IQs are supplemented by UQS, SQS and QES systems, the implications on IQs characteristics are addressed below.
Exclusivity: IQs provide holders with a fixed portion of the group quota. As the sum of the allocated IQs equals the group quota, the level of the characteristic is high (ranked 5 on the scale).
Duration: In principle, I(V)Qs are allocated each year. The explicit duration may be considered as limited, which suggests giving the characteristic a relatively low value (ranked 2 on the scale). In practice however, available information suggests that the time-span of the access right is perceived as important. The reason of this apparent paradox may be the following. IQs are based on fishing effort units, and effort units are attached to the licence whose duration is high; implicitly, the level of the characteristic may be considered high (ranked 5 on the scale).
UQS, SQS and QES systems have different implications regarding the duration of IQs obtained after trade:
� When an IQ holder used the UQS system, he holds the extra quota either for 13 or 18 years (ranked 4 on the scale).
� When an IQ holder used the SQS system, he holds 80% of the extra IQs for an unlimited period (ranked 5 on the scale).
� When an IQ holder used the QES system, he holds the extra quota for one year, but for a maximum of three years out of five years (ranked 2 on the scale).
Quality of the title: As noted in the Norwegian case study, the portion of the group quota allocated to each vessel is “more or less guaranteed. As in addition the Norwegian control system secures that every catch of an individual species is registered and settled
40 Available information suggests that tradability gives an explicit value to the licence.
136 - PART II - SURVEY OF THE USE OF MARKET MECHANISMS IN OECD COUNTRIES
USING MARKET MECHANISMS TO MANAGE FISHERIES: SMOOTHING THE PATH – ISBN-92-64-03657-1 © OECD 2006
against the quota for a particular stock, this suggests that the level of the characteristic can be considered as high (ranked 5 on the scale).
Transferability: In principle, IQs alone are not transferable. What is transferable is the vessel with the licence that serves as the basis of IQs allocation, so the level of the characteristic can be considered as low (ranked 0 on the scale). To overcome this situation, UQS, SQS and QES systems have been introduced. In addition, the system reduces active fishing capacity.
� UQS: For transfers of quotas to be possible under this scheme, a fisher (or fisher company) needs to own two vessels. In addition, limitations on the use of UQS have been made to avoid geographical concentration of licences. Vessels can only be merged with vessels that hold a license in the same fishery. The level of this characteristic can be considered to be rather weak (ranked 2 on the scale).
� SQS: for transfers of quotas to be possible under this scheme, a fisher (or fishing company) needs to own two vessels. In addition, limitations on the use of SQS have been made to avoid geographical concentration of annual permits. To avoid increased capacity caused by larger vessels length group limitations also apply to the SQS, which means that quotas from vessels in one vessel group can only be merged to quotas of vessels within the same vessel group41. The level of this characteristic can be considered to be rather weak (ranked 2 on the scale).
� QES: Under the QES system, trade of quotas is allowed between owners. Yet, in addition to the temporal constraints of this system, restrictions are also set on geographical and length groups’ criteria; the level of the characteristic can be considered as moderate (ranked 3 on the scale).
Divisibility: In principle, IQs are not divisible, so the level of the characteristic can be considered as low (ranked 0 on the scale). UQS, SQS and QES systems modify this general feature:
� UQS: In principle, the extra quota obtained by the owner/buyer through this system is not divisible (as the remaining vessel is allocated the entire quota of the scrapped vessel). In practice however, if a fisher (or a fishing company) owns several vessels, the quota of the withdrawn vessel can be shared among all remaining vessels. This implies that divisibility is possible to a certain extent. When UQS is used (i.e. in a long term perspective), the level of the characteristic can be considered per se as relatively high, but limited (ranked 4 on the scale).
� SQS: This system implies some divisibility, as the owner/buyer receives 80% of the decommissioned vessel’s quota. As with UQS, when a fisher owns several vessels, these 80% can also be shared among all remaining vessels; the level of the characteristic is considered as relatively high, but limited (ranked 4 on the scale).
� QES: Under this system, two a more owners can cooperate to pool and share different quotas. As aggregation and divisibility seems to be fully possible, the level of the characteristic is considered as high (ranked 5 on the scale)42.
41 There are two vessel groups, 15 – 21 meter and 21 – 28 meters.
42 In principle, if one vessel has started fishing on one quota, this vessel cannot transfer the remaining quota to another vessel. This suggests that divisibility may be attenuated. However, as a vessel owner can still sell his or hers quota to multiple buyers, it seems relevant to consider the level of the characteristic as high.
PART II - SURVEY OF THE USE OF MARKET MECHANISMS IN OECD COUNTRIES – 137
USING MARKET MECHANISMS TO MANAGE FISHERIES: SMOOTHING THE PATH – ISBN-92-64-03657-1 © OECD 2006
Flexibility: In principle, IQ holders have a relatively important scope in the way they can harvest their quotas. This can be attenuated in practice by the imposition of technical measures (in the cod fishery for example, in 2003, 25% of the group quota for 15-28m vessels must be caught after 1 September), so the level of the characteristic can be considered as relatively high but limited (ranked 4 on the scale).
Synthesis: Available information suggests that the Norwegian “standard” IQs system, by providing relatively high level of exclusivity and quality of the title can allow fishers to plan their fishing activities during the year. This is expected to prevent the race for fish. In association with relatively high level of implicit duration, this instrument might contribute to appropriate investment. Yet, the low level of transferability reduces both short term adaptation and long term fleet adjustment. To overcome this situation, UQS, SQS and QES systems have been implemented to explicitly allow for trade in quotas. The Norwegian IQ-plus systems experience is illustrated in Figure II.11.
� IQ+UQS: The purpose of this coupled system is to allow for relatively long term trade in quotas, in order to facilitate fleet adjustment. Compared to a “standard” buying of vessels/licences, the main interest of this system is to use the quotas calculated for two or three vessels with one vessel.
� IQ+SQS: The SQS system is relatively similar to the UQS system, so the expected outcomes are likely to be identical. The main difference concerns the duration, as 80% of the extra quota obtained under the SQS system is allocated for an unlimited period to the owner/buyer. As a result, this may further facilitate both investment decision and fleet adjustment.
� IQ+QES: As this scheme is time-limited, it can hardly contribute to the fleet adjustment. Yet, the coupled market-like instrument allows for short term adaptations to annual economic and environmental changes.
Vessel catch limits (VCs): “VC-plus systems”
Vessel catch limits (VCs) are used for coastal vessels below 15 meters, alone or in combination with Quota Exchange System (QES). Within this system, a maximum quota (VC) is allocated to each vessel annually. As mentioned above, this management regime is only applicable to a marginal part of the Norwegian fleet. It is primarily described here to share information.
Exclusivity: Each VC is “over-regulated”, and the sum of the allocated VCs is higher than the group quota. The Directorate of Fisheries gets consecutive information about landings, and closes the fishery when the total group quota is estimated to be caught. In such a situation, participants have no guarantee that they may catch their quota share. This attenuates exclusivity and is likely to encourage the race for fish; the level of the characteristic is considered to be relatively low (ranked 2 on the scale).
When VCs are coupled with QES, the situation may slightly change. QES system allows two or more fishers to cooperate by pooling and sharing quotas. Such a system can improve exclusivity by pooling the risks. The greater the cooperation, the higher is individual exclusivity. Yet, due to the size of the Norwegian coastal fleet, the level of the characteristic can still be considered as relatively limited (ranked 3 on the scale).
Duration: VCs are allocated annually. The explicit duration is subsequently relatively low (ranked 2 on the scale). Yet, due to the renewal process, available information suggests that that the time-span of the access right is perceived as important (see above
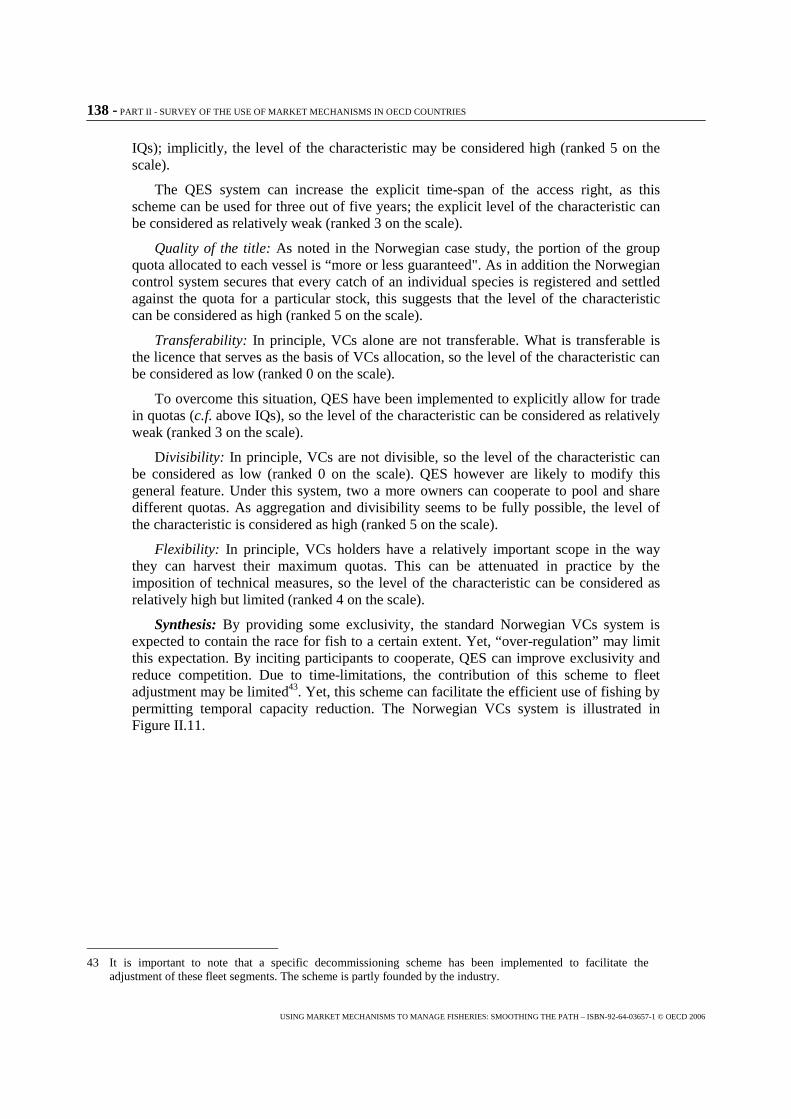
138 - PART II - SURVEY OF THE USE OF MARKET MECHANISMS IN OECD COUNTRIES
USING MARKET MECHANISMS TO MANAGE FISHERIES: SMOOTHING THE PATH – ISBN-92-64-03657-1 © OECD 2006
IQs); implicitly, the level of the characteristic may be considered high (ranked 5 on the scale).
The QES system can increase the explicit time-span of the access right, as this scheme can be used for three out of five years; the explicit level of the characteristic can be considered as relatively weak (ranked 3 on the scale).
Quality of the title: As noted in the Norwegian case study, the portion of the group quota allocated to each vessel is “more or less guaranteed". As in addition the Norwegian control system secures that every catch of an individual species is registered and settled against the quota for a particular stock, this suggests that the level of the characteristic can be considered as high (ranked 5 on the scale).
Transferability: In principle, VCs alone are not transferable. What is transferable is the licence that serves as the basis of VCs allocation, so the level of the characteristic can be considered as low (ranked 0 on the scale).
To overcome this situation, QES have been implemented to explicitly allow for trade in quotas (c.f. above IQs), so the level of the characteristic can be considered as relatively weak (ranked 3 on the scale).
Divisibility: In principle, VCs are not divisible, so the level of the characteristic can be considered as low (ranked 0 on the scale). QES however are likely to modify this general feature. Under this system, two a more owners can cooperate to pool and share different quotas. As aggregation and divisibility seems to be fully possible, the level of the characteristic is considered as high (ranked 5 on the scale).
Flexibility: In principle, VCs holders have a relatively important scope in the way they can harvest their maximum quotas. This can be attenuated in practice by the imposition of technical measures, so the level of the characteristic can be considered as relatively high but limited (ranked 4 on the scale).
Synthesis: By providing some exclusivity, the standard Norwegian VCs system is expected to contain the race for fish to a certain extent. Yet, “over-regulation” may limit this expectation. By inciting participants to cooperate, QES can improve exclusivity and reduce competition. Due to time-limitations, the contribution of this scheme to fleet adjustment may be limited43. Yet, this scheme can facilitate the efficient use of fishing by permitting temporal capacity reduction. The Norwegian VCs system is illustrated in Figure II.11.
43 It is important to note that a specific decommissioning scheme has been implemented to facilitate the adjustment of these fleet segments. The scheme is partly founded by the industry.
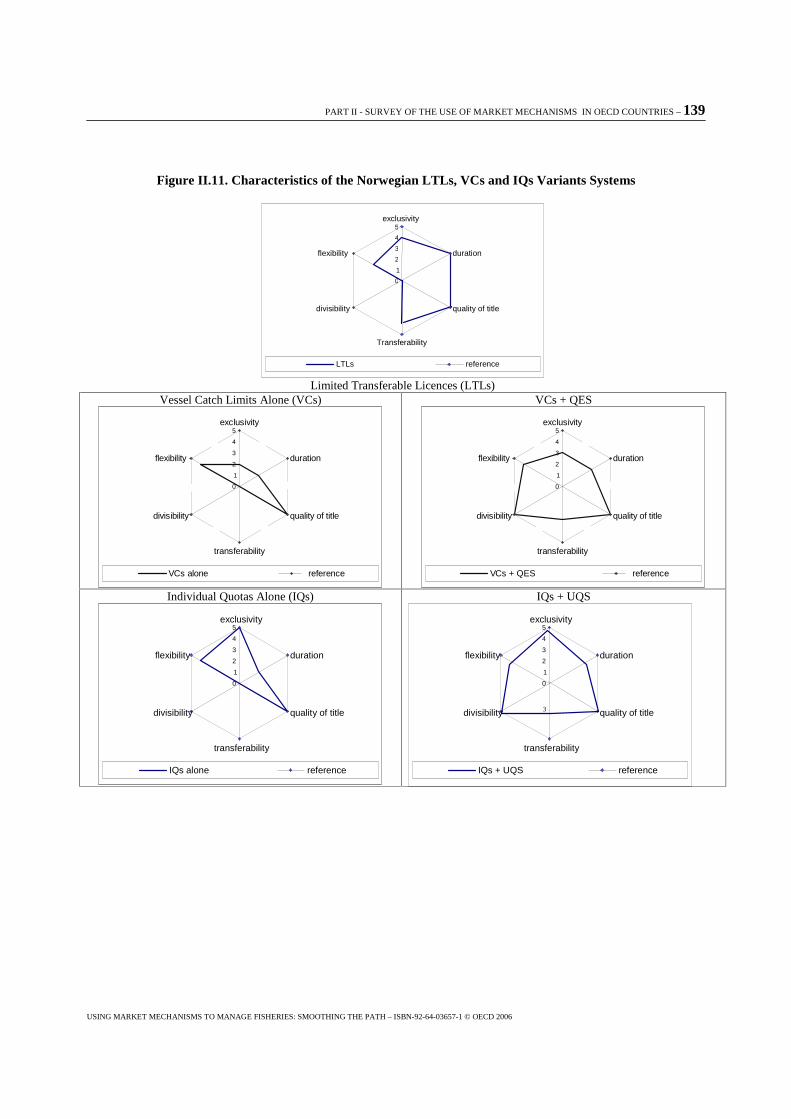
PART II - SURVEY OF THE USE OF MARKET MECHANISMS IN OECD COUNTRIES – 139
USING MARKET MECHANISMS TO MANAGE FISHERIES: SMOOTHING THE PATH – ISBN-92-64-03657-1 © OECD 2006
Figure II.11. Characteristics of the Norwegian LTLs, VCs and IQs Variants Systems
Limited Transferable Licences (LTLs)
Vessel Catch Limits Alone (VCs)
0
1
2
3
4
5exclusivity
duration
quality of title
transferability
divisibility
flexibility
VCs alone reference
VCs + QES
0
1
2
3
4
5exclusivity
duration
quality of title
transferability
divisibility
flexibility
VCs + QES reference
Individual Quotas Alone (IQs)
IQs + UQS
0 1 2 3 4 5 exclusivity
duration
quality of title
transferability
divisibility
flexibility
IQs + UQS reference
3
0 1 2 3 4 5 exclusivity
duration
quality of title
Transferability
divisibility
flexibility
LTLs reference
0 1 2 3 4 5 exclusivity
duration
quality of title
transferability
divisibility
flexibility
IQs alone reference
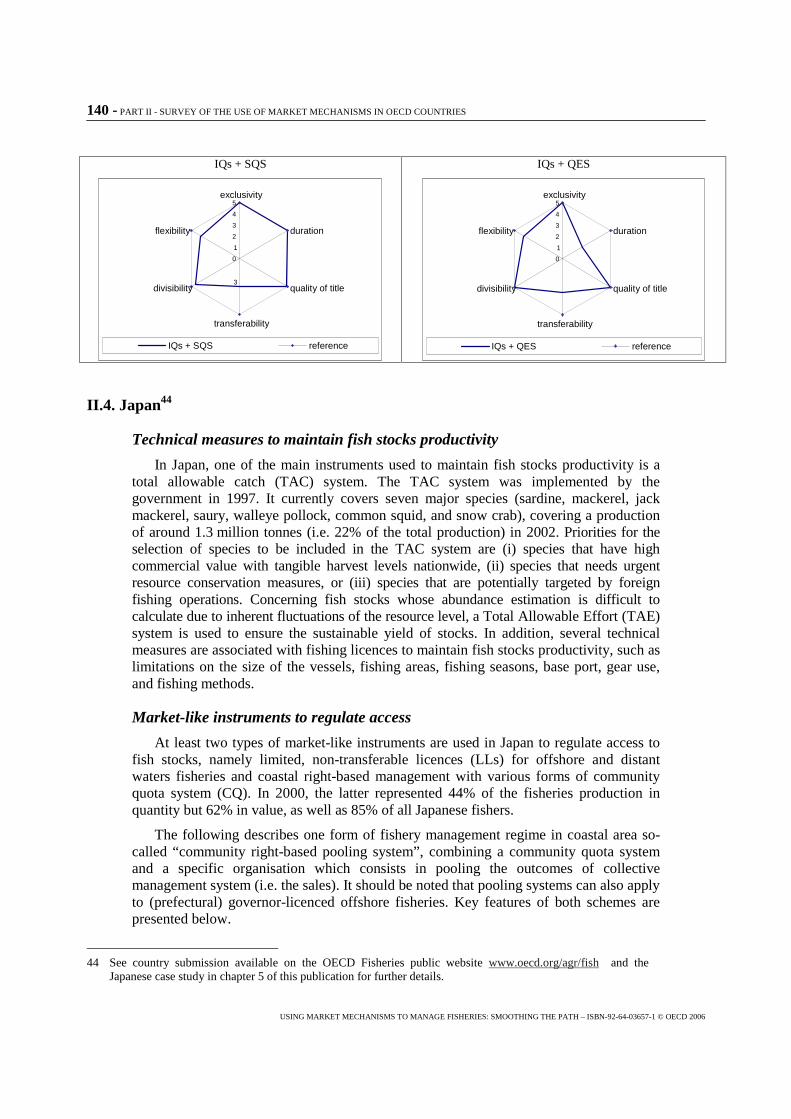
140 - PART II - SURVEY OF THE USE OF MARKET MECHANISMS IN OECD COUNTRIES
USING MARKET MECHANISMS TO MANAGE FISHERIES: SMOOTHING THE PATH – ISBN-92-64-03657-1 © OECD 2006
IQs + SQS
IQs + QES
II.4. Japan44
Technical measures to maintain fish stocks productivity
In Japan, one of the main instruments used to maintain fish stocks productivity is a total allowable catch (TAC) system. The TAC system was implemented by the government in 1997. It currently covers seven major species (sardine, mackerel, jack mackerel, saury, walleye pollock, common squid, and snow crab), covering a production of around 1.3 million tonnes (i.e. 22% of the total production) in 2002. Priorities for the selection of species to be included in the TAC system are (i) species that have high commercial value with tangible harvest levels nationwide, (ii) species that needs urgent resource conservation measures, or (iii) species that are potentially targeted by foreign fishing operations. Concerning fish stocks whose abundance estimation is difficult to calculate due to inherent fluctuations of the resource level, a Total Allowable Effort (TAE) system is used to ensure the sustainable yield of stocks. In addition, several technical measures are associated with fishing licences to maintain fish stocks productivity, such as limitations on the size of the vessels, fishing areas, fishing seasons, base port, gear use, and fishing methods.
Market-like instruments to regulate access
At least two types of market-like instruments are used in Japan to regulate access to fish stocks, namely limited, non-transferable licences (LLs) for offshore and distant waters fisheries and coastal right-based management with various forms of community quota system (CQ). In 2000, the latter represented 44% of the fisheries production in quantity but 62% in value, as well as 85% of all Japanese fishers.
The following describes one form of fishery management regime in coastal area so-called “community right-based pooling system”, combining a community quota system and a specific organisation which consists in pooling the outcomes of collective management system (i.e. the sales). It should be noted that pooling systems can also apply to (prefectural) governor-licenced offshore fisheries. Key features of both schemes are presented below.
44 See country submission available on the OECD Fisheries public website www.oecd.org/agr/fish and the Japanese case study in chapter 5 of this publication for further details.
0 1 2 3 4 5 exclusivity
duration
quality of title
transferability
divisibility
flexibility
IQs + SQS reference
3
0 1 2 3 4 5 exclusivity
duration
quality of title
transferability
divisibility
flexibility
IQs + QES reference
PART II - SURVEY OF THE USE OF MARKET MECHANISMS IN OECD COUNTRIES – 141
USING MARKET MECHANISMS TO MANAGE FISHERIES: SMOOTHING THE PATH – ISBN-92-64-03657-1 © OECD 2006
Overview of coastal right-based fishery
Community-based fishery management has been used in Japanese coastal areas for a long time. Fishery management in coastal areas is based on traditional local fishery rights: a group of fishermen (fishery cooperative associations) traditionally assumes exclusive rights for operating certain fisheries and, thus, all the responsibility for long-term sustainability of the resources. Although it does not provide an exclusive right per se over sea areas, a right to engage in fisheries is provided under limited conditions with regard to the fishing season, species and fishing methods. There are three types of fishing rights (Gyogyoken):
� Joint Fishery Right: The first is the Joint Fisheries Right (Kyodo-Gyogyoken). The fishery management system is originally based on common ownership of local fishing grounds. The license is issued only to fishery cooperatives, in which at least two-thirds of the members are engaged in coastal fisheries for at least 90 days in the areas. Members of the cooperative use the license on an individual basis.
� Demarcated Fishery Right: The second type of fishery rights is the Demarcated Fishery Right (Kukaku-Gyogyoken). This is the right to engage in aquaculture. Fishery cooperatives have the first priority of access to the special demarcated fishing rights (however, the operating entity of the fishery should not be the fishery cooperatives, but their members).
� Set-net Fishery Right: The last of the three fishery rights is the Set-Net Fishery Right (Teichi-Gyogyoken) used for set-net fisheries targeting for salmon, yellow tail, or other species.
Detailed regulations for coastal fisheries are implemented through local fishery cooperatives. The total number of fishery cooperative associations is approximately 1 500 along the coast of Japan. The fishery regulations introduced by the fishery cooperatives are based on the management policy set forth by the government.
The pooling system
The so-called “pooling system” has been used in Japan since the 1980’s, when fishers started a new form of fishery operation to resolve a crisis. It is a unique form of collaborative fishery operation established on the initiative of the fishermen themselves. The term "pooling system" was created by fishers. Although no agreed definition of the term exists so far, it can be roughly defined as "the fishery operation system in which the value of landed fish of individual fishermen is pooled and redistributed to individual fishermen based on certain criteria." It does not usually cover a fishery management system itself, but rather it mainly covers a redistribution system to ensure a collective use of fishing grounds. It can be interpreted that the pooling system is based on the allocation of sales, rather than allocating the catch quota to individual fishers.
The greatest numbers of pooling systems are found in shellfish and seaweed harvesting fisheries, followed by bottom trawl fisheries (mainly small-type trawl fisheries) and gillnet fisheries. This tendency has been rather stable for the past decade. Common features of these types of fisheries are: (i) they target sedentary living resources, (ii) good fishing grounds are limited, and (iii) concentration of and competition among fishing vessels can easily occur. Around 17% of the fishery management organisations employed the pooling system in 1998.
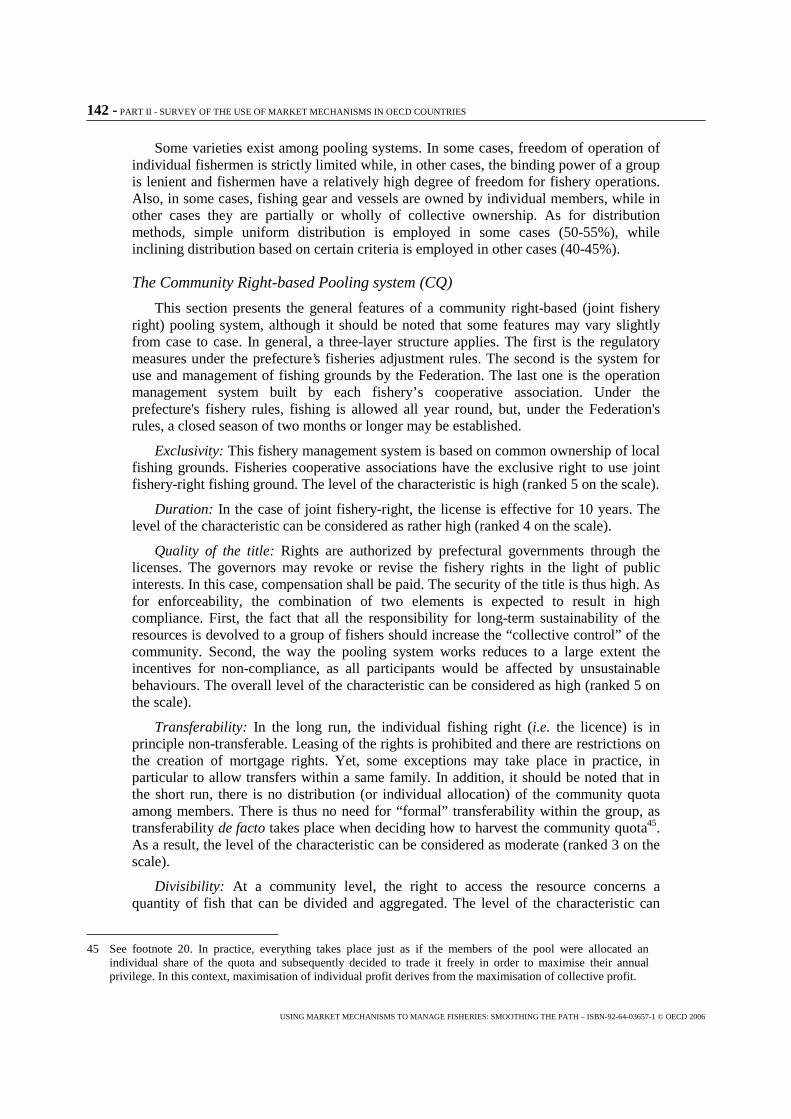
142 - PART II - SURVEY OF THE USE OF MARKET MECHANISMS IN OECD COUNTRIES
USING MARKET MECHANISMS TO MANAGE FISHERIES: SMOOTHING THE PATH – ISBN-92-64-03657-1 © OECD 2006
Some varieties exist among pooling systems. In some cases, freedom of operation of individual fishermen is strictly limited while, in other cases, the binding power of a group is lenient and fishermen have a relatively high degree of freedom for fishery operations. Also, in some cases, fishing gear and vessels are owned by individual members, while in other cases they are partially or wholly of collective ownership. As for distribution methods, simple uniform distribution is employed in some cases (50-55%), while inclining distribution based on certain criteria is employed in other cases (40-45%).
The Community Right-based Pooling system (CQ)
This section presents the general features of a community right-based (joint fishery right) pooling system, although it should be noted that some features may vary slightly from case to case. In general, a three-layer structure applies. The first is the regulatory measures under the prefecture’s fisheries adjustment rules. The second is the system for use and management of fishing grounds by the Federation. The last one is the operation management system built by each fishery’s cooperative association. Under the prefecture's fishery rules, fishing is allowed all year round, but, under the Federation's rules, a closed season of two months or longer may be established.
Exclusivity: This fishery management system is based on common ownership of local fishing grounds. Fisheries cooperative associations have the exclusive right to use joint fishery-right fishing ground. The level of the characteristic is high (ranked 5 on the scale).
Duration: In the case of joint fishery-right, the license is effective for 10 years. The level of the characteristic can be considered as rather high (ranked 4 on the scale).
Quality of the title: Rights are authorized by prefectural governments through the licenses. The governors may revoke or revise the fishery rights in the light of public interests. In this case, compensation shall be paid. The security of the title is thus high. As for enforceability, the combination of two elements is expected to result in high compliance. First, the fact that all the responsibility for long-term sustainability of the resources is devolved to a group of fishers should increase the “collective control” of the community. Second, the way the pooling system works reduces to a large extent the incentives for non-compliance, as all participants would be affected by unsustainable behaviours. The overall level of the characteristic can be considered as high (ranked 5 on the scale).
Transferability: In the long run, the individual fishing right (i.e. the licence) is in principle non-transferable. Leasing of the rights is prohibited and there are restrictions on the creation of mortgage rights. Yet, some exceptions may take place in practice, in particular to allow transfers within a same family. In addition, it should be noted that in the short run, there is no distribution (or individual allocation) of the community quota among members. There is thus no need for “formal” transferability within the group, as transferability de facto takes place when deciding how to harvest the community quota45. As a result, the level of the characteristic can be considered as moderate (ranked 3 on the scale).
Divisibility: At a community level, the right to access the resource concerns a quantity of fish that can be divided and aggregated. The level of the characteristic can
45 See footnote 20. In practice, everything takes place just as if the members of the pool were allocated an individual share of the quota and subsequently decided to trade it freely in order to maximise their annual privilege. In this context, maximisation of individual profit derives from the maximisation of collective profit.
PART II - SURVEY OF THE USE OF MARKET MECHANISMS IN OECD COUNTRIES – 143
USING MARKET MECHANISMS TO MANAGE FISHERIES: SMOOTHING THE PATH – ISBN-92-64-03657-1 © OECD 2006
thus be considered as high in the short term, allowing the community to adapt to environmental and economic changes. Yet, at the individual fisher level, available information suggests that the right to access the community pooling quota concerns the licence, which is not divisible per se. This restricts the “long term” divisibility of the right, and subsequently the individual ability to adjust. As a result, the level of the characteristic can be considered as high but limited (ranked 4 on the scale).
Flexibility: In general, numerous regulations limit the freedom of operation of individual fishermen, so as individual flexibility is limited46. However, it should be noted that those stringent measures are “self-restrictive”, i.e. decided collectively by fishers. A consent through a two-third majority from members of the cooperative (coastal fishers in the area concerned) is required to institute, amend or abolish the rules for implementation of fishing rights. In this case, it can be considered that the “collective flexibility” is rather high, as fishers are free (with respect to some general limitations) to decide how they want harvest their ground (ranked 4 on the scale).
Synthesis: Rather high levels of exclusivity, duration and quality of the title incite fishers to limit fishing effort to resource condition, in order to ensure the effective conservation of resources and stabilisation of catch (i.e. that long-term benefits would be available for the community). Collective decision-process and the pooling system restrict both conflicts and “race-for-fish” behaviours. Furthermore, when simple uniform distribution is employed, the pooling system should encourage fishers to reduce their fishing capacity and fishing costs. The Japanese variant of the community quota system (CQ) is illustrated in Figure II.12.
Figure II.12. Characteristics of the Japanese Community Quota Pooling System
46 In the case of the hard clam fisheries in Kashima-nada for example, a strict one-area-four-group rotation system prevails, limiting the number of fishing days and catch volume per vessels and per area.
0 1 2 3 4 5
exclusivity
duration
quality of title
transferability
divisibility
flexibility
CQs + pooling reference
144 - PART II - SURVEY OF THE USE OF MARKET MECHANISMS IN OECD COUNTRIES
USING MARKET MECHANISMS TO MANAGE FISHERIES: SMOOTHING THE PATH – ISBN-92-64-03657-1 © OECD 2006
II.5. Canada47
Technical measures to maintain fish stocks productivity
In order to maintain stocks’ productive and reproductive capacity, a wide range of measures are used simultaneously (see Annex 1 of the Canadian submission). Total Allowable Catch (TAC), usually subdivided at area or fleet levels, are used for most species and are in place in 76 fisheries (out of the 88 fisheries described). There are a few major exceptions in which fisheries are managed with the objective of meeting escapement targets in terms of the number of adult fish returning to the spawning grounds (Pacific salmon), or increasing the survival rate of the female population (Pacific prawn and Atlantic lobster). In addition, limited-entry licensing with vessel and gear restrictions apply to all fisheries, while technical measures such as restrictions on mesh size or actual fish size and time/area closures apply respectively to 81 and 84 fisheries (out of 88).
Market-like instruments to regulate access
Five types of market-like instruments are used in Canada to regulate access to the resource. Out of the 88 fisheries subdivided at area or fleet levels, individual quotas (IQs) are used in 22 fisheries, individual transferable quotas (ITQs) or individual vessel quotas (IVQs) in 26 fisheries, Enterprise Allocations (EAs) in 6 fisheries, community quotas (CQs) in 10 fisheries and vessels catch limits (VCs) in 44 fisheries. In general, rights-based systems48 have gained increasing acceptance in Canada. In 2000, out of 67 850 commercial licences/permits issued in main marine fisheries, at least 12 729 were under a variety of rights-based systems, representing 19% of all major species licences/permits issued. Further, these rights-based fisheries registered a total landed value of CAD 1.2 billion, accounting for at least 56% of the total landed value (CAD 2.1 billion) reported in main marine fisheries.
Due to the wide use of market-like instruments in Canada, the following description focuses on four selected cases in order (1) to identify the key characteristics of each instrument, (2) to reflect the diversity of instruments used and (3) to underline some specific and innovative features.
Individual Vessel Quotas (IVQ)
The Pacific groundfish fishery involves over 50 species of fish, the majority of which are caught by bottom and mid-water trawl gear. The main species landed by trawl gear vessels include rockfish, Pacific hake, sole, pollock, dogfish and lingcod. The trawl fishery is a complex mixed-species fishery with as many as 15 different species caught in a single trawl. Groundfish are also harvested in commercial, recreational and First Nations’ fisheries by traps and by hook and line gear. The landed value of the Pacific groundfish trawl fishery amounted to around CAD 49 million in 2000.
Since 1997, the groundfish trawl fishery has been managed by area and species specific fully transferable Individual Vessel Quotas (IVQ), which were determined according to vessel length and catch history.
47 See country submission on Canada for further details on the OECD Fisheries public web site: www.oecd.org/agr/fish
48 The term “right-based system” here covers IQ, ITQ/IVQ, EA and community-based quota systems.
PART II - SURVEY OF THE USE OF MARKET MECHANISMS IN OECD COUNTRIES – 145
USING MARKET MECHANISMS TO MANAGE FISHERIES: SMOOTHING THE PATH – ISBN-92-64-03657-1 © OECD 2006
Exclusivity: Fishing vessels are allocated a percentage share of the area/fleet quotas, which are then translated annually into actual quantities as a condition to licence based on current TACs. By attributing a direct right to catch a given quantity of fish, IVQs provide holders of the right with a relatively strong exclusivity. While the exclusivity might be attenuated by the fact that groundfish stocks are shared with other users, regular consultations between administration and representatives from the various stakeholders are conducted to avoid it. The level of the characteristic can be considered as high (ranked 5 on the scale).
Duration: An individual vessel quota is attached to a licence as a condition to licence. In principle, licences are annual privileges of access to the resource which must be renewed every year. In practice, licences are renewed as long as all eligibility criteria are met and licence fee paid, so the duration is being considered as important although implicit. In this context, the security of IQs and the permanent transferability of ITQs are merely affected, and the level of the characteristic can be considered as high but limited to a certain extent (ranked 4 on the scale).
Quality of the title: Available information suggests that the security of the title is important. For instance, to reduce risk related to the multi-users nature of the fishery, an agreement between the groundfish trawl and sablefish commercial fishing sectors on a pilot program that allows temporary reallocations of IVQs between these two sectors has been in place since 2002. As for enforceability, the fishery is subject to an industry-funded full-scale dockside monitoring program (DMP) at a limited number of designated landing ports and at-sea-observer coverage. In addition, the Canadian chapter stresses the fact that EA/IQ management usually requires consensus within the membership of a fishery, which affect positively both the security and enforceability of the title. The overall level of the characteristic can be considered as high (ranked 5 on the scale).
Transferability: Individual vessel quotas are fully transferable. Yet, overall individual species caps and total licence IVQ holdings caps have been set to inhibit excessive consolidation of IVQs. In addition, access by foreigners is restricted. As a result, transferability is high, but limited up to a point (ranked 4 on the scale).
Divisibility: Any fraction of an individual vessel quota may be divided, aggregated and transferred. The level of this characteristic is high (ranked 5 on the scale).
Flexibility: Some general technical measures apply to the groundfish trawl fishery. Yet, within these constraints, right holders are free to decide on how to use their quota (i.e. to adopt the least-cost way of using their quota). The level of this characteristic can be considered as high but limited (ranked 4 on the scale).
Synthesis: By providing high and rather high levels for all characteristics, the overall IVQ program has provided an opportunity for the industry to organize fleet and processing operations to make better use of catch and reduce at-sea releases. The Canadian IVQ system is illustrated in Figure II.13.
Community Quotas (CQs):
The Scotia-Fundy fixed gear fleet of vessels less than 45 ft. consists of over 2 500 licences and has adopted a community-based management (CBM) approach since 1996 as an alternative to individual quota systems. In 1996, the fixed-gear sector was initially divided into a series of community or geographic quota groups for cod, haddock and pollock stocks in the 4X5Y stock area. A quota was calculated for each group based on the average landings within the community using the average catch from 1986-1993. This
146 - PART II - SURVEY OF THE USE OF MARKET MECHANISMS IN OECD COUNTRIES
USING MARKET MECHANISMS TO MANAGE FISHERIES: SMOOTHING THE PATH – ISBN-92-64-03657-1 © OECD 2006
community management format was extended for a three-year trial period that began in 1997 where the fleet quota in 4X+5 was divided into seven geographic sub-allocations, based on the 1996 formula. The quota groups largely follow the county boundaries. Each of the different community management boards develops harvesting plans that generally include further quota divisions into three gear sector quotas for handline, longline and gillnet groups. Specific seasonal quotas are usually established for each of these quota groups, as are industry monitored trip limits. The landed value of this fishery amounted to around CAD 22 million in 2000.
Exclusivity: The multiple lays management system allocates a given amount of fish, subdivided at area and gear levels, to members of each community. Participants of a group know that outsiders are prevented to access the collective quota, which provides a rather high level of “external” exclusivity. To avoid the competitive use of the quota between members of a community (and resulting race for fish), the activity is in addition regulated by the community itself through seasonal and trip quotas. The level of the characteristic can be considered as high (ranked 5 on the scale).
Duration: To participate in a community quota scheme, fishers must have a licence. As annual licences are renewed rather automatically (see above), the level of the characteristic can be considered as high but limited (ranked 4 on the scale).
Quality of the title: As long as they belong to one community, right holders have access to the resource. Available information suggests that the security of the title is important. As for enforceability, industry monitored trip limits are expected to improve compliance. Yet, the resource exploited by Scotia-Fundy fixed gear fleet of vessels less than 45 ft. is shared with other fleets, which may affect the quality of control. The overall level of the characteristic can be considered as high but limited (ranked 4 on the scale).
Transferability: Community boards are permitted to trade quotas on a temporary basis at the community level. These measures have had the result of reducing the utilization of licences in these fleets, with some 700 licences actively engaged in the fishery at present. As available information suggests that trade between communities are restricted, the level of the characteristic can be considered as high but limited in the short term, allowing the community to adapt to environmental and economic changes. In a longer perspective however, it should be noted that the right to participate in a community quota system (i.e. the licence) is not transferable, which limits the availability of the fleet to adjust structurally. As a result, the overall level of the characteristic can be considered as moderate (ranked 3 on the scale).
Divisibility: At a community level, the right to access the resource concerns a quantity of fish that can be divided and aggregated. The level of the characteristic can thus be considered as high in the short term, also allowing the community to adapt to natural and economic fluctuation. Yet, at the individual fisher level, available information suggests that the right to access the community quota concerns the licence, which is not divisible per se. This restricts the “long term” divisibility of the right, and subsequently the individual ability to adjust. As a result, the level of the characteristic can be considered as high but limited (ranked 4 on the scale).
Flexibility: Specific seasonal quotas, trip limits and technical measures reduce the freedom of decision of each fisher about how to harvest its part of the collective quota. Yet, such decisions are taken collectively by fishers (or by the community board). It can be considered that the “collective flexibility” is rather high, as fishers are free (with
PART II - SURVEY OF THE USE OF MARKET MECHANISMS IN OECD COUNTRIES – 147
USING MARKET MECHANISMS TO MANAGE FISHERIES: SMOOTHING THE PATH – ISBN-92-64-03657-1 © OECD 2006
respect to some general limitations) to decide how they want to harvest their collective quota (ranked 4 on the scale).
Synthesis: By providing high or rather high levels of exclusivity, quality of the title, flexibility and temporary transferability, the community quota system allows for community solutions to problems in fish management and gives industry associations the opportunity to develop conservation harvesting plans that address seasonal fishing patterns and provide most benefit to their own groups. The Canadian CQ system is illustrated in Figure II.13.
A variant of Community Quotas (CQs): The roe herring pooling system
Pacific herring populations migrate in the fall from offshore feeding grounds to inshore spawning areas for spawning in the following spring. Since the early 1970s onward, a major roe herring and a small-scale spawn-on-kelp (SOK) fishery has occurred for short periods between mid-February to the end of April, just when herring spawn. This fishery was developed in response to the lucrative Japanese roe market. Purse seine and gillnet are gear used in harvesting roe. The landed value of this fishery amounted to around CAD 48 millions in 2000.
The roe herring fishery operates on a unique cooperative scheme. It is a short, intense fishery that extends over about six weeks from late February to early April, but openings in individual areas can be as short as a few days. It had seen many vessels on the grounds rushing for fish in a very short period. This inevitably led to unsustainable and unsafe fishing operations and an impossible policing problem. After implementing various management measures such as limited-entry licences and area licensing, DFO introduced a pooling system for seiners in 1998, and subsequently for gillnets in 1999. Pooling is a management tool whereby a group of vessels (licenses) will form a “pool”. Each pool has its own quota depending on the TAC for the area and the number of licenses included in the pool. A pool captain is appointed for each pool, who works on ground with a DFO resource manager to determine how many vessels will be allowed to fish at any one time. The net profits of the pool are then divided among the pool members.
Exclusivity: A share of the herring TAC is allocated to each pool. The exclusive “pool-quota” is subsequently harvested in a non-competitive way by members of the pool. The level of the characteristic is high (ranked 5 on the scale).
Duration: To participate in a pooling system, fishers must have a licence. As annual licences are renewed rather automatically (see above), the level of the characteristic can be considered as high but limited (ranked 4 on the scale).
Quality of the title: The system is designed in such a way that the security of the title is high. Regulation for instance stipulates that if a pool exceeds its quota, then arrangements should be made to have another pool in the licensed area take the excess. As for enforcement, all commercial landings are required to be checked at dockside under a DMP funded by the licence holders. In addition, the net profits of the pool are divided among the members, so the incentive for non-compliance within the group is reduced to zero. The level of the characteristic is high (ranked 5 on the scale).
Transferability: Within a pool system, there is no distribution (or individual allocation) of the pool-quota among members. There is thus no need for “formal” transferability between members of the group, as transferability de facto takes place when
148 - PART II - SURVEY OF THE USE OF MARKET MECHANISMS IN OECD COUNTRIES
USING MARKET MECHANISMS TO MANAGE FISHERIES: SMOOTHING THE PATH – ISBN-92-64-03657-1 © OECD 2006
deciding how to harvest the pool-quota49. In addition, a limited transferability exists between pools due to the requirement that, if a pool exceeds their quota, arrangements should be made to have another pool in the licensed area take the excess. Short term transferability can thus be considered as high, which allows fishers to adapt to economic and environmental changes. In a longer term perspective however, it should be noted that the individual privilege to access the resource (i.e. the licence) is not transferable, which limits the availability of the fleet to adjust structurally. As a result, the overall level of the characteristic can be considered as moderate (ranked 3 on the scale).
Divisibility: At the pool level, the right to access the resource concerns a quantity of fish that can be divided and aggregated, so the level of the characteristic can be considered as high in the short term, allowing the community to adapt to environmental and economic changes. Yet, as available information also suggests that “long term” divisibility is restricted to a certain extent (because being linked to the licence, see above), the overall level of the characteristic can be considered as high but limited (ranked 4 on the scale).
Flexibility: Fishing operations are organised by representatives from the pool and the administration. Individual flexibility is thus restricted. Yet, those stringent measures are “co-restrictive”, as fishers are free (with respect to some general limitations) to decide how they want to harvest their quota. The overall level of the characteristic can thus be as high but limited (ranked 4 on the scale).
Synthesis: By providing members of the pool with rather high levels for all characteristics, the pooling system has eliminated the race for fish and reduced overall operating cost within pools, reduced catch overages, and improved safety of vessels on the grounds. This also permits easier management of fishing effort on the grounds where large catches could be taken in very short periods of time. The Canadian pooling system is illustrated in Figure II.13.
A hybrid system: Enterprise Allocation + community quota (EA/CQ) in the offshore northern shrimp fishery off eastern Newfoundland and Labrador
The Canadian shrimp fishery is primarily based on the northern shrimp (or pink shrimp), one of several cold water species of shrimp found north of latitude 40° N in the Atlantic, Pacific and Arctic oceans. The Atlantic fishery has been managed in three broad areas: stocks off eastern Newfoundland and Labrador, stocks of the Gulf of St. Lawrence, and stocks on the Eastern Scotian Shelf.
The offshore northern shrimp fishery off eastern Newfoundland and Labrador is a capital intensive operation employing a fleet of modern freezer trawlers. It has been managed under an Enterprise Allocation system since 1987. EAs are based on an equal sharing arrangement among the participating licence holders for each of the northern shrimp fishing areas. The landed value of the offshore northern shrimp fishery amounted to around CAD 181 millions in 2000.
The number of offshore licences has been kept constant at seventeen since 1991 (i.e. which represents average revenue per licence of more than CAD 10 millions in 2000). The traditional offshore northern shrimp licence holders are represented by four
49 See footnote 20. In practice, everything takes place just as if the members of the pool were allocated an individual share of the quota and subsequently decided to trade it freely in order to maximise their annual privilege. In this context, maximisation of individual profit derives from the maximisation of collective profit.
PART II - SURVEY OF THE USE OF MARKET MECHANISMS IN OECD COUNTRIES – 149
USING MARKET MECHANISMS TO MANAGE FISHERIES: SMOOTHING THE PATH – ISBN-92-64-03657-1 © OECD 2006
organisations. The Canadian Association of Prawn Producers represents nine licence holders and the Northern Coalition represents six licence holders and the Labrador Inuit Development Corporation. The remaining two licence holders are not members of either of these organisations. The Northern Coalition licences are in effect community-based because its membership includes aboriginal, regional and cooperative based groups. The management system is thus hybrid, where a community participates in an EA regime (at the same level as any other participants) and secures a community quota for their constituents50. The following focuses on this specific situation.
Exclusivity: Each participant to the EA regime is allocated an even share of the area/fleet quotas. By attributing a direct right to catch a given quantity of fish, EAs in general provide holders of the right with a relatively strong exclusivity. In the case of the Northern Coalition, the resulting allocation is exploited by various stakeholders, including fishing communities. To avoid competitive behaviour within this group, EAs are further allocated to each stakeholder. Insofar as the community quotas are exploited in a non-competitive way, the overall level of the characteristic can be considered as high (ranked 5 on the scale).
Duration: To participate in the system, fishers must have a licence. As annual licences are renewed rather automatically (see above), the level of the characteristic can be considered as high but limited (ranked 4 on the scale).
Quality of the title: Available information suggests that the security of the title is important. This is reflected by the fact that the number of licences has been kept constant at seventeen since 1991. As for enforceability, there is full observer coverage and random dockside monitoring within the program. Yet, the Canadian chapter reports that highgrading continues to be an issue of enforcement concern. The overall level of the characteristic is thus high but limited (ranked 4 on the scale).
Transferability: Permanent transfers between enterprises are not allowed. Inter-enterprise transfers of EAs are permitted on a temporary basis within the fishing season and subject to DFO approval. The level of the characteristic can be considered as moderate (ranked 3 on the scale).
Divisibility: The privilege concerns access to a given quantity of shrimp, which can be divided, aggregated and - temporarily - transferred. The level of the characteristic is high (ranked 5 on the scale).
Flexibility: Some technical measures apply to the shrimp fishery, such as gear restrictions, minimum mesh size, and the use of an exclusion device known as the Nordmore grate to reduce groundfish by-catches. Beyond such general measures, EA holders are free in planning and conducting their fishing activities. The level of the characteristic can be considered as high but limited (ranked 4 on the scale).
Synthesis: The hybrid system gathers different users of a common resource, from a single company to members of a fishing community, under a unique scheme. Rather high levels of exclusivity, duration and quality of the title are expected to facilitate the adjustment of the fleet, although permanent transferability is not allowed. Rather high level of divisibility, flexibility and temporary transferability can facilitate the use of annual quotas. The Canadian pooling system is illustrated in Figure II.13.
50 Such a hybrid system also applies to the aboriginal commercial communal licences in a number of Gulf crab fisheries and many Pacific fisheries.
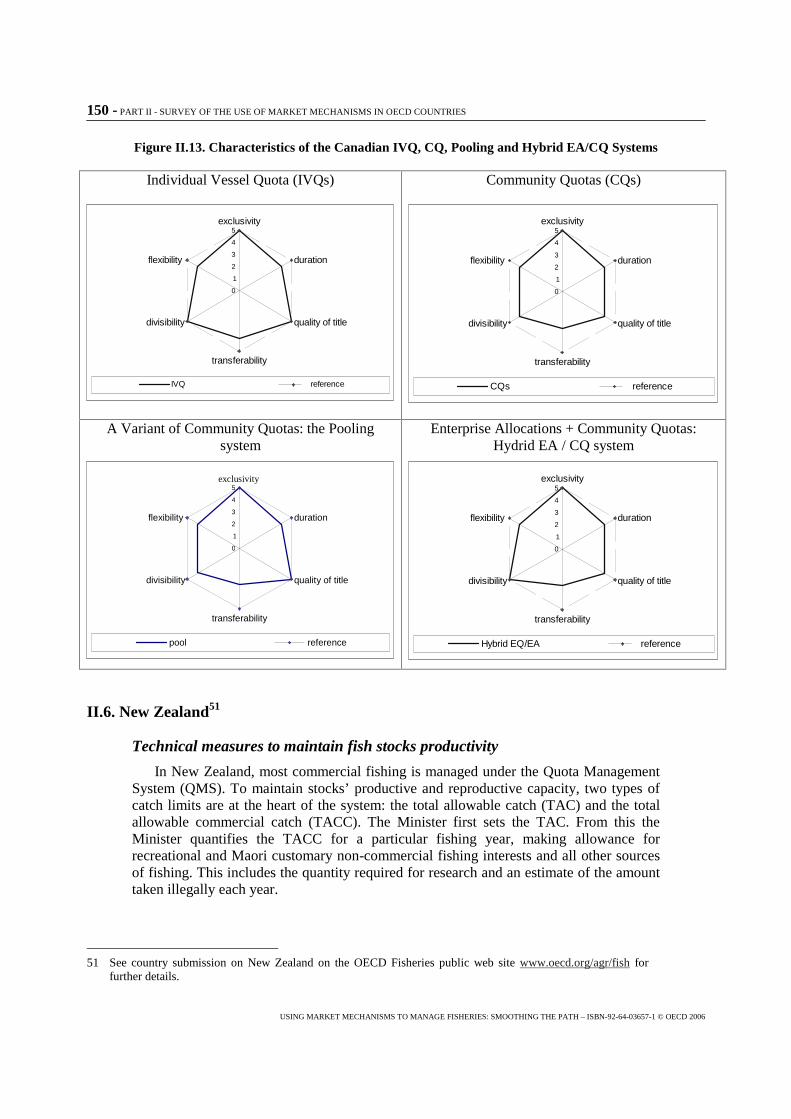
150 - PART II - SURVEY OF THE USE OF MARKET MECHANISMS IN OECD COUNTRIES
USING MARKET MECHANISMS TO MANAGE FISHERIES: SMOOTHING THE PATH – ISBN-92-64-03657-1 © OECD 2006
Figure II.13. Characteristics of the Canadian IVQ, CQ, Pooling and Hybrid EA/CQ Systems
Individual Vessel Quota (IVQs)
0
1
2
3
4
5exclusivity
duration
quality of title
transferability
divisibility
flexibility
IVQ reference
Community Quotas (CQs)
0
1
2
3
4
5exclusivity
duration
quality of title
transferability
divisibility
flexibility
CQs reference
A Variant of Community Quotas: the Pooling system
Enterprise Allocations + Community Quotas: Hydrid EA / CQ system
0
1
2
3
4
5exclusivity
duration
quality of title
transferability
divisibility
flexibility
Hybrid EQ/EA reference
II.6. New Zealand51
Technical measures to maintain fish stocks productivity
In New Zealand, most commercial fishing is managed under the Quota Management System (QMS). To maintain stocks’ productive and reproductive capacity, two types of catch limits are at the heart of the system: the total allowable catch (TAC) and the total allowable commercial catch (TACC). The Minister first sets the TAC. From this the Minister quantifies the TACC for a particular fishing year, making allowance for recreational and Maori customary non-commercial fishing interests and all other sources of fishing. This includes the quantity required for research and an estimate of the amount taken illegally each year.
51 See country submission on New Zealand on the OECD Fisheries public web site www.oecd.org/agr/fish for further details.
0 1 2 3 4 5 exclusivity
duration
quality of title
transferability
divisibility
flexibility
pool reference
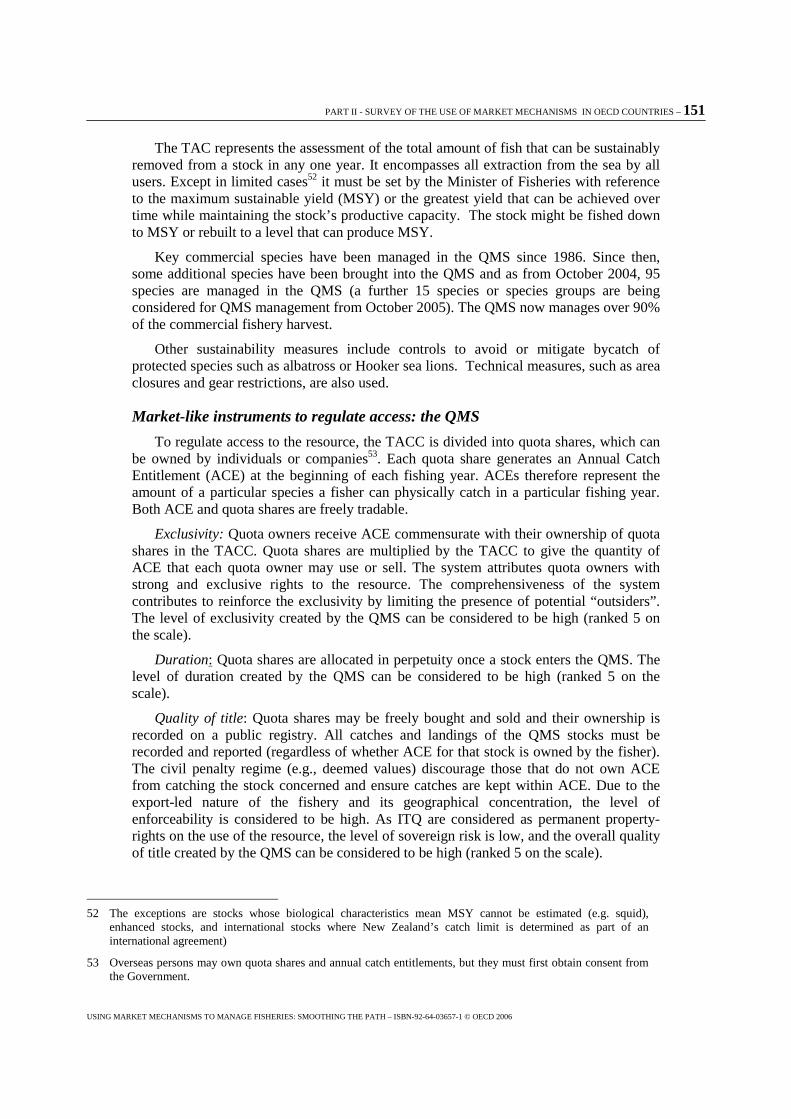
PART II - SURVEY OF THE USE OF MARKET MECHANISMS IN OECD COUNTRIES – 151
USING MARKET MECHANISMS TO MANAGE FISHERIES: SMOOTHING THE PATH – ISBN-92-64-03657-1 © OECD 2006
The TAC represents the assessment of the total amount of fish that can be sustainably removed from a stock in any one year. It encompasses all extraction from the sea by all users. Except in limited cases52 it must be set by the Minister of Fisheries with reference to the maximum sustainable yield (MSY) or the greatest yield that can be achieved over time while maintaining the stock’s productive capacity. The stock might be fished down to MSY or rebuilt to a level that can produce MSY.
Key commercial species have been managed in the QMS since 1986. Since then, some additional species have been brought into the QMS and as from October 2004, 95 species are managed in the QMS (a further 15 species or species groups are being considered for QMS management from October 2005). The QMS now manages over 90% of the commercial fishery harvest.
Other sustainability measures include controls to avoid or mitigate bycatch of protected species such as albatross or Hooker sea lions. Technical measures, such as area closures and gear restrictions, are also used.
Market-like instruments to regulate access: the QMS
To regulate access to the resource, the TACC is divided into quota shares, which can be owned by individuals or companies53. Each quota share generates an Annual Catch Entitlement (ACE) at the beginning of each fishing year. ACEs therefore represent the amount of a particular species a fisher can physically catch in a particular fishing year. Both ACE and quota shares are freely tradable.
Exclusivity: Quota owners receive ACE commensurate with their ownership of quota shares in the TACC. Quota shares are multiplied by the TACC to give the quantity of ACE that each quota owner may use or sell. The system attributes quota owners with strong and exclusive rights to the resource. The comprehensiveness of the system contributes to reinforce the exclusivity by limiting the presence of potential “outsiders”. The level of exclusivity created by the QMS can be considered to be high (ranked 5 on the scale).
Duration: Quota shares are allocated in perpetuity once a stock enters the QMS. The level of duration created by the QMS can be considered to be high (ranked 5 on the scale).
Quality of title: Quota shares may be freely bought and sold and their ownership is recorded on a public registry. All catches and landings of the QMS stocks must be recorded and reported (regardless of whether ACE for that stock is owned by the fisher). The civil penalty regime (e.g., deemed values) discourage those that do not own ACE from catching the stock concerned and ensure catches are kept within ACE. Due to the export-led nature of the fishery and its geographical concentration, the level of enforceability is considered to be high. As ITQ are considered as permanent property-rights on the use of the resource, the level of sovereign risk is low, and the overall quality of title created by the QMS can be considered to be high (ranked 5 on the scale).
52 The exceptions are stocks whose biological characteristics mean MSY cannot be estimated (e.g. squid), enhanced stocks, and international stocks where New Zealand’s catch limit is determined as part of an international agreement)
53 Overseas persons may own quota shares and annual catch entitlements, but they must first obtain consent from the Government.
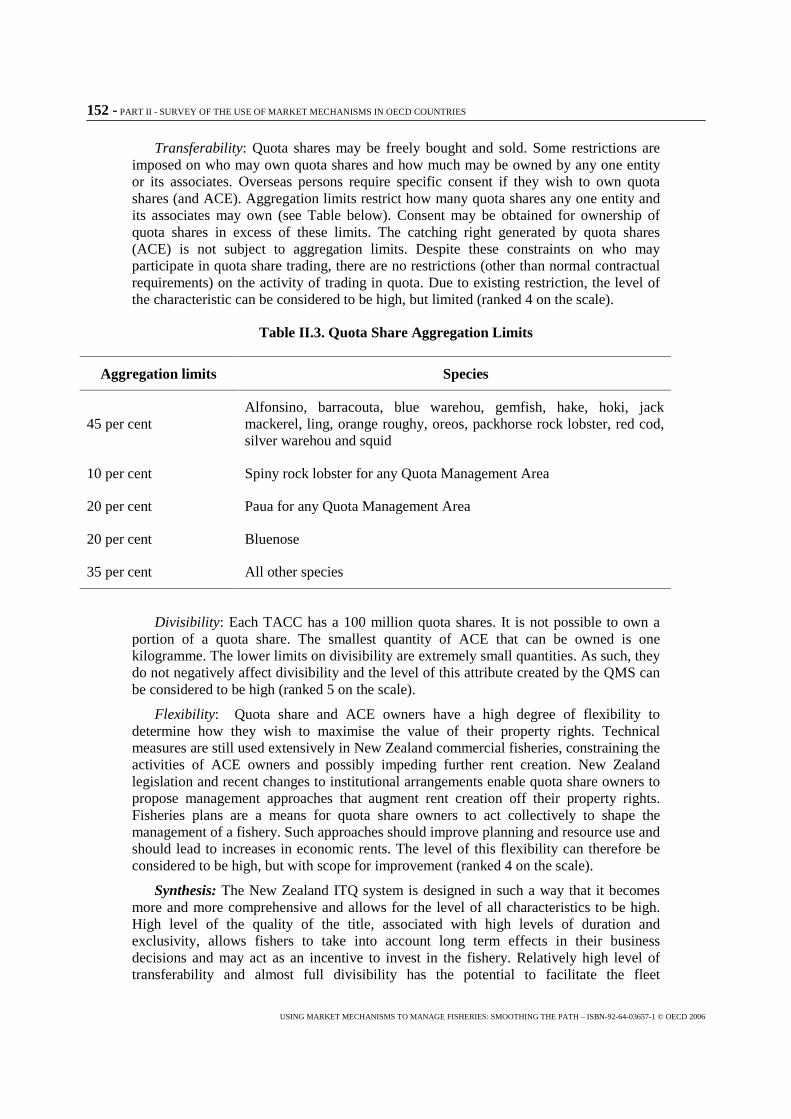
152 - PART II - SURVEY OF THE USE OF MARKET MECHANISMS IN OECD COUNTRIES
USING MARKET MECHANISMS TO MANAGE FISHERIES: SMOOTHING THE PATH – ISBN-92-64-03657-1 © OECD 2006
Transferability: Quota shares may be freely bought and sold. Some restrictions are imposed on who may own quota shares and how much may be owned by any one entity or its associates. Overseas persons require specific consent if they wish to own quota shares (and ACE). Aggregation limits restrict how many quota shares any one entity and its associates may own (see Table below). Consent may be obtained for ownership of quota shares in excess of these limits. The catching right generated by quota shares (ACE) is not subject to aggregation limits. Despite these constraints on who may participate in quota share trading, there are no restrictions (other than normal contractual requirements) on the activity of trading in quota. Due to existing restriction, the level of the characteristic can be considered to be high, but limited (ranked 4 on the scale).
Table II.3. Quota Share Aggregation Limits
Aggregation limits Species
45 per cent Alfonsino, barracouta, blue warehou, gemfish, hake, hoki, jack mackerel, ling, orange roughy, oreos, packhorse rock lobster, red cod, silver warehou and squid
10 per cent Spiny rock lobster for any Quota Management Area
20 per cent Paua for any Quota Management Area
20 per cent Bluenose
35 per cent All other species
Divisibility: Each TACC has a 100 million quota shares. It is not possible to own a portion of a quota share. The smallest quantity of ACE that can be owned is one kilogramme. The lower limits on divisibility are extremely small quantities. As such, they do not negatively affect divisibility and the level of this attribute created by the QMS can be considered to be high (ranked 5 on the scale).
Flexibility: Quota share and ACE owners have a high degree of flexibility to determine how they wish to maximise the value of their property rights. Technical measures are still used extensively in New Zealand commercial fisheries, constraining the activities of ACE owners and possibly impeding further rent creation. New Zealand legislation and recent changes to institutional arrangements enable quota share owners to propose management approaches that augment rent creation off their property rights. Fisheries plans are a means for quota share owners to act collectively to shape the management of a fishery. Such approaches should improve planning and resource use and should lead to increases in economic rents. The level of this flexibility can therefore be considered to be high, but with scope for improvement (ranked 4 on the scale).
Synthesis: The New Zealand ITQ system is designed in such a way that it becomes more and more comprehensive and allows for the level of all characteristics to be high. High level of the quality of the title, associated with high levels of duration and exclusivity, allows fishers to take into account long term effects in their business decisions and may act as an incentive to invest in the fishery. Relatively high level of transferability and almost full divisibility has the potential to facilitate the fleet
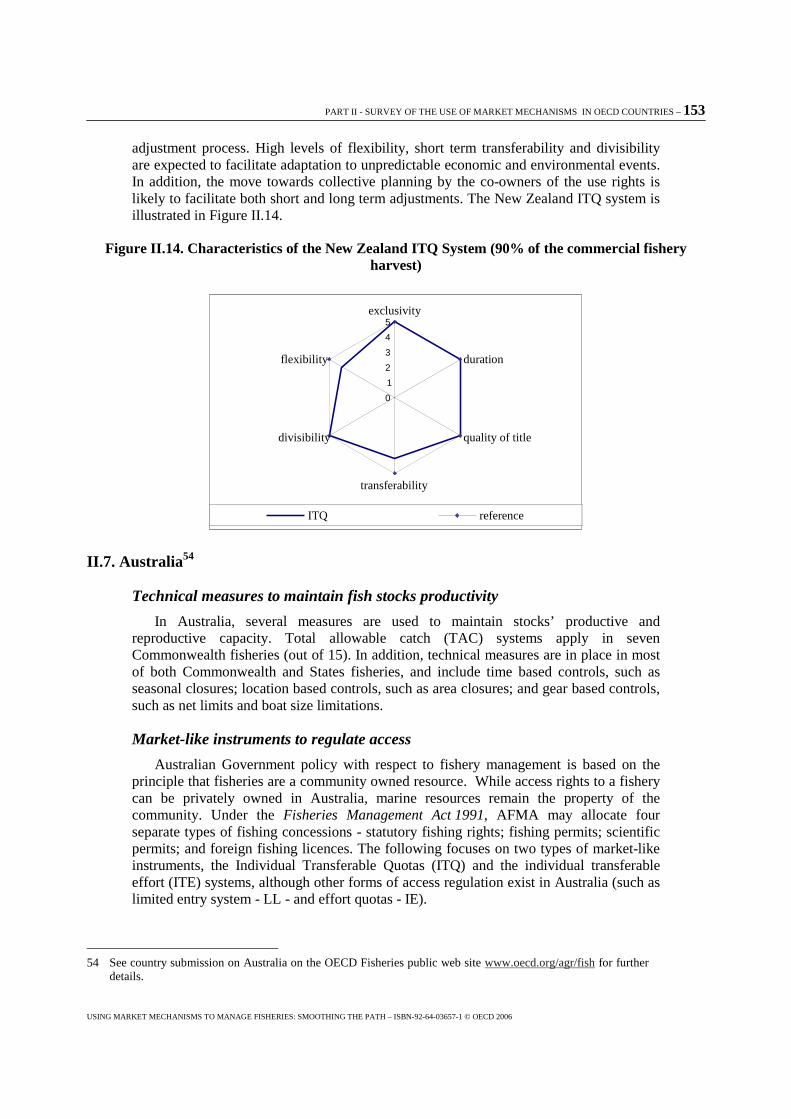
PART II - SURVEY OF THE USE OF MARKET MECHANISMS IN OECD COUNTRIES – 153
USING MARKET MECHANISMS TO MANAGE FISHERIES: SMOOTHING THE PATH – ISBN-92-64-03657-1 © OECD 2006
adjustment process. High levels of flexibility, short term transferability and divisibility are expected to facilitate adaptation to unpredictable economic and environmental events. In addition, the move towards collective planning by the co-owners of the use rights is likely to facilitate both short and long term adjustments. The New Zealand ITQ system is illustrated in Figure II.14.
Figure II.14. Characteristics of the New Zealand ITQ System (90% of the commercial fishery harvest)
II.7. Australia54
Technical measures to maintain fish stocks productivity
In Australia, several measures are used to maintain stocks’ productive and reproductive capacity. Total allowable catch (TAC) systems apply in seven Commonwealth fisheries (out of 15). In addition, technical measures are in place in most of both Commonwealth and States fisheries, and include time based controls, such as seasonal closures; location based controls, such as area closures; and gear based controls, such as net limits and boat size limitations.
Market-like instruments to regulate access
Australian Government policy with respect to fishery management is based on the principle that fisheries are a community owned resource. While access rights to a fishery can be privately owned in Australia, marine resources remain the property of the community. Under the Fisheries Management Act 1991, AFMA may allocate four separate types of fishing concessions - statutory fishing rights; fishing permits; scientific permits; and foreign fishing licences. The following focuses on two types of market-like instruments, the Individual Transferable Quotas (ITQ) and the individual transferable effort (ITE) systems, although other forms of access regulation exist in Australia (such as limited entry system - LL - and effort quotas - IE).
54 See country submission on Australia on the OECD Fisheries public web site www.oecd.org/agr/fish for further details.
0 1 2 3 4 5
exclusivity
duration
quality of title
transferability
divisibility
flexibility
ITQ reference
154 - PART II - SURVEY OF THE USE OF MARKET MECHANISMS IN OECD COUNTRIES
USING MARKET MECHANISMS TO MANAGE FISHERIES: SMOOTHING THE PATH – ISBN-92-64-03657-1 © OECD 2006
In general, the Australian Government maintains that ITQs provide the most effective mechanism to underpin management for ecologically sustainable and economically efficient fisheries. Importantly, ITQ-based management also provides the framework of market-based adjustment as the fishery changes over time. However, the Government also recognises there may be occasions where the nature of a fishery and of its broader ecosystem issues may mean that ITQs may not be the most appropriate management system. Under these circumstances, where the AFMA Board considers that a management system based on alternative management approaches, such as approaches based on individual transferable effort (ITE), will better pursue its legislative objectives, this form of management may be used.
Australian ITQ fisheries
In Australia, there are currently twenty ITQ fisheries which accounted in 1997-1998 for approximately 26% of total landings by weight and 22% of total landed value55. On these 20 fisheries, 12 are single species fisheries, 5 are dual species fisheries, 2 are three species fisheries and 1 fishery, the south east trawl fishery, is multispecies (with sixteen species under quota).
ITQ fisheries are managed either by the Commonwealth (Federal) government or by the state governments (or both under the Offshore Constitutional Settlement - OCS). While no two Australian ITQ systems are identical, the following attempts to capture the main characteristics of the ITQ systems56. When relevant, distinctions between state and Commonwealth fisheries are operated, although this must still considered as generalisations where some levels of heterogeneity remain.
Exclusivity: The basic quota entitlement in Australian fisheries is the Individual Transferable Share Quota (ITSQ), i.e. a share in whatever TAC is adopted by the fisheries authorities every fishing season. This multiplied by the TAC then gives the seasonal individual quota57. In principle, the system attributes quota owners with strong and exclusive rights to access the resource. The level of the characteristic can be considered to be high (ranked 5 on the scale).
Duration: The duration of the ITSQ varies. As for State fisheries it is in general the same as the duration of the fishing licence, with common terms of duration being one to five years. In some cases, e.g. in the Tasmanian abalone fishery, access rights have been granted for the duration of ten years. As the renewal is in principle fairly automatic, the overall level of the characteristic can be considered high but limited (ranked 4 on the scale).
The situation differs for ITQ systems issued as Statutory Fishing Rights (SFRs) issued under a statutory Management Plan in Commonwealth fisheries. These rights remain in existence for as long as the plan does. As it is in practice as difficult to revoke a Plan as it is to make a Plan, this means that SFRs provide a long term access right, so as the level of the characteristic can be considered as high (ranked 5 on the scale).
55 Sen S, Kaufmann B. and Gerry Geen. 2000. ITQs and property Rights. A Review of Australian Case Law. Proceedings of the tenth biennial conference of IIFET. Corvallis (USA).
56 Arnason R. 2002. A review of International Experiences with ITQs. Report 58. CEMARE.
57 Kaufmann B., Geen G. and Sen S. 1999. Fish Futures: Individual Transferable Quotas in Fisheries. Fisheries Research and Development Corporation and Fisheries Economics Research and Management Pty Ltd. Kiama.
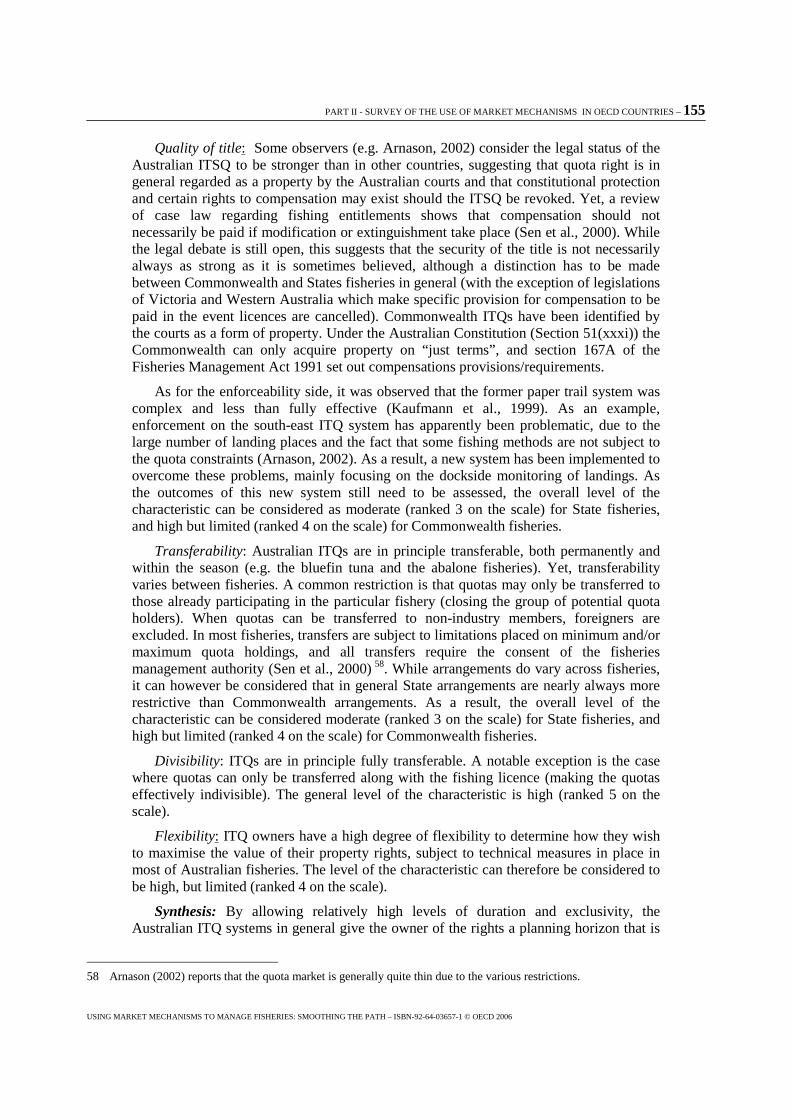
PART II - SURVEY OF THE USE OF MARKET MECHANISMS IN OECD COUNTRIES – 155
USING MARKET MECHANISMS TO MANAGE FISHERIES: SMOOTHING THE PATH – ISBN-92-64-03657-1 © OECD 2006
Quality of title: Some observers (e.g. Arnason, 2002) consider the legal status of the Australian ITSQ to be stronger than in other countries, suggesting that quota right is in general regarded as a property by the Australian courts and that constitutional protection and certain rights to compensation may exist should the ITSQ be revoked. Yet, a review of case law regarding fishing entitlements shows that compensation should not necessarily be paid if modification or extinguishment take place (Sen et al., 2000). While the legal debate is still open, this suggests that the security of the title is not necessarily always as strong as it is sometimes believed, although a distinction has to be made between Commonwealth and States fisheries in general (with the exception of legislations of Victoria and Western Australia which make specific provision for compensation to be paid in the event licences are cancelled). Commonwealth ITQs have been identified by the courts as a form of property. Under the Australian Constitution (Section 51(xxxi)) the Commonwealth can only acquire property on “just terms”, and section 167A of the Fisheries Management Act 1991 set out compensations provisions/requirements.
As for the enforceability side, it was observed that the former paper trail system was complex and less than fully effective (Kaufmann et al., 1999). As an example, enforcement on the south-east ITQ system has apparently been problematic, due to the large number of landing places and the fact that some fishing methods are not subject to the quota constraints (Arnason, 2002). As a result, a new system has been implemented to overcome these problems, mainly focusing on the dockside monitoring of landings. As the outcomes of this new system still need to be assessed, the overall level of the characteristic can be considered as moderate (ranked 3 on the scale) for State fisheries, and high but limited (ranked 4 on the scale) for Commonwealth fisheries.
Transferability: Australian ITQs are in principle transferable, both permanently and within the season (e.g. the bluefin tuna and the abalone fisheries). Yet, transferability varies between fisheries. A common restriction is that quotas may only be transferred to those already participating in the particular fishery (closing the group of potential quota holders). When quotas can be transferred to non-industry members, foreigners are excluded. In most fisheries, transfers are subject to limitations placed on minimum and/or maximum quota holdings, and all transfers require the consent of the fisheries management authority (Sen et al., 2000) 58. While arrangements do vary across fisheries, it can however be considered that in general State arrangements are nearly always more restrictive than Commonwealth arrangements. As a result, the overall level of the characteristic can be considered moderate (ranked 3 on the scale) for State fisheries, and high but limited (ranked 4 on the scale) for Commonwealth fisheries.
Divisibility: ITQs are in principle fully transferable. A notable exception is the case where quotas can only be transferred along with the fishing licence (making the quotas effectively indivisible). The general level of the characteristic is high (ranked 5 on the scale).
Flexibility: ITQ owners have a high degree of flexibility to determine how they wish to maximise the value of their property rights, subject to technical measures in place in most of Australian fisheries. The level of the characteristic can therefore be considered to be high, but limited (ranked 4 on the scale).
Synthesis: By allowing relatively high levels of duration and exclusivity, the Australian ITQ systems in general give the owner of the rights a planning horizon that is
58 Arnason (2002) reports that the quota market is generally quite thin due to the various restrictions.
156 - PART II - SURVEY OF THE USE OF MARKET MECHANISMS IN OECD COUNTRIES
USING MARKET MECHANISMS TO MANAGE FISHERIES: SMOOTHING THE PATH – ISBN-92-64-03657-1 © OECD 2006
relatively secure and which provides proper incentives to make efficient investment in harvesting techniques and in developing new markets. While high level of divisibility and flexibility has in addition the potential to facilitate adaptation to unpredictable economic and environmental events, fleet adjustment can however be limited in particular in States fisheries by constraints on transferability. Moreover, the enforceability of the system remains a challenge due to the number and diversity of the underlying fisheries. Having noted above that Commonwealth Statutory Fishing Rights are the strongest and most enduring of existing rights, the Australian ITQ systems are illustrated in Figure II.15.
Figure II.15. Characteristics of the Australian State and Commonwealth ITQ Systems
Australian State ITQ System
Australian Commonwealth ITQ Systems
Australian ITE system: the rock lobster fishery59
With an annual value of approximately AUD 50 million the Southern zone rock lobster is among the most valuable fisheries in Australia. While the management system is often presented as an ITQ system (e.g. Arnason, 2002), it is also recognised that in effect, the “ITQ” units are the pots (Arnason, ibid). There is a limitation on the maximum and minimum number of pots that can be held by any licence holder in the fishery.
Since 1998, the pots quotas can be transferred to any licence holder provided the traders do not violate the minimum and maximum pot stipulation. While available information does not allow for the application of the analytical framework to this fishery, indications suggested that the ITE system is working well to restrict the harvest level and to increase economic efficiency.
59 Another interesting example of ITE concerns the Northern Prawn Fishery. This is a Commonwealth fishery with a gross value of production exceeding AUD 100 million for which a very well defined ITE system (headrope units) has been implemented under a Statutory Management Plan.
0 1 2 3 4 5 exclusivity
duration
quality of title
transferability
divisibility
flexibility
ITQ State reference
0 1 2 3 4 5 exclusivity
duration
quality of title
transferability
divisibility
flexibility
ITQ Commonwealth reference
PART II - SURVEY OF THE USE OF MARKET MECHANISMS IN OECD COUNTRIES – 157
USING MARKET MECHANISMS TO MANAGE FISHERIES: SMOOTHING THE PATH – ISBN-92-64-03657-1 © OECD 2006
II.8. Korea60
Technical measures to maintain fish stocks productivity
In Korea, a total allowable catch (TAC) system was introduced in 1999 to maintain the productivity of main fish stocks. As of 2003, 9 species were subjected to TACs (mackerel, jack mackerel, sardine, red snow crab, purplish washington clam, pen shell, cheju top shell, snow crab and blue crab). In addition, Korea has restricted the use of nets generating intensive catches such as gill nets and fish traps and implemented numerous additional technical measures to help maintaining the productivity of some stocks.
Market-like instruments to regulate access: the Fishermen-Oriented Co-Management System
Recognising that the government’s top-down, command and control approach to fisheries management have had limited success, the Korean Government adopted in 2001 a new market-like instrument to regulate access to the resource: the so-called Fishermen-Oriented Co-Management system, which is a form of community quota (CQ) system. Basically, the fishermen-oriented co-management system consists in extending the responsibility and rights associated with the management of fishing grounds, fishery resources and harvesting with a sense of co-ownership.
As of 2004, the Korean government designated 177 fishing villages as co-management fishery communities. These villages, with a total of 15 437 fishers (i.e. around 20% of the labour force employed in fisheries), have been granted an exclusive right to access the fish stocks that are placed under their responsibility. The following describes the main characteristics of this management system.
Exclusivity: This management system is based on common ownership of local fishing grounds61. Fishing communities participating in the Fishermen-Oriented Co-Management system have the exclusive right to use local fishing grounds. In addition, fishing communities consist of fishers operating under identical technical and regulatory conditions. This is likely to ensure the internal cohesion and reduce the (internal) incentives to compete. The level of the characteristic can be considered as high (ranked 5 on the scale).
Duration: The basic validity term of the fishing licence is 10 years. In principle, the term could be automatically renewed for another 10 years in case of application from the fishing community (providing compliance with rules). As a result, the level of the characteristic can be considered as high but limited (ranked 4 on the scale).
Quality of the title: Rights are generally authorised by law through the delivering of licences to the communities. Even in the absence of explicit licences, the law recognises the customary nature of the right (see above footnote). The validity of community fishing licence is basically secured except for limited cases that are specified in the law (e.g. for the purpose of protecting marine resources, shipping safety, public development). However, in case of the revocation of the fishing licence, Government has to compensate the community. The security of the title is thus perceived as high. As for enforceability, it
60 See country submission on Korea on the OECD Fisheries public web site www.oecd.org/agr/fish for further details.
61 In some cases, an exclusive right is explicitly granted to the community. In other case, the law recognises the right as “conventional” or “customary”.
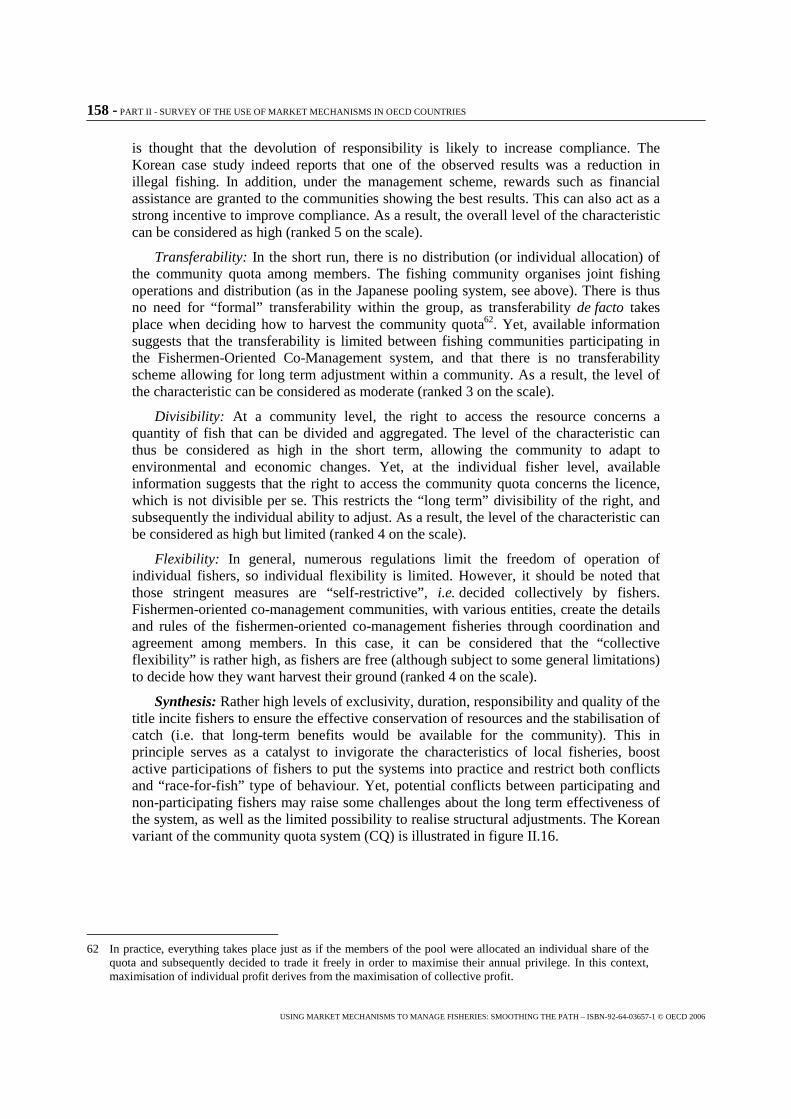
158 - PART II - SURVEY OF THE USE OF MARKET MECHANISMS IN OECD COUNTRIES
USING MARKET MECHANISMS TO MANAGE FISHERIES: SMOOTHING THE PATH – ISBN-92-64-03657-1 © OECD 2006
is thought that the devolution of responsibility is likely to increase compliance. The Korean case study indeed reports that one of the observed results was a reduction in illegal fishing. In addition, under the management scheme, rewards such as financial assistance are granted to the communities showing the best results. This can also act as a strong incentive to improve compliance. As a result, the overall level of the characteristic can be considered as high (ranked 5 on the scale).
Transferability: In the short run, there is no distribution (or individual allocation) of the community quota among members. The fishing community organises joint fishing operations and distribution (as in the Japanese pooling system, see above). There is thus no need for “formal” transferability within the group, as transferability de facto takes place when deciding how to harvest the community quota62. Yet, available information suggests that the transferability is limited between fishing communities participating in the Fishermen-Oriented Co-Management system, and that there is no transferability scheme allowing for long term adjustment within a community. As a result, the level of the characteristic can be considered as moderate (ranked 3 on the scale).
Divisibility: At a community level, the right to access the resource concerns a quantity of fish that can be divided and aggregated. The level of the characteristic can thus be considered as high in the short term, allowing the community to adapt to environmental and economic changes. Yet, at the individual fisher level, available information suggests that the right to access the community quota concerns the licence, which is not divisible per se. This restricts the “long term” divisibility of the right, and subsequently the individual ability to adjust. As a result, the level of the characteristic can be considered as high but limited (ranked 4 on the scale).
Flexibility: In general, numerous regulations limit the freedom of operation of individual fishers, so individual flexibility is limited. However, it should be noted that those stringent measures are “self-restrictive”, i.e. decided collectively by fishers. Fishermen-oriented co-management communities, with various entities, create the details and rules of the fishermen-oriented co-management fisheries through coordination and agreement among members. In this case, it can be considered that the “collective flexibility” is rather high, as fishers are free (although subject to some general limitations) to decide how they want harvest their ground (ranked 4 on the scale).
Synthesis: Rather high levels of exclusivity, duration, responsibility and quality of the title incite fishers to ensure the effective conservation of resources and the stabilisation of catch (i.e. that long-term benefits would be available for the community). This in principle serves as a catalyst to invigorate the characteristics of local fisheries, boost active participations of fishers to put the systems into practice and restrict both conflicts and “race-for-fish” type of behaviour. Yet, potential conflicts between participating and non-participating fishers may raise some challenges about the long term effectiveness of the system, as well as the limited possibility to realise structural adjustments. The Korean variant of the community quota system (CQ) is illustrated in figure II.16.
62 In practice, everything takes place just as if the members of the pool were allocated an individual share of the quota and subsequently decided to trade it freely in order to maximise their annual privilege. In this context, maximisation of individual profit derives from the maximisation of collective profit.
PART II - SURVEY OF THE USE OF MARKET MECHANISMS IN OECD COUNTRIES – 159
USING MARKET MECHANISMS TO MANAGE FISHERIES: SMOOTHING THE PATH – ISBN-92-64-03657-1 © OECD 2006
Figure II.16. Characteristics of the Korean community quota system (CQ)
II.9. Other OECD Countries
Several other OECD Countries have market-like instruments in place to regulate access to fisheries. While available information doesn’t allow for applying the analytical framework to their description, this section lists these management instruments for the purpose of comprehensiveness.
� Finland: forms of TURF63 and Community based quotas (CQ) where waters are privately owned. As described in the Finnish management system64, the Finnish water areas can today be divided into three groups on the basis of ownership. Some areas are owned by individual persons, i.e. parcelled water areas (or TURF). These areas are most common in the southern and western parts of the country. Secondly, there are areas that are jointly owned by groups of private real estate holders. In legal terms the proprietor of the areas owned by groups of private real estate holders is a shareholders' association for a registered village's common areas. The shareholders are not always organised, but sometimes they are replaced by the statutory shareholders' fishery association for the (respective) registered village's common waters (i.e. between TURF and CQ). The shareholding estates per village vary between two and several thousands. The system is furthermore complicated by the fact that the archipelago water area is split by a network of village and estate boundaries. Finally, outside the village boundaries (and in the middle of the largest lakes) there are public water areas owned by the state.
� Ireland: form of Vessel Catch limits (VC). Each month, on the basis of national quota allocations, the Department of Communications, Marine and Natural Resources in consultation with the industry decides on management regimes for the following month. These management regimes involve catch limitations per vessel.
63 i.e. a system similar to the one in place in Sweden up to 300 meters from the coast
64 http://www.oecd.org/dataoecd/11/40/34429179.pdf
0 1 2 3 4 5
exclusivity
duration
quality of title
transferability
divisibility
flexibility
CQ reference
160 - PART II - SURVEY OF THE USE OF MARKET MECHANISMS IN OECD COUNTRIES
USING MARKET MECHANISMS TO MANAGE FISHERIES: SMOOTHING THE PATH – ISBN-92-64-03657-1 © OECD 2006
� Mexico: form of Limited Transferable Licence (LTL) system, i.e. system of permits and concessions, where “the difference between permits and concessions lies in the amount invested and the economic prospects of the project” and where “the fact that (concessions) are transferable allows for the entry of new economic agents” (see the Mexican submission, paragraph 25, at http://www.oecd.org/dataoecd/9/58/34430128.pdf);
� Poland: form of Individual Transferable Quota (ITQ) under the so-called "individual catch limits" scheme (see the Polish chapter to the Review of Fisheries in OECD Countries, OECD, 2005). Under this scheme, which is applied to cod and salmon vessels above 15 meters, catch quota allocated by special fishing permit could be transferred wholly or partly to another ship owner who have had individual catch quota for the same fish. This transfer was possible with acceptance of Minister of Agriculture and Rural development given after taking the opinion of social fishermen’s associations. This system was in force until the 1st May of 2004;
� USA: TURF, Community-based catch quotas (CQ, e.g. through Community Development Quotas for Eskimo and Aleut Native Alaskans or the cooperative formed to manage Alaska pollack), Vessel Catch limits (VC), Individual non-transferable quotas (IQ), Individual transferable effort quotas (ITE, under the form of transferable pots systems), Individual transferable quotas (ITQ, for the wreckfish, halibut/sablefish, surf clam and tuna purse seine fisheries) (see the US case study in Appendix and OECD, 1997, for further details);
II.10. Greenland65
Technical measures to maintain fish stocks productivity
To maintain fish stocks’ productive and reproductive capacity, Total Allowable Catch (TAC) represents the cornerstone of Greenland’s fisheries management system. For each year, the Landsstyre (Greenland Executive) fixes TACs for specific fish stocks in the fishing territory of Greenland. Currently, 11 species in the offshore sector are subject to TAC, including shrimp, Greenlandic halibut, snow crab, grenadiers, redfish, Atlantic halibut, catfish, capelin, Blue Whiting, cod, and bottomfish (and 2 sub-stocks, including Arctic char and octopus/ squid, as well as by-catch). Individual quota agreements are established with Russia pertaining to haddock in Russian waters; Norway regarding haddock and saithe in Norwegian waters; the Faroe Islands in terms of herring; and, under ‘International’ agreements additional herring quota – these individual agreements establish quota limits for Greenlandic vessels fishing in the respective partners’ fishing territories. These species account for over 96.6% of the value of harvest taken within the EEZ, with shrimp accounting for the most significant portion (65% of the value of harvest subject to TAC in 2003). As pertains to the application of TAC limitations in the coastal fishery, only shrimp, crab and scallop are regulated.
In addition to the TAC system, there are a number of other measures designed to improve the sustainable yield of the stocks. This includes technical measures such as
65 See country submission on Greenland for further details on OECD Fisheries public web site: www.oecd.org/agr/fish
PART II - SURVEY OF THE USE OF MARKET MECHANISMS IN OECD COUNTRIES – 161
USING MARKET MECHANISMS TO MANAGE FISHERIES: SMOOTHING THE PATH – ISBN-92-64-03657-1 © OECD 2006
protection periods and areas that shall be kept free of fishing; equipment and use of vessels; fishing tackle and equipment, including a ban on the use of certain gear; types of gear or catching methods; minimum sizes of fish, mesh sizes and the gauging of mesh sizes; maximum by-catches of specific species in fishing for other species. One particular example of this is on Greenland’s east coast where a “Redfish protection area” was established, wherein fisheries with bottom trawl were completely banned. Since the year 2001, the Ministry also imposed the usage of sorting-grids as a mandatory requirement for shrimp fishing operations.
Market-like instruments to regulate access
General characteristics
In Greenland, access to national TAC is regulated through several means. For species where a TAC has been established, each stock is divided in quotas66. To begin with, quotas are in general reserved for vessels and owners of vessels from Greenland recognized as Greenlanders67. Available quotas are allocated to fleet units (i.e. a delimited group of vessels registered in Greenland), occupational groups and non-Greenland fisheries according to time and geographical area. For instance, the TAC for shrimps off West Greenland shall be allotted 43% to the inshore fleet component and 57% to the offshore fleet component. Within fleet units, fleet quotas are in general divided among shipowners on the basis of the “quota share” possessed. In a given year, each shipowner is allocated a maximum allowable quantity expressed in tonnes from a given quota (the “annual quota”).
Regulation is then based on four different types of licenses: time-limited licenses with and without quotas and time-unlimited licenses with and without quotas. The government decides what kind of license is mandated with the exception of those for shrimp (already pre-determined as both time-unlimited – quota allocations for offshore shrimp trawlers are renewed each 5-year period - and transferable quota required) and salmon fisheries, which according to the Fisheries Act require licenses. For fisheries where licenses are not required, the fisheries are open to all Greenlandic vessels, as long as the TAC has not been utilized to its full extent.
As the Greenland fisheries management system is extensively based on individual transferable quotas (ITQs) systems, this market-like instrument is described in the following section. Yet, it should be noted that a form of individual transferable effort system (ITE) also exists, in particular for vessels below 75 GRT operating in the shrimp fishery. In this case, the regulation method (the Capacity Quota System) is through a number of points given to each fisherman involved in the fisheries based on the individual’s activities in the previous years and determined according to their respective technical capacity (e.g. vessel size, gear type, etc). The points are fully transferable, and it is feasible to upgrade the fishing capacity by buying a certain number of points and upgrading gear68.
66 . For species where no quota has been established, there are no limitations according to the Fisheries Act.
67 Although the Home Rule administration has the possibility to make exceptions to this condition, as necessary.
68 See country submission for further details on the OECD Fisheries public web site www.oecd.org/agr/fish . This may be further explored in the future.
162 - PART II - SURVEY OF THE USE OF MARKET MECHANISMS IN OECD COUNTRIES
USING MARKET MECHANISMS TO MANAGE FISHERIES: SMOOTHING THE PATH – ISBN-92-64-03657-1 © OECD 2006
The Greenland ITQ system in the shrimp fishery
The Greenland ITQs or “individual quota share” system was introduced in 1990 for offshore shrimp fisheries and subsequently on January 1st, 1997 for coastal shrimp fisheries. As noted above, shrimps accounted for around two-thirds of Greenland revenue from fishing in 2003.
Exclusivity: For those licenses combined with a maximum allowable catch, as in the case of the shrimp ITQ system, the Landsstyre shall publish information about the size of the annual quota every year. Each operator knows the quantity that other right holders are entitled to fish. In addition, a quota share or annual quota allocated to one fleet unit shall not be fished by any other fleet unit. This provides a high level of exclusivity within and among groups, so the level of the characteristic is high (ranked 5 on the scale).
Duration: In general, quota shares are possessed by ship owners and shall be transferable by inheritance. In the case of shrimp, licences are also considered “time-unlimited”, as quota allocations for offshore shrimp trawlers are renewed each 5-year period. The level of the characteristic is high (ranked 5 on the scale).
Quality of the title: Due to the social and economic importance of the fishing industry in Greenland, particular efforts are dedicated to enforcement operations. Inspections are managed in tandem by the “Grønlands Kommando” (the naval inspection fleet stationed at Grønnedal, South Greenland, as well as their aircraft based in Narsarsuaq) and the Fisheries License Control, the Home Rule government’s designated fishing licensing and monitoring authority. These operations include practical inspection of fishing vessels’ catch and fishing gear exclusively when they are at sea with onboard patrols. In addition, controls may occur at the fish processing plants’ level, which improve the comprehensiveness of the enforcement system. As for the security of the title, it should be noted that the Cabinet may issue notices about time-limited changes of the conditions for fishing activities, which entails a fairly significant sovereign risk. In addition, the Landsstyre may lay down rules on reduction of quota shares in the case of mergers of ship owning entities (duty of reversion), which also carries a risk. Yet, the Home Rule has also a precedent for buying quota shares in order to reduce the fishing activity or to redistribute the share69, which reduces such a sovereign risk. The overall level of the characteristic can be considered as high but limited (ranked 4 on the scale).
Transferability: A ship owner may, without effect for the operation’s license and quota shares, sell its annual quota or part of this quota, if damage or long-term repair at a shipyard transpires; natural obstructions such as ice or similar circumstances prevent the ship owner from exhausting the operation’s annual quota. Transfer of an annual quota may moreover take place in special cases warranted by economic or administrative conditions. Enterprises owned by the Home Rule Government may sell and buy annual quotas irrespective of the provisions of subsections (1)-(3) in the Fisheries Act. Yet, transfers of both quota share and annual quota must be approved by the Landsstyre, and several other restrictions on the transferability of the fishing rights are in force: No company or individual may by purchase of quota shares attain a total quota share which exceeds 33.3% in the regulated area for the offshore fleet unit; No company or individual may through purchases of quota shares acquire a quota share in the regulation area for the coastal fleet component which exceeds 10%; An annual quota allocated to one fleet unit
69 A policy maintained in 2004 through the administration of a quota bank.
PART II - SURVEY OF THE USE OF MARKET MECHANISMS IN OECD COUNTRIES – 163
USING MARKET MECHANISMS TO MANAGE FISHERIES: SMOOTHING THE PATH – ISBN-92-64-03657-1 © OECD 2006
shall not be fished by any other fleet unit. The level of the characteristic can be considered as high but limited (ranked 4 on the scale).
Divisibility: Available information suggests that any fraction of the right can be divided, aggregated and traded, so the level of the characteristics is high (ranked 5 on the scale).
Flexibility: Right holders are relatively free in planning and conducting their fishing activities within a given year. In addition, the Cabinet may issue rules according to which a shipping company, which has exhausted its annual quota, may continue its fishing activities provided that the quantities fished in excess of the annual quota quantities are deducted from the shipping company’s annual quota for the subsequent year. Further, the Cabinet may issue rules according to which a shipping company, which has not exhausted its annual quota, may, for the coming year, have its annual quota increased by a quantity corresponding to the unused portion from the preceding year. All this increases the level of the characteristic. Yet, some restrictions also apply to most fisheries. For instance, the Cabinet may issue notices setting out when fishing activities may be commenced and when fishing activities must be stopped. For Greenland fisheries according to section 6 of the Fisheries Law, it may also be required as a condition for acquiring a license (1) that the catch shall be delivered in full or in part to one or more specified processing plants in Greenland, possibly for definite periods and with respect to certain quantities, qualities and compositions of the catch (specified delivery), and (2) that a certain part of the crew shall be persons with a permanent connection with the Greenlandic society and/or community (crew share). As this attenuates the right, the overall level of the characteristic can be considered as moderate (ranked 3 on the scale).
Synthesis: By providing right holders with rather high levels for all characteristics, Greenland's ITQ system reduces the tendency of overcapitalization and overexploitation. On the one hand, quota owners do not have any economic incentives to invest more than their respective quota share can support. On the other hand, high levels of duration and quality of the title provide incentives for secure investments (e.g., the offshore fleet alone has invested DKK 570 million – EUR 76.6 million - in purchasing quota from the Home Rule Government since establishment of the ITQ system in the early 1990s). Yet, restrictions on transferability and on flexibility may affect the use of annual quotas. The Greenland ITQ system is illustrated in Figure II.17.
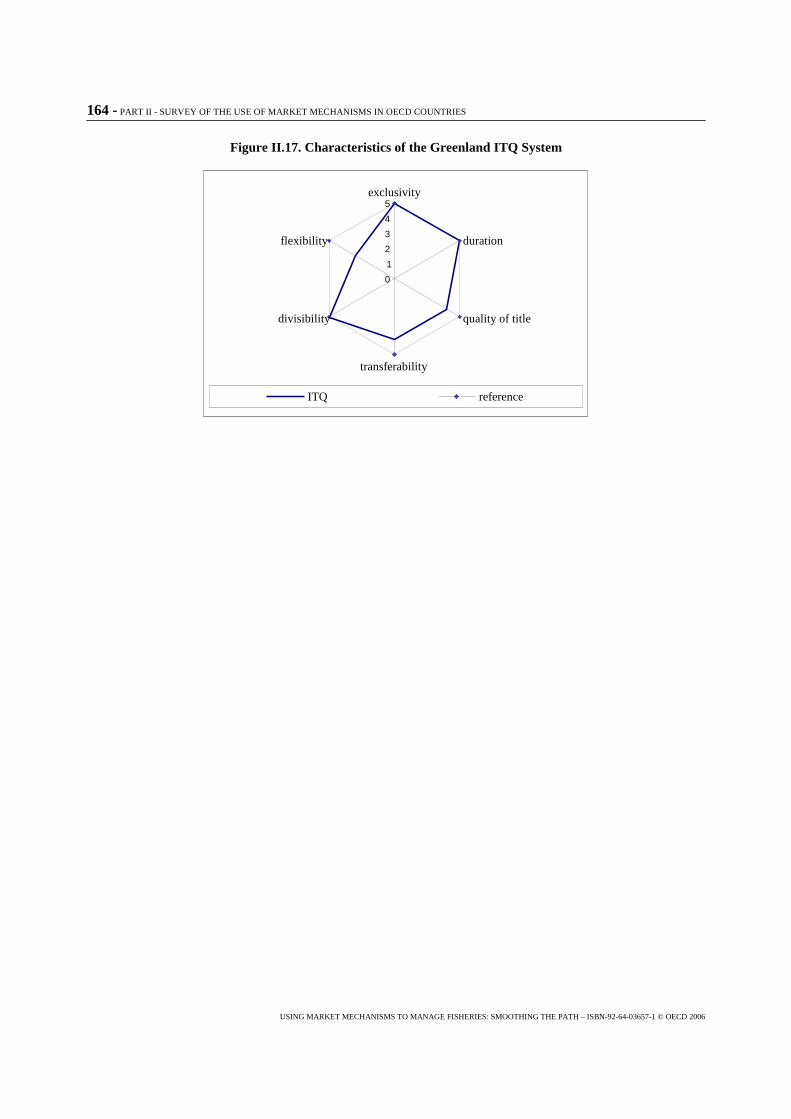
164 - PART II - SURVEY OF THE USE OF MARKET MECHANISMS IN OECD COUNTRIES
USING MARKET MECHANISMS TO MANAGE FISHERIES: SMOOTHING THE PATH – ISBN-92-64-03657-1 © OECD 2006
Figure II.17. Characteristics of the Greenland ITQ System
0 1 2 3 4 5
exclusivity
duration
quality of title
transferability
divisibility
flexibility
ITQ reference
PART III – COUNTRY CASES - 165
USING MARKET MECHANISMS TO MANAGE FISHERIES: SMOOTHING THE PATH – ISBN-92-64-03657-1 © OECD 2006
PART III
COUNTRY CASES

CHAPTER 4 – ICELAND – 167
USING MARKET MECHANISMS TO MANAGE FISHERIES: SMOOTHING THE PATH – ISBN-92-64-03657-1 © OECD 2006
Chapter 4
Iceland*
Introduction
It is by now widely recognized that the basic problem of economic inefficiency in fisheries, often-referred to as the common property problem (Hardin 1968), stems fundamentally from inadequate or lacking property rights in the underlying natural resources, the fish stocks and their ocean habitat (Scott 1955, Neher et al. 1989, Arnason, 1997, Shotton 2000). Due to this lack of property rights, trades in the natural resources cannot occur. As a result a market cannot arise and, consequently, market forces do not emerge to guide behavior to the common good.
Under these circumstances, management authorities have essentially three choices:
1. They can do nothing in which case the most valuable fish resources will almost certainly be decimated.
2. They can attempt to control the harvesting process by direct restrictions of various kinds. These measures, if effectively carried out, may conserve the fish stocks, but are economically useless if not outright wasteful.1
3. They can attempt to simulate the operation of markets by introducing market-like instruments.
4. The market-like instruments that have been suggested essentially fall into two categories (Arnason 1994):
5. Taxes and
6. Property rights.
Taxes simulate the operation of the market by charging a fee for the use of the underlying natural resource. Ideally this fee should be what a hypothetical profit-maximizing owner of the resource, operating in a competitive economic environment, would charge others for the use of the resource. In the case of fisheries, it is often suggested that this fee should be a payment for each unit of harvest (Arnason, 1990, Weitzman 2002). It is important to notice, however, that since the volume of harvest is
* Written by Professor Ragnar Arnason with the permission of the Fisheries Association of Iceland to access its data files, on which much of the empirical research of this paper relies, is gratefully acknowledged. The paper has also benefited greatly from the research assistance of Brynhildur Benediktsdottir at Statistics Iceland. Thanks are, moreover, due to Ari Arason and various members of the staff of the Fisheries Directorate, Statistics Iceland and the Icelandic Ministry of Fisheries for their valuable help. All remaining errors and imperfections are my sole responsibility.
1 According to OECD 1997 and many other reports, direct restrictions generally do not generate lasting economic benefits. They are, however, costly to implement and enforce. Consequently their employment generally leads to a net economic loss.

168 - CHAPTER 4 - ICELAND
USING MARKET MECHANISMS TO MANAGE FISHERIES: SMOOTHING THE PATH – ISBN-92-64-03657-1 © OECD 2006 168
but a part of the overall impacts on fish stocks generated by the fishing activity � the others including variables such as by-kills, distortion of the age distribution of the stock, species behavioural disruption and stress, habitat changes and so on � even an ideal tax on harvests will not render the fishery fully efficient.
Management authorities may also attempt to remedy the missing markets problem by establishing property rights in the resources or their close complements. There are many possible types of such property rights in fisheries including (a) sole ownership, (b) individual quotas (IQs), (c) individual transferable quotas (ITQs), (d) territorial use rights in fisheries (TURFs) and (e) community fishing rights. If these property rights are transferable, a market for them will arise. In this market a price will emerge and this price will directly and indirectly guide the activities of the participants in the fishery, just as any other market price.
Although contrived natural resource markets of this kind are in most respects very similar to traditional markets, it is important to be aware of the differences. First, the property rights instruments on which the market is based are not spontaneous. They have been artificially created for an express purpose. Therefore, they usually require the establishment and operation of the appropriate supporting institutions, such as enforcement, to work as intended. Second, the property rights created are often somewhat limited or incomplete compared to perfect property rights. IQs and ITQs, for instance, are property rights in the volume of harvest from a given stock. Unlike farming, they are not property rights in what really counts, i.e. individual fish and the habitat they inhabit. TURFs may be slightly better in this respect but even they are subject to the migration of fish and other organisms and materials in and out of the TURF. The only marine resource property right that comes close to traditional property rights on land is sole ownership. Therefore, as generators of economic efficiency, most fisheries property rights, certainly IQs/ITQs, are subject to similar limitations as taxes discussed above. Third, for many of these property rights to function optimally, some centralized intervention is still required. Thus, certainly in the case of IQs or ITQs and even for TURFs and community fishing rights, some authority has to set overall extraction volumes such as total allowable catches (TACs). Thus, the creation of most fisheries property rights (sole ownership seems to be the exception) generally does not imply that complete decentralization is appropriate. It is interesting to note in this connection that this feature is to certain extent the second are shared by many financial instruments such as money.
Since 1979, Iceland has increasingly used ITQs in the management of her fisheries with major steps being taken in 1984 and 1990 (Anonymous 2004). At the same time the system has gradually been improved in design and operation. By now (2004) virtually all Icelandic fisheries are managed on the basis of ITQs.2 As is well known (Scott 1997), ITQs are property rights designed to overcome the traditional common property problem of fisheries. According to theory (Arnason 1990), ITQs will lead to micro-efficiency in the fisheries, i.e. the TAC will be taken in the economically most efficient way. Moreover, according to the theory, the fishery will be approximately fully efficient attained if the appropriate level of TAC is set every season.
2 The exceptions are (i) a few commercially insignificant fisheries for which TACs have not been set, (ii) a few artisanal fishing rights subject to effort restrictions due to expire within 2 years and (iii) certain type of recreational fisheries and fishing for own consumption.
CHAPTER 4 - ICELAND - 169
USING MARKET MECHANISMS TO MANAGE FISHERIES: SMOOTHING THE PATH – ISBN-92-64-03657-1 © OECD 2006 169
This paper considers the impact of ITQs on one particular variable having to do with the efficiency of the Icelandic fisheries, namely the fleet size.3 Generally, when an improved fisheries management system is introduced, the fishery is already heavily overexploited and the fishing fleet greatly excessive. This was certainly the case in Iceland. It follows that a reduction in the fleet size constitutes one measure of the efficacy of the ITQ system. Somewhat unexpectedly, it has generally been found in ITQ fisheries around the world as well as those of Iceland, that while variables such as fishing effort and the timing and quality of landings respond smartly to the ITQ incentives, the size of the fishing fleet adjusts quite sluggishly (for Iceland see Anonymous 2004, for other ITQ fisheries see Hatcher et al. 2002).
This paper investigates this issue both theoretically and empirically. The theoretical part of the paper attempts to derive the optimal (and therefore likely) response of fleet size to the incentives embodied in ITQs given the usual economic conditions such as the cost of investment function. This theoretical investigation is, of course, applicable to fisheries in general and is not restricted to the Icelandic situation. In fact, it is not even restricted to fisheries. It applies to profit maximizing investment behaviour in general. The empirical part of the paper is based on data from the Icelandic fisheries. More precisely it looks at the evolution of certain components of the Icelandic fishing fleet under both ITQs and previous fisheries management regimes. Special attention is paid to one subset of the Icelandic fishing fleet, namely the small vessel fleet. There are two main reasons for this. First, this is a comparatively homogeneous fleet, harvesting a small selection of demersal species (esp. cod, haddock and ocean catfish) and employing limited number of fishing gear. Second, this small vessel segment of the fishing fleet has been subject to a range of different fisheries management system over the past 20 years including ITQs. It thus constitutes an interesting test bed for the impact of the various fisheries management systems on fleet development.
The paper is organized broadly as follows: The next section lays out the basic theoretical considerations regarding investment behaviour and the dynamics of fleet capital when a formerly overcapitalized fishery is rationalized for instance by the introduction of ITQs. This section basically summarizes and explains the theoretical results. A more compete and rigorous analysis is contained in a series of appendices to the paper. In the following section, section 2, we look at the evidence from the Icelandic fisheries, focusing, as already explained on the small vessel fleet. Then in the final section of the paper we summarize our results.
1. Theory4
Consider a profit maximizing fishing firm. The firm attempts to solve the following problem (Appendix A):
(1.1) 0{ , }
[ ( , ) ( )] r t
a iMax V R a k x C i e dt
�
� �� � � ��
S.t. ( ) ( , )x G x Y a k x y� � � �� ,
3 Information about the impact of ITQs on various other aspects of the Icelandic fisheries can be found in Anonymous 2004.
4 This section is based on analysis contained in Appendices A-D. For analytical details and clarifications the reader is referred to these appendices.
170 - CHAPTER 4 - ICELAND
USING MARKET MECHANISMS TO MANAGE FISHERIES: SMOOTHING THE PATH – ISBN-92-64-03657-1 © OECD 2006 170
k i k�� � �� ,
1 0a� � .
In this expression, the function ( , )R a k x� represents a net revenue function of the firm before investment costs with the variable k representing fishing capital, a the utilisation rate of fishing capital and x fish stock biomass. The multiple a�k measures the application of fishing capital to fishing usually referred to as fishing effort. The function
( )C i represents the outlays associated with investment, i. These consist of the price of capital and the other costs incurred when investment (dis-investment) takes place. Thus, the expression ( , ) ( )R a k x C i� � represents the firm’s instantaneous profit function on cash flow basis. The parameter r represents the rate of interest. V , the so-called value function (or, more precisely, functional) measures the present value of profits from the fishery from the current time, t=0, onwards.
In the differential equation, ( ) ( , )x G x Y a k x y� � � �� , the function G(x) stands for
natural growth of biomass, ( , )Y a k x� is the firm’s harvest as already stated and y is the harvest of other firms in the fishery. The equation, thus, simply says that biomass evolves according to natural growth, G(x), less total harvest ( , )Y a k x y� � . According to the
other differential equation, k i k�� � �� , capital increases with investment, i, and declines with depreciation, k� � . Finally, the inequality constraint, 1 0a� � , merely states the fact-of-life that utilisation of capital cannot be less than zero and cannot exceed unity.
The firm’s problem is to maximize V by selecting the appropriate paths of investment, {i}, and utilisation of the fishing capital, {a}. To do this right, however, the firm must take due notice of the two differential constraints on biomass, x, and capital, k, as well as the inequality constraint on utilisation of capital, a.
It is important to appreciate, that apart from the explicit inclusion of fishing capital variable, problem (1.1) is a fairly standard fisheries problem whose solution is well understood (see e.g. Clark 1975 and Arnason 1991). The explicit presence of capital, however, complicates the problem substantially. In particular, it makes it very difficult to characterize the complete solution in reasonably understandable terms (see e.g. Clark et al. 1977). For this reason we will in this section restrict our attention to the fishing capital aspect of this problem. Information about the complete solution and other analytical details can be found in Appendices A-D.
In many respects, the cost of investment function is central to this analysis. This function, as already stated, would generally consist of the price of investment goods plus the cost of procuring and installing the investments or, alternatively, offloading them. Let us for convenience express this investment cost function explicitly as:
(1.2) ( ) ( )kC i p i i� � � ,
where pk represents the price of capital units � possibly different for positive and negative investments, and the function ( )i the cost of undertaking the investments. There are generally found to be various and often quite substantial costs associated with undertaking investments. These include installment (or, as the case may be, removal) costs, various operation disturbance costs, negotiation costs etc. ( )i , which we for convenience refer to as the investment adjustment cost, comprises the totality of all these costs. In accordance with observed reality, the function ( )i is taken to be nonnegative
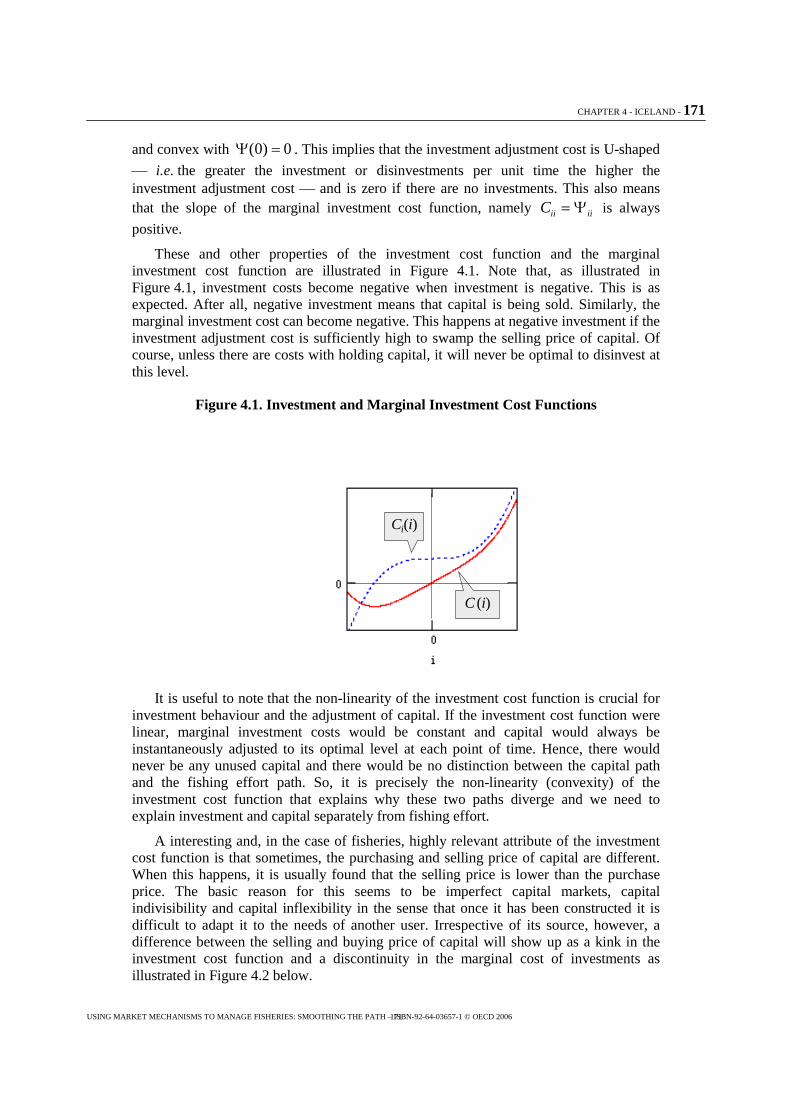
CHAPTER 4 - ICELAND - 171
USING MARKET MECHANISMS TO MANAGE FISHERIES: SMOOTHING THE PATH – ISBN-92-64-03657-1 © OECD 2006 171
and convex with (0) 0 � . This implies that the investment adjustment cost is U-shaped
� i.e. the greater the investment or disinvestments per unit time the higher the investment adjustment cost � and is zero if there are no investments. This also means that the slope of the marginal investment cost function, namely ii iiC � is always
positive.
These and other properties of the investment cost function and the marginal investment cost function are illustrated in Figure 4.1. Note that, as illustrated in Figure 4.1, investment costs become negative when investment is negative. This is as expected. After all, negative investment means that capital is being sold. Similarly, the marginal investment cost can become negative. This happens at negative investment if the investment adjustment cost is sufficiently high to swamp the selling price of capital. Of course, unless there are costs with holding capital, it will never be optimal to disinvest at this level.
Figure 4.1. Investment and Marginal Investment Cost Functions
Ci(i)
C (i)
Ci(i)
C (i)
Ci(i)
C (i)
It is useful to note that the non-linearity of the investment cost function is crucial for investment behaviour and the adjustment of capital. If the investment cost function were linear, marginal investment costs would be constant and capital would always be instantaneously adjusted to its optimal level at each point of time. Hence, there would never be any unused capital and there would be no distinction between the capital path and the fishing effort path. So, it is precisely the non-linearity (convexity) of the investment cost function that explains why these two paths diverge and we need to explain investment and capital separately from fishing effort.
A interesting and, in the case of fisheries, highly relevant attribute of the investment cost function is that sometimes, the purchasing and selling price of capital are different. When this happens, it is usually found that the selling price is lower than the purchase price. The basic reason for this seems to be imperfect capital markets, capital indivisibility and capital inflexibility in the sense that once it has been constructed it is difficult to adapt it to the needs of another user. Irrespective of its source, however, a difference between the selling and buying price of capital will show up as a kink in the investment cost function and a discontinuity in the marginal cost of investments as illustrated in Figure 4.2 below.
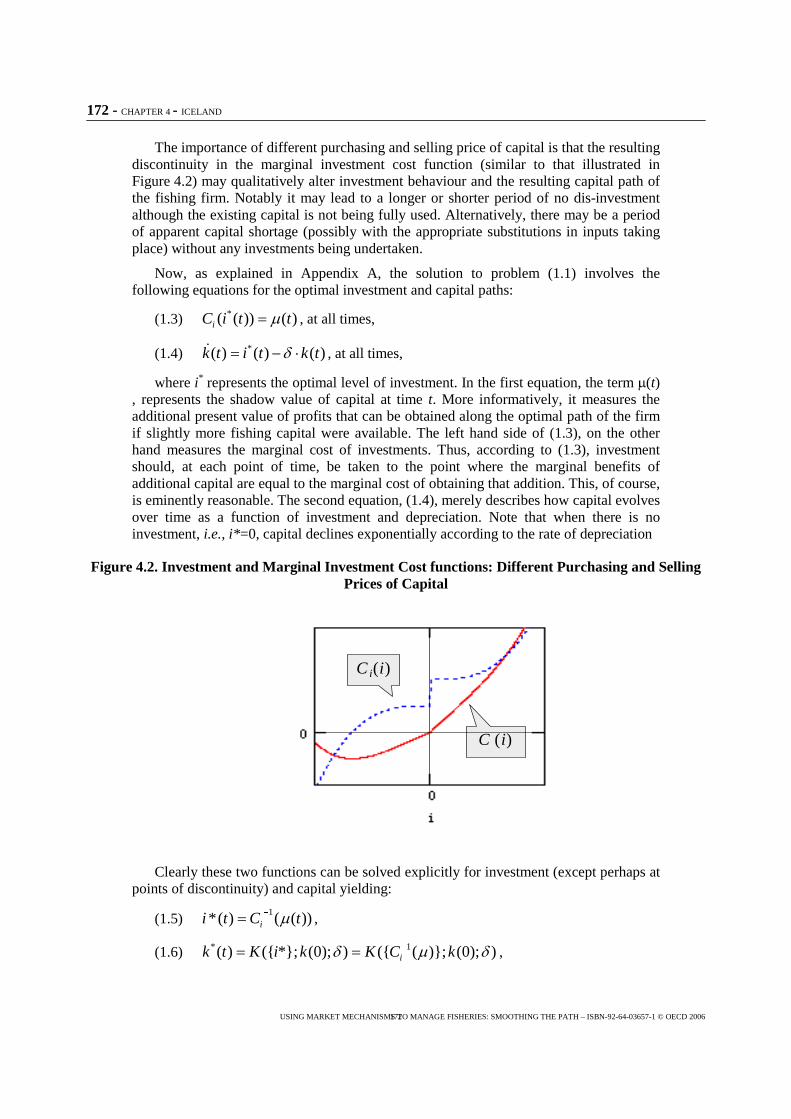
172 - CHAPTER 4 - ICELAND
USING MARKET MECHANISMS TO MANAGE FISHERIES: SMOOTHING THE PATH – ISBN-92-64-03657-1 © OECD 2006 172
The importance of different purchasing and selling price of capital is that the resulting discontinuity in the marginal investment cost function (similar to that illustrated in Figure 4.2) may qualitatively alter investment behaviour and the resulting capital path of the fishing firm. Notably it may lead to a longer or shorter period of no dis-investment although the existing capital is not being fully used. Alternatively, there may be a period of apparent capital shortage (possibly with the appropriate substitutions in inputs taking place) without any investments being undertaken.
Now, as explained in Appendix A, the solution to problem (1.1) involves the following equations for the optimal investment and capital paths:
(1.3) *( ( )) ( )iC i t t�� , at all times,
(1.4) *( ) ( ) ( )k t i t k t�� � �� , at all times,
where i* represents the optimal level of investment. In the first equation, the term (t) , represents the shadow value of capital at time t. More informatively, it measures the additional present value of profits that can be obtained along the optimal path of the firm if slightly more fishing capital were available. The left hand side of (1.3), on the other hand measures the marginal cost of investments. Thus, according to (1.3), investment should, at each point of time, be taken to the point where the marginal benefits of additional capital are equal to the marginal cost of obtaining that addition. This, of course, is eminently reasonable. The second equation, (1.4), merely describes how capital evolves over time as a function of investment and depreciation. Note that when there is no investment, i.e., i*=0, capital declines exponentially according to the rate of depreciation
Figure 4.2. Investment and Marginal Investment Cost functions: Different Purchasing and Selling Prices of Capital
C i(i)
C (i)
C i(i)
C (i)
Clearly these two functions can be solved explicitly for investment (except perhaps at points of discontinuity) and capital yielding:
(1.5) 1*( ) ( ( ))ii t C t��� ,
(1.6) * 1( ) ({ *}; (0); ) ({ ( )}; (0); )ik t K i k K C k� � ��� � ,
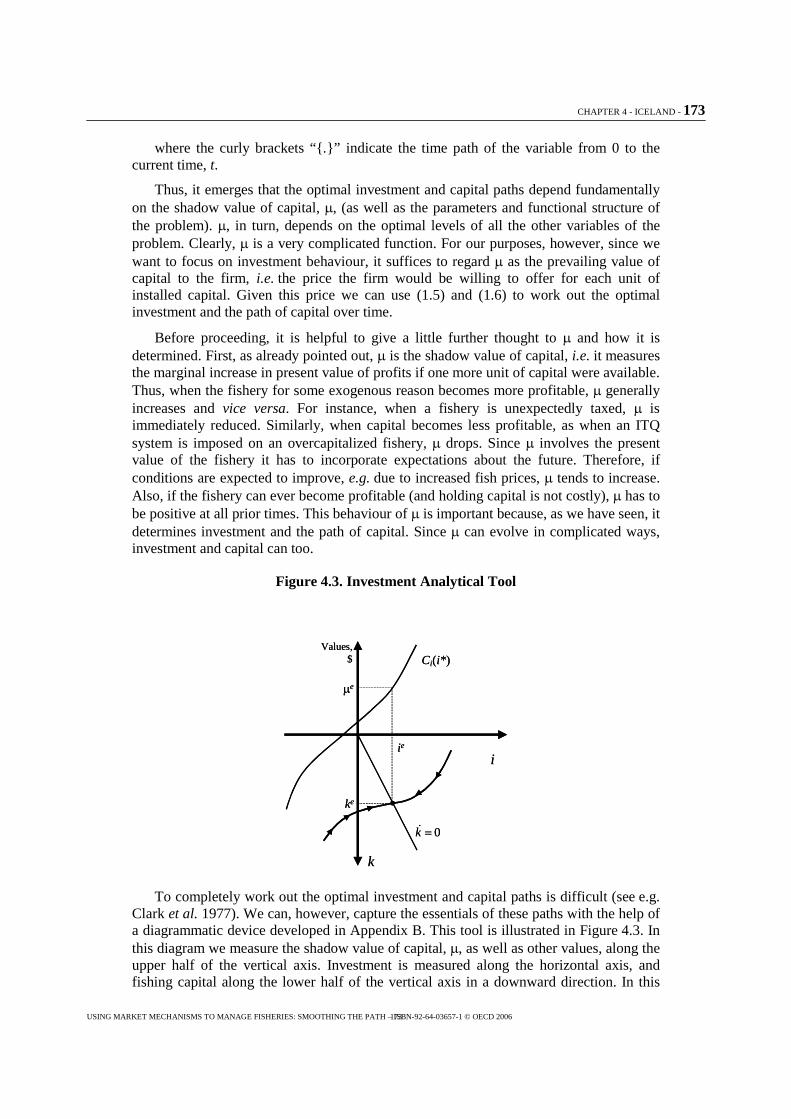
CHAPTER 4 - ICELAND - 173
USING MARKET MECHANISMS TO MANAGE FISHERIES: SMOOTHING THE PATH – ISBN-92-64-03657-1 © OECD 2006 173
where the curly brackets “{.}” indicate the time path of the variable from 0 to the current time, t.
Thus, it emerges that the optimal investment and capital paths depend fundamentally on the shadow value of capital, , (as well as the parameters and functional structure of the problem). , in turn, depends on the optimal levels of all the other variables of the problem. Clearly, is a very complicated function. For our purposes, however, since we want to focus on investment behaviour, it suffices to regard as the prevailing value of capital to the firm, i.e. the price the firm would be willing to offer for each unit of installed capital. Given this price we can use (1.5) and (1.6) to work out the optimal investment and the path of capital over time.
Before proceeding, it is helpful to give a little further thought to and how it is determined. First, as already pointed out, is the shadow value of capital, i.e. it measures the marginal increase in present value of profits if one more unit of capital were available. Thus, when the fishery for some exogenous reason becomes more profitable, generally increases and vice versa. For instance, when a fishery is unexpectedly taxed, is immediately reduced. Similarly, when capital becomes less profitable, as when an ITQ system is imposed on an overcapitalized fishery, drops. Since involves the present value of the fishery it has to incorporate expectations about the future. Therefore, if conditions are expected to improve, e.g. due to increased fish prices, tends to increase. Also, if the fishery can ever become profitable (and holding capital is not costly), has to be positive at all prior times. This behaviour of is important because, as we have seen, it determines investment and the path of capital. Since can evolve in complicated ways, investment and capital can too.
Figure 4.3. Investment Analytical Tool
i
Values,$ Ci(i*)
e
ie
k
0k ��
ke
i
Values,$ Ci(i*)
e
ie
k
0k ��
ke
To completely work out the optimal investment and capital paths is difficult (see e.g. Clark et al. 1977). We can, however, capture the essentials of these paths with the help of a diagrammatic device developed in Appendix B. This tool is illustrated in Figure 4.3. In this diagram we measure the shadow value of capital, , as well as other values, along the upper half of the vertical axis. Investment is measured along the horizontal axis, and fishing capital along the lower half of the vertical axis in a downward direction. In this
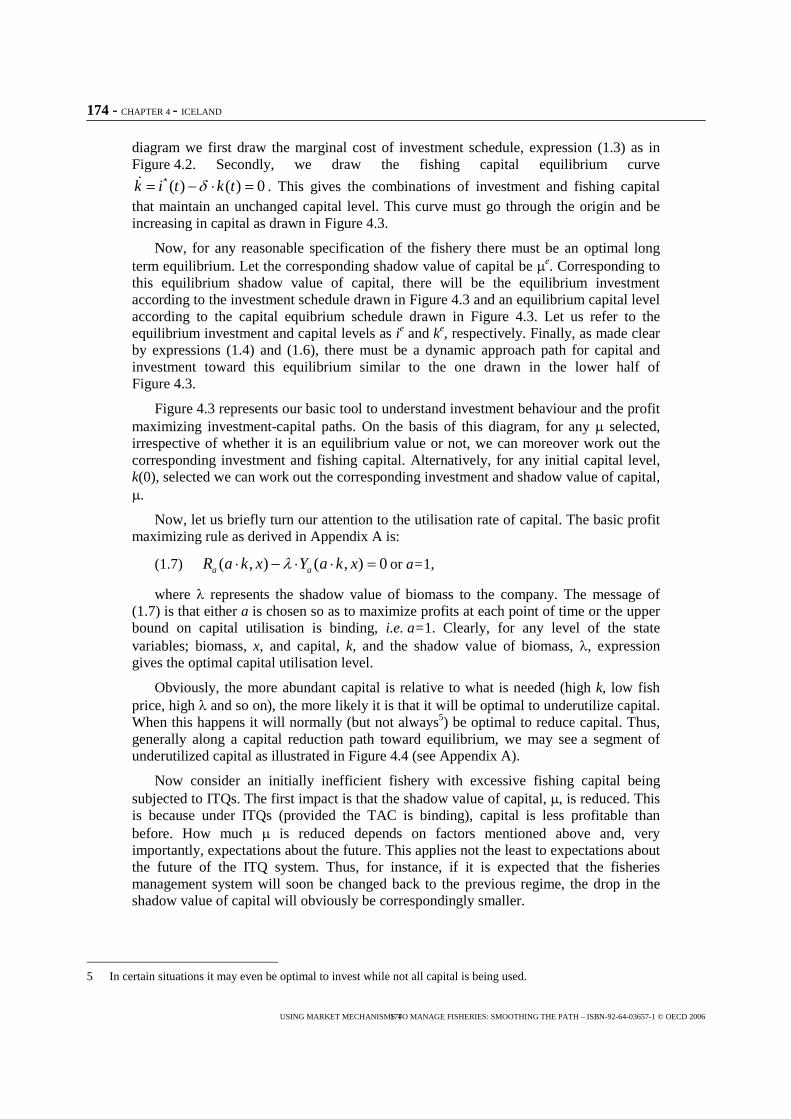
174 - CHAPTER 4 - ICELAND
USING MARKET MECHANISMS TO MANAGE FISHERIES: SMOOTHING THE PATH – ISBN-92-64-03657-1 © OECD 2006 174
diagram we first draw the marginal cost of investment schedule, expression (1.3) as in Figure 4.2. Secondly, we draw the fishing capital equilibrium curve
*( ) ( ) 0k i t k t�� � � �� . This gives the combinations of investment and fishing capital that maintain an unchanged capital level. This curve must go through the origin and be increasing in capital as drawn in Figure 4.3.
Now, for any reasonable specification of the fishery there must be an optimal long term equilibrium. Let the corresponding shadow value of capital be e. Corresponding to this equilibrium shadow value of capital, there will be the equilibrium investment according to the investment schedule drawn in Figure 4.3 and an equilibrium capital level according to the capital equibrium schedule drawn in Figure 4.3. Let us refer to the equilibrium investment and capital levels as ie and ke, respectively. Finally, as made clear by expressions (1.4) and (1.6), there must be a dynamic approach path for capital and investment toward this equilibrium similar to the one drawn in the lower half of Figure 4.3.
Figure 4.3 represents our basic tool to understand investment behaviour and the profit maximizing investment-capital paths. On the basis of this diagram, for any selected, irrespective of whether it is an equilibrium value or not, we can moreover work out the corresponding investment and fishing capital. Alternatively, for any initial capital level, k(0), selected we can work out the corresponding investment and shadow value of capital, .
Now, let us briefly turn our attention to the utilisation rate of capital. The basic profit maximizing rule as derived in Appendix A is:
(1.7) ( , ) ( , ) 0a aR a k x Y a k x�� � � � � or a=1,
where � represents the shadow value of biomass to the company. The message of (1.7) is that either a is chosen so as to maximize profits at each point of time or the upper bound on capital utilisation is binding, i.e. a=1. Clearly, for any level of the state variables; biomass, x, and capital, k, and the shadow value of biomass, �, expression gives the optimal capital utilisation level.
Obviously, the more abundant capital is relative to what is needed (high k, low fish price, high � and so on), the more likely it is that it will be optimal to underutilize capital. When this happens it will normally (but not always5) be optimal to reduce capital. Thus, generally along a capital reduction path toward equilibrium, we may see a segment of underutilized capital as illustrated in Figure 4.4 (see Appendix A).
Now consider an initially inefficient fishery with excessive fishing capital being subjected to ITQs. The first impact is that the shadow value of capital, , is reduced. This is because under ITQs (provided the TAC is binding), capital is less profitable than before. How much is reduced depends on factors mentioned above and, very importantly, expectations about the future. This applies not the least to expectations about the future of the ITQ system. Thus, for instance, if it is expected that the fisheries management system will soon be changed back to the previous regime, the drop in the shadow value of capital will obviously be correspondingly smaller.
5 In certain situations it may even be optimal to invest while not all capital is being used.
CHAPTER 4 – ICELAND – 175
USING MARKET MECHANISMS TO MANAGE FISHERIES: SMOOTHING THE PATH – ISBN-92-64-03657-1 © OECD 2006
Figure 4.4. Capital Utilisation along Figure 4.5. Introduction of ITQs: An Example Capital Reduction Paths of Possible Investment-Capital Paths
i
Values,$
Ci(i*)
�enew
ienew
k0k �
�
kenew
�eold
keold
ieold
i
Values,$
Ci(i*)
�enew
ienew
k0k �
�
kenew
�eold
keold
ieold
From Figure 4.3, it can immediately be deduced that a drop in the shadow value of capital will immediately lead to less investment (unless of course in the unlikely case that the discontinuity in Figure 4.2 applies and investment happens to be zero). Moreover, if the new system is expected to be lasting, there will be a new equilibrium level of the shadow value of biomass, investment and capital as illustrated in Figure 4.5. As a result the optimal approach paths to equilibrium also shift. Now, if we assume that capital was initially in equilibrium, the new investment-capital path is similar to the one indicated by the heavy curve in Figure 4.5. Thus, we see that the impact is an immediate drop in investment. In fact, as in Figure 4.5 it may even become negative. As a result capital starts to decline toward the new equilibrium level, initially at a relatively fast rate and then more slowly, as investment increases.
This is the story, if the fishing firms immediately understand all the implications of the ITQ system. However, if that is not so; i.e. because industry participants are only slowly learning about the system or skeptical of its permanence, e will not immediately settle down to its long term value. It will move over time. It may even fluctuate. As a result the investment capital path may be much more irregular than depicted in Figure 4.5. The same applies if the fishery is subject to fluctuating stocks and prices, which, of course, is always the case. Nevertheless, over time, the broad trend of declining fishing capital should be observed. Moreover, one can confidently expect an initial drop in fishing capital investment. Apart from this, the path of investment and capital is subject to the various complicating factors discussed above and, therefore cannot be predicted with a reasonable level of confidence.
Capital,k
Utilizationof capital,
a
ke
1
i>0 i<0
Unused capacity
Capital,k
Utilizationof capital,
a
ke
1
i>0 i<0
Unused capacity
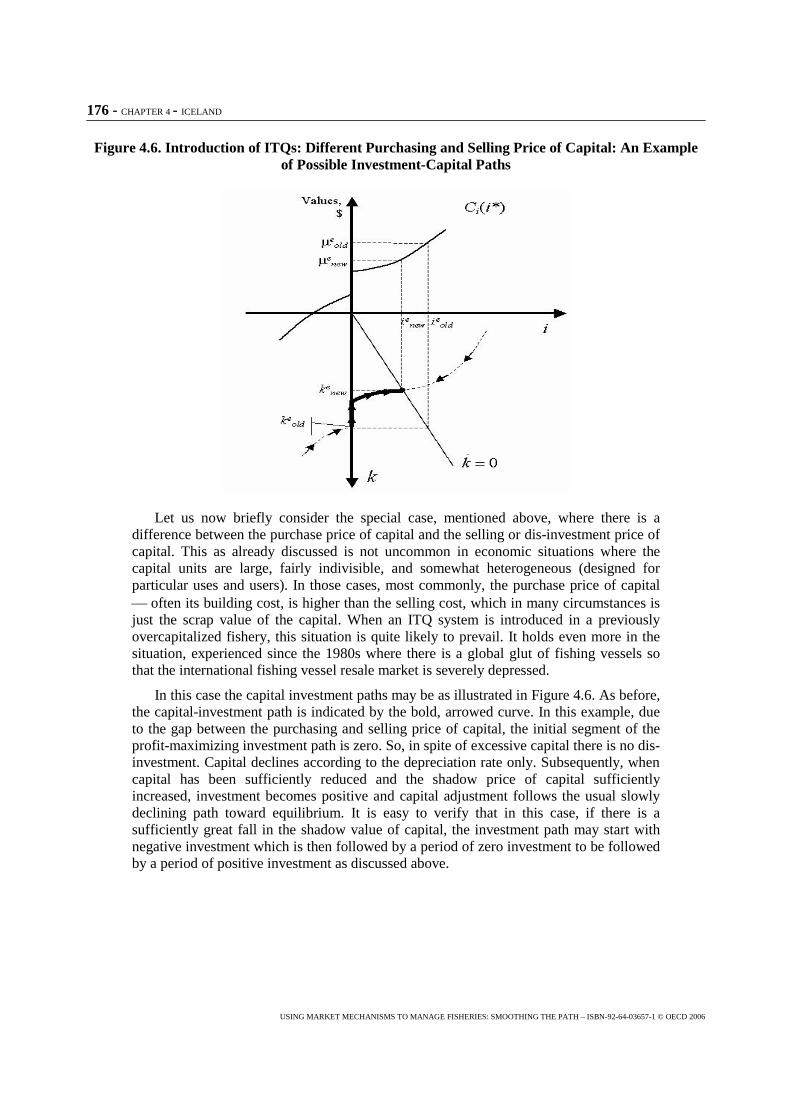
176 - CHAPTER 4 - ICELAND
USING MARKET MECHANISMS TO MANAGE FISHERIES: SMOOTHING THE PATH – ISBN-92-64-03657-1 © OECD 2006
Figure 4.6. Introduction of ITQs: Different Purchasing and Selling Price of Capital: An Example of Possible Investment-Capital Paths
Let us now briefly consider the special case, mentioned above, where there is a difference between the purchase price of capital and the selling or dis-investment price of capital. This as already discussed is not uncommon in economic situations where the capital units are large, fairly indivisible, and somewhat heterogeneous (designed for particular uses and users). In those cases, most commonly, the purchase price of capital � often its building cost, is higher than the selling cost, which in many circumstances is just the scrap value of the capital. When an ITQ system is introduced in a previously overcapitalized fishery, this situation is quite likely to prevail. It holds even more in the situation, experienced since the 1980s where there is a global glut of fishing vessels so that the international fishing vessel resale market is severely depressed.
In this case the capital investment paths may be as illustrated in Figure 4.6. As before, the capital-investment path is indicated by the bold, arrowed curve. In this example, due to the gap between the purchasing and selling price of capital, the initial segment of the profit-maximizing investment path is zero. So, in spite of excessive capital there is no dis-investment. Capital declines according to the depreciation rate only. Subsequently, when capital has been sufficiently reduced and the shadow price of capital sufficiently increased, investment becomes positive and capital adjustment follows the usual slowly declining path toward equilibrium. It is easy to verify that in this case, if there is a sufficiently great fall in the shadow value of capital, the investment path may start with negative investment which is then followed by a period of zero investment to be followed by a period of positive investment as discussed above.
CHAPTER 4 – ICELAND – 177
USING MARKET MECHANISMS TO MANAGE FISHERIES: SMOOTHING THE PATH – ISBN-92-64-03657-1 © OECD 2006
The above analysis informs us about few general characteristics of profit maximizing investment paths in fishing capital and the resulting fishing capital paths:
1. When out of equilibrium, fishing capital is generally not adjusted immediately to its equilibrium value.
2. The length and form of the optimal investment-capital adjustment path depend on:
3. The initial capital level (relative to the equilibrium one),
4. The shape of the marginal investment schedule,
5. The rate of capital depreciation and
6. The shadow value of capital, , which as we have already discussed depends on all the aspects of the problem including future expectations.
7. Along an adjustment path to a lower fishing capital level it may well be that the utilisation rate of capital falls well below unity.
8. Without knowing the particulars of the situation it is not possible to assert much more about the optimal path investment-capital path.
9. The general attributes of the optimal investment-capital path when an ITQ is introduced on a previously overexploited fishery may be inferred from Figures 4.5 and 4.6
� Capital generally follows a declining path
� It may well be that along this path, especially early on, that capital is less than fully utilized.
� If there is a significant difference between purchasing and selling price of capital, there may be no dis-investment for a substantial period, even when capital is highly excessive.
� For various reasons of empirical complexity not accounted for in the theory the actual path followed may deviate substantially form the path illustrated in Figures 4.5 and 4.6.
Finally, let us reiterate that the above analysis only describes capital paths, investment and capital utilisation behaviour in a very simplified framework. Real fisheries are much more complex. Among other things they are characterized by heterogeneous capital with the result that investment may take place in certain types of capital while there are disinvestments in other types. Also, real fishing industries typically have the option of pursuing several different fisheries. Thus, otherwise redundant fishing capital may be simply shifted to other, possibly less managed fisheries, rather than being scrapped. Finally expectations about future fisheries management, stocks, prices and soon may radically alter what is optimal for the firms compared to what is found above. For these reasons and others, actual investment and fishing capital paths may well diverge radically from the theoretical predictions of the simple model outlined above. Nevertheless, if the above analysis is reasonably correct, one expects that the broad outlines of the above theoretical predictions will apply and emerge as an average trend over many different fisheries.
178 - CHAPTER 4 - ICELAND
USING MARKET MECHANISMS TO MANAGE FISHERIES: SMOOTHING THE PATH – ISBN-92-64-03657-1 © OECD 2006
2. Experience in Iceland
We now turn our attention to the response of the Icelandic fishing fleet to the introduction of ITQs. In this report we will primarily consider the fleet in terms of vessel numbers. This is clearly a limited view but has nevertheless certain appealing properties. First, the evolution of the fleet in terms of value and tonnage and its response to ITQs has already been described in Anonymous 2004. Second, alternative measures such as fleet tonnage and fleet horsepower are subject to a number of imprecisions and difficulties. One is that it is difficult to obtain a consistent times series for these variables over any length of time. Third, for deep-sea trawlers and, in particular, the undecked fleet, vessels are fairly homogeneous. Therefore, for these fleet segments, vessel numbers provide a good approximation to fleet developments, at least in the relatively short run. Fourth, fixed costs are a very substantial part of total fishing costs. Fixed costs are associated with each vessel and thus, for any given vessel class, depend more on vessel numbers than they do on vessel tonnage or horsepower. Last but not least, an important component of the current study is the number of vessels counted in the fleet (ship registry) but inactive in the sense that they don´t have catches. Measures of the inactive part of the fleet are most easily obtained in terms of numbers. In fact, due to the peculiarities of the Icelandic fleet statistics, it would be extremely difficult to obtain this measure in terms of tonnage or power of the inactive vessels.6
We consider two main fleet segments; (i) the decked fleet and (ii) the undecked fleet. The decked fleet generally consists of vessels above 10 GRT (corresponding to approximately 10 m. in length). Most of these vessels, however, are much larger, the average being some 150 GRT (and about 30 m. in length). The decked fleet can be divided into two distinct sub-fleets; (a) the deep-sea trawlers, which are fairly homogenous in size and type, and (b) general purpose fishing vessels which many different types of vessels.
The undecked fleet consists of small fishing vessels under 10 GRT although most are around 6 GRT (and 7 m in length). These vessels are quite homogenous in terms of type, technology, crew size and the fishery they pursue. In spite of their relative homogeneity, vessels in this fleet have over the years been operating under a variety of fisheries management systems, including ITQs. Moreover, some of these systems have even been running simultaneously for different parts of this fleet. Thus, the experience of this fleet provides natural experiments of the impact of ITQs compared to other fisheries management systems.
The Decked Fleet
This fleet covers a wide range of vessel types, ranging from some 10 GRT to over 2000 GRT, employing several types of fishing gear (bottom trawl, mid-water trawl, long-line, gill nets, purse seine, shrimp trawl, molluscs dredges etc.) and pursuing a high number of different fisheries including molluscs (scallops, ocean quohog), crustaceans (shrimp and nephrops), pelagic species (herring, blue whiting and capelin) and numerous demersal species (incl. cod, haddock, saithe, redfish, Greenland halibut and plaice). Thus, this fleet as a whole is quite heterogeneous. Within this fleet, however, there is an important, fairly homogenous subfleet, the deep-sea trawlers. These are all large stern
6 It appears that the vessel activity data files are not compatible with the vessel registry data files.
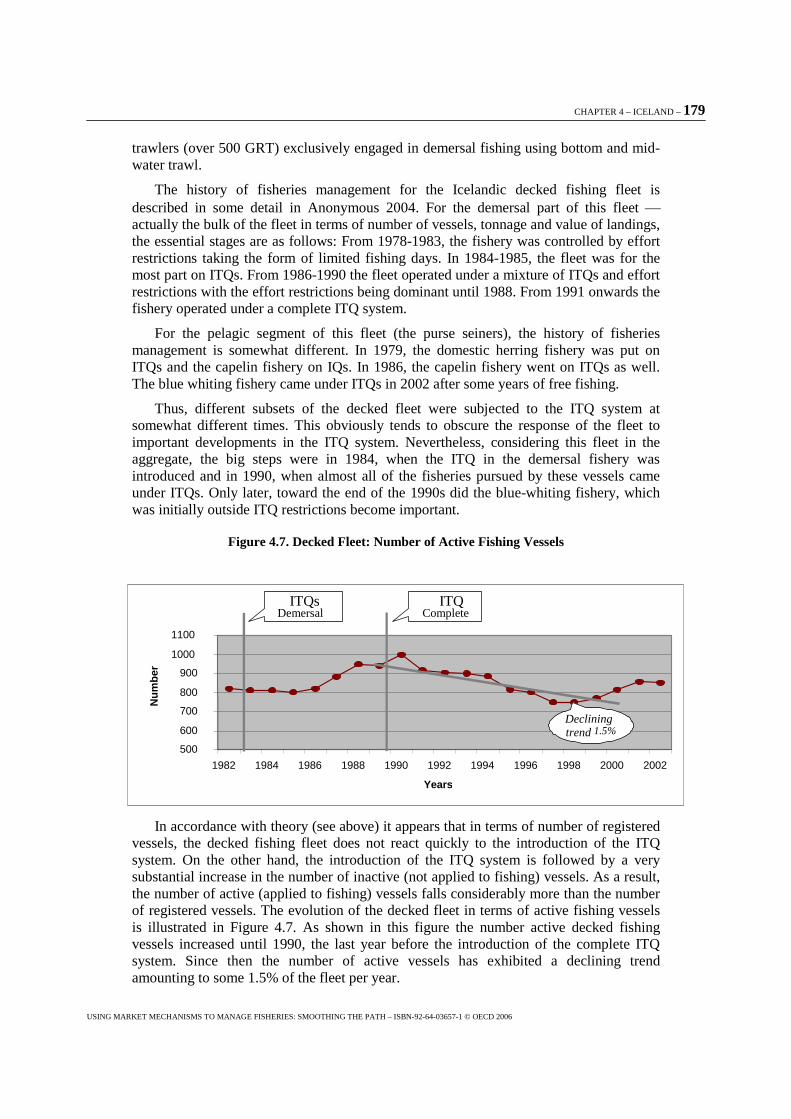
CHAPTER 4 – ICELAND – 179
USING MARKET MECHANISMS TO MANAGE FISHERIES: SMOOTHING THE PATH – ISBN-92-64-03657-1 © OECD 2006
trawlers (over 500 GRT) exclusively engaged in demersal fishing using bottom and mid-water trawl.
The history of fisheries management for the Icelandic decked fishing fleet is described in some detail in Anonymous 2004. For the demersal part of this fleet � actually the bulk of the fleet in terms of number of vessels, tonnage and value of landings, the essential stages are as follows: From 1978-1983, the fishery was controlled by effort restrictions taking the form of limited fishing days. In 1984-1985, the fleet was for the most part on ITQs. From 1986-1990 the fleet operated under a mixture of ITQs and effort restrictions with the effort restrictions being dominant until 1988. From 1991 onwards the fishery operated under a complete ITQ system.
For the pelagic segment of this fleet (the purse seiners), the history of fisheries management is somewhat different. In 1979, the domestic herring fishery was put on ITQs and the capelin fishery on IQs. In 1986, the capelin fishery went on ITQs as well. The blue whiting fishery came under ITQs in 2002 after some years of free fishing.
Thus, different subsets of the decked fleet were subjected to the ITQ system at somewhat different times. This obviously tends to obscure the response of the fleet to important developments in the ITQ system. Nevertheless, considering this fleet in the aggregate, the big steps were in 1984, when the ITQ in the demersal fishery was introduced and in 1990, when almost all of the fisheries pursued by these vessels came under ITQs. Only later, toward the end of the 1990s did the blue-whiting fishery, which was initially outside ITQ restrictions become important.
Figure 4.7. Decked Fleet: Number of Active Fishing Vessels
In accordance with theory (see above) it appears that in terms of number of registered vessels, the decked fishing fleet does not react quickly to the introduction of the ITQ system. On the other hand, the introduction of the ITQ system is followed by a very substantial increase in the number of inactive (not applied to fishing) vessels. As a result, the number of active (applied to fishing) vessels falls considerably more than the number of registered vessels. The evolution of the decked fleet in terms of active fishing vessels is illustrated in Figure 4.7. As shown in this figure the number active decked fishing vessels increased until 1990, the last year before the introduction of the complete ITQ system. Since then the number of active vessels has exhibited a declining trend amounting to some 1.5% of the fleet per year.
ITQs Demersal
ITQ Complete
Declining trend,
500 600 700 800 900
1000 1100
1982 1984 1986 1988 1990 1992 1994 1996 1998 2000 2002 Years
ITQs Demersal
ITQ Complete
Declining trend 1.5%
Nu
mb
er
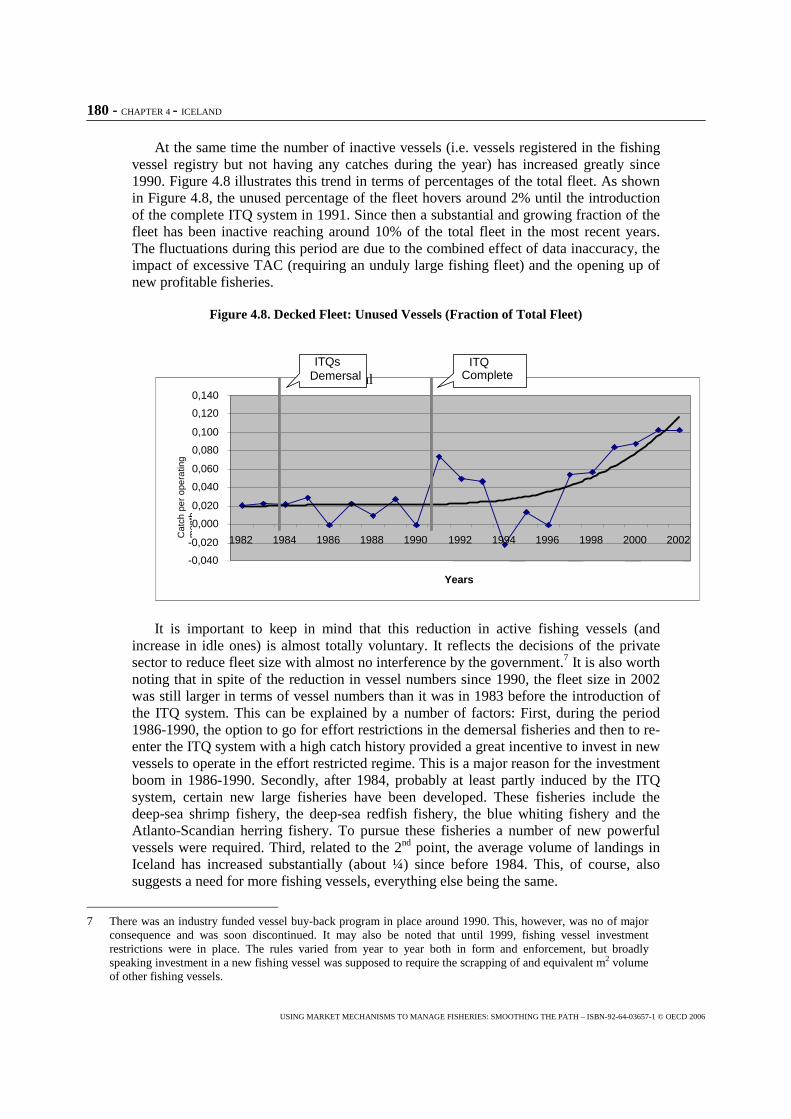
180 - CHAPTER 4 - ICELAND
USING MARKET MECHANISMS TO MANAGE FISHERIES: SMOOTHING THE PATH – ISBN-92-64-03657-1 © OECD 2006
At the same time the number of inactive vessels (i.e. vessels registered in the fishing vessel registry but not having any catches during the year) has increased greatly since 1990. Figure 4.8 illustrates this trend in terms of percentages of the total fleet. As shown in Figure 4.8, the unused percentage of the fleet hovers around 2% until the introduction of the complete ITQ system in 1991. Since then a substantial and growing fraction of the fleet has been inactive reaching around 10% of the total fleet in the most recent years. The fluctuations during this period are due to the combined effect of data inaccuracy, the impact of excessive TAC (requiring an unduly large fishing fleet) and the opening up of new profitable fisheries.
Figure 4.8. Decked Fleet: Unused Vessels (Fraction of Total Fleet)
It is important to keep in mind that this reduction in active fishing vessels (and increase in idle ones) is almost totally voluntary. It reflects the decisions of the private sector to reduce fleet size with almost no interference by the government.7 It is also worth noting that in spite of the reduction in vessel numbers since 1990, the fleet size in 2002 was still larger in terms of vessel numbers than it was in 1983 before the introduction of the ITQ system. This can be explained by a number of factors: First, during the period 1986-1990, the option to go for effort restrictions in the demersal fisheries and then to re-enter the ITQ system with a high catch history provided a great incentive to invest in new vessels to operate in the effort restricted regime. This is a major reason for the investment boom in 1986-1990. Secondly, after 1984, probably at least partly induced by the ITQ system, certain new large fisheries have been developed. These fisheries include the deep-sea shrimp fishery, the deep-sea redfish fishery, the blue whiting fishery and the Atlanto-Scandian herring fishery. To pursue these fisheries a number of new powerful vessels were required. Third, related to the 2nd point, the average volume of landings in Iceland has increased substantially (about ¼) since before 1984. This, of course, also suggests a need for more fishing vessels, everything else being the same.
7 There was an industry funded vessel buy-back program in place around 1990. This, however, was no of major consequence and was soon discontinued. It may also be noted that until 1999, fishing vessel investment restrictions were in place. The rules varied from year to year both in form and enforcement, but broadly speaking investment in a new fishing vessel was supposed to require the scrapping of and equivalent m2 volume of other fishing vessels.
-0,040 -0,020 0,000 0,020 0,040 0,060 0,080 0,100 0,120 0,140
1982 1984 1986 1988 1990 1992 1994 1996 1998 2000 2002
Years
ITQs Demersal
ITQ Complete Demersal ITQ
Complete
Cat
ch p
er o
pera
ting
mon
th
ITQs
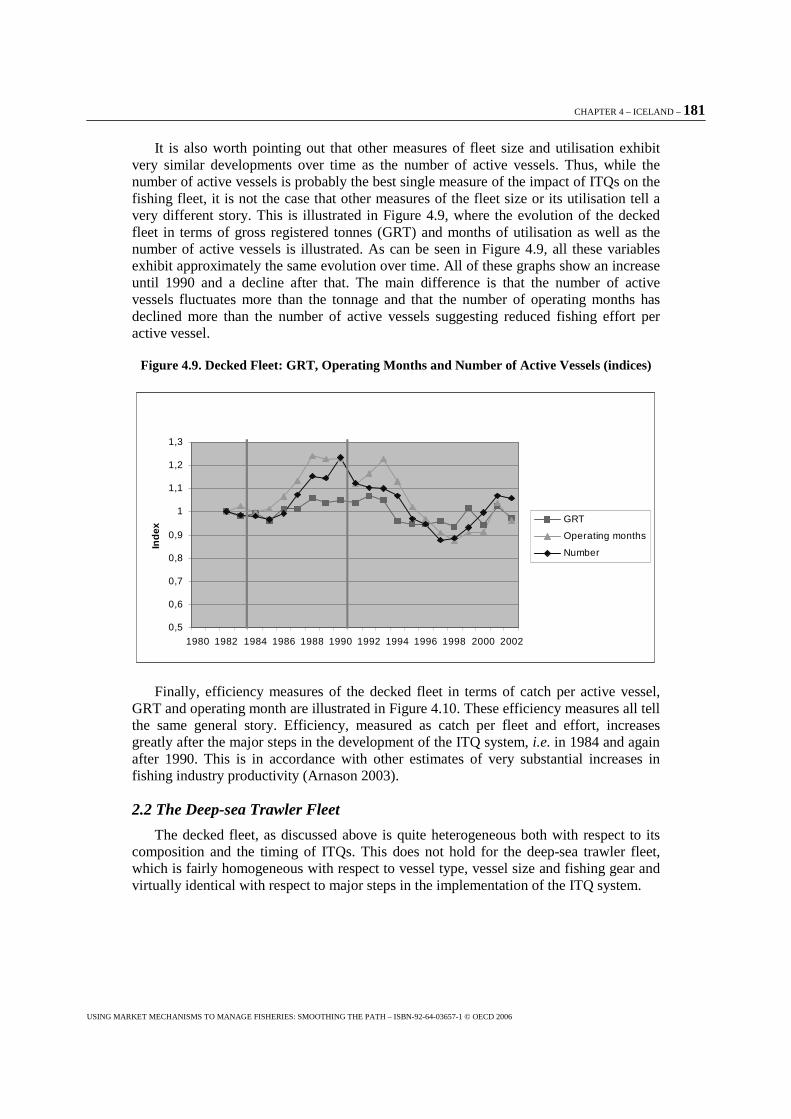
CHAPTER 4 – ICELAND – 181
USING MARKET MECHANISMS TO MANAGE FISHERIES: SMOOTHING THE PATH – ISBN-92-64-03657-1 © OECD 2006
It is also worth pointing out that other measures of fleet size and utilisation exhibit very similar developments over time as the number of active vessels. Thus, while the number of active vessels is probably the best single measure of the impact of ITQs on the fishing fleet, it is not the case that other measures of the fleet size or its utilisation tell a very different story. This is illustrated in Figure 4.9, where the evolution of the decked fleet in terms of gross registered tonnes (GRT) and months of utilisation as well as the number of active vessels is illustrated. As can be seen in Figure 4.9, all these variables exhibit approximately the same evolution over time. All of these graphs show an increase until 1990 and a decline after that. The main difference is that the number of active vessels fluctuates more than the tonnage and that the number of operating months has declined more than the number of active vessels suggesting reduced fishing effort per active vessel.
Figure 4.9. Decked Fleet: GRT, Operating Months and Number of Active Vessels (indices)
0,5
0,6
0,7
0,8
0,9
1
1,1
1,2
1,3
1980 1982 1984 1986 1988 1990 1992 1994 1996 1998 2000 2002
Ind
ex
GRT
Operating months
Number
0,5
0,6
0,7
0,8
0,9
1
1,1
1,2
1,3
1980 1982 1984 1986 1988 1990 1992 1994 1996 1998 2000 2002
Ind
ex
GRT
Operating months
Number
Finally, efficiency measures of the decked fleet in terms of catch per active vessel, GRT and operating month are illustrated in Figure 4.10. These efficiency measures all tell the same general story. Efficiency, measured as catch per fleet and effort, increases greatly after the major steps in the development of the ITQ system, i.e. in 1984 and again after 1990. This is in accordance with other estimates of very substantial increases in fishing industry productivity (Arnason 2003).
2.2 The Deep-sea Trawler Fleet
The decked fleet, as discussed above is quite heterogeneous both with respect to its composition and the timing of ITQs. This does not hold for the deep-sea trawler fleet, which is fairly homogeneous with respect to vessel type, vessel size and fishing gear and virtually identical with respect to major steps in the implementation of the ITQ system.
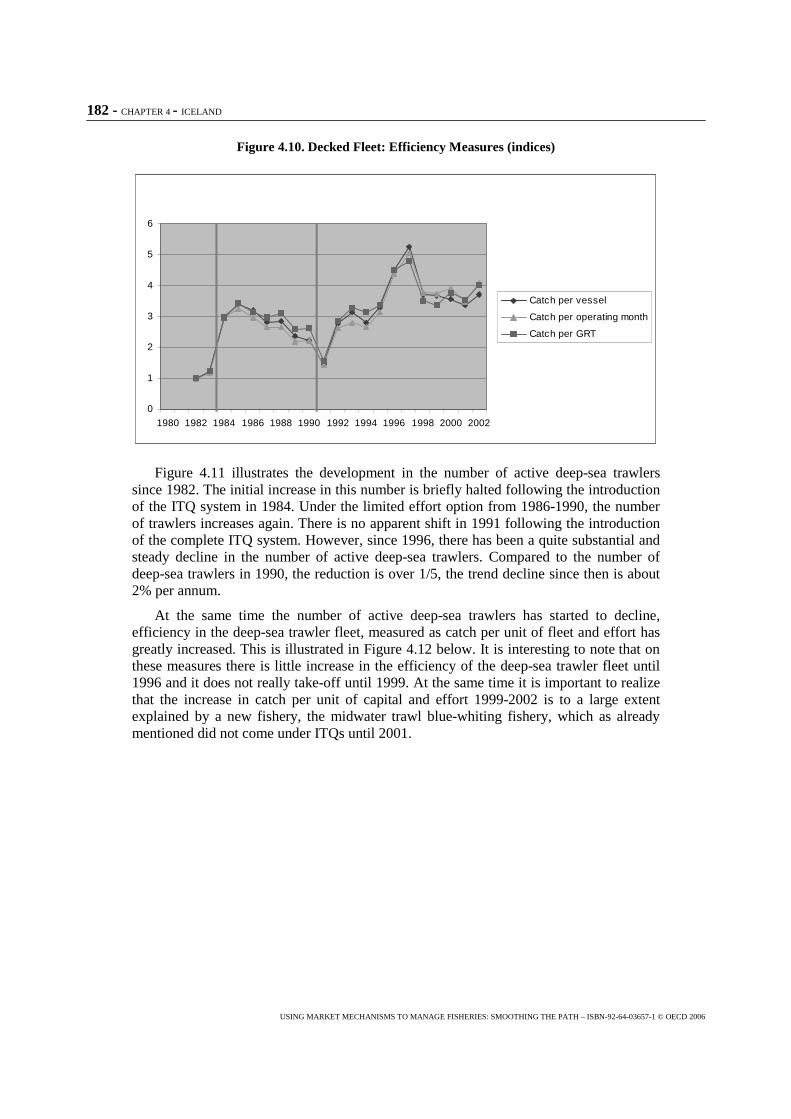
182 - CHAPTER 4 - ICELAND
USING MARKET MECHANISMS TO MANAGE FISHERIES: SMOOTHING THE PATH – ISBN-92-64-03657-1 © OECD 2006
Figure 4.10. Decked Fleet: Efficiency Measures (indices)
0
1
2
3
4
5
6
1980 1982 1984 1986 1988 1990 1992 1994 1996 1998 2000 2002
Catch per vessel
Catch per operating month
Catch per GRT
0
1
2
3
4
5
6
1980 1982 1984 1986 1988 1990 1992 1994 1996 1998 2000 2002
Catch per vessel
Catch per operating month
Catch per GRT
Figure 4.11 illustrates the development in the number of active deep-sea trawlers since 1982. The initial increase in this number is briefly halted following the introduction of the ITQ system in 1984. Under the limited effort option from 1986-1990, the number of trawlers increases again. There is no apparent shift in 1991 following the introduction of the complete ITQ system. However, since 1996, there has been a quite substantial and steady decline in the number of active deep-sea trawlers. Compared to the number of deep-sea trawlers in 1990, the reduction is over 1/5, the trend decline since then is about 2% per annum.
At the same time the number of active deep-sea trawlers has started to decline, efficiency in the deep-sea trawler fleet, measured as catch per unit of fleet and effort has greatly increased. This is illustrated in Figure 4.12 below. It is interesting to note that on these measures there is little increase in the efficiency of the deep-sea trawler fleet until 1996 and it does not really take-off until 1999. At the same time it is important to realize that the increase in catch per unit of capital and effort 1999-2002 is to a large extent explained by a new fishery, the midwater trawl blue-whiting fishery, which as already mentioned did not come under ITQs until 2001.
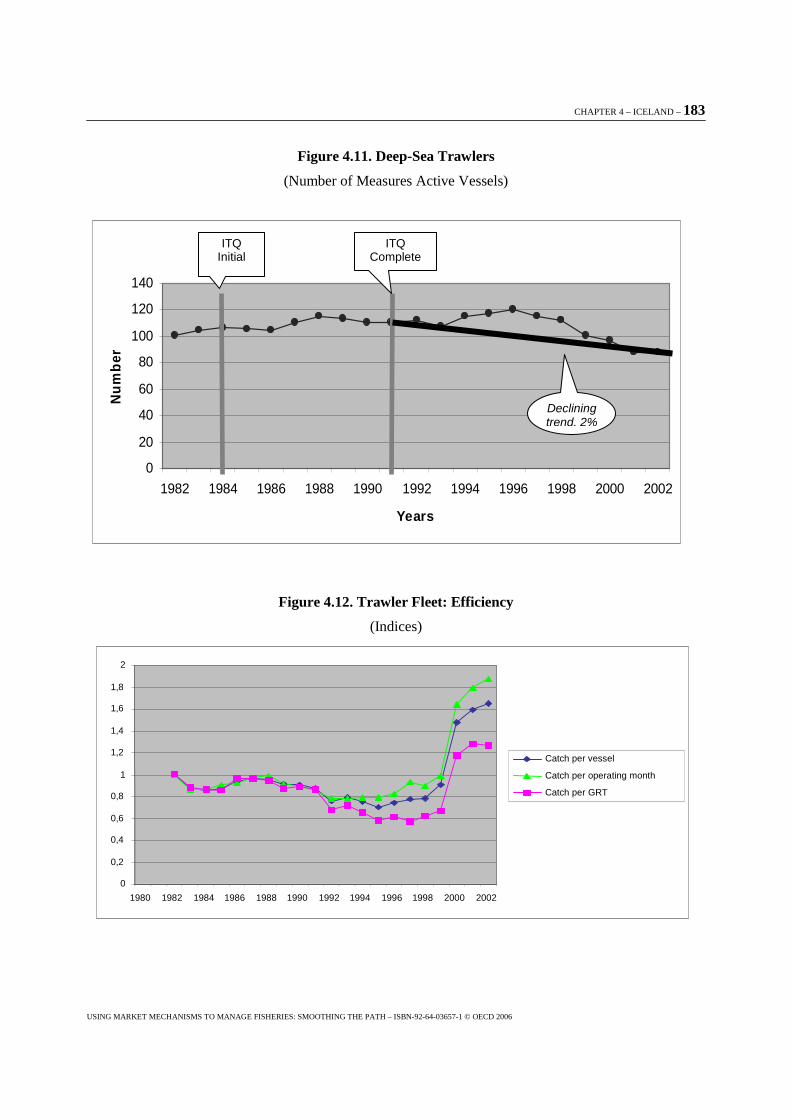
CHAPTER 4 – ICELAND – 183
USING MARKET MECHANISMS TO MANAGE FISHERIES: SMOOTHING THE PATH – ISBN-92-64-03657-1 © OECD 2006
Figure 4.11. Deep-Sea Trawlers
(Number of Measures Active Vessels)
Figure 4.12. Trawler Fleet: Efficiency
(Indices)
0
0,2
0,4
0,6
0,8
1
1,2
1,4
1,6
1,8
2
1980 1982 1984 1986 1988 1990 1992 1994 1996 1998 2000 2002
Catch per vessel Catch per operating month Catch per GRT
0
20
40
60
80
100
120
140
1982 1984 1986 1988 1990 1992 1994 1996 1998 2000 2002
Years
Nu
mb
er
ITQ Initial
ITQ Complete
Declining trend, 2%
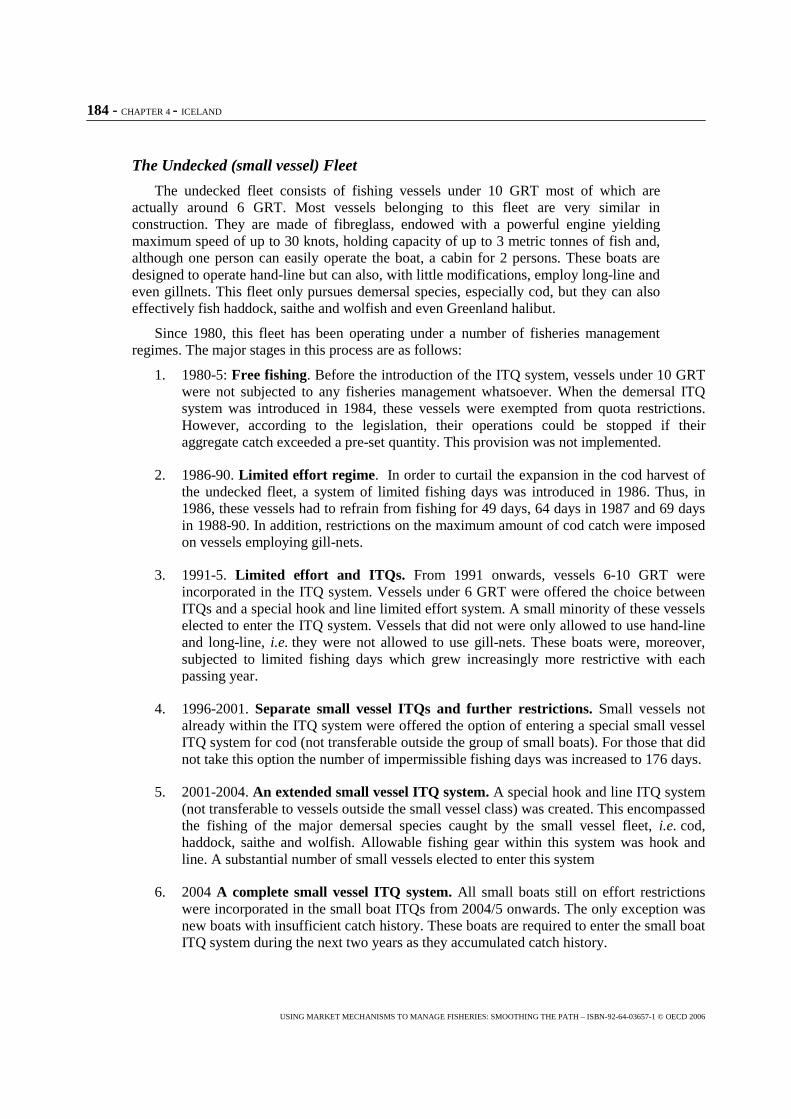
184 - CHAPTER 4 - ICELAND
USING MARKET MECHANISMS TO MANAGE FISHERIES: SMOOTHING THE PATH – ISBN-92-64-03657-1 © OECD 2006
The Undecked (small vessel) Fleet
The undecked fleet consists of fishing vessels under 10 GRT most of which are actually around 6 GRT. Most vessels belonging to this fleet are very similar in construction. They are made of fibreglass, endowed with a powerful engine yielding maximum speed of up to 30 knots, holding capacity of up to 3 metric tonnes of fish and, although one person can easily operate the boat, a cabin for 2 persons. These boats are designed to operate hand-line but can also, with little modifications, employ long-line and even gillnets. This fleet only pursues demersal species, especially cod, but they can also effectively fish haddock, saithe and wolfish and even Greenland halibut.
Since 1980, this fleet has been operating under a number of fisheries management regimes. The major stages in this process are as follows:
1. 1980-5: Free fishing. Before the introduction of the ITQ system, vessels under 10 GRT were not subjected to any fisheries management whatsoever. When the demersal ITQ system was introduced in 1984, these vessels were exempted from quota restrictions. However, according to the legislation, their operations could be stopped if their aggregate catch exceeded a pre-set quantity. This provision was not implemented.
2. 1986-90. Limited effort regime. In order to curtail the expansion in the cod harvest of the undecked fleet, a system of limited fishing days was introduced in 1986. Thus, in 1986, these vessels had to refrain from fishing for 49 days, 64 days in 1987 and 69 days in 1988-90. In addition, restrictions on the maximum amount of cod catch were imposed on vessels employing gill-nets.
3. 1991-5. Limited effort and ITQs. From 1991 onwards, vessels 6-10 GRT were incorporated in the ITQ system. Vessels under 6 GRT were offered the choice between ITQs and a special hook and line limited effort system. A small minority of these vessels elected to enter the ITQ system. Vessels that did not were only allowed to use hand-line and long-line, i.e. they were not allowed to use gill-nets. These boats were, moreover, subjected to limited fishing days which grew increasingly more restrictive with each passing year.
4. 1996-2001. Separate small vessel ITQs and further restrictions. Small vessels not already within the ITQ system were offered the option of entering a special small vessel ITQ system for cod (not transferable outside the group of small boats). For those that did not take this option the number of impermissible fishing days was increased to 176 days.
5. 2001-2004. An extended small vessel ITQ system. A special hook and line ITQ system (not transferable to vessels outside the small vessel class) was created. This encompassed the fishing of the major demersal species caught by the small vessel fleet, i.e. cod, haddock, saithe and wolfish. Allowable fishing gear within this system was hook and line. A substantial number of small vessels elected to enter this system
6. 2004 A complete small vessel ITQ system. All small boats still on effort restrictions were incorporated in the small boat ITQs from 2004/5 onwards. The only exception was new boats with insufficient catch history. These boats are required to enter the small boat ITQ system during the next two years as they accumulated catch history.
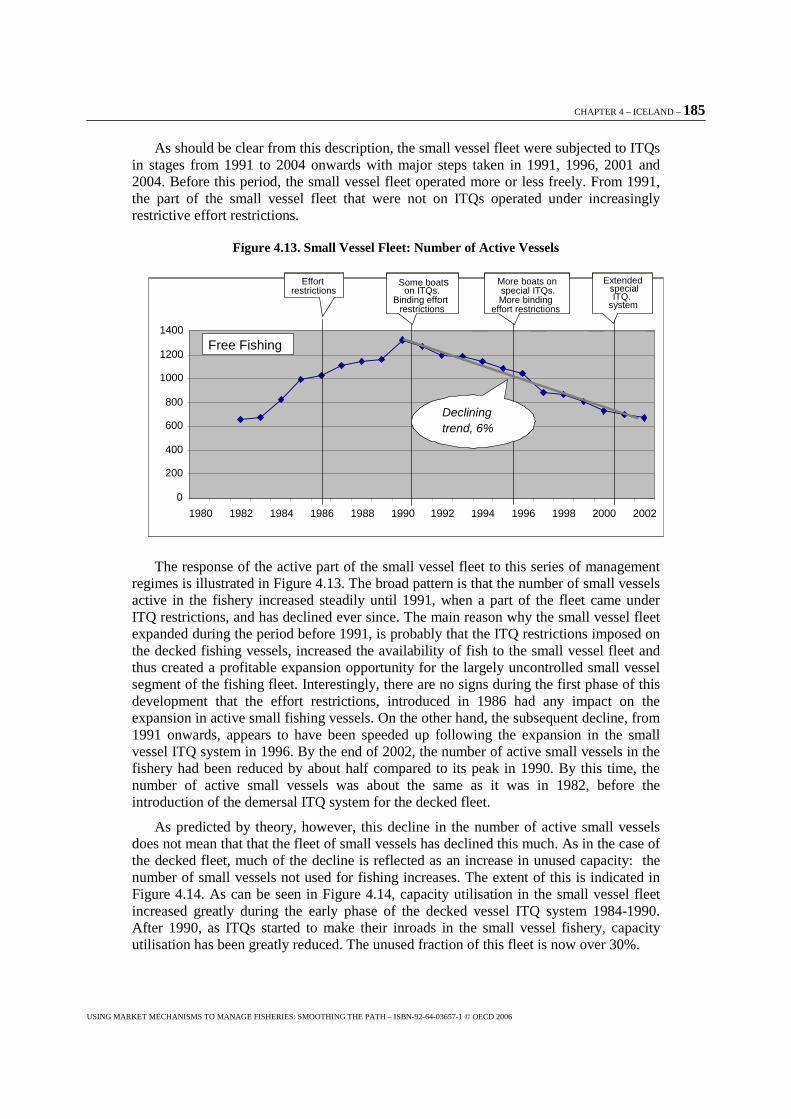
CHAPTER 4 – ICELAND – 185
USING MARKET MECHANISMS TO MANAGE FISHERIES: SMOOTHING THE PATH – ISBN-92-64-03657-1 © OECD 2006
As should be clear from this description, the small vessel fleet were subjected to ITQs in stages from 1991 to 2004 onwards with major steps taken in 1991, 1996, 2001 and 2004. Before this period, the small vessel fleet operated more or less freely. From 1991, the part of the small vessel fleet that were not on ITQs operated under increasingly restrictive effort restrictions.
Figure 4.13. Small Vessel Fleet: Number of Active Vessels
The response of the active part of the small vessel fleet to this series of management regimes is illustrated in Figure 4.13. The broad pattern is that the number of small vessels active in the fishery increased steadily until 1991, when a part of the fleet came under ITQ restrictions, and has declined ever since. The main reason why the small vessel fleet expanded during the period before 1991, is probably that the ITQ restrictions imposed on the decked fishing vessels, increased the availability of fish to the small vessel fleet and thus created a profitable expansion opportunity for the largely uncontrolled small vessel segment of the fishing fleet. Interestingly, there are no signs during the first phase of this development that the effort restrictions, introduced in 1986 had any impact on the expansion in active small fishing vessels. On the other hand, the subsequent decline, from 1991 onwards, appears to have been speeded up following the expansion in the small vessel ITQ system in 1996. By the end of 2002, the number of active small vessels in the fishery had been reduced by about half compared to its peak in 1990. By this time, the number of active small vessels was about the same as it was in 1982, before the introduction of the demersal ITQ system for the decked fleet.
As predicted by theory, however, this decline in the number of active small vessels does not mean that that the fleet of small vessels has declined this much. As in the case of the decked fleet, much of the decline is reflected as an increase in unused capacity: the number of small vessels not used for fishing increases. The extent of this is indicated in Figure 4.14. As can be seen in Figure 4.14, capacity utilisation in the small vessel fleet increased greatly during the early phase of the decked vessel ITQ system 1984-1990. After 1990, as ITQs started to make their inroads in the small vessel fishery, capacity utilisation has been greatly reduced. The unused fraction of this fleet is now over 30%.
0
200
400
600
800
1000
1200
1400
1980 1982 1984 1986 1988 1990 1992 1994 1996 1998 2000 2002
Effort restrictions
Some boats on ITQs.
Binding effort restrictions
More boats on special ITQs.
More binding effort restrictions
Free Fishing
Extended special ITQ.
system
Declining trend, 6%
0
200
400
600
800
1000
1200
1400
1980 1982 1984 1986 1988 1990 1992 1994 1996 1998 2000 2002
Effort restrictions
Some boats on ITQs.
Binding effort restrictions
More boats on special ITQs.
More binding effort restrictions
Free Fishing
Extended special ITQ.
system
0
200
400
600
800
1000
1200
1400
1980 1982 1984 1986 1988 1990 1992 1994 1996 1998 2000 2002
Effort restrictions
Some boats on ITQs.
Binding effort restrictions
More boats on special ITQs. More binding
effort restrictions
Free Fishing
Extended special ITQ.
system
Declining trend, 6%
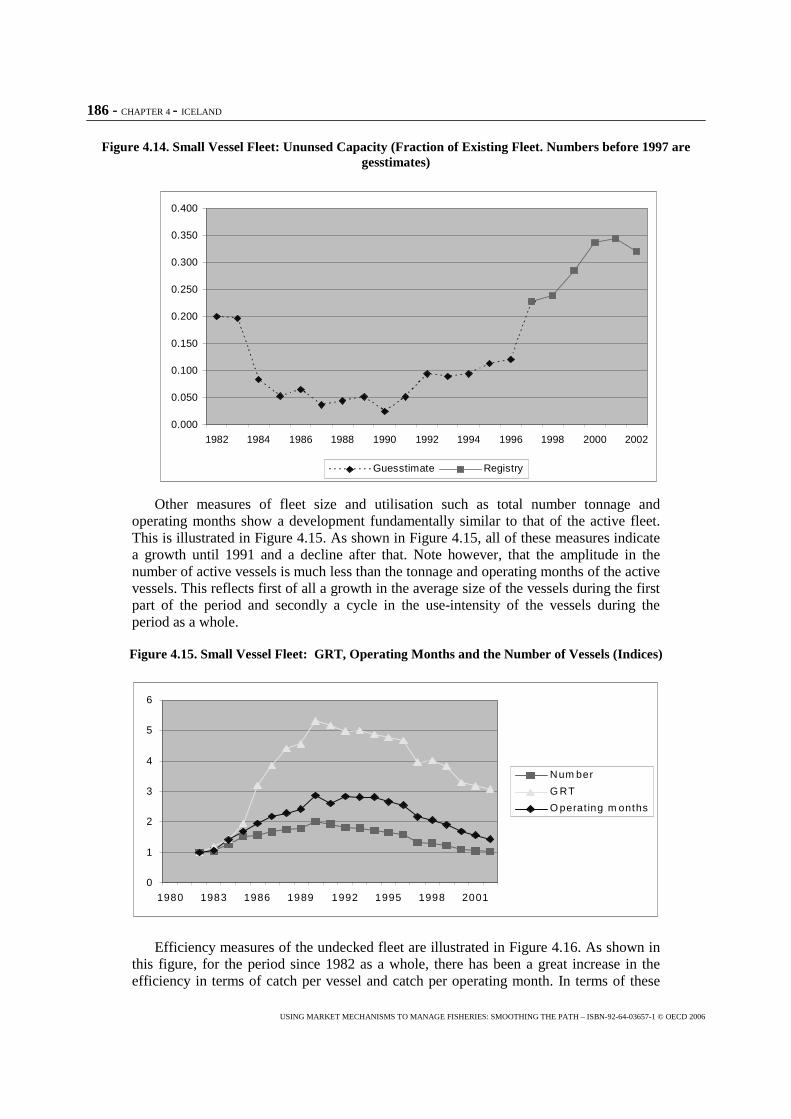
186 - CHAPTER 4 - ICELAND
USING MARKET MECHANISMS TO MANAGE FISHERIES: SMOOTHING THE PATH – ISBN-92-64-03657-1 © OECD 2006
Figure 4.14. Small Vessel Fleet: Ununsed Capacity (Fraction of Existing Fleet. Numbers before 1997 are gesstimates)
0.000
0.050
0.100
0.150
0.200
0.250
0.300
0.350
0.400
1982 1984 1986 1988 1990 1992 1994 1996 1998 2000 2002
Guesstimate Registry
Other measures of fleet size and utilisation such as total number tonnage and operating months show a development fundamentally similar to that of the active fleet. This is illustrated in Figure 4.15. As shown in Figure 4.15, all of these measures indicate a growth until 1991 and a decline after that. Note however, that the amplitude in the number of active vessels is much less than the tonnage and operating months of the active vessels. This reflects first of all a growth in the average size of the vessels during the first part of the period and secondly a cycle in the use-intensity of the vessels during the period as a whole.
Figure 4.15. Small Vessel Fleet: GRT, Operating Months and the Number of Vessels (Indices)
0
1
2
3
4
5
6
1980 1983 1986 1989 1992 1995 1998 2001
Num ber
G RT
O perat ing m onths
Efficiency measures of the undecked fleet are illustrated in Figure 4.16. As shown in this figure, for the period since 1982 as a whole, there has been a great increase in the efficiency in terms of catch per vessel and catch per operating month. In terms of these
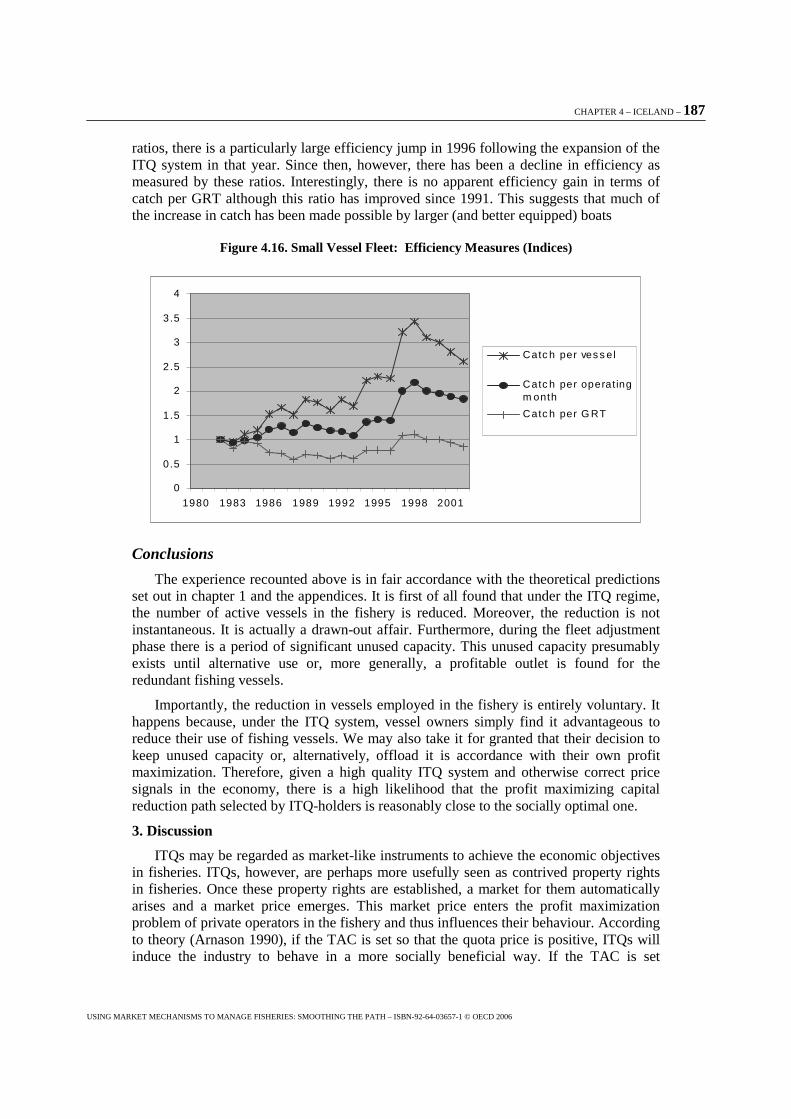
CHAPTER 4 – ICELAND – 187
USING MARKET MECHANISMS TO MANAGE FISHERIES: SMOOTHING THE PATH – ISBN-92-64-03657-1 © OECD 2006
ratios, there is a particularly large efficiency jump in 1996 following the expansion of the ITQ system in that year. Since then, however, there has been a decline in efficiency as measured by these ratios. Interestingly, there is no apparent efficiency gain in terms of catch per GRT although this ratio has improved since 1991. This suggests that much of the increase in catch has been made possible by larger (and better equipped) boats
Figure 4.16. Small Vessel Fleet: Efficiency Measures (Indices)
0
0.5
1
1.5
2
2.5
3
3.5
4
1980 1983 1986 1989 1992 1995 1998 2001
Catc h per ves s el
Catc h per operat ingm onth
Catc h per G RT
Conclusions
The experience recounted above is in fair accordance with the theoretical predictions set out in chapter 1 and the appendices. It is first of all found that under the ITQ regime, the number of active vessels in the fishery is reduced. Moreover, the reduction is not instantaneous. It is actually a drawn-out affair. Furthermore, during the fleet adjustment phase there is a period of significant unused capacity. This unused capacity presumably exists until alternative use or, more generally, a profitable outlet is found for the redundant fishing vessels.
Importantly, the reduction in vessels employed in the fishery is entirely voluntary. It happens because, under the ITQ system, vessel owners simply find it advantageous to reduce their use of fishing vessels. We may also take it for granted that their decision to keep unused capacity or, alternatively, offload it is accordance with their own profit maximization. Therefore, given a high quality ITQ system and otherwise correct price signals in the economy, there is a high likelihood that the profit maximizing capital reduction path selected by ITQ-holders is reasonably close to the socially optimal one.
3. Discussion
ITQs may be regarded as market-like instruments to achieve the economic objectives in fisheries. ITQs, however, are perhaps more usefully seen as contrived property rights in fisheries. Once these property rights are established, a market for them automatically arises and a market price emerges. This market price enters the profit maximization problem of private operators in the fishery and thus influences their behaviour. According to theory (Arnason 1990), if the TAC is set so that the quota price is positive, ITQs will induce the industry to behave in a more socially beneficial way. If the TAC is set
188 - CHAPTER 4 - ICELAND
USING MARKET MECHANISMS TO MANAGE FISHERIES: SMOOTHING THE PATH – ISBN-92-64-03657-1 © OECD 2006
optimally, quota markets operate well and other prices are true, the ITQ system will lead to a fishery that is approximately optimal.
According to the theory developed in this report (chapter 1 and appendices), when an ITQ system is imposed on a previously overcapitalized fishery (and the TAC set reasonably sensibly), private operators will find themselves with excess fishing capacity. This will lead to a reduction in fishing capital actually employed and, depending on the conditions for disinvestment (the cost of disinvestment schedule), will generally lead to a period of unused capacity and the gradual reduction in fishing capital. The speed of reduction in capital usage depends very much on the stock rebuilding (TAC) program adopted and various system inflexibilities. The speed of fishing capital disinvestment depends on the associated cost and, of course, expectations.
The fishing capital adjustment paths observed in the Icelandic fisheries under ITQs broadly confirm these theoretical predictions. Under ITQs fishing capital usage is invariably reduced, in some cases quite drastically. Moreover, in the cases for which data are available, the introduction of ITQs is followed by a period of unused fishing capacity, which in the case of the small vessel (undecked) fleet is very substantial. The presence of unused capacity implies that capital disinvestment proceeds at a lesser pace than the reduction in capital utilisation, exactly as predicted by theory.
Although the fishing capital data presented above appear in good conformance with theoretical predictions, the inference that could be drawn was neither very complete nor particularly precise. Greater insight could be obtained by more in-depth analysis. An obvious extension is to associate individual vessels in the small vessel fleet, which, as already stated, operated under a number of different fisheries management systems simultaneously, with the fisheries management system under which they operated at each point of time. With these data in hand, it would be possible to compare the fleet development of virtually identical vessels in virtually identical fisheries but operating under different fisheries management systems. This would give a more precise indication of the impact of the ITQ system relative to the alternative fisheries management systems used.
CHAPTER 4 – ICELAND – 189
USING MARKET MECHANISMS TO MANAGE FISHERIES: SMOOTHING THE PATH – ISBN-92-64-03657-1 © OECD 2006
Bibliography
Anonymous. 2004. Iceland: Country Note on National Fisheries Management Systems. OECD Directorate for Food, Agriculture and Fisheries. Fisheries Committee.
Arnason, R. 1990. Minimum Information Management in Fisheries. Canadian Journal of Economics.
Arnason, R. 1991. Efficient Management of Ocean Fisheries, European Economic Review 35: 408-17.
Arnason, R. 1994. Theoretical and Practical Fisheries Management. Managing Fishery Resources, E. Loayza (editor). World Bank Discussion Papers 217:3-10.
Arnason, R. 1996. Property Rights as an Organizational Framework in Fisheries. In B.L. Crowley (ed.). Taking Ownership: Property Rights and Fishery Management on the Atlantic Coast. Atlantic Institute for Market Studies.
Arnason, R. 2003. On Productivity and Productivity Growth in the Icealndic Fisheries. In Gudmundsson and Valtysson (eds.) Competitiveness within the Global Fisheries. University of Akureyri. Akureyri.
Clark, C.W. 1975. Mathematical Bioeconomics.: The Optimal Management of Renewable Resources. Wiley and sons. New York.
Clark, C.W., F.H. Clarke and G.R. Munro. 1979. The Optimal Explaoitation of Renewable resource Stocks: Problems of Irreversible Investment. Econometrica 47:25-49
Gordon, H.S. 1954. Economic Theory of a Common Property Resource: The Fishery. Journal of Political Economy 62:124-42
Hardin, G. 1968. The Tragedy of the Commons. Science 162:1243-47
Hatcher, A. S. Pascoe, R. Banks and R. Arnason. 2002. Future Options for UK Fish Quota Management. CEMARE Report 58.
Intriligator, A.D. 1971. Mathematical Optimization and Economic Theory. Prentice-Hall. Englewood Cliffs.
Neher, P.A., R. Arnason and N. Mollett (eds.). 1989. Rights Based Fishing. Kluwer Dordrecht.
OECD. 1997. Toward Sustainable Fisheries: Economic Aspects of the Management of Living Marine Resources. Organization for Economic Cooperation and Development. Paris.Scott, A.D. 1955. The Fishery: The Objectives of Sole Ownership: Journal of Political Economy 63:116-24
Scott, A.D. 1996. The ITQ as a Property Right: Where it Came from, How it Works and Where it is Going. In B.L. Crowley (ed.). Taking Ownership: Property Rights and Fishery Management on the Atlantic Coast. Atlantic Institute for Market Studies.
190 - CHAPTER 4 - ICELAND
USING MARKET MECHANISMS TO MANAGE FISHERIES: SMOOTHING THE PATH – ISBN-92-64-03657-1 © OECD 2006
Shotton R. 2000. (Ed.) Use of Property Rights in Fisheries Management. FAO Fisheries Technical Paper 401/1 and 401/2. Food and Agriculture Organization of the United Nations. Rome.
Weitzman, M.L. 2002. Landing Fees vs. Harvest Quota with Uncertain Fish Stocks. Journal of Environmental Economics and Management 43:325-38.
CHAPTER 4 – ICELAND – 191
USING MARKET MECHANISMS TO MANAGE FISHERIES: SMOOTHING THE PATH – ISBN-92-64-03657-1 © OECD 2006
Appendix 4.A. Fisheries Investment Theory: Essential Elements
A fishing firm can choose capital, k, and application of this capital to fishing, a. It is convenient to write the obvious upper and lower bounds on a as a�[0,1], where 0 means that none of the capital and 1 that all of it is applied. Thus, a can be regarded as the utilisation rate of fishing capital. In what follows, the variable a will play a central role. The application of capital to fishing, i.e. the multiple a�k, is often referred to as fishing effort, which we denote by e. Needless to say all these variables are functions of time.
Capital is a stock variable and the fishing firm cannot adjust it directly. However by undertaking investment, i, the fishing firm can adjust its capital level. More precisely, capital evolves according to the equation:
k i k�� � �� ,
where is the rate of capital depreciation.
The firm’s profit function is:
( , ; , ) ( , ) ( ) ( )a i k x Y a k x C a k C i� � � � � � ,
where x represents the size of the fish stocks. The first function on the right hand side of the profit function is the usual harvesting function (or more precisely revenue function) employed in fisheries economics. This function is taken to be increasing and concave in its arguments. The second function, ( )C a k� , is the usual harvesting cost function assumed to be increasing and convex. The third function on the right hand side of the profit function is somewhat less traditional. This is the investment cost function representing the costs associated with investment in capital. These costs reflect both the purchase (selling) price of capital and the costs associated with procuring and installing the capital. Formally, we may write this function as ( )kp i i� � , where kp is the unit
cost of capital and ( )i represents the cost of procuring and installing the capital. This last function is assumed to be convex with a minimum at i=0. This shape is supposed to reflect the growing costs as the rate of investment (per unity time) is increased. This shape of the investment cost function as a whole as well as the marginal investment cost function is illustrated in Figure 4.A1
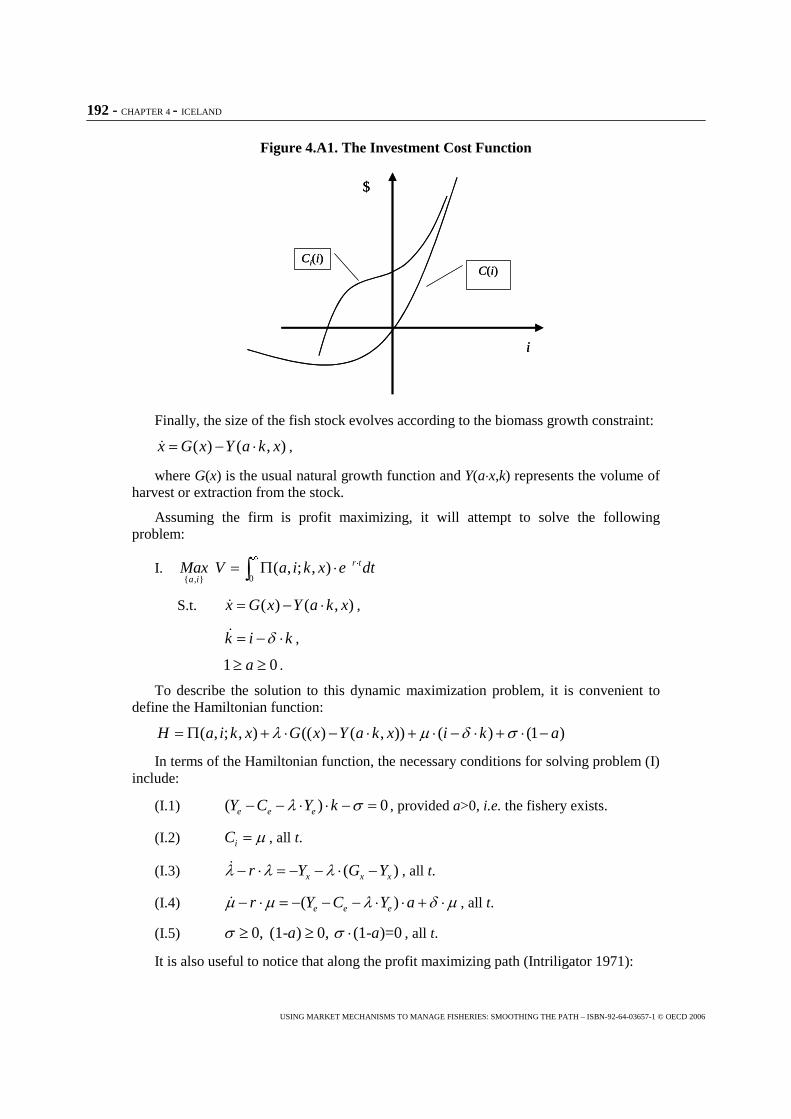
192 - CHAPTER 4 - ICELAND
USING MARKET MECHANISMS TO MANAGE FISHERIES: SMOOTHING THE PATH – ISBN-92-64-03657-1 © OECD 2006
Figure 4.A1. The Investment Cost Function
i
$
Ci(i)C(i)
i
$
Ci(i)C(i)
Finally, the size of the fish stock evolves according to the biomass growth constraint:
( ) ( , )x G x Y a k x� � �� ,
where G(x) is the usual natural growth function and Y(a�x,k) represents the volume of harvest or extraction from the stock.
Assuming the firm is profit maximizing, it will attempt to solve the following problem:
I. 0{ , }
( , ; , ) r t
a iMax V a i k x e dt
�
� �� � ��
S.t. ( ) ( , )x G x Y a k x� � �� ,
k i k�� � �� ,
1 0a� � .
To describe the solution to this dynamic maximization problem, it is convenient to define the Hamiltonian function:
( , ; , ) (( ) ( , )) ( ) (1 )H a i k x G x Y a k x i k a� � � �� � � � � � � � � � � � �
In terms of the Hamiltonian function, the necessary conditions for solving problem (I) include:
(I.1) ( ) 0e e eY C Y k� �� � � � � � , provided a>0, i.e. the fishery exists.
(I.2) iC �� , all t.
(I.3) ( )x x xr Y G Y� � �� � � � � � �� , all t.
(I.4) ( )e e er Y C Y a� � � � �� � � � � � � � � �� , all t.
(I.5) 0, (1- ) 0, (1- )=0a a� �� � � , all t.
It is also useful to notice that along the profit maximizing path (Intriligator 1971):
CHAPTER 4 – ICELAND – 193
USING MARKET MECHANISMS TO MANAGE FISHERIES: SMOOTHING THE PATH – ISBN-92-64-03657-1 © OECD 2006
( )
( ) 0( )
r tV tt e
x t� �
�� � ��
,
( )
( ) 0( )
r tV tt e
k t� �
�� � ��
.
The inequality signs stem from the fact that both biomass and capital are normally revenue enhancing (if the fishery exists) and do not entail any costs.
In equilibrium 0k x� �� � . This immediately implies 0� �� ��� . I.e. the shadow value of capital and biomass must then also be constant. We can now prove the following lemma:
Lemma A.1
If acquiring capital is costly, equilibrium entails full use of capital, i.e. a=1.
Proof:
In equilibrium i k�� � , otherwise k� �0.
In equilibrium, ( )
a
r k
��
��
�� �
, by (I.3) and (I.1).
By (I.2), iC �� =( )
a
r k
���
� �
Now, if k>0, i.e. the fishery exists, i>0 also [ i k�� � in equilibrium].
It follows that Ci>0 [by assumption acquiring capital is costly, i.e. capital is not free]. It
follows that ( )
a
r k
���
� �>0. But if a<1 then �=0 by (I.5) => a=1. �
So, in equilibrium fishing capital is fully utilized. Obviously, however, along the optimal path (possibly toward equilibrium), the utilisation of capital, a, may well be less than unity.
We now turn to exploring optimal investment behaviour specifically. We may distinguish different cases:
1. Equilibrum pertains
2. Disequilibrium pertains and a=1
3. Disequilibrium pertains and a<1
Case 1. Equilibrium
This case is simple. According to Lemma A.1, a=1. Investment is obviously given by the equation:
i k�� �
194 - CHAPTER 4 - ICELAND
USING MARKET MECHANISMS TO MANAGE FISHERIES: SMOOTHING THE PATH – ISBN-92-64-03657-1 © OECD 2006
And the equilibrium values of the stock variables, k and x can be determined from the optimal equilibrium equations:
( , ) ( ( ) ( ) ( )
( )( , ) ( ) ( ) ( )
x e ix
e e i
Y k x C k r C kG x r
Y k x C k r C k
� �� �
� � � � �� �
� � � � �,
( ) ( , )G x Y k x� .
Once the equilibrium k has been determined from these two equations, the optimal investment, i, is given by the first equation.
Case 2. Disequilibrium. Capital is fully utilized
This case is much more difficult to characterize than case 1. To fully specify the path of investment and capital we have to solve conditions (I.1) to (I.5) along with the two
differential equations for the stock variables, k i k�� � �� and ( ) ( , )x G x Y a k x� � �� imposing the condition that a=1.
Note, however, that investment is always given by expression (I.2). Moreover, since Ci is monotonic by assumption (C(i) is convex), we may write the optimal path of investment as:
1*( ) ( ( ))ii t C t���
where the path of the shadow value of capital, , is given by
( )rk
�� � �� � � �� .
Clearly, investment may be either positive or negative as indeed may be the corresponding path of capital growth. Thus, without specifying the functions and the initial conditions explicitly, it is not possible to characterize the path of capital and investment much further. Let it suffice to say that this case may well apply in the real world and under it capital may be growing or declining and investment may be of any sign.
Case 3. Disequilibrium. Capital is not fully utilized
In this case �=0 (the other case is extremely unlikely and then only fleeting). It follows that (I.4) reduces to:
(I.4’) ( )r� � �� � �� ,
the solution of which is:
( )( ) (0) r tt e �� � � �� �
Thus from (I.2) we have for investment:
( )( ) (0) r tiC i e �� � �� �
which implies that investment is a monotonically increasing function of time. Note, however, that in spite of being growing, investment may well be negative initially. Write this optimal investment function as:
CHAPTER 4 – ICELAND – 195
USING MARKET MECHANISMS TO MANAGE FISHERIES: SMOOTHING THE PATH – ISBN-92-64-03657-1 © OECD 2006
1 ( )* ( (0) )r t
ii C e ��� � �� � .
The corresponding capital equation is:
*k i k�� � �� .
Obviously, capital may be either increasing or declining.
Again, it is necessary to solve the necessary optimal equations completely to obtain full characterization of the solution. The main point, however, is that there is nothing inherent in the structure of this problem that prevents the optimal solution to the fisheries problem from operating with unused capital for a period of time that may possibly be very long.
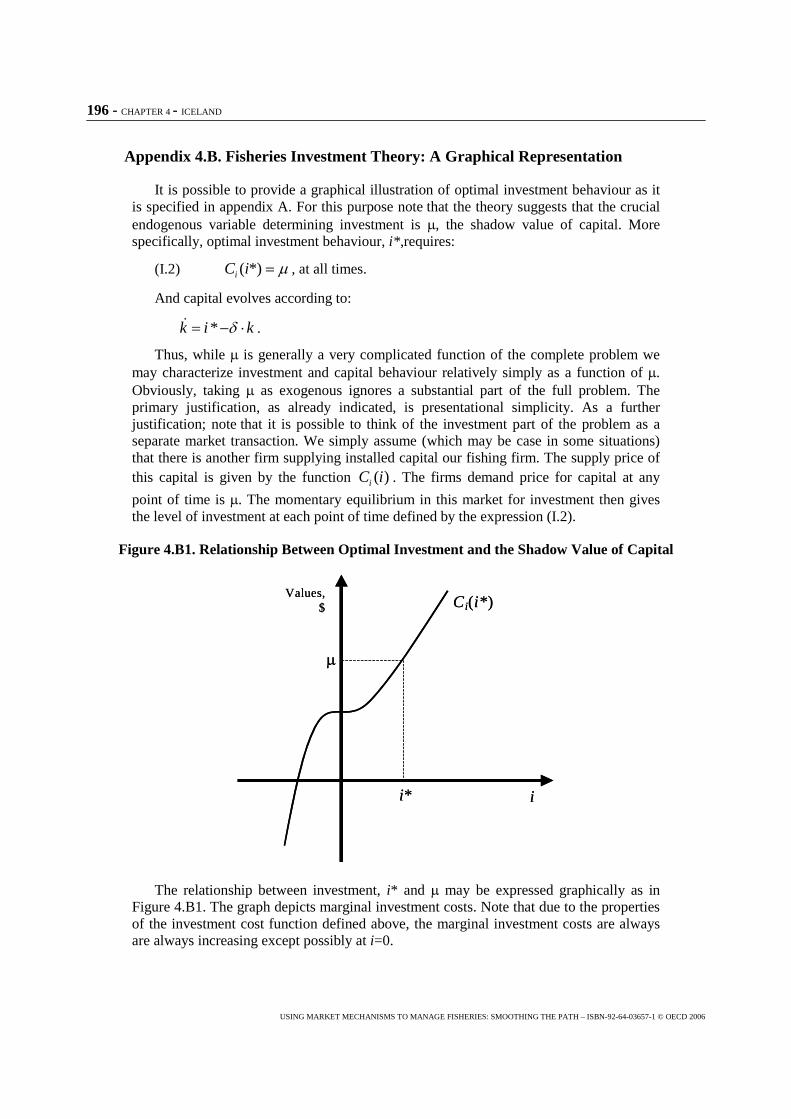
196 - CHAPTER 4 - ICELAND
USING MARKET MECHANISMS TO MANAGE FISHERIES: SMOOTHING THE PATH – ISBN-92-64-03657-1 © OECD 2006
Appendix 4.B. Fisheries Investment Theory: A Graphical Representation
It is possible to provide a graphical illustration of optimal investment behaviour as it is specified in appendix A. For this purpose note that the theory suggests that the crucial endogenous variable determining investment is , the shadow value of capital. More specifically, optimal investment behaviour, i*,requires:
(I.2) ( *)iC i �� , at all times.
And capital evolves according to:
*k i k�� � �� .
Thus, while is generally a very complicated function of the complete problem we may characterize investment and capital behaviour relatively simply as a function of . Obviously, taking as exogenous ignores a substantial part of the full problem. The primary justification, as already indicated, is presentational simplicity. As a further justification; note that it is possible to think of the investment part of the problem as a separate market transaction. We simply assume (which may be case in some situations) that there is another firm supplying installed capital our fishing firm. The supply price of this capital is given by the function ( )iC i . The firms demand price for capital at any
point of time is . The momentary equilibrium in this market for investment then gives the level of investment at each point of time defined by the expression (I.2).
Figure 4.B1. Relationship Between Optimal Investment and the Shadow Value of Capital
i
Values,$ Ci(i*)
i* i
Values,$ Ci(i*)
i*
The relationship between investment, i* and may be expressed graphically as in Figure 4.B1. The graph depicts marginal investment costs. Note that due to the properties of the investment cost function defined above, the marginal investment costs are always are always increasing except possibly at i=0.
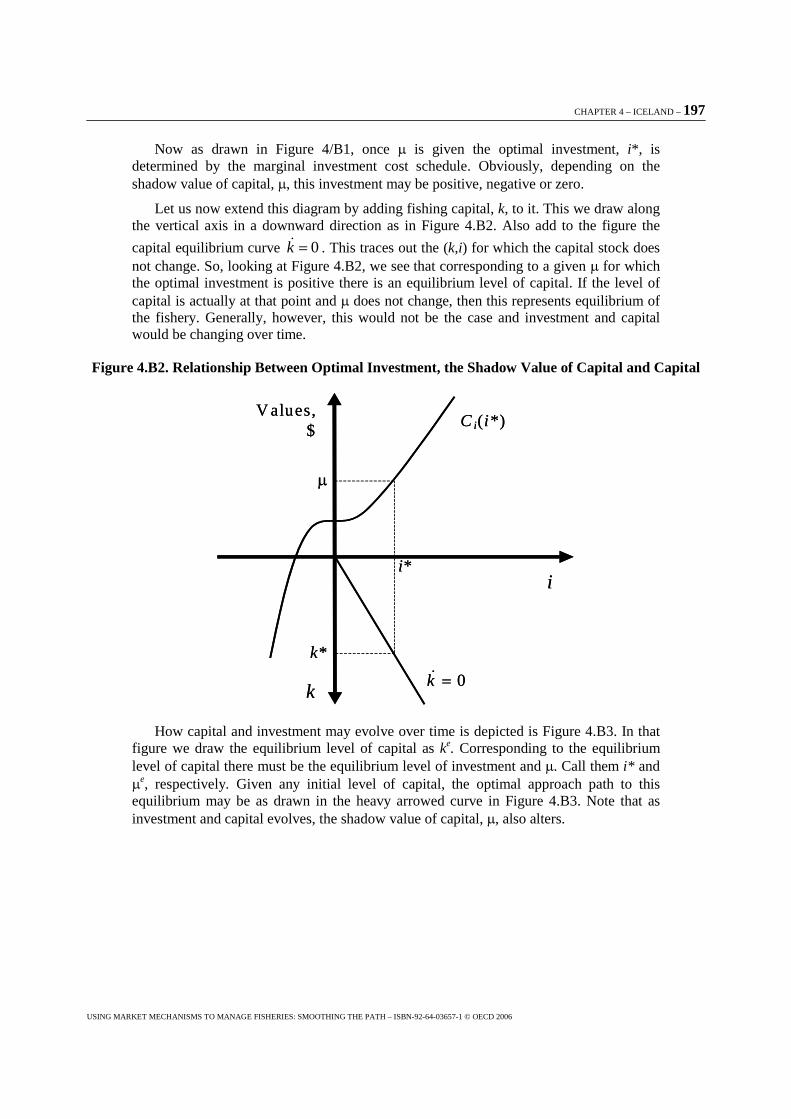
CHAPTER 4 – ICELAND – 197
USING MARKET MECHANISMS TO MANAGE FISHERIES: SMOOTHING THE PATH – ISBN-92-64-03657-1 © OECD 2006
Now as drawn in Figure 4/B1, once is given the optimal investment, i*, is determined by the marginal investment cost schedule. Obviously, depending on the shadow value of capital, , this investment may be positive, negative or zero.
Let us now extend this diagram by adding fishing capital, k, to it. This we draw along the vertical axis in a downward direction as in Figure 4.B2. Also add to the figure the
capital equilibrium curve 0k �� . This traces out the (k,i) for which the capital stock does not change. So, looking at Figure 4.B2, we see that corresponding to a given for which the optimal investment is positive there is an equilibrium level of capital. If the level of capital is actually at that point and does not change, then this represents equilibrium of the fishery. Generally, however, this would not be the case and investment and capital would be changing over time.
Figure 4.B2. Relationship Between Optimal Investment, the Shadow Value of Capital and Capital
i
V alues,$
C i(i*)
i*
k0k ��
k*
i
V alues,$
C i(i*)
i*
k0k ��
k*
How capital and investment may evolve over time is depicted is Figure 4.B3. In that figure we draw the equilibrium level of capital as ke. Corresponding to the equilibrium level of capital there must be the equilibrium level of investment and . Call them i* and e, respectively. Given any initial level of capital, the optimal approach path to this equilibrium may be as drawn in the heavy arrowed curve in Figure 4.B3. Note that as investment and capital evolves, the shadow value of capital, , also alters.
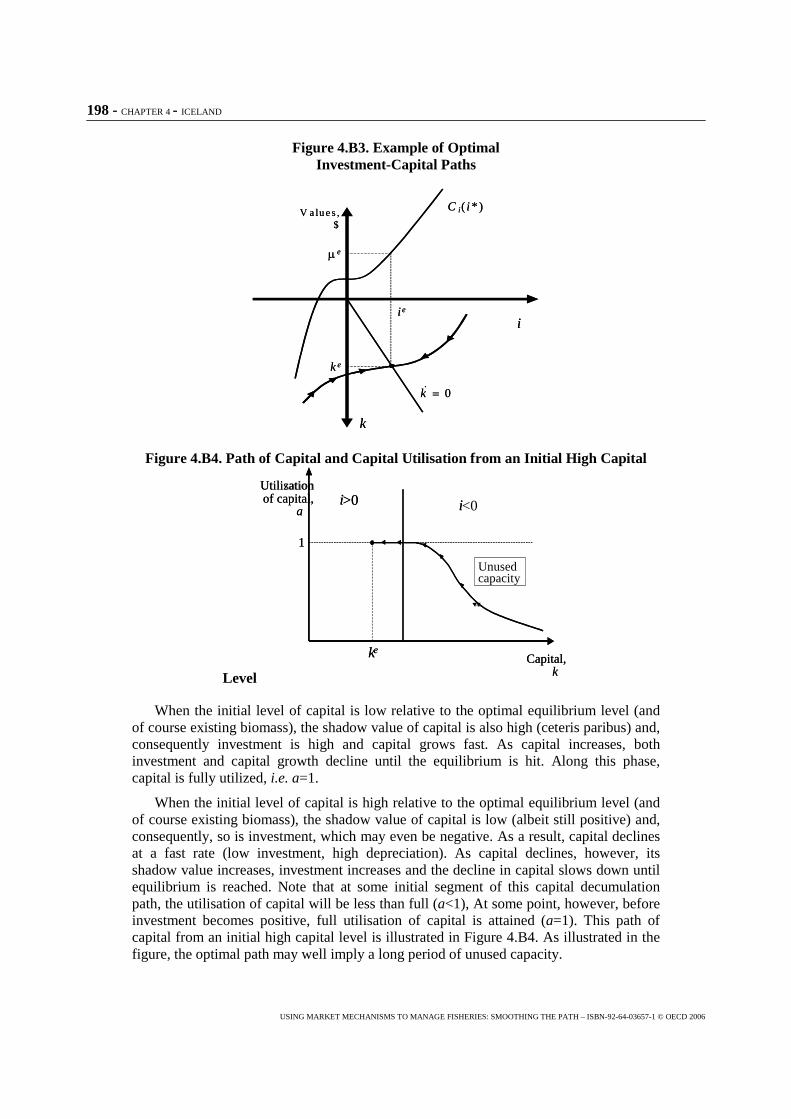
198 - CHAPTER 4 - ICELAND
USING MARKET MECHANISMS TO MANAGE FISHERIES: SMOOTHING THE PATH – ISBN-92-64-03657-1 © OECD 2006
Figure 4.B3. Example of Optimal Investment-Capital Paths
i
V a lu e s ,$
C i( i* )
e
i e
k
0k ��
k e
i
V a lu e s ,$
C i( i* )
e
i e
k
0k ��
k e
Figure 4.B4. Path of Capital and Capital Utilisation from an Initial High Capital
Level
When the initial level of capital is low relative to the optimal equilibrium level (and of course existing biomass), the shadow value of capital is also high (ceteris paribus) and, consequently investment is high and capital grows fast. As capital increases, both investment and capital growth decline until the equilibrium is hit. Along this phase, capital is fully utilized, i.e. a=1.
When the initial level of capital is high relative to the optimal equilibrium level (and of course existing biomass), the shadow value of capital is low (albeit still positive) and, consequently, so is investment, which may even be negative. As a result, capital declines at a fast rate (low investment, high depreciation). As capital declines, however, its shadow value increases, investment increases and the decline in capital slows down until equilibrium is reached. Note that at some initial segment of this capital decumulation path, the utilisation of capital will be less than full (a<1), At some point, however, before investment becomes positive, full utilisation of capital is attained (a=1). This path of capital from an initial high capital level is illustrated in Figure 4.B4. As illustrated in the figure, the optimal path may well imply a long period of unused capacity.
Capital, k
Utilization of capital,
a
k e
1
i >0 i <0
Unused capacity
Capital, k
Utilisation of capital,
a
k e
1
i >0 i
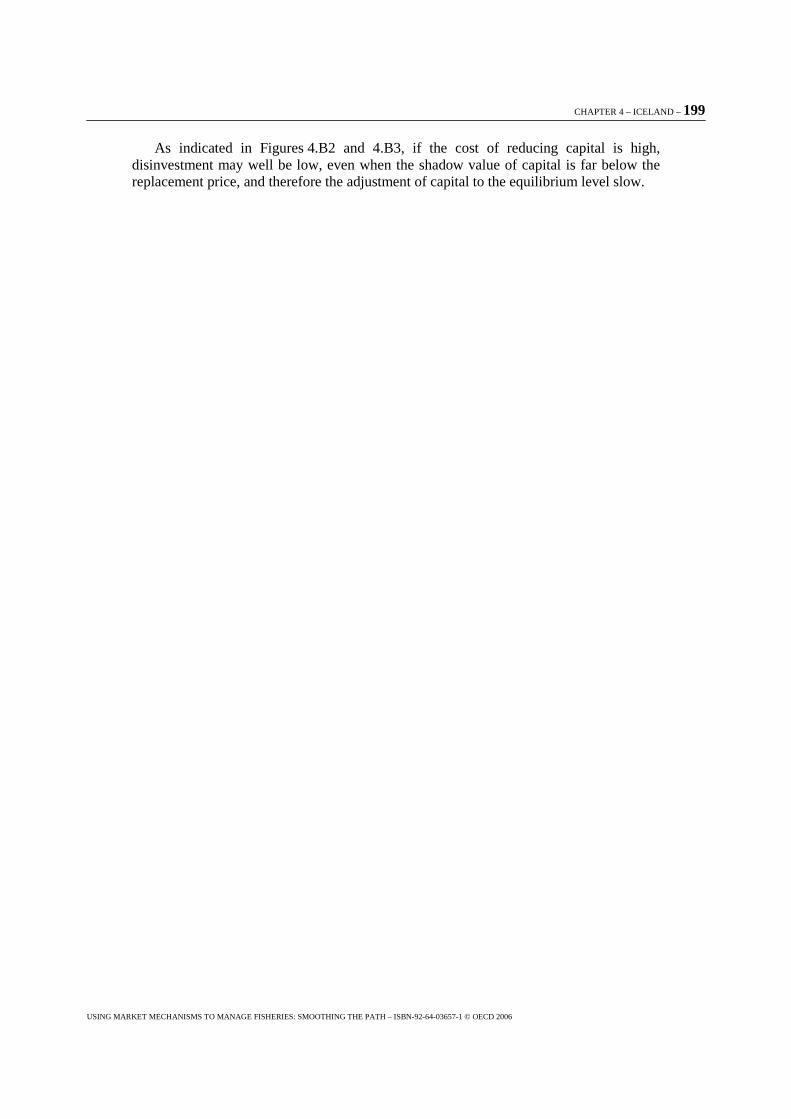
CHAPTER 4 – ICELAND – 199
USING MARKET MECHANISMS TO MANAGE FISHERIES: SMOOTHING THE PATH – ISBN-92-64-03657-1 © OECD 2006
As indicated in Figures 4.B2 and 4.B3, if the cost of reducing capital is high, disinvestment may well be low, even when the shadow value of capital is far below the replacement price, and therefore the adjustment of capital to the equilibrium level slow.
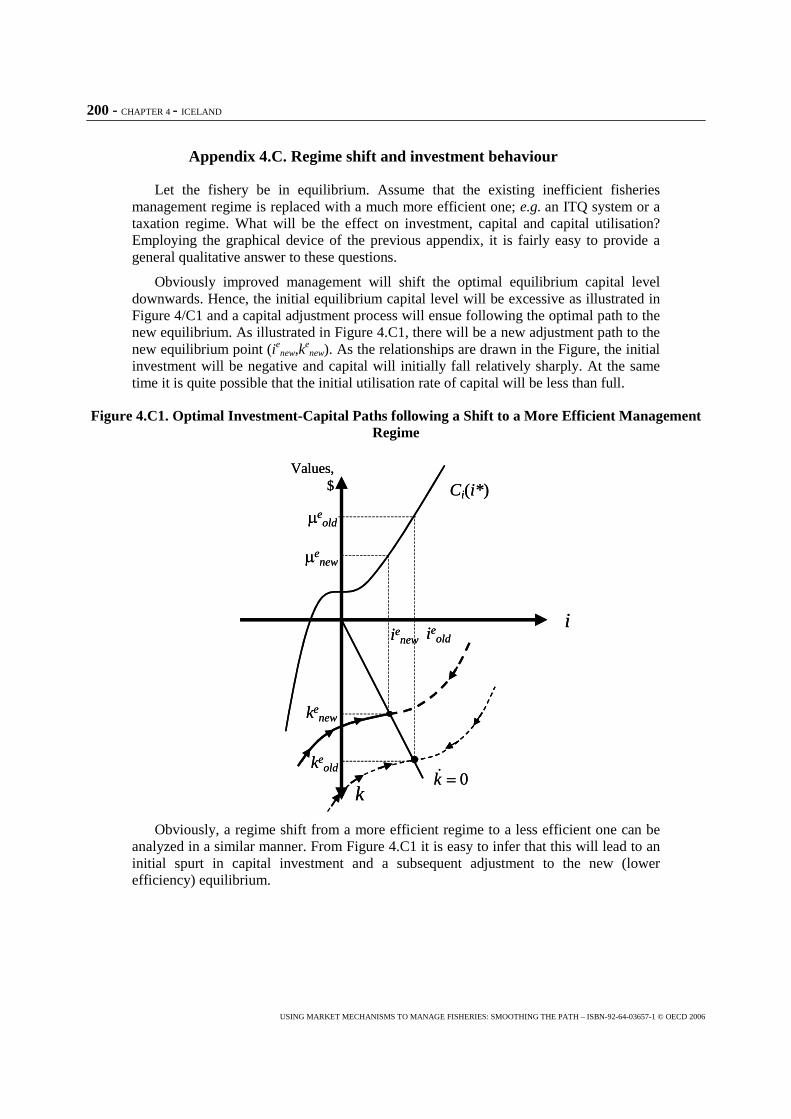
200 - CHAPTER 4 - ICELAND
USING MARKET MECHANISMS TO MANAGE FISHERIES: SMOOTHING THE PATH – ISBN-92-64-03657-1 © OECD 2006
Appendix 4.C. Regime shift and investment behaviour
Let the fishery be in equilibrium. Assume that the existing inefficient fisheries management regime is replaced with a much more efficient one; e.g. an ITQ system or a taxation regime. What will be the effect on investment, capital and capital utilisation? Employing the graphical device of the previous appendix, it is fairly easy to provide a general qualitative answer to these questions.
Obviously improved management will shift the optimal equilibrium capital level downwards. Hence, the initial equilibrium capital level will be excessive as illustrated in Figure 4/C1 and a capital adjustment process will ensue following the optimal path to the new equilibrium. As illustrated in Figure 4.C1, there will be a new adjustment path to the new equilibrium point (ie
new,kenew). As the relationships are drawn in the Figure, the initial
investment will be negative and capital will initially fall relatively sharply. At the same time it is quite possible that the initial utilisation rate of capital will be less than full.
Figure 4.C1. Optimal Investment-Capital Paths following a Shift to a More Efficient Management Regime
i
Values,$ Ci(i*)
enew
ienew
k0k ��
kenew
eold
keold
ieold
i
Values,$ Ci(i*)
enew
ienew
k0k ��
kenew
eold
keold
ieold
Obviously, a regime shift from a more efficient regime to a less efficient one can be analyzed in a similar manner. From Figure 4.C1 it is easy to infer that this will lead to an initial spurt in capital investment and a subsequent adjustment to the new (lower efficiency) equilibrium.
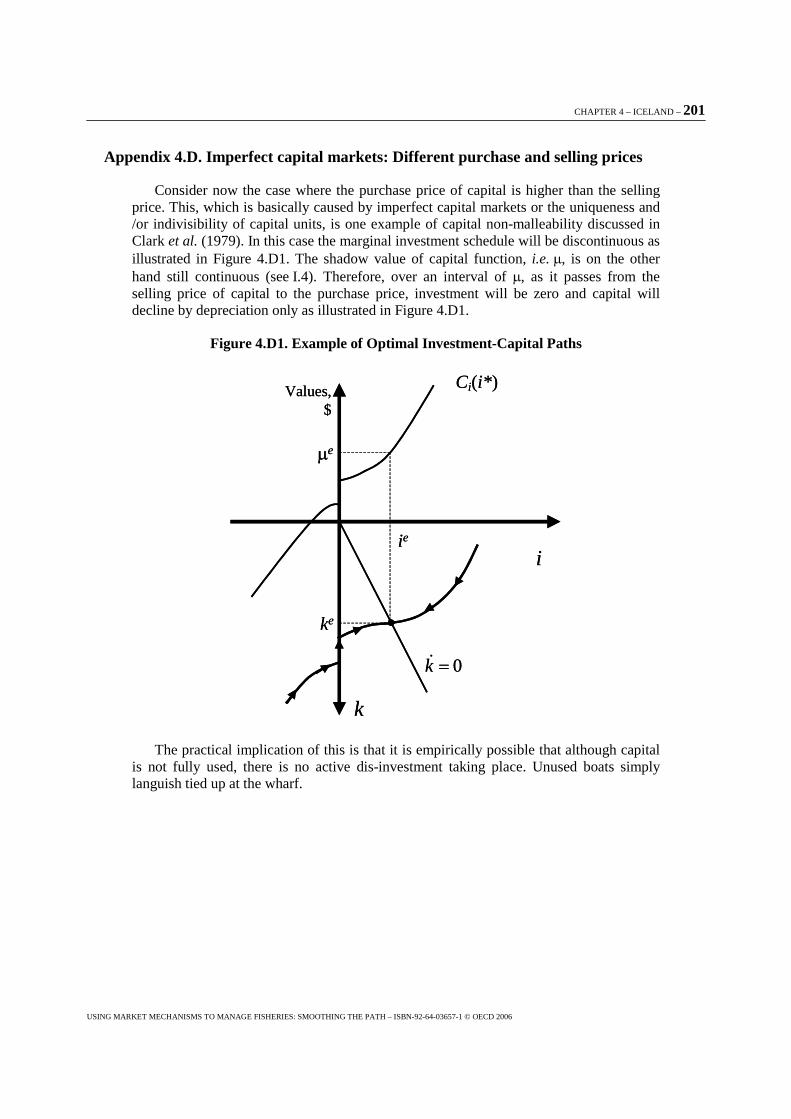
CHAPTER 4 – ICELAND – 201
USING MARKET MECHANISMS TO MANAGE FISHERIES: SMOOTHING THE PATH – ISBN-92-64-03657-1 © OECD 2006
Appendix 4.D. Imperfect capital markets: Different purchase and selling prices
Consider now the case where the purchase price of capital is higher than the selling price. This, which is basically caused by imperfect capital markets or the uniqueness and /or indivisibility of capital units, is one example of capital non-malleability discussed in Clark et al. (1979). In this case the marginal investment schedule will be discontinuous as illustrated in Figure 4.D1. The shadow value of capital function, i.e. , is on the other hand still continuous (see I.4). Therefore, over an interval of , as it passes from the selling price of capital to the purchase price, investment will be zero and capital will decline by depreciation only as illustrated in Figure 4.D1.
Figure 4.D1. Example of Optimal Investment-Capital Paths
i
Values,$
Ci(i*)
e
ie
k
0k ��
ke
i
Values,$
Ci(i*)
e
ie
k
0k ��
ke
The practical implication of this is that it is empirically possible that although capital is not fully used, there is no active dis-investment taking place. Unused boats simply languish tied up at the wharf.
CHAPTER 5 – JAPAN – 203
USING MARKET MECHANISMS TO MANAGE FISHERIES: SMOOTHING THE PATH – ISBN-92-64-03657-1 © OECD 2006
Chapter 5
Japan Roles and Functions of the Pooling System in Japanese Fisheries1
1. Introduction
Community-based fishery management has been employed in Japanese coastal areas for a long time now. Recent technological advancement of fishery operations, however, has enabled fishermen to efficiently harvest a large quantity of fish at one time. Fishermen sometimes face poor consequences caused by lower fish prices and over-exploitation of resources. The oil shortage in the 1970s added an extra problem for small local entities.
Coastal fishers have attempted to find solutions to this problem and the introduction of the exclusive economic zone system in major countries stimulated this movement. In the 1980s, fishermen in some areas started a new form of fishery operation called the “pooling system.” It is a unique form of collaborative fishery operations established on the initiative of the fishermen themselves.
The term "pooling system" was created by fishermen. Although no agreed definition of the term exists so far, it can be roughly defined as "the fishery operation system in which the value of landed fish of individual fishermen is pooled and redistributed to individual fishermen based on certain criteria." It does not usually cover a fishery management system itself, but rather it mainly covers a redistribution system to ensure a collective use of fishing grounds. It can be interpreted that the pooling system is based on the allocation of sales, rather than allocating the catch quota to individual fishers.
Some varieties exist among pooling systems. In some cases, freedom of operation of individual fishermen is strictly limited while, in other cases, the binding power of a group is lenient and fishermen have a relatively high degree of freedom for fishery operations. Also, in some cases, fishing gear and vessels are owned by individual members, while in other cases they are partially or wholly of collective ownership. As for distribution methods, simple uniform distribution is employed in some cases, while inclining distribution based on certain criteria is employed in other cases.
1 . Submitted by Mr. O. Baba, Tokyo University of Marine Science and Technology, Professor at Department of Marine Policy and Culture and Mr. N. Yagi, Fisheries Agency, MAFF, 1-2-1 Kasumigaseki, Chiyoda-ku, Tokyo.
204 – CHAPTER 5 – JAPAN
USING MARKET MECHANISMS TO MANAGE FISHERIES: SMOOTHING THE PATH – ISBN-92-64-03657-1 © OECD 2006
2. Current state of the pooling system in Japan
Increase in the number of pooling system organisations
The number of fisheries management organisations increased by about 4002 to 1,7343 during the decade from 1988 to 1998. Along with this increase, the number of management organisations, using the pooling calculation system, (hereinafter referred to as pooling system organisations) doubled in the same decade to 294. As a result, 17% of the fishery management organisation employed the pooling system in 1998. As for the type of distribution employed by the pooling system, simple distribution holds 50-55% of pooling system organisations, somewhat exceeding 40-45% of weighted distribution.
Actual state of introduction by type of fisheries
The pooling system organisations are found in the largest number in shellfish and seaweed harvesting fisheries, followed by bottom trawl fisheries (mainly small-type trawl fisheries) and gillnet fisheries. This tendency has been rather stable for the past decade. Common features of these types of fisheries are: (i) they target sessile living resources, (ii) good fishing grounds are limited, and (iii) concentration of and competition among fishing vessels can easily occur.
Actual state of pooling system introduction by sea area
The distribution of pooling system organisations is generally higher in the east and lower in the west or higher in the north and lower in the south of Japan. Although the reason behind such geographical-skewed distribution may not be simple, one factor could be the difference in the fish species composition. While fisheries in western or southern Japan target a relatively wide variety of fish species, fisheries in eastern or northern Japan target a simpler composition of species. It would be difficult in the western and southern region, where fishermen’s interests are complex, due to the existence of multiple target species, to enforce uniform regulatory measures.
Regulatory measures and its effect
As for regulatory measures employed by pooling system organisations, a unique characteristic is the use of joint operations and harvest rotation among members. It is assumed that production is increased for the organisations as a whole by cooperative use of the fishing ground, and it is distributed to individual fishermen through the pooling system. Fishermen’s perception on the effects of the pooling system was rather positive. More than 50% of the pooling system organisations noted that "maintenance and stability of catch volume" was achieved, and about 40% of the organisation indicated that "maintenance and stability of fish prices" was accomplished. This result suggests that a fair recognition exists among the fishers on the effectiveness of the pooling system.
3. Examples of the pooling system in Japan
Two cases are provided as instances of fisheries adopting the pooling system. One is a case of governor-licensed fisheries and the other is a case of the right-based coastal
2 The 8th Fishery Census: Ministry of Agriculture, Forestry, and Fisheries
3 The 10th Fishery Census: ibid.
CHAPTER 5 – JAPAN – 205
USING MARKET MECHANISMS TO MANAGE FISHERIES: SMOOTHING THE PATH – ISBN-92-64-03657-1 © OECD 2006
fishery. The reason for citing these two cases is to demonstrate that the pooling system can be introduced under different fishery management schemes.
The case of stardust shrimp fisheries in Suruga Bay
Overview of the fishery
Stardust shrimps (Sergia lucens) are distributed at the water depth of 200-350m during the day time, moved up to the water depth of 20-60m before sunset and form highly dense swarms, and return to the deeper water around dawn. Stardust shrimp fisheries target swarms in shallow water during the night. Stardust shrimps occur in wide sea areas near Japan and Taiwan. But as swarms are formed only in special sea bottom shape areas, stardust shrimp fishery exists only in Suruga Bay in Japan.
Three base-ports for the stardust shrimp fishery exist in the Suruga Bay area. They are Kanbara, Yui and Oigawa. Fishermen in Kanbara and Yui belong to the Yui Port Fisheries Cooperative Association. Fishers in Oigawa belong to Oigawa Town Fisheries Cooperative Association. The fishing method is two-boat engine-powered trawling (midwater trawl), and a total of 60 entities (120 vessels) are licensed in this area. The catch in recent years has been about 1,500 tons in the spring season and about 700 tons in the autumn season.
Shizuoka prefectural government introduced various regulations for this fishery. The maximum number of licensed fishing vessels is set at 120, and their respective tonnage must be less than 7 gross tons. The closed season is set for June 11-September 30, taking into account the spawning season of stardust shrimps. In addition to the regulatory measures enforced by the prefectural government, Shizuoka Prefecture Stardust Shrimp Fisheries Association, a voluntary organisation of stardust shrimp fishermen, set closed seasons in winter time. Consequently, there are two operation seasons: the spring season from mid-March to early June and the autumn season from mid-October to late December. In addition, the Association sets regulations on the equipment as voluntary regulatory measures. The Association has promoted the pooling system.
Process of the introduction of the pooling system
In 1964 and 1965, the amount of catch decreased to about half of that of the previous year. It caused rising awareness of overexploitation and, in 1966, the fishermen’s group in Yui attempted to reorganize the fishery operation by terminating excessive catch competition. They also started to introduce the pooling calculation system of the value of landed fish in an attempt to adjust production and to conserve resources. Incidents of collision of vessels in the fishing ground (as operations are carried out at night) and excessive competition among fishing vessels had motivated this move. However, during this period the pooling system was still being tried out on a trial basis.
The resource condition had apparently improved since then. However, in the spring of 1967, the auction prices largely fell because of continued good harvest, and conflict arose over prices between fishermen and middlemen. Consequently, a full scale implementation of the pooling calculation methods started in the Yui area from the spring season of 1968. But this was suspended after one month. It employed a uniform distribution system, which disregards differences in capabilities among fishermen, and was not fully supported by fishermen. However, the system was re-introduced, in the autumn season of 1968, because fishermen realized that the pooling system had contributed to maintaining higher shrimp prices. The same system was also introduced in Kanbara and Oigawa. This
206 – CHAPTER 5 – JAPAN
USING MARKET MECHANISMS TO MANAGE FISHERIES: SMOOTHING THE PATH – ISBN-92-64-03657-1 © OECD 2006
pooling calculation system achieved the expected results and continued until 1976. The current pooling calculation system was initiated in 1977, when the three areas agreed to consolidate the system to pursue higher management effects. The status of the consolidation was strengthened in 1983 so that the producing side would have further negotiation leverage for shrimp price against buyers.
At present, Sizuoka Prefecture Stardust Shrimp Fisheries Association, a voluntary organisation of ship owners, organizes "Fishing Operation Committees" to discuss the actual operation regime. The committee is composed of 21 members--2 shipowners and 5 skippers each from the Kanbara, Yui and Oigawa areas. The members gather around noon every day during the fishing season, and decide whether or not fishing operation should take place, and target landing volume, operation area, port departure time, and ending time for the day.
Under this arrangement, the committee appoints one leader vessel out of 120 fishing vessels. The leader vessel plays the role of commanding other vessels and giving instructions regarding fishing operations. When all the vessels arrive at the fishing ground, they start operations following instructions given over the radio by the command vessel.
When wide-range fishing grounds have not been formed, the fishing vessels are divided into two groups and only one group is allowed to operate trawling in order to prevent accidents in the small fishing ground, such as entanglement of nets between vessels. Vessels in the other group cannot engage in trawling but just wait for instruction from the command vessel. In this case, vessels operate trawling alternately every other day. The commander vessel also monitors the amount of production and decides the time of termination of the operation of the day, so that planned amount of the landing volume is kept. The Fishing Operation Committee decides on the planned landing volume, but it is just a recommended value. Final catch volume for the day is determined at the fishing ground taking into account swarm density or actual per-unit catch volume. Through this collective operation system, operational troubles among fishing vessels on the sea are resolved at reduced costs. This system has also contributed to stabilizing the shrimp price through planned catch.
Maintaining product quality is also taken into account under this system. Engaging in trawling for many hours in a low-density area of shrimps causes damage to the body of shrimps in the nets. It also increases work time for sorting out by-catch such as lantern fish, and, as a result, it can lead to quality degradation and lower market appraisal of the shrimps. To avoid this, fishing vessels are allocated a limited, small fishing ground with a high density of stardust shrimps.
To make this system workable, a fair income distribution system is indispensable. The method of the pooling calculation here (distribution of the sales income) is as follows: First, the value of landed fish of all fishing vessels for each operation is added up to calculate total sales. Second, sales commissions for the fisheries cooperative association and expenses incurred for the operation of each vessel (fuel cost, etc.) are deducted. Third, the balance is distributed proportionately among ship owners (45%) and crew (55%). This amount is equally divided according to the number of ship owners and crew.
CHAPTER 5 – JAPAN – 207
USING MARKET MECHANISMS TO MANAGE FISHERIES: SMOOTHING THE PATH – ISBN-92-64-03657-1 © OECD 2006
The role of scientific research in this system
Scientific information provided by the Fisheries Research Laboratory of Shizuoka Prefecture plays an important role in supporting this pooling system. The laboratory has carried out scientific research on stardust shrimp resources since the 1960s, and has provided fishermen with results through seminars. Fishermen have become more interested in resource conservation in the process of promoting the pooling system, and have been helping the laboratory in various types of research activities.
Fishermen themselves, at their own expense, have carried out sampling using plankton nets around spawning season as well as research on water temperature, using water temperature recorders, and they have thus provided samples to the laboratory. The laboratory has conducted data analysis of the samples. By using the results of research by fishing vessels, real-time monitoring on the subtle changes in the biological conditions of the species has become feasible.
The case of hard clam fisheries in Kashima-nada
Overview of fisheries
In the shallow sea in Kashima-nada from Ooarai Town to Hasaki Town in Ibaraki Prefecture, shellfish dredge net fisheries are carried out targeting shellfish species including hard clam (Meretrix lamarckii), equilateral venus (Gomphina melanaegis), and Sakhalin surf-clam (Spisla sachalinensis).
Bivalves in this area at times occur in great quantities, and the concentrated catch and depleting of resources over a short period has reoccurred. Prices have fallen because of large-quantity catch. The volume of landed shellfish often fluctuates drastically over a short period of time. In the Kashima-nada area, equilateral venus occurred in large quantities in 1972. The peak of its catch was 13,000 tons in 1977, but the shellfish had mostly disappeared from the area by around 1978. In later years, catch of hard clam gradually increased to take the place of equilateral venus but, since 1993, hard clam has also mostly disappeared from the area.
The fishing method is small-type bottom trawling using boats under 5 gross tons. The boat must be licensed by the prefectural governor. The fishing ground is limited to the first-class joint fishery-right fishing ground. This joint fishery-right fishing ground is shared by four fisheries cooperative associations along the coast of Kashima-nada.
A three-layer structure is observed for fishery management here. The first is the regulatory measures under the prefecture’s fisheries adjustment rules. The second is the system for use and management of fishing grounds by the Federation. The last one is the operation management system built by each fisheries cooperative association. Under the prefecture’s fishery rules, fishing is allowed all year round, but, under the Federation’s rules, a closed season of two months or longer should be established.
The Federation has also introduced additional regulations during the course of its long history. Regulations on operation days and hours for shellfish dredge net fisheries were introduced as early as 1969. The shellfish dredge net fisheries were allowed only once or twice a week for all areas, and the port departure time, and starting and ending time of the operation were unified. This regulation was uniformly applied to all the vessels, and usually all vessels went out fishing on the same days. However, accidents and problems occurred through excessively dense operation over limited good fishing ground. Also, sometimes large quantities of shellfish were landed at one time at the market of producing
208 – CHAPTER 5 – JAPAN
USING MARKET MECHANISMS TO MANAGE FISHERIES: SMOOTHING THE PATH – ISBN-92-64-03657-1 © OECD 2006
places in the three areas, and middlemen could not properly handle the products (many middlemen operate for the three areas in common).
In an effort to improve the situation, a rotation system for the use of fishing grounds was introduced in1976. The shellfish dredge net fishing vessels of each fisheries cooperative association in the Federation were divided into three areas: Ooarai, Kashima and Hasaki areas, and each area has its rotation to go out fishing on different days. Along with the rotation system, regulation on fishing hours was also enforced.
Regulation on the volume of landed fish was enforced in 1981, but it was not so successful due to low compliance of fishermen. Therefore, the regulation was again shifted to operation hour regulation, which can be understood by all fishermen. Voluntary closed areas were established under agreement of the three areas of Ooarai, Kashima and Hazaki under the Federation, aiming at protection of juveniles of equilateral venus.
Under the rotation system, fishing vessels of one area were allowed to operate twice a week from Monday to Saturday (6 days/3 areas=twice). This measure was changed late in 1981, and fishing vessels of one area were then obliged to operate one day out of the two fishing rotation days in a week for each area. This style has been maintained for a decade since 1982. In 1991, actual fishing days were reduced eve, further. Previously, all vessels went fishing on the fishing rotation day (the system of one group per area). But fishermen operating in one area were divided into two groups, and one fishing rotation day was allotted to each group. As a result, only half of the vessels in one area were allowed to operate on one fishing day, resulting in a reduction of fishing days per vessel.
This one-area-two-group system was changed to one-area-four-group system, further reducing the number of fishing days per vessel. The area-to-area group composition comprises the Oarai area (a total of 100 vessels) with four groups, the Kashima area (110 vessels) with four groups, and the Hasaki area (50 vessels) with two groups. The number of fishing vessels for the Hasaki area is about half of the other two areas, and the fishermen in this area are divided into two groups instead of four in order to maintain the level of fishing vessels per group.
The pooling system in the area
The main motivation for the introduction of the pooling system is the need to avoid the concentration of vessels in special and good fishing ground in the wake of the creation of the voluntary regulation area. In order to organize operations in good fishing grounds, the need to resolve the dissatisfaction of fishermen was recognized.
The Federation is managing the use of fishing grounds under the three-area system. Each area introduced the pooling system individually. The Hasaki Kyoei Fisheries Cooperative Association of the Hasaki area introduced the pooling system in 1987, and Kashima-nada Fisheries Cooperative Association introduced it in 1989. Two fisheries cooperative associations in the Ooarai area (now consolidated into one) started the pooling system in 1991. At that point, all of the three areas under the Federation adopted the pooling system.
The application of the pooling system itself follows the individual method of each fisheries cooperative association. But decisions on operation hours and other matters are based on the common regulations of the Federation.
In the pooling calculation method, the value of landed fish for all the operating fishing vessels is combined for each fisheries cooperative association, and sales
CHAPTER 5 – JAPAN – 209
USING MARKET MECHANISMS TO MANAGE FISHERIES: SMOOTHING THE PATH – ISBN-92-64-03657-1 © OECD 2006
commissions (5% of the total sales value) is deducted from it, and the balance is divided proportionately between the vessel owner (70%) and crew (30%). The money allocated to the vessel covers operation expenses and costs for vessel maintenance.
Under the pooling system, catch competition among fishing vessels was avoided, and operation aimed at stabilization of market prices for the entire region was realized. Fishermen also came to use the resources cautiously until the next occurrence took place, to ensure more effective conservation of resources and stabilization of catch.
Furthermore, it contributed to increasing product quality. Before the pooling system was introduced, a phenomenon called "Bero-kui (or self leg-cutting of shellfish) frequently occurred because fishermen retrieved fishing gear hastily in an attempt to achieve the maximum catch within a limited amount of time. (Bero-kui is a phenomenon whereby the shellfish closes its shell rapidly as a reaction to external stimulus caused by the strong pressure of fishing gear on the shellfish, prompting the shellfish to cut its legs (bero) by itself. This caused substantial loss of merchandise value.) The introduction of the pooling system alleviated this problem.
The role of scientific research in this system
Ibaraki Prefecture Fisheries Laboratory has been conducting research on the resources of hard clam, and has consistently made the results public. The research reports include the state of juvenile shellfish occurrence and estimated population, and are delivered to fishermen groups and the fisheries cooperative association. Fishermen reflect the research results in their management efforts on a discretionary basis. During the continued process in exchanging information between fishermen and research laboratories, mutual trust has been reinforced and voluntary measures by fishermen are becoming more scientifically oriented.
4. Analyses of the pooling system
The pooling system imposes fishermen to observe certain rules. To accept this system, fishermen must have incentives. Mechanisms for the creation of such incentives are considered as follows.
Incentive 1: the need to avoid excessive competition in limited fishing grounds
In the case of fisheries for non-migratory resources, good fishing grounds are generally limited and many fishing vessels tend to concentrate in narrow fishing grounds. Competition among fishermen is generally intensified. Excessive investment in equipment and long-hour labour is eminent. Even though fishermen might manage to survive competition through such rigorous efforts, they rarely have business benefits because of the overwhelming burden of investment.
Collective use of the fishing ground by particular groups would be useful to avoid such a situation. This system allows orderly fishery operation through allocation of fishing vessels to fishing ground, rotation system for the use of fishing ground, and limitation of catch volume. When the income distribution measure is added to this collective use of the fishing ground, the system as a whole can provide strong incentives for fishermen to join it. Conversely, once fishermen enter into this system, they lose the freedom of the fishery operation and they have to rely on the income distribution system.
210 – CHAPTER 5 – JAPAN
USING MARKET MECHANISMS TO MANAGE FISHERIES: SMOOTHING THE PATH – ISBN-92-64-03657-1 © OECD 2006
Incentive 2: the need to adopt market-oriented operations in fishery
Fish prices generally fall down locally when the volume of landed fish exceeds demand because of a limitation in the sales capability of middlemen and the processing capability of processors in the local area. To avoid this situation, producers need to coordinate to restrain their catch volume. The problem here is non-compliance of restraint measures by individual fishers. Monitoring activities by peer fishermen may put extra burden on fishermen. The use of collective operations to successfully restrain catch volume is therefore a good option in some cases. A fair system for income redistribution has to be combined with the system. Once this system becomes workable, there are strong incentives for fishermen to join in.
Incentive 3: the need for joint use of limited fishing quota
When an upper limit to the number of the license is imposed in one fisheries cooperative association and the number of the fisher exceeds the number of licenses, the collective operation system is employed in some cases. This system enables equal distribution of the opportunity for fishing and conflict among fishermen relating to the license is minimized. Income redistribution measures are usually accompanied by the collective operation system in this case, and the system as a whole encourages fishermen to take part in the system.
Conditions for the fishermen’s compliances to the stringent measures can be summarized as follows.
Condition 1: monopolistic use of fishing ground
Stringent self-restrictive measures can be successfully introduced when monopolistic use of fishing ground by fishermen is guaranteed. When non-cooperative fisher's parties exist in the same fishing ground, the collective operation based on the pooling system does not work.
Condition 2: maintenance of price forming capability
The ability to maintain prices, as a result of catch volume control, is indispensable to make the pooling system workable. Monopolized supply of the product in a region or presence of strong brand images of certain products are key aspects in this respect.
Condition 3: homogeneity of members in the organisation
Some level of homogeneity for management scale, technology and skills among members, is required to maintain the pooling system. If the pooling system is introduced in a group of non-homogeneity, an inclining distribution is naturally requested corresponding to the differences of members. Creating a fair income redistribution procedure may not be an easy task, and the maintenance of the pooling system itself becomes more difficult in this situation. In this context, homogeneity within the organisation is an important element for the success of pooling system organisations.
Condition 4: Limited application of the pooling system
When the pooling system is introduced in limited types of fisheries, opportunity for the pursuit of higher individual income usually exists in the operations of other types of non-pooling system fisheries. Under the pooling system, it is often the case that fishing days decrease and opportunities for operation for additional types of fisheries increase.
CHAPTER 5 – JAPAN – 211
USING MARKET MECHANISMS TO MANAGE FISHERIES: SMOOTHING THE PATH – ISBN-92-64-03657-1 © OECD 2006
Some fishers may simply regard the pooling system fishery as a stable income source with relatively low risks. It is important that the fishers have an additional opportunity to utilize these saved resources for other types of non-pooling system fisheries to seek better total output. In other words, it would be difficult to obtain the agreement of individual fishers for the all-species year-round pooling system.
Condition 5: Presence of strong leadership
Another important condition is the presence of an individual who plays a leading role in the process of achieving a consensus for the introduction of the pooling system in the area. In many cases, the fisherman with the largest volume of landed fish assumes the role of leader. The person is already a winner of the competition of fishery operations. Proposal from that person to restrain competition would constitute an important condition for achieving a consensus for the creation of the pooling system.
In addition, the advantages of the pooling system can be summarized as follows:
Advantage 1: Orderly operation of fishery and resource conservation
Under the competitive catch system, excessive concentration of fishing vessels in a particular superior fishing ground presents a problem. But, under the collective operation system of the pooling system organisation, planned allocation of fishing vessels to the fishing ground and effective use of unused fishing ground would be feasible, enabling effective utilization of the resources and fishing ground.
This system would also have a positive effect on fishery management of other fisheries in the region. When the pooling system organisation is formed in one type of fishery, negotiation to adjust the use of the same fishing ground by other types of fishery can be facilitated.
Advantage 2: Price stabilization of the catch
Control of catch volume is possible using pooling system organisations, thereby stabilising prices of catch .
Advantage 3: Product Quality Improvement
Fishermen tend to pursue quantities under the competitive operation systems. Under the pooling system, however, a shift may occur in fisher’s activities toward the pursuit of quality to better secure profit.
Advantage 4: Saving fishermen’s cost and investment
Establishment of an efficient operation system by pooling system organisations may reduce excessive investment in engine and equipment and this would lead to lower consumption of fuel and supplies.
Advantage 5: Risk diversification
Under the operation of the pooling system, the number of fishing days can be reduced. Opportunities to operate in additional types of fisheries may increase, resulting in an increase of overall income for individual fishers. Shifting the operation system from single fishery to multiple fisheries would be easier, and fishermen could diversify their operational risks caused by volatility in resource conditions of single species.
212 – CHAPTER 5 – JAPAN
USING MARKET MECHANISMS TO MANAGE FISHERIES: SMOOTHING THE PATH – ISBN-92-64-03657-1 © OECD 2006
Advantage 6: Improvement of labour conditions and welfare of the workforce
Under the competitive fishery operation systems, early-time operations for securing the fishing ground and prolonged working hours usually occur. The pooling and collective operation system can improve this situation. This is also an important aspect for securing or recruiting crews.
Improved work conditions can lead to fewer time constraints on fishing operations, and safety in the fishing operation would thus be improved.
5. Discussion
So far, we have reviewed the advantages and constraints of the collective operation of fisheries based on the pooling system. We will now attempt to compare the merit of the pooling system with some other management methods of fisheries.
As a measure against over-capacity of fishing efforts, vessel reduction programs are sometimes implemented for offshore and pelagic fisheries. For coastal fisheries, however, this may not always be an appropriate step. Coastal fisheries operate within a small area, and a fixed number of fishing vessels in one small area are determined according to the level of resources during a particular period, which is maybe less meaningful in a biological sense. The socio-economic impact of the reduction in the number of fishing entities is also a source of concern for coastal fishery communities where transition to another industry is not easy and where the population of fishermen is high. In Japanese coastal fisheries, the collective operation based on the pooling system sometimes delivers the best results, ensuring the continued existence of individual family fishing businesses and local communities.
The pooling system is employed mostly in coastal fisheries at this stage in Japan. Applying this system to offshore fisheries would be worth while considering. Even in offshore fisheries, securing the crew depends on local communities. However, in the case of offshore fisheries, reconciling the interests of the people to initiate the pooling system is a serious challenge because offshore fishing grounds are distributed in much wider sea-areas and, therefore, the number of stakeholders becomes much larger than those of coastal fisheries.
In several countries, the Individual Transferable Quota (ITQ) system under the Total Allowable Catch (TAC) has become a popular method for fishery management. These methods are based on the concept that the number of fishing entities can be adjusted properly through competition under market mechanisms. However, this system allows the survival of only a limited number of fishing entities and many other family fishermen and related community members are forced out. If this situation were to be implemented in Japanese coastal areas where fishery is historically rooted in community life, it would cause serious socio-economic problems.
In conclusion, the most suitable approach towards the transition to sustainable fisheries, based on market-like incentives, may vary from country to country, from region to region, and from fishery to fishery. In the case of Japanese coastal areas, the most suitable measures would not be those based on market mechanisms but, rather, a mechanism that ensures stakeholder involvement with full use of a traditional mutual supporting system in local communities would be the best option in many cases.
CHAPTER 6 – KOREA – 213
USING MARKET MECHANISMS TO MANAGE FISHERIES: SMOOTHING THE PATH – ISBN-92-64-03657-1 © OECD 2006 – ISBN-92-64-XXXXX-X © OECD 2004
Chapter 6
Korea Current Status and Implications of Fishermen-Oriented
Co-Management Fisheries
Introduction of Fishermen-Oriented Co-Management Fisheries
Korea’s fish stocks are managed under the control of the government-led fishing license and permit system, the Total Allowable Catch (TAC) system, and through the application of numerous technical measures from a traditional perspective. However, harvests of wild fish stocks have been declining over time. Korea keenly recognizes that the government’s top-down, command and control approach to fisheries management does not work well. Therefore, the concept of co-management has brought attention to management practices that would have been neglected. A new framework for “fishermen-oriented co-management fisheries” was launched in 2001 in order to encourage active participations of Korean fishermen.
Pursuant to the relevant provisions of Korea’s fisheries-related laws and regulations, Korea’s fishermen-oriented co-management fisheries help fishermen to manage their fishing grounds and fish stocks, improve profitability through the proper management of fishery production, and keep fishing operations in order through their voluntary participations. It aims to build strong infrastructures for promoting sustainable fishery production, resolving fishery-related disputes, and boosting fishermen’s income as well as enabling fishing villages viable. Furthermore, it focuses Korea’s fishermen-oriented co-management fisheries on coastal fisheries in need of public aid, especially small-scale fisheries, to ensure fishermen’s livelihoods. Over a two-year experimental period, it has been implemented with fishermen’s voluntary participation, as part of Korea’s ‘New Fishing Village Movement’.
Co-management as a concept has a relatively short history in fisheries, not more than a quarter of a century. As a practice, however, co-management has been with us for much longer. While Korea’s and Japan’s co-management systems are relatively very similar, some other countries’ systems are different in terms of the contents of the co-management system.
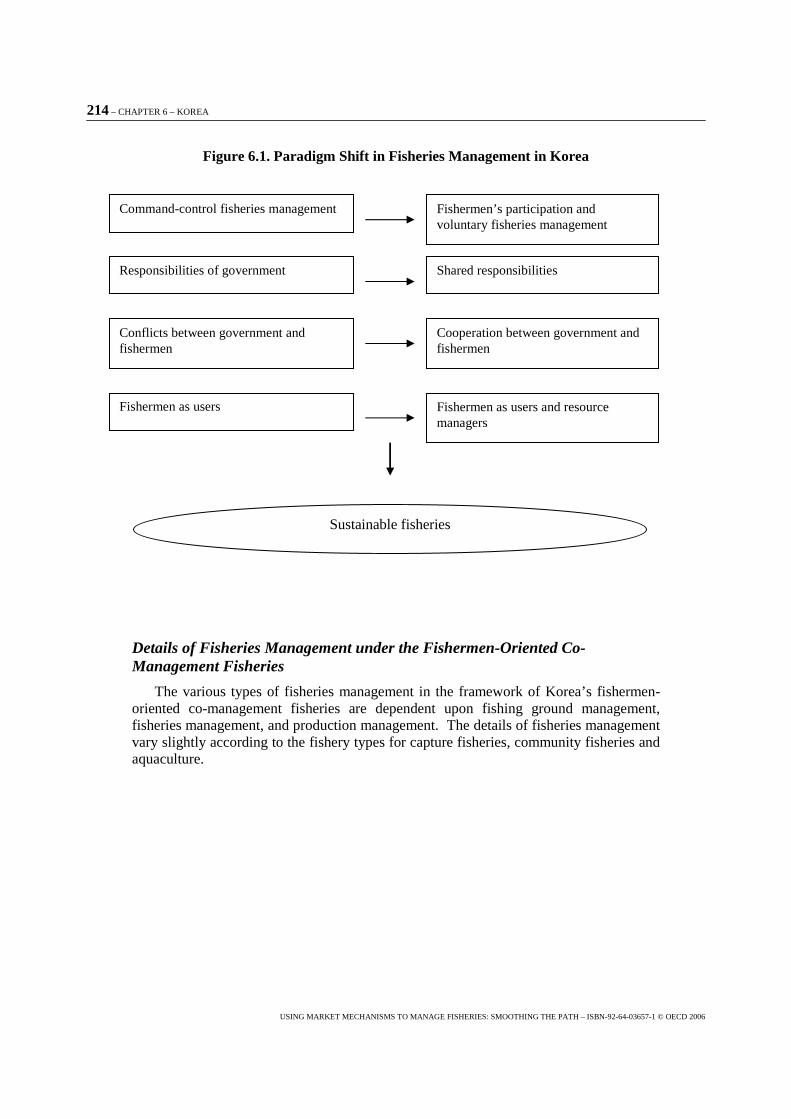
214 – CHAPTER 6 – KOREA
USING MARKET MECHANISMS TO MANAGE FISHERIES: SMOOTHING THE PATH – ISBN-92-64-03657-1 © OECD 2006
Figure 6.1. Paradigm Shift in Fisheries Management in Korea
��
�
�
�
�
�
�
�
�
�
�
�
�
�
Details of Fisheries Management under the Fishermen-Oriented Co-Management Fisheries
The various types of fisheries management in the framework of Korea’s fishermen-oriented co-management fisheries are dependent upon fishing ground management, fisheries management, and production management. The details of fisheries management vary slightly according to the fishery types for capture fisheries, community fisheries and aquaculture.
Command-control fisheries management Fishermen’s participation and voluntary fisheries management
Responsibilities of government Shared responsibilities
Conflicts between government and fishermen
Cooperation between government and fishermen
Fishermen as users Fishermen as users and resource managers
Sustainable fisheries
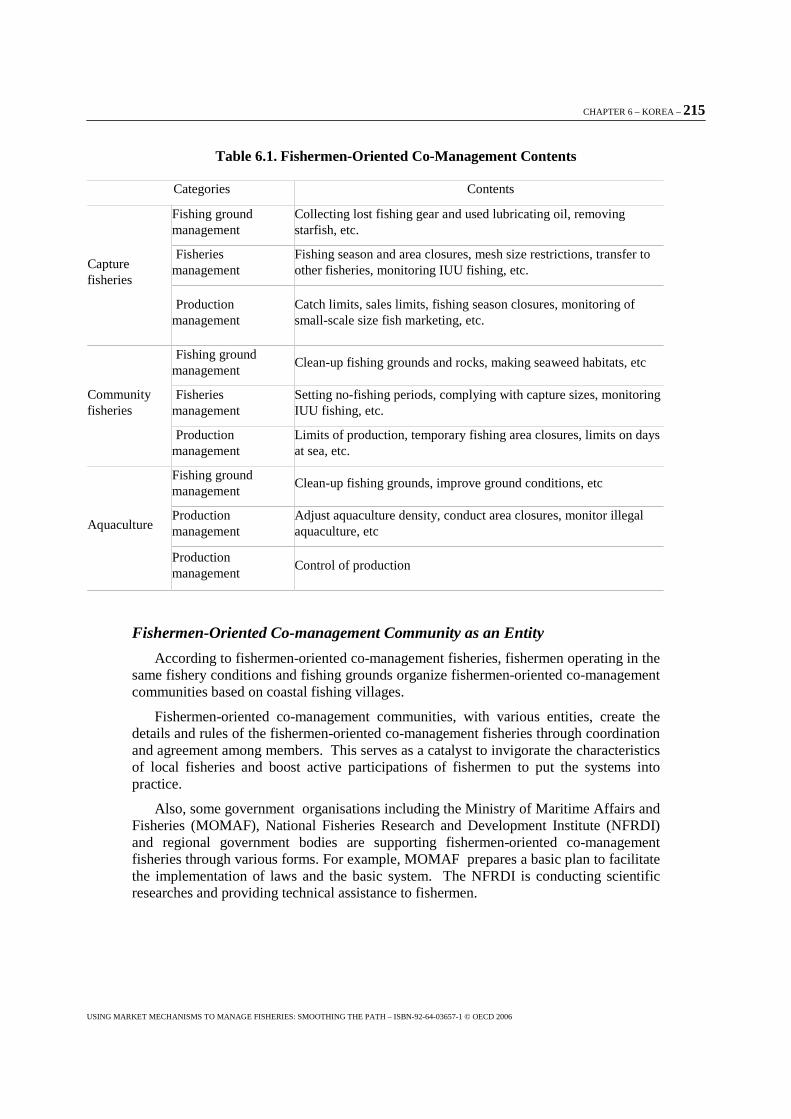
CHAPTER 6 – KOREA – 215
USING MARKET MECHANISMS TO MANAGE FISHERIES: SMOOTHING THE PATH – ISBN-92-64-03657-1 © OECD 2006
Table 6.1. Fishermen-Oriented Co-Management Contents
Categories Contents
Fishing ground management
Collecting lost fishing gear and used lubricating oil, removing starfish, etc.
Fisheries management
Fishing season and area closures, mesh size restrictions, transfer to other fisheries, monitoring IUU fishing, etc. Capture
fisheries
Production management
Catch limits, sales limits, fishing season closures, monitoring of small-scale size fish marketing, etc.
Fishing ground management
Clean-up fishing grounds and rocks, making seaweed habitats, etc
Fisheries management
Setting no-fishing periods, complying with capture sizes, monitoring IUU fishing, etc.
Community fisheries
Production management
Limits of production, temporary fishing area closures, limits on days at sea, etc.
Fishing ground management
Clean-up fishing grounds, improve ground conditions, etc
Production management
Adjust aquaculture density, conduct area closures, monitor illegal aquaculture, etc Aquaculture
Production management
Control of production
Fishermen-Oriented Co-management Community as an Entity
According to fishermen-oriented co-management fisheries, fishermen operating in the same fishery conditions and fishing grounds organize fishermen-oriented co-management communities based on coastal fishing villages.
Fishermen-oriented co-management communities, with various entities, create the details and rules of the fishermen-oriented co-management fisheries through coordination and agreement among members. This serves as a catalyst to invigorate the characteristics of local fisheries and boost active participations of fishermen to put the systems into practice.
Also, some government organisations including the Ministry of Maritime Affairs and Fisheries (MOMAF), National Fisheries Research and Development Institute (NFRDI) and regional government bodies are supporting fishermen-oriented co-management fisheries through various forms. For example, MOMAF prepares a basic plan to facilitate the implementation of laws and the basic system. The NFRDI is conducting scientific researches and providing technical assistance to fishermen.
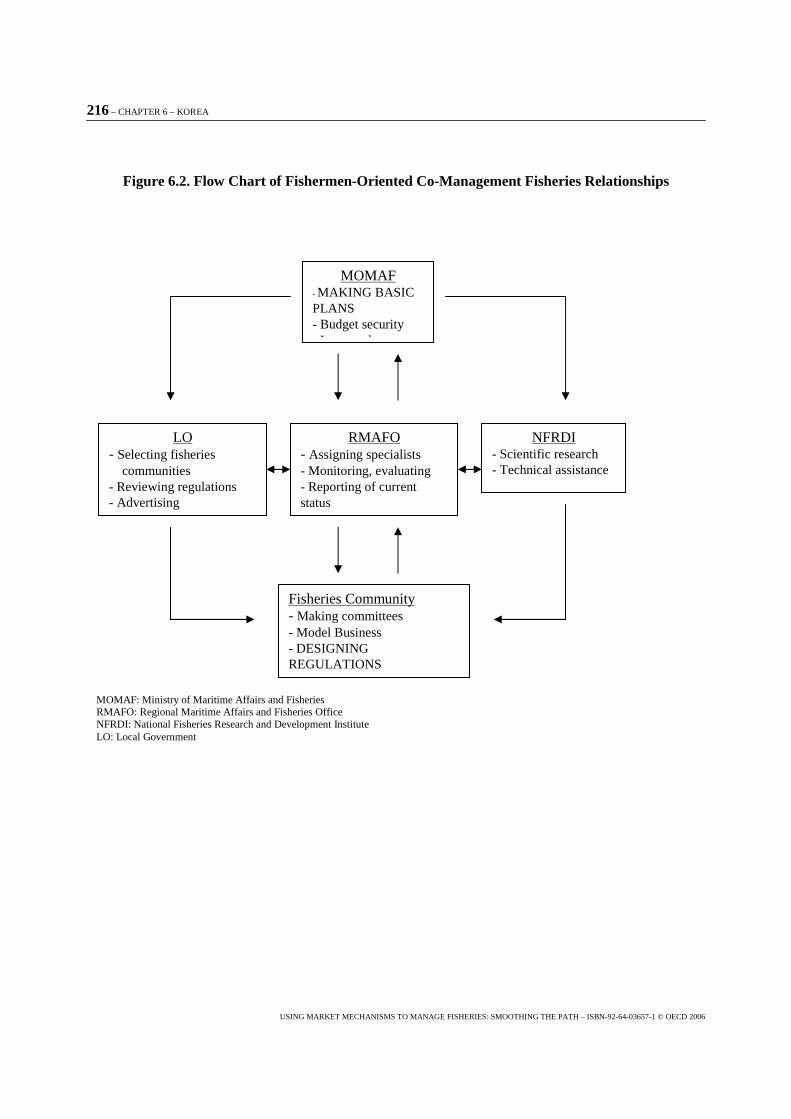
216 – CHAPTER 6 – KOREA
USING MARKET MECHANISMS TO MANAGE FISHERIES: SMOOTHING THE PATH – ISBN-92-64-03657-1 © OECD 2006
Figure 6.2. Flow Chart of Fishermen-Oriented Co-Management Fisheries Relationships
MOMAF - MAKING BASIC PLANS - Budget security - Laws and
LO - Selecting fisheries
communities - Reviewing regulations - Advertising
RMAFO - Assigning specialists - Monitoring, evaluating - Reporting of current status
NFRDI - Scientific research - Technical assistance
Fisheries Community - Making committees - Model Business - DESIGNING REGULATIONS
MOMAF: Ministry of Maritime Affairs and Fisheries RMAFO: Regional Maritime Affairs and Fisheries Office NFRDI: National Fisheries Research and Development Institute LO: Local Government
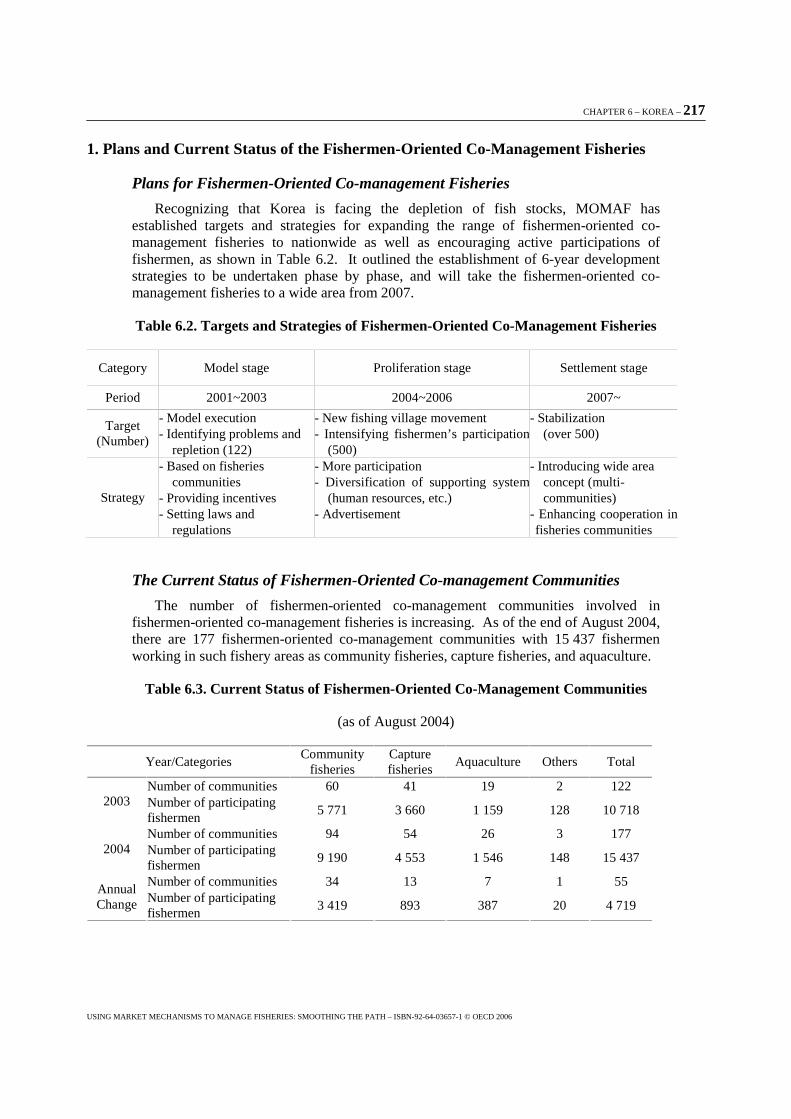
CHAPTER 6 – KOREA – 217
USING MARKET MECHANISMS TO MANAGE FISHERIES: SMOOTHING THE PATH – ISBN-92-64-03657-1 © OECD 2006
1. Plans and Current Status of the Fishermen-Oriented Co-Management Fisheries
Plans for Fishermen-Oriented Co-management Fisheries
Recognizing that Korea is facing the depletion of fish stocks, MOMAF has established targets and strategies for expanding the range of fishermen-oriented co-management fisheries to nationwide as well as encouraging active participations of fishermen, as shown in Table 6.2. It outlined the establishment of 6-year development strategies to be undertaken phase by phase, and will take the fishermen-oriented co-management fisheries to a wide area from 2007.
Table 6.2. Targets and Strategies of Fishermen-Oriented Co-Management Fisheries
Category Model stage Proliferation stage Settlement stage
Period 2001~2003 2004~2006 2007~
Target (Number)
- Model execution - Identifying problems and
repletion (122)
- New fishing village movement - Intensifying fishermen’s participation
(500)
- Stabilization (over 500)
Strategy
- Based on fisheries communities
- Providing incentives - Setting laws and
regulations
- More participation - Diversification of supporting system
(human resources, etc.) - Advertisement
- Introducing wide area concept (multi- communities)
- Enhancing cooperation in fisheries communities
The Current Status of Fishermen-Oriented Co-management Communities
The number of fishermen-oriented co-management communities involved in fishermen-oriented co-management fisheries is increasing. As of the end of August 2004, there are 177 fishermen-oriented co-management communities with 15 437 fishermen working in such fishery areas as community fisheries, capture fisheries, and aquaculture.
Table 6.3. Current Status of Fishermen-Oriented Co-Management Communities
(as of August 2004)
Year/Categories Community
fisheries Capture fisheries
Aquaculture Others Total
Number of communities 60 41 19 2 122 2003 Number of participating
fishermen 5 771 3 660 1 159 128 10 718
Number of communities 94 54 26 3 177 2004 Number of participating
fishermen 9 190 4 553 1 546 148 15 437
Number of communities 34 13 7 1 55 Annual Change Number of participating
fishermen 3 419 893 387 20 4 719
�
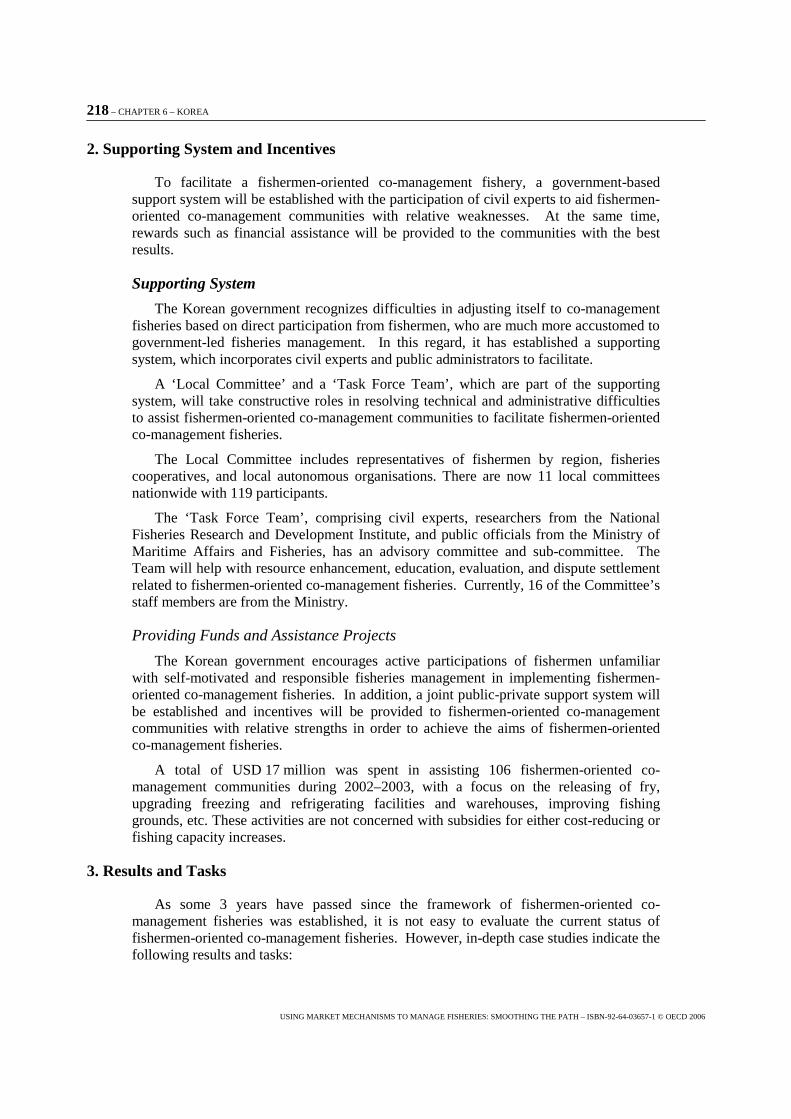
218 – CHAPTER 6 – KOREA
USING MARKET MECHANISMS TO MANAGE FISHERIES: SMOOTHING THE PATH – ISBN-92-64-03657-1 © OECD 2006
2. Supporting System and Incentives
To facilitate a fishermen-oriented co-management fishery, a government-based support system will be established with the participation of civil experts to aid fishermen-oriented co-management communities with relative weaknesses. At the same time, rewards such as financial assistance will be provided to the communities with the best results.
Supporting System
The Korean government recognizes difficulties in adjusting itself to co-management fisheries based on direct participation from fishermen, who are much more accustomed to government-led fisheries management. In this regard, it has established a supporting system, which incorporates civil experts and public administrators to facilitate.
A ‘Local Committee’ and a ‘Task Force Team’, which are part of the supporting system, will take constructive roles in resolving technical and administrative difficulties to assist fishermen-oriented co-management communities to facilitate fishermen-oriented co-management fisheries.
The Local Committee includes representatives of fishermen by region, fisheries cooperatives, and local autonomous organisations. There are now 11 local committees nationwide with 119 participants.
The ‘Task Force Team’, comprising civil experts, researchers from the National Fisheries Research and Development Institute, and public officials from the Ministry of Maritime Affairs and Fisheries, has an advisory committee and sub-committee. The Team will help with resource enhancement, education, evaluation, and dispute settlement related to fishermen-oriented co-management fisheries. Currently, 16 of the Committee’s staff members are from the Ministry.
Providing Funds and Assistance Projects
The Korean government encourages active participations of fishermen unfamiliar with self-motivated and responsible fisheries management in implementing fishermen-oriented co-management fisheries. In addition, a joint public-private support system will be established and incentives will be provided to fishermen-oriented co-management communities with relative strengths in order to achieve the aims of fishermen-oriented co-management fisheries.
A total of USD 17 million was spent in assisting 106 fishermen-oriented co-management communities during 2002–2003, with a focus on the releasing of fry, upgrading freezing and refrigerating facilities and warehouses, improving fishing grounds, etc. These activities are not concerned with subsidies for either cost-reducing or fishing capacity increases.
3. Results and Tasks
As some 3 years have passed since the framework of fishermen-oriented co-management fisheries was established, it is not easy to evaluate the current status of fishermen-oriented co-management fisheries. However, in-depth case studies indicate the following results and tasks:
CHAPTER 6 – KOREA – 219
USING MARKET MECHANISMS TO MANAGE FISHERIES: SMOOTHING THE PATH – ISBN-92-64-03657-1 © OECD 2006
Results
� Reduction of illegal fisheries and orientation for active resource management (re-releasing of fry and sabbatical year for fishing grounds)
� Improvement of farming grounds
� Resolution of fishery disputes and conflicts in an autonomous manner
Tasks and Questions
� Difficulties in expanding capture fisheries for migratory species
� Conflicts between participating and non-participating fishermen
� Increasing demand for more incentives from government
4. The Implications of Fishermen-Oriented Co-Management Fisheries in Korea
The implications of fishermen-oriented co-management fisheries are as follows:
� The fishermen-oriented co-management fishery is a sort of high quality fisheries management method supplementing the government-led fisheries management, helping to upgrade Korea’s policies for the rational management of fishery resources
� The fishermen-oriented co-management fishery is part of co-management fisheries undertaken by fishermen and the government. In particular, assistance from civil experts and government officials may be linked to the development of fishing village communities, which create synergy effects
� Increasing fishery incomes will boost self-respect for fishermen. In particular, the fishermen-oriented co-management fishery, which includes joint fishing operations and distribution, serves as a cornerstone to help fishing villages prosper and support aged fishermen
CHAPTER 7 – NORWAY – 221
USING MARKET MECHANISMS TO MANAGE FISHERIES: SMOOTHING THE PATH – ISBN-92-64-03657-1 © OECD 2006
Chapter 7
Norway
Key Highlights of the Document
The main purpose of this paper is to show how market based instruments have been introduced in Norway. The paper will analyse how stakeholders have dealt with the changes and cooperated in the introduction of these instruments.
The first section gives some main characteristics of the fishing industry in Norway. Based on local exploitation of the fish resources, as well as the common policy that the fisheries sector is an important contributor to the settlement in the coastal areas, a strong coastal culture has developed. The main objective of the fisheries policy is to maximise profits through an economically efficient use of the resources, but also to ensure socio-economic optimisation with respect to the total gain for the communities, within the limits of sustainable use of the resources.
The second section gives an introduction to the fisheries policies. According to catch volume, Norway is the 10th largest fishing nation in the world, with 9 700 registered vessels and more than 13 000 fishers. The Norwegian model for sustainable marine resource management is based on certain key principles: sustainable harvesting, multi-species approach, adequate regulations and an extensive control and enforcement system. It is vital that these principles are accepted as legitimate by the fishers themselves, and stakeholders are therefore involved in the regulation development process. Efforts to improve the management of marine recourses are given a high priority by both the authorities and the fishing industry itself.
The third section focuses on the Norwegian management regime and describes the input and output regulations and the measures made to deal with overcapacity problems in the fishing fleet. Two basic models, licences and annual permits, are implemented for regulating the number of vessels that can join the various fisheries, and only marginal fisheries are presently not regulated by either licences or annual permits. Regulations are implemented for every stock of economic importance.
The technical development of Norwegian vessels, gear and equipment has contributed to a fishing fleet capable of depleting most of the Norwegian fish stocks. To meet the challenge of overcapacity, various control systems, with the purpose of reducing the number of vessels, have been introduced. Today, a quota-transfer system called the Unit Quota System (UQS) has been implemented to the offshore fishing fleet; the larges
222 – CHAPTER 7 – NORWAY
USING MARKET MECHANISMS TO MANAGE FISHERIES: SMOOTHING THE PATH – ISBN-92-64-03657-1 © OECD 2006
coastal vessels have a Structural Quota System (SQS), and the smaller coastal vessel have a partly user-paid decommissioning scheme.
The fourth section focuses on Norway’s experiences with these market-like instruments through a description of how the systems has fared. The UQS has led to a 27% reduction in the cod trawler fleet since 2000, and a 12% reduction in the purse seiner fleet in the same period. UQS has decreased the number of long liners more than 28 meters (long liners) by 52% over the last four years. The SQS was introduced in 2004, and it is at present too early to say anything about the effects. However, an analysis of the coastal fleet indicates overcapacity also in this segment, and the SQS is expected to have a positive effect on this situation.
The fifth section focuses on the reform process towards the current situation and how stakeholders have dealt with the changes and cooperated in introducing these instruments.
A fleet composed of a variety of sizes has created challenges in designing efficient instruments to manage fleet overcapacity. For Norway, the key to overcome these challenges has been continuous and efficient cooperation between the authorities and the stakeholders.
1. Introduction
The waters of the Norwegian coast benefit from an up-welling system that makes the banks one of the most productive coastal marine areas in the world. This has provided Norway with rich fisheries, which throughout history have been of great importance both as a source of livelihood to the coastal population, as well as a major source of export revenue to the nation. The fishing sector is still a strong contributor to settlement and income for the people living along the western and northern coasts of Norway; even though the Norwegian oil production during the last 20 years have been the main contributor to the Norwegian economy.
The fisheries sector has played a major role in the development of the Norwegian society, and has consequently also played a major role in national politics. A strong coastal culture has developed based on local exploitation of the fish resources, as well as the nationally agreed policy that the fisheries sector shall contribute to the settlement in the coastal areas.
The regulatory choices Norway has made have to be viewed against this background, taking into account that the main objective of the Norwegian Government fisheries policy is to maximise profits through an economically efficient use of the resources by seeking the highest possible rate of return from the fisheries sector. Consequently, the policy shall also ensure socio-economic optimisation with respect to the total gain for the communities along the Norwegian coast. The Norwegian fisheries sector still plays an important role in the Norwegian government’s overall policy to maintain the settlement structure in the coastal communities, and especially in the northern part of Norway.
The Norwegian fleet structure is twofold, with the coastal and offshore sectors existing side by side. In addition to differences in technology, operational patterns and ownership structure, the two fleet segments were historically subject to very different regulatory regimes. While the coastal fisheries remained an open access fishery, the trawler fleet was subject to strict access control from the start. The coastal fleet had no access limitations before the Atlantic Cod crisis of 1989/90.
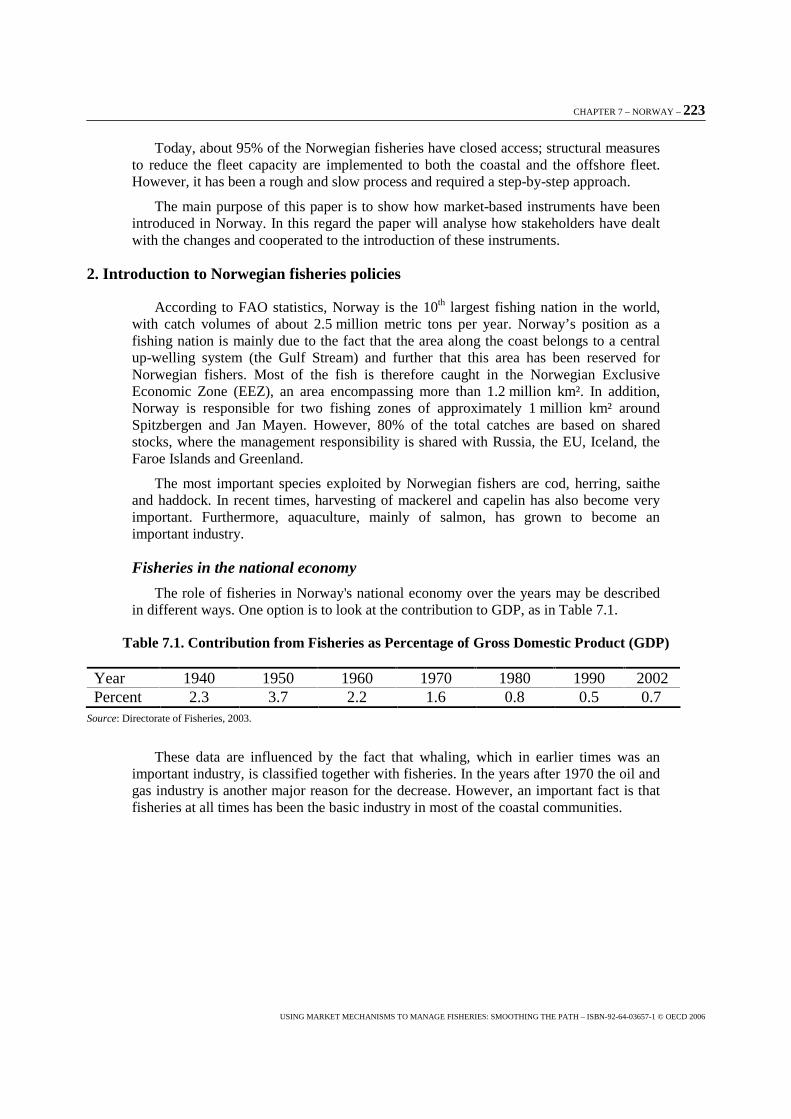
CHAPTER 7 – NORWAY – 223
USING MARKET MECHANISMS TO MANAGE FISHERIES: SMOOTHING THE PATH – ISBN-92-64-03657-1 © OECD 2006
Today, about 95% of the Norwegian fisheries have closed access; structural measures to reduce the fleet capacity are implemented to both the coastal and the offshore fleet. However, it has been a rough and slow process and required a step-by-step approach.
The main purpose of this paper is to show how market-based instruments have been introduced in Norway. In this regard the paper will analyse how stakeholders have dealt with the changes and cooperated to the introduction of these instruments.
2. Introduction to Norwegian fisheries policies
According to FAO statistics, Norway is the 10th largest fishing nation in the world, with catch volumes of about 2.5 million metric tons per year. Norway’s position as a fishing nation is mainly due to the fact that the area along the coast belongs to a central up-welling system (the Gulf Stream) and further that this area has been reserved for Norwegian fishers. Most of the fish is therefore caught in the Norwegian Exclusive Economic Zone (EEZ), an area encompassing more than 1.2 million km². In addition, Norway is responsible for two fishing zones of approximately 1 million km² around Spitzbergen and Jan Mayen. However, 80% of the total catches are based on shared stocks, where the management responsibility is shared with Russia, the EU, Iceland, the Faroe Islands and Greenland.
The most important species exploited by Norwegian fishers are cod, herring, saithe and haddock. In recent times, harvesting of mackerel and capelin has also become very important. Furthermore, aquaculture, mainly of salmon, has grown to become an important industry.
Fisheries in the national economy
The role of fisheries in Norway's national economy over the years may be described in different ways. One option is to look at the contribution to GDP, as in Table 7.1.
Table 7.1. Contribution from Fisheries as Percentage of Gross Domestic Product (GDP)
Year 1940 1950 1960 1970 1980 1990 2002 Percent 2.3 3.7 2.2 1.6 0.8 0.5 0.7
Source: Directorate of Fisheries, 2003.
These data are influenced by the fact that whaling, which in earlier times was an important industry, is classified together with fisheries. In the years after 1970 the oil and gas industry is another major reason for the decrease. However, an important fact is that fisheries at all times has been the basic industry in most of the coastal communities.
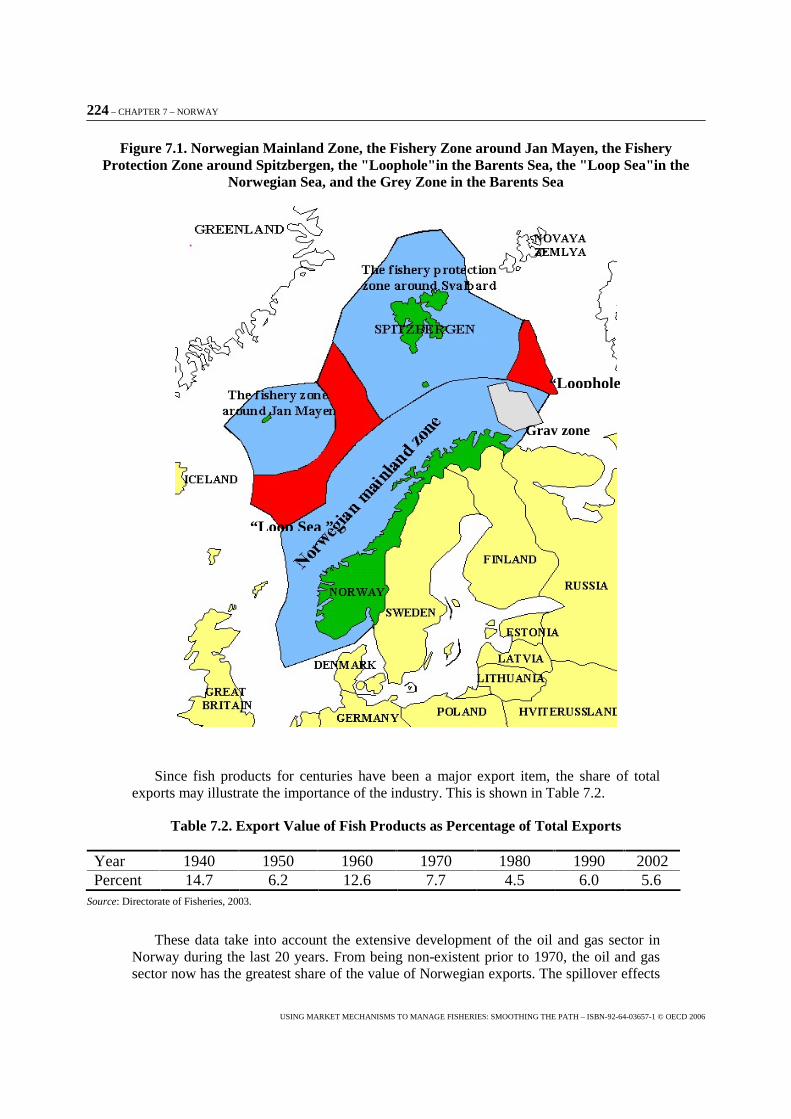
224 – CHAPTER 7 – NORWAY
USING MARKET MECHANISMS TO MANAGE FISHERIES: SMOOTHING THE PATH – ISBN-92-64-03657-1 © OECD 2006
Figure 7.1. Norwegian Mainland Zone, the Fishery Zone around Jan Mayen, the Fishery Protection Zone around Spitzbergen, the "Loophole"in the Barents Sea, the "Loop Sea"in the
Norwegian Sea, and the Grey Zone in the Barents Sea
Since fish products for centuries have been a major export item, the share of total exports may illustrate the importance of the industry. This is shown in Table 7.2.
Table 7.2. Export Value of Fish Products as Percentage of Total Exports
Year 1940 1950 1960 1970 1980 1990 2002 Percent 14.7 6.2 12.6 7.7 4.5 6.0 5.6
Source: Directorate of Fisheries, 2003.
These data take into account the extensive development of the oil and gas sector in Norway during the last 20 years. From being non-existent prior to 1970, the oil and gas sector now has the greatest share of the value of Norwegian exports. The spillover effects
Gray zone
“Loophole
“Loop Sea ”
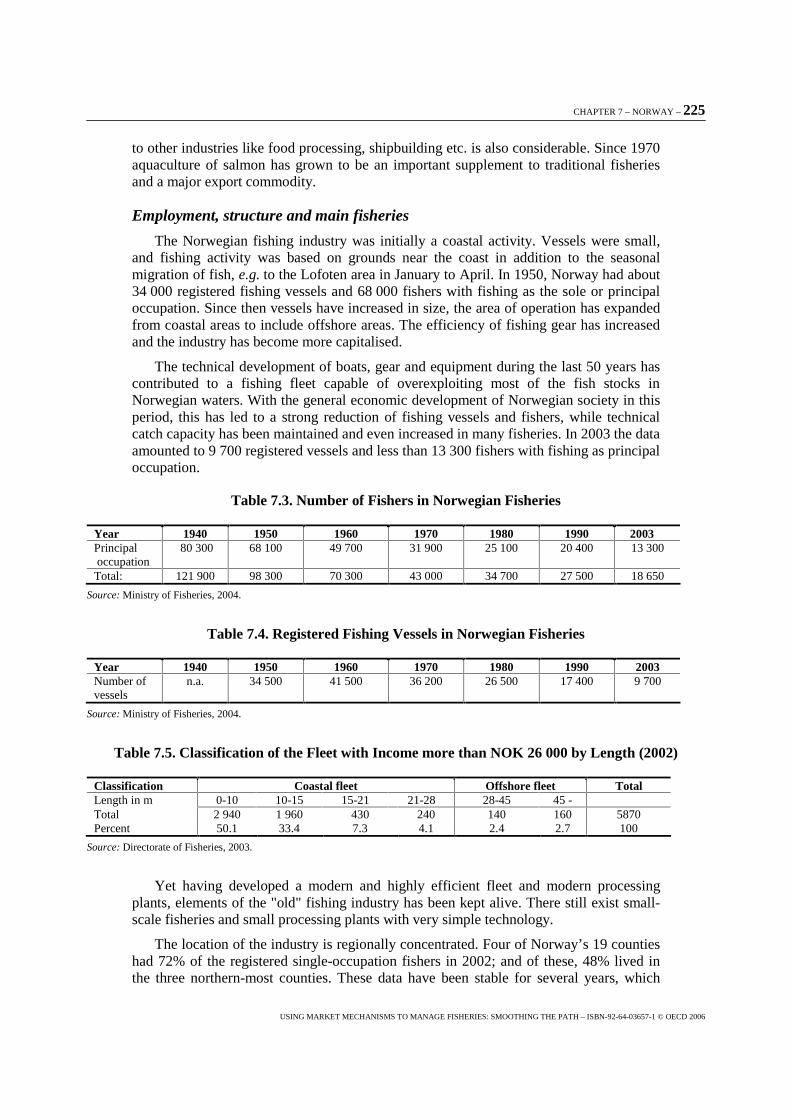
CHAPTER 7 – NORWAY – 225
USING MARKET MECHANISMS TO MANAGE FISHERIES: SMOOTHING THE PATH – ISBN-92-64-03657-1 © OECD 2006
to other industries like food processing, shipbuilding etc. is also considerable. Since 1970 aquaculture of salmon has grown to be an important supplement to traditional fisheries and a major export commodity.
Employment, structure and main fisheries
The Norwegian fishing industry was initially a coastal activity. Vessels were small, and fishing activity was based on grounds near the coast in addition to the seasonal migration of fish, e.g. to the Lofoten area in January to April. In 1950, Norway had about 34 000 registered fishing vessels and 68 000 fishers with fishing as the sole or principal occupation. Since then vessels have increased in size, the area of operation has expanded from coastal areas to include offshore areas. The efficiency of fishing gear has increased and the industry has become more capitalised.
The technical development of boats, gear and equipment during the last 50 years has contributed to a fishing fleet capable of overexploiting most of the fish stocks in Norwegian waters. With the general economic development of Norwegian society in this period, this has led to a strong reduction of fishing vessels and fishers, while technical catch capacity has been maintained and even increased in many fisheries. In 2003 the data amounted to 9 700 registered vessels and less than 13 300 fishers with fishing as principal occupation.
Table 7.3. Number of Fishers in Norwegian Fisheries
Year 1940 1950 1960 1970 1980 1990 2003 Principal occupation
80 300 68 100 49 700 31 900 25 100 20 400 13 300
Total: 121 900 98 300 70 300 43 000 34 700 27 500 18 650
Source: Ministry of Fisheries, 2004.
Table 7.4. Registered Fishing Vessels in Norwegian Fisheries
Year 1940 1950 1960 1970 1980 1990 2003 Number of vessels
n.a. 34 500 41 500 36 200 26 500 17 400 9 700
Source: Ministry of Fisheries, 2004.
Table 7.5. Classification of the Fleet with Income more than NOK 26 000 by Length (2002)
Classification Coastal fleet Offshore fleet Total Length in m 0-10 10-15 15-21 21-28 28-45 45 - Total 2 940 1 960 430 240 140 160 5870 Percent 50.1 33.4 7.3 4.1 2.4 2.7 100
Source: Directorate of Fisheries, 2003.
Yet having developed a modern and highly efficient fleet and modern processing plants, elements of the "old" fishing industry has been kept alive. There still exist small-scale fisheries and small processing plants with very simple technology.
The location of the industry is regionally concentrated. Four of Norway’s 19 counties had 72% of the registered single-occupation fishers in 2002; and of these, 48% lived in the three northern-most counties. These data have been stable for several years, which
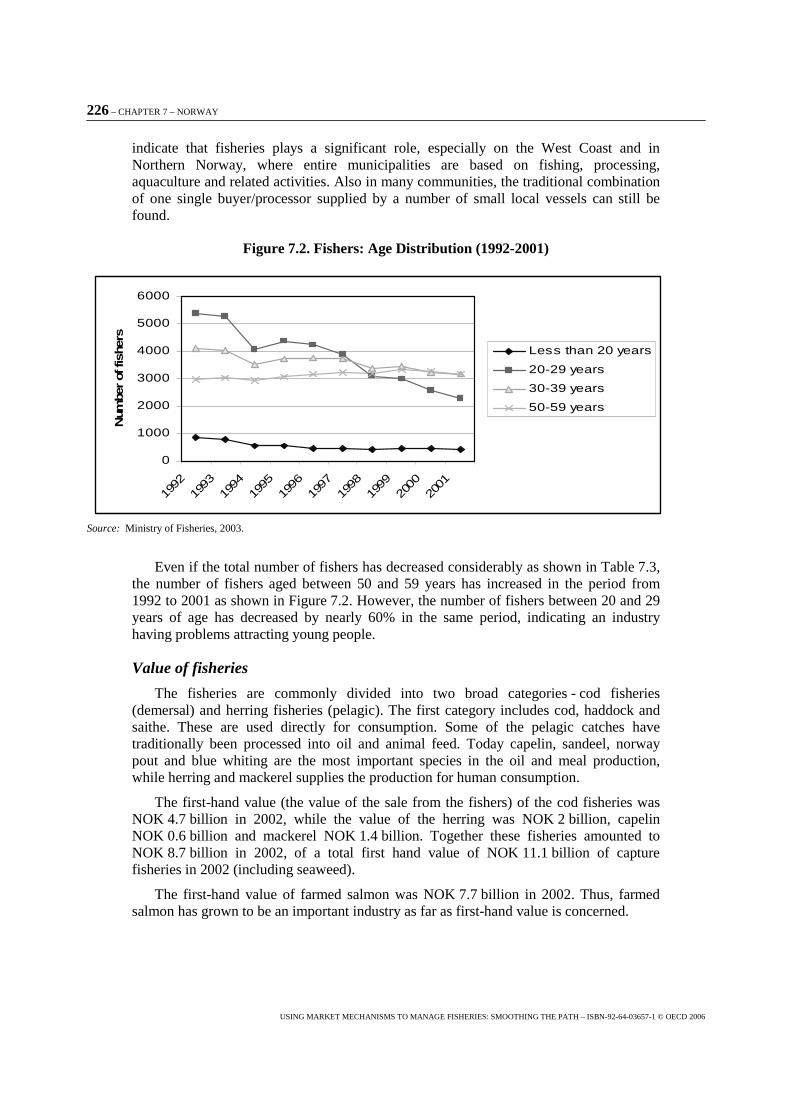
226 – CHAPTER 7 – NORWAY
USING MARKET MECHANISMS TO MANAGE FISHERIES: SMOOTHING THE PATH – ISBN-92-64-03657-1 © OECD 2006
indicate that fisheries plays a significant role, especially on the West Coast and in Northern Norway, where entire municipalities are based on fishing, processing, aquaculture and related activities. Also in many communities, the traditional combination of one single buyer/processor supplied by a number of small local vessels can still be found.
Figure 7.2. Fishers: Age Distribution (1992-2001)
0
1000
2000
3000
4000
5000
6000
1992
1993
1994
1995
1996
1997
1998
1999
2000
2001
Num
ber of
fish
ers
Less than 20 years
20-29 years
30-39 years
50-59 years
Source: Ministry of Fisheries, 2003.
Even if the total number of fishers has decreased considerably as shown in Table 7.3, the number of fishers aged between 50 and 59 years has increased in the period from 1992 to 2001 as shown in Figure 7.2. However, the number of fishers between 20 and 29 years of age has decreased by nearly 60% in the same period, indicating an industry having problems attracting young people.
Value of fisheries
The fisheries are commonly divided into two broad categories - cod fisheries (demersal) and herring fisheries (pelagic). The first category includes cod, haddock and saithe. These are used directly for consumption. Some of the pelagic catches have traditionally been processed into oil and animal feed. Today capelin, sandeel, norway pout and blue whiting are the most important species in the oil and meal production, while herring and mackerel supplies the production for human consumption.
The first-hand value (the value of the sale from the fishers) of the cod fisheries was NOK 4.7 billion in 2002, while the value of the herring was NOK 2 billion, capelin NOK 0.6 billion and mackerel NOK 1.4 billion. Together these fisheries amounted to NOK 8.7 billion in 2002, of a total first hand value of NOK 11.1 billion of capture fisheries in 2002 (including seaweed).
The first-hand value of farmed salmon was NOK 7.7 billion in 2002. Thus, farmed salmon has grown to be an important industry as far as first-hand value is concerned.
CHAPTER 7 – NORWAY – 227
USING MARKET MECHANISMS TO MANAGE FISHERIES: SMOOTHING THE PATH – ISBN-92-64-03657-1 © OECD 2006
Status of fish stocks
Stock sizes have also shown extensive variation over the years. The stock of Norwegian Spring Spawning herring collapsed after strong fishing pressure in the 1960s. The fishery was stopped in 1970, in an effort to build up the stock again. That effort was successful, and fishing was resumed in the 1970s. At the moment the stock supports an annual yield of 700 000 to 1 000 000 metric tons, which must be considered a high yield from a historical perspective. Capelin in the Barents Sea and blue whiting has to a great extent replaced herring as the basis of the fish oil production. The stock of capelin in the Barents Sea shows great short-term variations, collapsing in 1986 and then again in 1993. It is believed that the fluctuations in the capelin stock in the Barents Sea are caused by interactions between sea mammals, cod and herring.
The stock of Atlantic Cod has also shown extensive variations, but less than for herring and capelin. There has been a long-term decline in the stock, but according to the latest stock assessments, the attempts in recent years to increase the stock by regulations seem to have achieved positive results.
At present, the resource situation for two of the most important species, Atlantic Cod and Norwegian Spring Spawning herring are better than it has been for a long time. For further information on the status of stocks, see Appendix 1, or statistics provided by the Institute of Marine Research (www.imr.com).
Resource management
The Norwegian model for sustainable marine resource management is based on certain key principles: sustainable harvesting, multi-species approach, adequate regulations and an efficient control and enforcement scheme. It is vital that these principles are accepted as legitimate by the fishers themselves, and the stakeholders are therefore involved in the regulation process.
The regulation processes start with quota recommendations given by the International Council for Exploration of the Sea (ICES). Before the negotiations between Norway and other states take place, scientists from different countries perform their research and studies, and the results are discussed in Working Groups inside the ICES system. After ICES has given its quota recommendations, the quota negotiations between Norway and other states take place.
During the negotiations, the Parties agree upon the Total Allowable Catch (TAC) separately for each fish stock for the coming year. The Parties also agree upon how the TAC should be shared between the Parties. When setting the TAC, the Parties have to take into account the objectives of economic sustainability, stable conditions for the industry and other social and economic aspects, in addition to biological sustainability.
The Parties also discuss and agree upon other common issues related to the management of the different fish stocks, thereby monitoring the fisheries to make sure that the industry follows the rules of how the fishing is supposed to be undertaken.
In the national regulation process, the Directorate of Fisheries first makes a proposal regarding how the Norwegian part of the TAC should be shared. Experiences gathered throughout the year are taken into account, and proposals are then made and given to an “Advisory Board for Fisheries Regulations”. This Advisory Board includes twelve participants:
� Norwegian Fishermen’s Association (5 members)
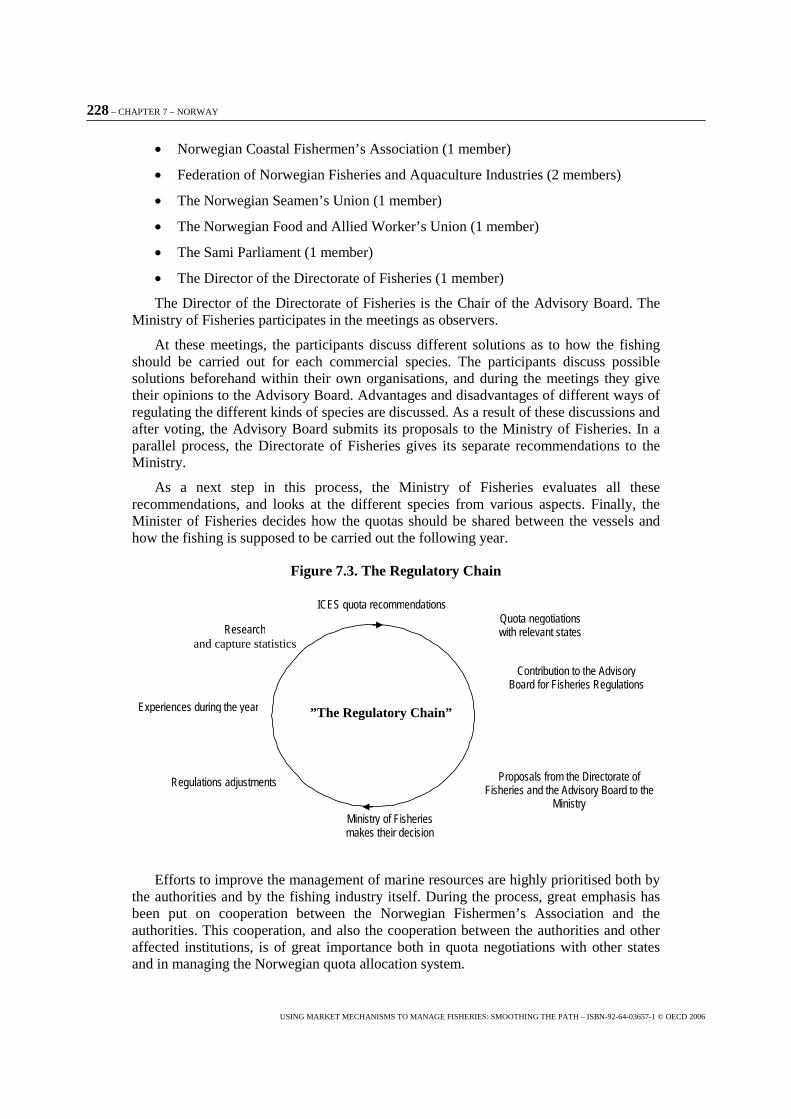
228 – CHAPTER 7 – NORWAY
USING MARKET MECHANISMS TO MANAGE FISHERIES: SMOOTHING THE PATH – ISBN-92-64-03657-1 © OECD 2006
� Norwegian Coastal Fishermen’s Association (1 member)
� Federation of Norwegian Fisheries and Aquaculture Industries (2 members)
� The Norwegian Seamen’s Union (1 member)
� The Norwegian Food and Allied Worker’s Union (1 member)
� The Sami Parliament (1 member)
� The Director of the Directorate of Fisheries (1 member)
The Director of the Directorate of Fisheries is the Chair of the Advisory Board. The Ministry of Fisheries participates in the meetings as observers.
At these meetings, the participants discuss different solutions as to how the fishing should be carried out for each commercial species. The participants discuss possible solutions beforehand within their own organisations, and during the meetings they give their opinions to the Advisory Board. Advantages and disadvantages of different ways of regulating the different kinds of species are discussed. As a result of these discussions and after voting, the Advisory Board submits its proposals to the Ministry of Fisheries. In a parallel process, the Directorate of Fisheries gives its separate recommendations to the Ministry.
As a next step in this process, the Ministry of Fisheries evaluates all these recommendations, and looks at the different species from various aspects. Finally, the Minister of Fisheries decides how the quotas should be shared between the vessels and how the fishing is supposed to be carried out the following year.
Figure 7.3. The Regulatory Chain
”The Regulatory Chain”
Research and capture statistics
ICES quota recommendations Quota negotiations with relevant states
Contribution to the Advisory Board for Fisheries Regulations
Proposals from the Directorate of Fisheries and the Advisory Board to the
Ministry Ministry of Fisheries makes their decision
Regulations adjustments
Experiences during the year
Efforts to improve the management of marine resources are highly prioritised both by the authorities and by the fishing industry itself. During the process, great emphasis has been put on cooperation between the Norwegian Fishermen’s Association and the authorities. This cooperation, and also the cooperation between the authorities and other affected institutions, is of great importance both in quota negotiations with other states and in managing the Norwegian quota allocation system.
CHAPTER 7 – NORWAY – 229
USING MARKET MECHANISMS TO MANAGE FISHERIES: SMOOTHING THE PATH – ISBN-92-64-03657-1 © OECD 2006
Fisheries co-operation with other countries in the North Atlantic
The marine ecosystem has to be seen as a comprehensive whole, and the utilisation of the different species must reflect the interrelationship between species. The aim of the Norwegian management policy encompasses both the commercial harvesting of a large variety of species, and at the same time the objective to maintain them at safe biological levels. As more than 80 per cent of the Norwegian fisheries derive from shared stocks, the Norwegian management objectives can only be achieved in close co-operation with the other North Atlantic fisheries nations.
The establishment of the EEZ of 200 nautical miles in the late 1970s required new forms of international fisheries co-operation, since most important fish stocks were shared between two or more coastal states. Thus, fisheries agreements were concluded with Norway’s two main collaborators in the management of the resources in the Barents Sea and the North Sea; Russia and the European Union, respectively. In addition, agreements were concluded with the Faroe Islands and Greenland to enable a balanced exchange of fish quotas to help maintain traditional fishing patterns. An agreement regulating the fishery on the joint capelin stock in the Iceland/Greenland/Jan Mayen area has later been concluded with Iceland and Greenland.
Following the development in joint regional management of high seas resources, based on the UN-agreement on straddling fish stocks and highly migratory fish stocks, a coastal state agreement between Norway, Russia, EU, Iceland and the Faroe Islands has been concluded on the management of the Norwegian Spring Spawning Herring. Included in this agreement is a regime for the fishing on this stock in international waters, negotiated within the framework of the North East Atlantic Fisheries Commission (NEAFC). A similar regime on the North Atlantic Mackerel stock, between Norway, EU and Faroe Islands has also been adopted. In addition, Norway and Russia have recently adopted long-term management plans for the stocks of Atlantic Cod and North Atlantic Haddock.
Norway and Russia have over the past decades developed an extensive co-operation to ensure rational and responsible management based on joint measures. Importantly, the management of joint resources requires the same routines and efforts regarding monitoring and control. In this respect, close co-operation has been developed between the Norwegian and Russian control authorities, and a system of continuous exchange of data on catches and landings in Norwegian ports has been established. Close contact has also been established at sea between the two countries’ Coast Guards. A joint effort made by Norway and Russia in the management of the resources in the Barents Sea has proved fruitful, providing for an extensive and practical common approach to resolve new problems.
The major challenge in the fisheries cooperation with the European Union is to rebuild major stocks in the North Sea to sustainable levels. Norway and the European Union have both adopted comprehensive regulations and measures to control fishing activities and to promote rational exploitation of fish resources. However, the principle of sustainable management and exploitation is applied differently in some important areas. For instance, Norway has introduced a ban on discards, based on the notion that all catches should be accounted for and deducted from the quotas in order to control the outtake of each particular fish stock. The European Union on the other hand, has mandatory discard of fish outside the quotas as a central element of their management regime.
230 – CHAPTER 7 – NORWAY
USING MARKET MECHANISMS TO MANAGE FISHERIES: SMOOTHING THE PATH – ISBN-92-64-03657-1 © OECD 2006
3. Norwegian management regime
The technological development of the Norwegian fishing fleet proved early on that imposing regulations to the fishing fleet was necessary. Already in 1908, the first restriction on fishing activities was established. This was the so-called “trawler act”, which encompassed a prohibition against fishing with trawl within the Norwegian territorial zone. The first law regulating access to the fisheries came in 1932 when a licence system for the trawler fleet was implemented. Since these first regulations, directed at restricting the development of trawling in the demersal sector of the Norwegian fisheries, a number of different regulations have been enacted aiming at protecting the fish stocks from overexploitation and sustaining the right to exploit these resources with the fishers.
Commercial fisheries in Norway are restricted through regulatory and legal instruments, with the aim to keep the stock productivity high and to control the individual access to the resource. To manage catch capacity to a level that is commensurate with the resource’s natural productivity, there has been established a number of regulations with the purpose of reducing catch capacity.
The first part of this section will address the regulatory instruments, categorising the measures as input and output control systems. To illustrate the combination of regulatory instruments applied, the Atlantic Cod fishery is used as an example. To meet the challenge of finding a balance between resource productivity and fleet capacity various set of management systems have been developed and implemented. This is addressed in the second part of the chapter.
Regulatory instruments to maintaining stock productivity
In general, management instruments aim to maintain the productivity and reproductive capacity of stocks, and allocate the limited productive potential of the stock to the various fishing firms that can exploit it. The instruments needed to manage a fishery have been divided into input controls, output controls and technical measures. Input controls constrain the inputs used to produce catch e.g. licenses, gear and vessels restrictions. Output controls constrain the catch of the fleet e.g. catch limits. Technical measures constrain the output that can be obtained by a given amount of inputs e.g. selectivity, and time- and area closure. Technical measures will not be addressed in this study.
Input control systems
The Norwegian input control system relates to vessels allowed to join the various fisheries and to who is allowed to own fishing vessels.
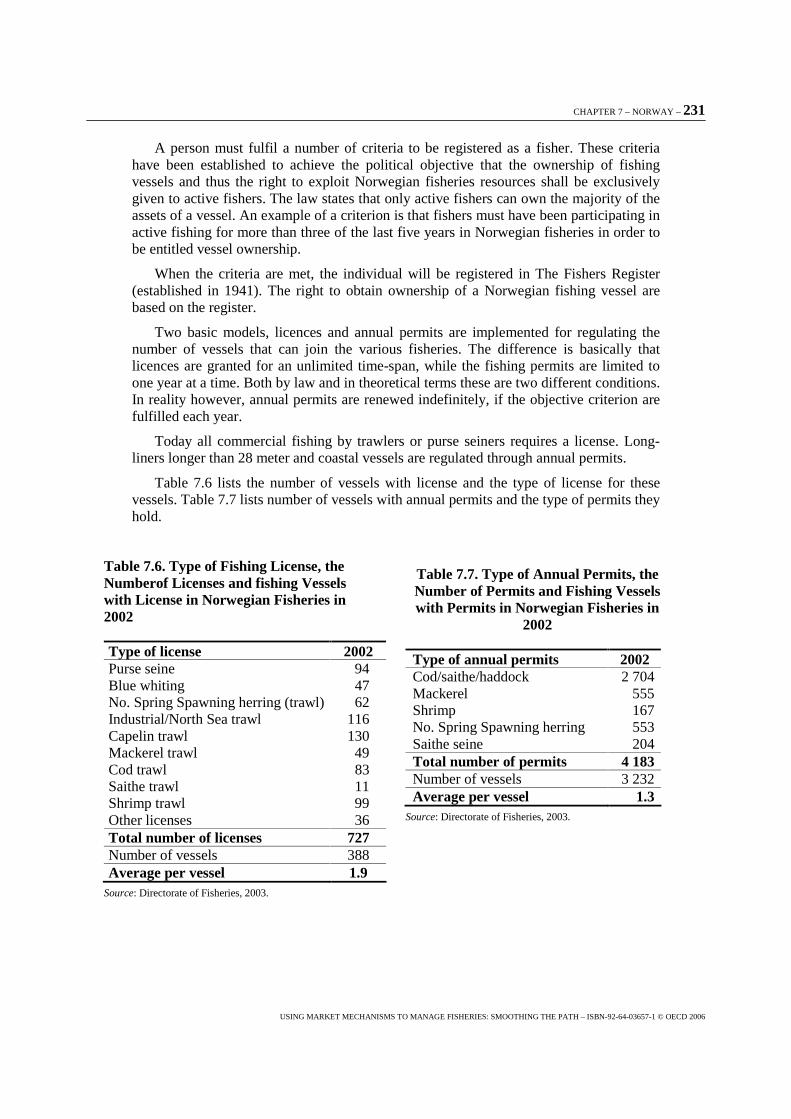
CHAPTER 7 – NORWAY – 231
USING MARKET MECHANISMS TO MANAGE FISHERIES: SMOOTHING THE PATH – ISBN-92-64-03657-1 © OECD 2006
A person must fulfil a number of criteria to be registered as a fisher. These criteria have been established to achieve the political objective that the ownership of fishing vessels and thus the right to exploit Norwegian fisheries resources shall be exclusively given to active fishers. The law states that only active fishers can own the majority of the assets of a vessel. An example of a criterion is that fishers must have been participating in active fishing for more than three of the last five years in Norwegian fisheries in order to be entitled vessel ownership.
When the criteria are met, the individual will be registered in The Fishers Register (established in 1941). The right to obtain ownership of a Norwegian fishing vessel are based on the register.
Two basic models, licences and annual permits are implemented for regulating the number of vessels that can join the various fisheries. The difference is basically that licences are granted for an unlimited time-span, while the fishing permits are limited to one year at a time. Both by law and in theoretical terms these are two different conditions. In reality however, annual permits are renewed indefinitely, if the objective criterion are fulfilled each year.
Today all commercial fishing by trawlers or purse seiners requires a license. Long-liners longer than 28 meter and coastal vessels are regulated through annual permits.
Table 7.6 lists the number of vessels with license and the type of license for these vessels. Table 7.7 lists number of vessels with annual permits and the type of permits they hold.
Table 7.6. Type of Fishing License, the Numberof Licenses and fishing Vessels with License in Norwegian Fisheries in 2002
Type of license 2002 Purse seine 94 Blue whiting 47 No. Spring Spawning herring (trawl) 62 Industrial/North Sea trawl 116 Capelin trawl 130 Mackerel trawl 49 Cod trawl 83 Saithe trawl 11 Shrimp trawl 99 Other licenses 36 Total number of licenses 727 Number of vessels 388 Average per vessel 1.9
Source: Directorate of Fisheries, 2003.
Table 7.7. Type of Annual Permits, the Number of Permits and Fishing Vessels with Permits in Norwegian Fisheries in
2002
Type of annual permits 2002 Cod/saithe/haddock 2 704 Mackerel 555 Shrimp 167 No. Spring Spawning herring 553 Saithe seine 204 Total number of permits 4 183 Number of vessels 3 232 Average per vessel 1.3
Source: Directorate of Fisheries, 2003.
CHAPTER 7 – NORWAY – 232
USING MARKET MECHANISMS TO MANAGE FISHERIES: SMOOTHING THE PATH – ISBN-92-64-03657-1 © OECD 2006
As indicated in Tables 7.6 and 7.7, a particular vessel may hold several different types of licenses or annual permits.
As of today, only minor fisheries are not regulated by either licences or annual permits. Closed access prevails for all important economic fisheries, and approximately 95% of the catch value comes from access-regulated fisheries.
Output control systems
The overall objectives are to provide for sustainable development and long-term optimal use of the living marine resources. This implies that catch of any TAC-regulated species is not to exceed the agreed quotas based on the best biological advice available.
Norwegian conservation philosophy stipulates that all regulations and corresponding enforcement should be directed towards the fishing activities themselves. To catch fish below the required minimum size is prohibited, and a ban on discarding fish is established for all economically valuable species. In addition, to protect fishing grounds with too high intermixture of undersized fish, it is a requirement that vessels change fishing grounds if the mixtures of undersized fish exceed permitted levels. Another measure is the use of catch sorting devices, i.e. grids and mesh size.
In order to manage the different fisheries, an extensive system to control fishing activity and the fishing fleet has been established. There are three cornerstones in the control and enforcement system: the Coast Guard, the Directorate of Fisheries and the Sales Organisations. These ensure that every catch of individual specie is registered and settled against the quota for that particular stock.
Regulations are implemented on every stock of economic importance. In addition to regulating the fisheries inside the Norwegian Economic Zone, the Norwegian fisheries authorities also regulates the fishing activity of Norwegian vessels outside own EEZ, as a part of the fisheries agreements with other States. Foreign vessels fishing activity in Norwegian waters are regulated correspondingly.
The Norwegian part of the Total Allowable Catch (TAC) is divided into group-quotas. Each group quotas are then shared between vessels within the group. Each group are regulated either with Individual Vessel Quotas (IVQs) or maximum quotas. IVQs mainly regulate vessels holding a licence or an annual permit, and maximum quotas mainly regulate coastal vessels in the open access fisheries.
Within the system of IVQs, the group quota is shared among the participating vessels in fixed and – more or less – guaranteed portions. The sum of the allocated Individual Vessel Quotas equals the group quota.
Within the system of maximum quotas, an upper limit is set for the annual catches. Each maximum quota is “over-regulated”, as the sum of the allocated maximum quotas is higher than the group quota. The Directorate of Fisheries gets subsequent information about the landings, and closes the fishery for a certain species when the total group quota is estimated to have been caught. In this case, the participating vessels have no guarantee for how much they may catch of their quota share. On the other side, in situations where the participation in the fishery has been lower than expected, the over-regulation might be increased during the year to make sure that fishing persists until the group quota is caught.
The system with “over-regulation” is applied to vessel groups consisting of a large variety of vessels with different activity levels. Because of lower total quotas and an
CHAPTER 7 – NORWAY – 233
USING MARKET MECHANISMS TO MANAGE FISHERIES: SMOOTHING THE PATH – ISBN-92-64-03657-1 © OECD 2006
increase in vessel efficiency, the degree of the over-regulation has been lowered considerably during the recent years.
The various regulations provide specific rules on the implementation of the fisheries, and as a part of this, as mentioned, the division of the annual quota amongst the different vessel- and gear-groups. In addition there are rules pertaining to periodic regulations of outtake, by-catchrules, start- and stop-dates, and sanctions in the case of violations.
The industry has to comply with the regulations, even if they do not always agree with the decisions. This may lead to meetings and discussions with the Ministry in order to find alternative solutions. This consultation process has a long tradition in Norway. The cooperation between the authorities and different stakeholders has proved to be an important way to ensure legitimacy both in the industry and in the community at large.
The Atlantic Cod fisheries
The regulations implemented in the Atlantic Cod fisheries in 2004 can illustrate the combination of quota models applied in the Norwegian fisheries regulations.
As illustrated in Figure 7.4, the Norwegian Atlantic Cod quota is shared between two groups of vessels depending on their use of fishing gear: vessels fishing with traditional gear; and the trawler fleet. This corresponds fairly well to a division by length groups - the offshore fleet consisting vessels longer than 28 meters (trawlers and large long-liners) and the coastal fleet consisting of vessels less than 28 meters.
The coastal vessels are divided into to main groups: priority Group I, which are vessels bound with closed access and an annual permit; and Group II, which is an open access group. The Group I vessels are further divided into four length groups1, which each have a given share of the Group I quota.
Trawlers, long-liners and coastal vessels have Individual Vessel Quotas, while the open access group have maximum quotas.
As most fish stocks in Norwegian fisheries covered by the regulation system are migrating and intermingling, the application of the single species regulations has to be carefully designed. The large variation in the availability of the different fish species throughout the year and along the coast also has bearings on both the details of the regulations as well as on the fishing pattern and fishing opportunities for all vessel groups. The regulation also has to take the processing industry’s need for a stable supply throughout the year into considerations. As value-adding and maximum sustainable market output is the overall economic objective (within sustainable limits), regulations are aimed at contributing to that objective.
1 The so called “Finnmark model”, the implementation process is described in section 5.
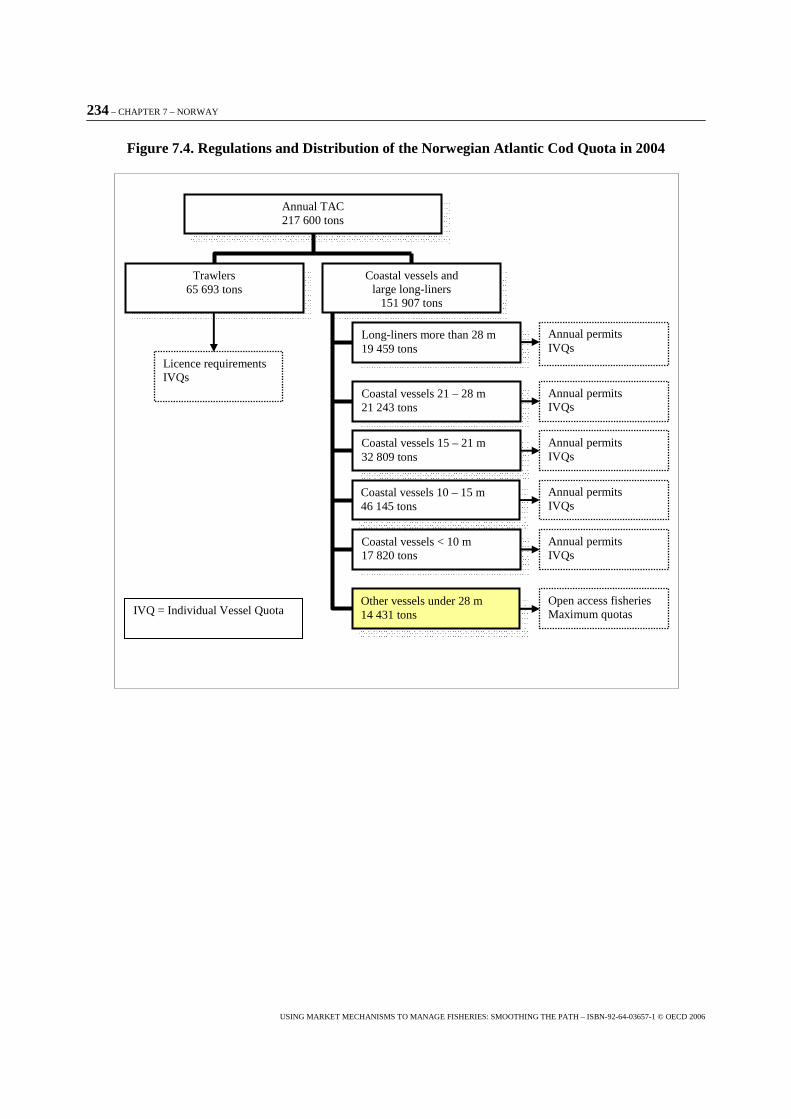
234 – CHAPTER 7 – NORWAY
USING MARKET MECHANISMS TO MANAGE FISHERIES: SMOOTHING THE PATH – ISBN-92-64-03657-1 © OECD 2006
Figure 7.4. Regulations and Distribution of the Norwegian Atlantic Cod Quota in 2004
Annual TAC 217 600 tons
Trawlers 65 693 tons
Coastal vessels and large long-liners
151 907 tons
Long-liners more than 28 m 19 459 tons
Coastal vessels 21 – 28 m 21 243 tons
Coastal vessels 15 – 21 m 32 809 tons
Coastal vessels 10 – 15 m 46 145 tons
Coastal vessels < 10 m 17 820 tons
Other vessels under 28 m 14 431 tons
Annual permits IVQs
Open access fisheries Maximum quotas
Annual permits IVQs
Licence requirements IVQs
Annual permits IVQs
Annual permits IVQs
Annual permits IVQs
IVQ = Individual Vessel Quota
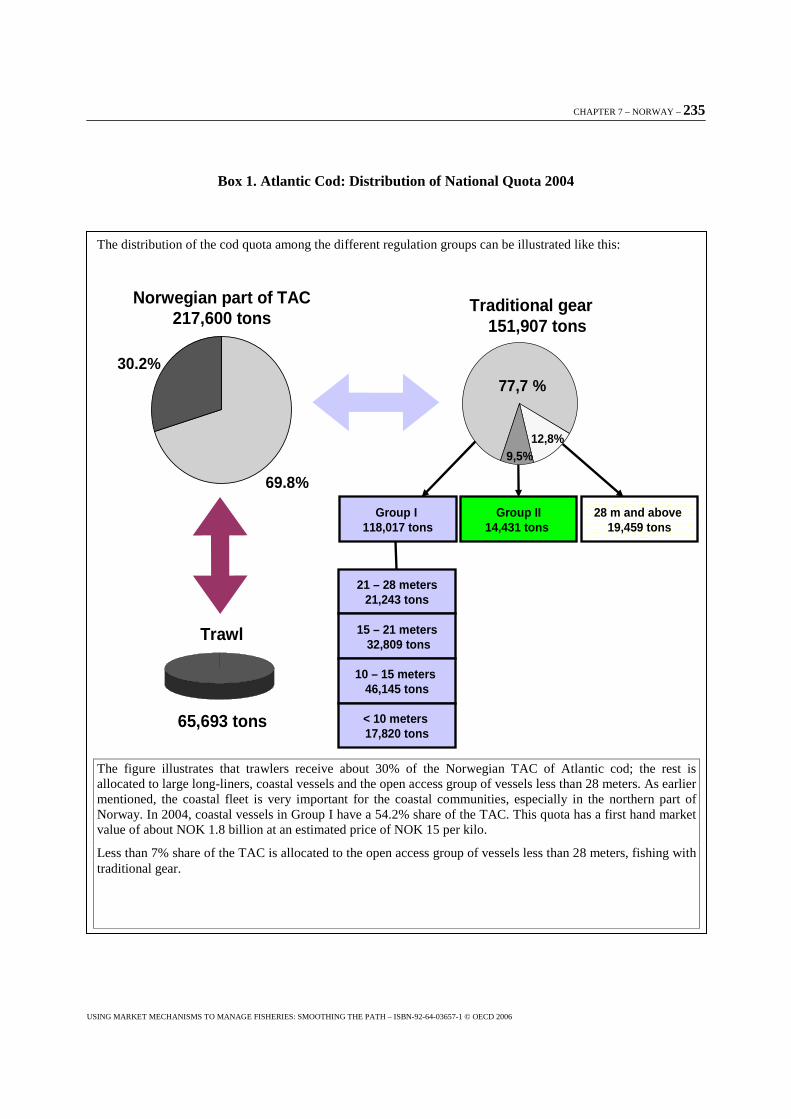
CHAPTER 7 – NORWAY – 235
USING MARKET MECHANISMS TO MANAGE FISHERIES: SMOOTHING THE PATH – ISBN-92-64-03657-1 © OECD 2006
Box 1. Atlantic Cod: Distribution of National Quota 2004
The distribution of the cod quota among the different regulation groups can be illustrated like this:
Traditional gear151,907 tons
Havfiskeflåten
Norwegian part of TAC217,600 tons
Group I 118,017 tons
28 m and above19,459 tons
Trawl
65,693 tons
Group II14,431 tons
21 – 28 meters 21,243 tons
15 – 21 meters32,809 tons
10 – 15 meters 46,145 tons
< 10 meters 17,820 tons
77,7 %
12,8%9,5%
30.2%
69.8%
The figure illustrates that trawlers receive about 30% of the Norwegian TAC of Atlantic cod; the rest is allocated to large long-liners, coastal vessels and the open access group of vessels less than 28 meters. As earlier mentioned, the coastal fleet is very important for the coastal communities, especially in the northern part of Norway. In 2004, coastal vessels in Group I have a 54.2% share of the TAC. This quota has a first hand market value of about NOK 1.8 billion at an estimated price of NOK 15 per kilo.
Less than 7% share of the TAC is allocated to the open access group of vessels less than 28 meters, fishing with traditional gear.
236 – CHAPTER 7 – NORWAY
USING MARKET MECHANISMS TO MANAGE FISHERIES: SMOOTHING THE PATH – ISBN-92-64-03657-1 © OECD 2006
Regulatory instruments to manage overcapacity
Overcapacity has until recently been contained by redirecting surplus capacity towards new resources and new fishing grounds. Such expansion is today not possible. It is generally recognised that current fishing capacity in the Norwegian fishing fleet exceeds the available fisheries resources. The technical development of vessels, gear and equipment has contributed to a fishing fleet with a far too large capacity compared to most of the fish stocks. To meet the challenge of overcapacity, various control systems with the purpose of reducing the number of vessels, have been introduced in a step-by-step process throughout the last 15 to 20 years.
The main instruments used to reduce the number of vessels have been decommissioning schemes and a quota-transfer system implemented in the offshore fishing fleet. A new quota-transfer system has been developed and implemented to the coastal fleet from 2004, together with a partly user-paid decommissioning scheme for the smaller coastal vessels.
Quota-transfer systems implemented in the offshore fishing fleet
A quota-transfer system, of which the main purpose is to reduce the number of vessels and thus increase the income for each vessel, was first introduced in Norway in 1984 in part of the cod trawler fleet. The scheme was reintroduced in 1990 to include other groups, and then on a permanent basis from 1996. The scheme, called the Unit Quota System (UQS), is today implemented in all offshore fishing groups.
Initially, when the UQS was introduced, the number of vessel quotas was equal to the number of fishing vessels. The idea with the UQS is to make the members of a vessel group, where such a system has been applied, responsible for adjusting the fishing capacity to the available resources and thus secure higher profitability.
The system allows the owner of two vessels to transfer the quota of one vessel to another. The owner of a vessel will then control more than one quota for a period of 13 years, if the surplus vessel withdrawn from the fishing fleet is sold, and for 18 years if the surplus vessel is scrapped– the latter to contribute to the reduction of worldwide overcapacity.
Quota-transfer systems implemented to the coastal fishing fleet
A quota-transfer system designed for the coastal fleet was introduced in 2004. This new scheme enables vessels between 15 and 21 meters and between 21 and 28 meters to transfer quota from one vessel to another if one vessel is scrapped. A 20% part of the quota (held by the scrapped vessel) remains in the regulation group the vessel was withdrawn from. This scheme is named the Structural Quota System (SQS). To avoid geographical concentration of annual permits, SQS is subject to certain limitations.
The UQS scheme gives a vessel owner who has bought another vessel the possibility to fish both quotas with the remaining vessel for a period of 13 or 18 years. After this period, the additional quota goes back to the regulation group where the vessel once was withdrawn from 13 or 18 years earlier. The SQS system is quite similar, but differs since 80% of the additional quota is held in perpetuity. The 20% reduction goes back to the regulation group the scrapped vessel once belonged to. SQS is also subject to more limitations than UQS.
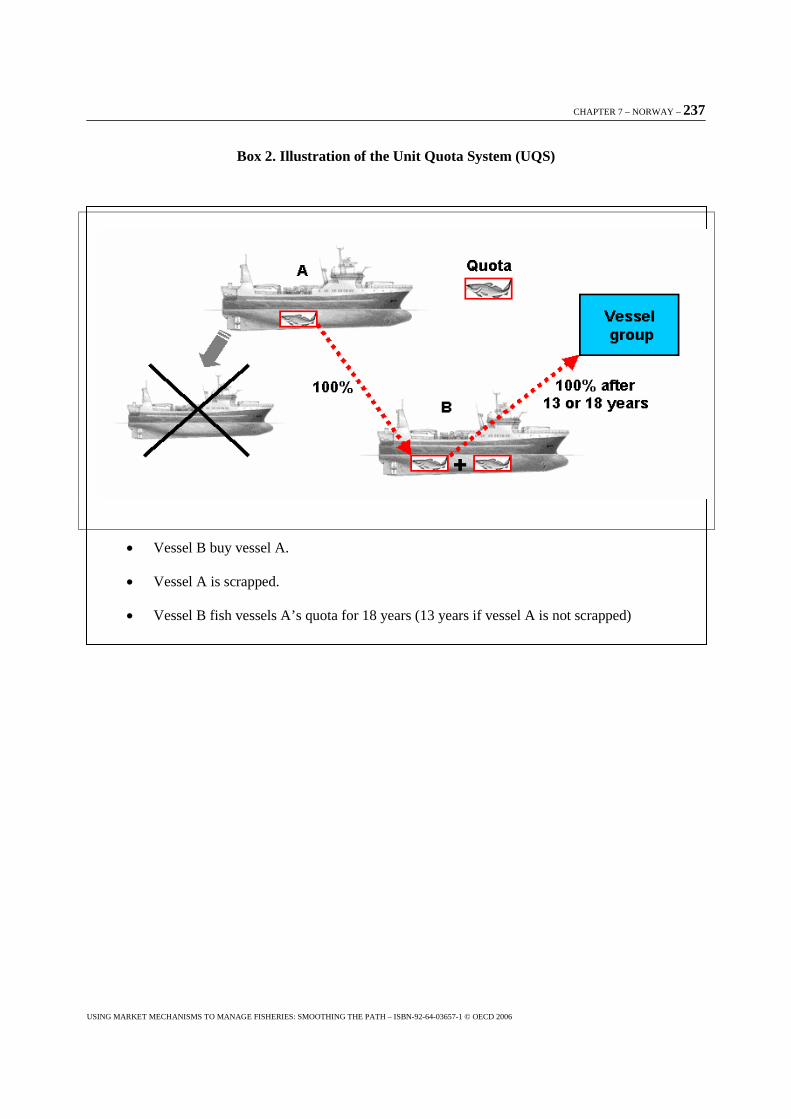
CHAPTER 7 – NORWAY – 237
USING MARKET MECHANISMS TO MANAGE FISHERIES: SMOOTHING THE PATH – ISBN-92-64-03657-1 © OECD 2006
Box 2. Illustration of the Unit Quota System (UQS)
� Vessel B buy vessel A.
� Vessel A is scrapped.
� Vessel B fish vessels A’s quota for 18 years (13 years if vessel A is not scrapped)
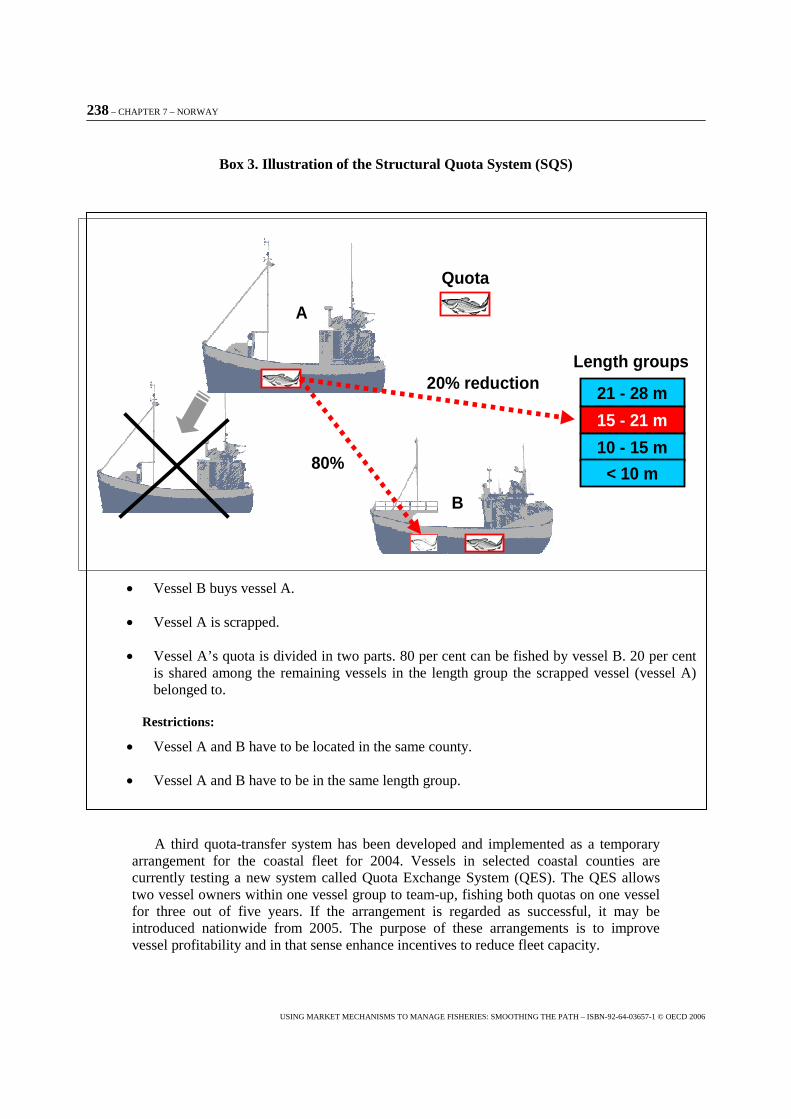
238 – CHAPTER 7 – NORWAY
USING MARKET MECHANISMS TO MANAGE FISHERIES: SMOOTHING THE PATH – ISBN-92-64-03657-1 © OECD 2006
Box 3. Illustration of the Structural Quota System (SQS)
A third quota-transfer system has been developed and implemented as a temporary arrangement for the coastal fleet for 2004. Vessels in selected coastal counties are currently testing a new system called Quota Exchange System (QES). The QES allows two vessel owners within one vessel group to team-up, fishing both quotas on one vessel for three out of five years. If the arrangement is regarded as successful, it may be introduced nationwide from 2005. The purpose of these arrangements is to improve vessel profitability and in that sense enhance incentives to reduce fleet capacity.
Quota
Length groups
80%
B
A
20% reduction 21 - 28 m
15 - 21 m
10 - 15 m
< 10 m
� Vessel B buys vessel A.
� Vessel A is scrapped.
� Vessel A’s quota is divided in two parts. 80 per cent can be fished by vessel B. 20 per cent is shared among the remaining vessels in the length group the scrapped vessel (vessel A) belonged to.
Restrictions:
� Vessel A and B have to be located in the same county.
� Vessel A and B have to be in the same length group.
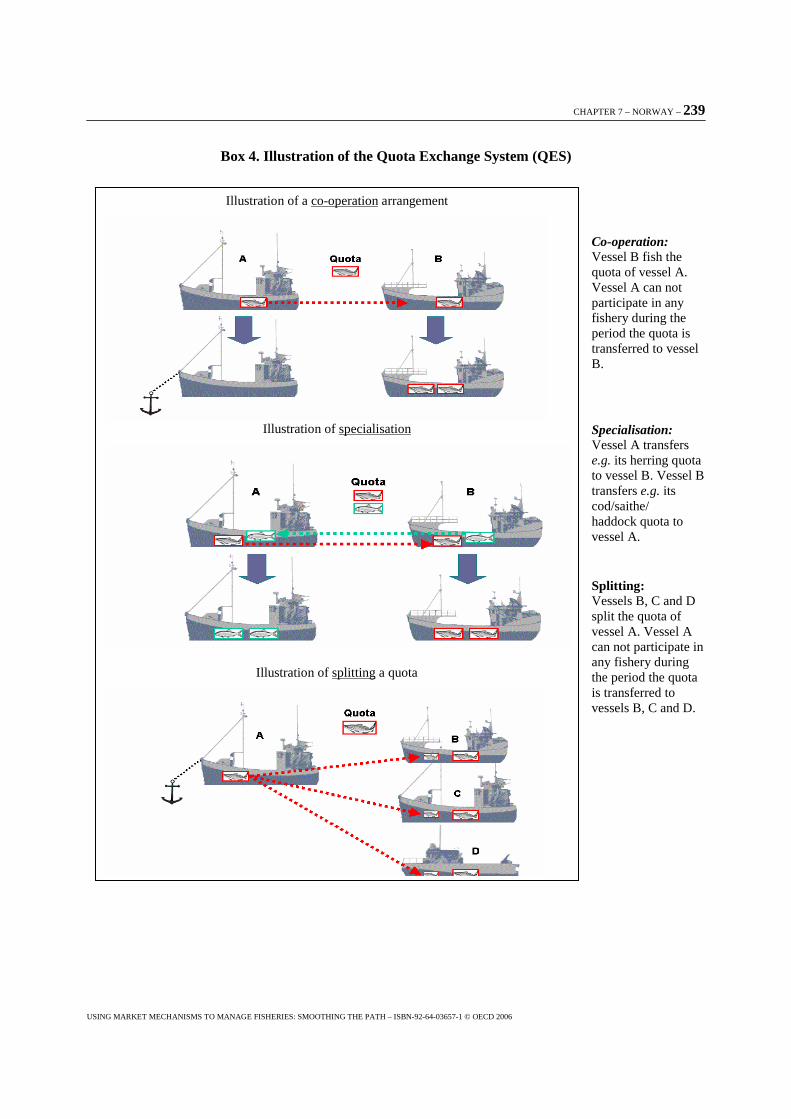
CHAPTER 7 – NORWAY – 239
USING MARKET MECHANISMS TO MANAGE FISHERIES: SMOOTHING THE PATH – ISBN-92-64-03657-1 © OECD 2006
Box 4. Illustration of the Quota Exchange System (QES)
Co-operation: Vessel B fish the quota of vessel A. Vessel A can not participate in any fishery during the period the quota is transferred to vessel B. Specialisation: Vessel A transfers e.g. its herring quota to vessel B. Vessel B transfers e.g. its cod/saithe/ haddock quota to vessel A. Splitting: Vessels B, C and D split the quota of vessel A. Vessel A can not participate in any fishery during the period the quota is transferred to vessels B, C and D.
Illustration of a co-operation arrangement
Illustration of specialisation
Illustration of splitting a quota
240 – CHAPTER 7 – NORWAY
USING MARKET MECHANISMS TO MANAGE FISHERIES: SMOOTHING THE PATH – ISBN-92-64-03657-1 © OECD 2006
Decommissioning schemes in the offshore fishing fleet
Norway also uses decommissioning schemes as an instrument to reduce the number of vessels in the offshore fleet. Various schemes have been in effect during 1960 to 1993. Approximately 400 vessels have been removed with decommissioning grants of approximately NOK 600 million.
Table 7.8. Decommission Scheme Designed for the Offshore Fishing Fleet (nominal price index)
Years 1960 - 1968 1969 – 1978 1978 – 1988 1990 - 1993 Total Scrapped 115 55 190 33 393 NOK (million) 15 11 470 96 592
Source: Ministry of Fisheries 2004
Decommissioning schemes in the offshore fishing fleet was most instrumental in reducing the number of purse seiners and trawlers. Between 1978 and 1988, 83 vessels were withdrawn from fisheries on the condition that the vessel was scrapped, reducing the group to 105 vessels in 1990.
Decommissioning schemes in the coastal fishing fleet
The first decommissioning scheme designed for the coastal fleet was established in 1960, and by 1988 about 2 800 vessels had been scrapped as a result of various schemes. From 1990 access to the coastal Atlantic Cod fishery was limited, and a decommissioning scheme (1990 to 1993) was directed at coastal vessels holding an annual permit. Owners of scrapped vessels had to give up the permits to fish. From 1998 to 2002, a new decommissioning scheme was established. The aim of this scheme was partly to reduce capacity, and partly to provide for modernisation of the coastal fleet without increasing the number of vessels. Two different components of the scheme were offered: a traditional decommissioning scheme; and a combined decommissioning scheme. In the first scheme, the annual permit(s) were withdrawn, and the vessel was scrapped. In the second scheme, when the vessel was scrapped and the annual permit(s) were withdrawn, new annual permit(s) were issued on a replacement-vessel (new-built or newer used vessel).
The Norwegian Government has spent approximately NOK 500 million over the years on decommissioning schemes designed for the coastal fleet, and about 3 000 vessels have been scrapped.
Restrictions: � Vessels A and B (C and D) have to be located in the same county. � Vessels A and B (C and D) have to be in the same length group. � Transfers of quota (s) have to be approved by the fisheries authorities. � QES can only be used three out of five years.
CHAPTER 7 – NORWAY – 241
USING MARKET MECHANISMS TO MANAGE FISHERIES: SMOOTHING THE PATH – ISBN-92-64-03657-1 © OECD 2006
Table 7.9. Decommission Scheme Designed for the Coastal Fleet (nominal price index)
Years 1960 - 1968 1969 – 1978 1978 – 1988 1990 - 1993 1998 - 2002 Total Scrapped + permits redrawn
1 760 540 490 143
53 44
2 843 187
NOK (million) 21 13 130 150 200 514
Source: Ministry of Fisheries, 2004.
Initially, the decommissioning scheme designed for the coastal fleet was both a modernisation and capacity reducing scheme. Today the aim is solely capacity reduction. Grants for constructing new vessels are no longer given.
A new fund for decommissioning of home-based fishing vessels up to 15 meters holding annual permit(s) was established on 1 July 2003. The scheme is funded through a fee on the value of first-hand landings of every Norwegian fishing vessel. The public sector gave a start capital to the fund, estimated to about 50% of the contribution from the industry. For 2004 the Government transferred NOK 35 million, which is just under 50% of the estimated contribution from the fishery sector in 2004. Further contribution from the Government is not guaranteed.
The statutory authority given by the Norwegian Parliament to impose a fee on the value of first-hand landings lasts for five years. The statutory authority thereafter disappears (sunset law). The aim is, within these five yeas, to collect about NOK 350 million for the fund, which would enable the scrapping of approximately 15% of the coastal fishing vessels less than 15 meters holding annual permit(s). With a 50% financial contribution from the Government, this will give a fee on the value of first-hand landing of 0.35% per NOK.
4. Market-based incentives systems implemented
Market-based instruments have been used over the last 15 to 20 years as part of the Norwegian management system to reduce the number of vessels in a certain vessel group where fishing capacity is considered to exceed current and future TACs. The Unit Quota System (UQS) has been introduced in the ocean-going part of the Norwegian fishing fleet and the Structural Quota System (SQS) is now covering the coastal fleet. Norway is also testing another market-based instrument in the Quota Exchange System (QES) for the coastal fleet. The following provides a description of the development of the schemes and examples of how the three systems have fared.
Experiences with the Unit Quota System (UQS)
The offshore fleet can roughly be divided into four groups.
1. Cod, saithe and shrimp trawlers, 2. the industrial trawlers, 3. purse seiners; and 4. large long-liners.
All of these four groups now have access to UQS.
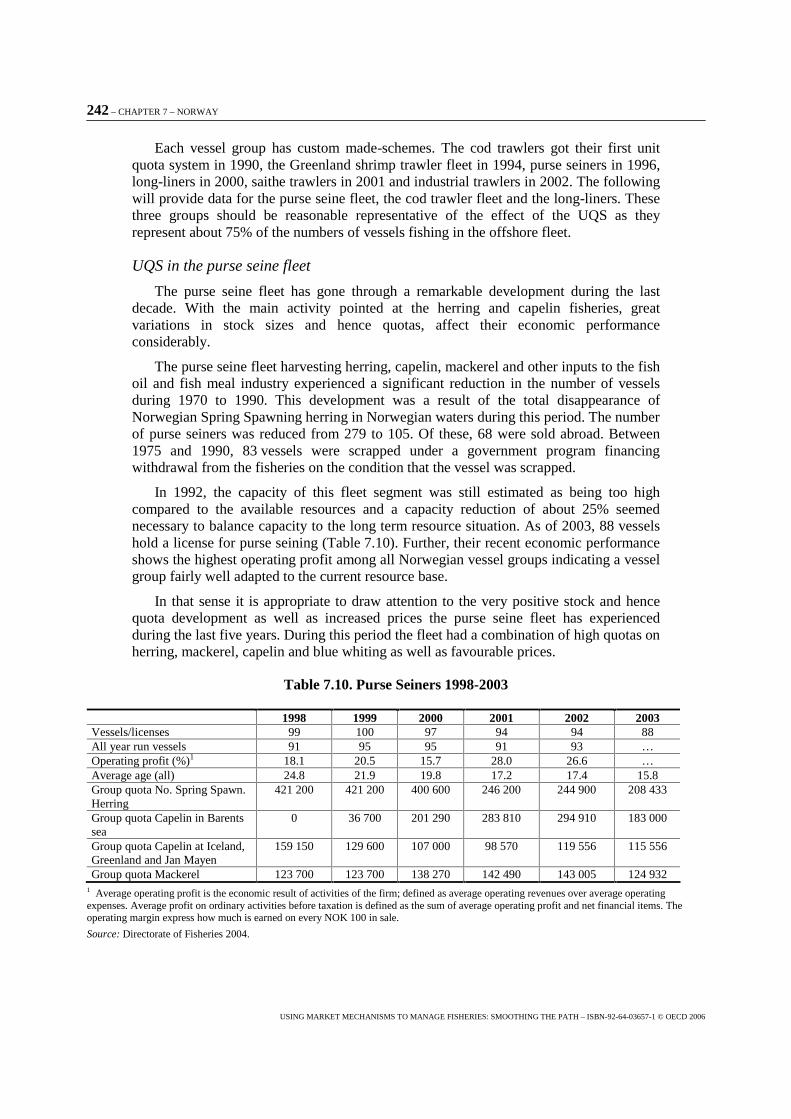
242 – CHAPTER 7 – NORWAY
USING MARKET MECHANISMS TO MANAGE FISHERIES: SMOOTHING THE PATH – ISBN-92-64-03657-1 © OECD 2006
Each vessel group has custom made-schemes. The cod trawlers got their first unit quota system in 1990, the Greenland shrimp trawler fleet in 1994, purse seiners in 1996, long-liners in 2000, saithe trawlers in 2001 and industrial trawlers in 2002. The following will provide data for the purse seine fleet, the cod trawler fleet and the long-liners. These three groups should be reasonable representative of the effect of the UQS as they represent about 75% of the numbers of vessels fishing in the offshore fleet.
UQS in the purse seine fleet
The purse seine fleet has gone through a remarkable development during the last decade. With the main activity pointed at the herring and capelin fisheries, great variations in stock sizes and hence quotas, affect their economic performance considerably.
The purse seine fleet harvesting herring, capelin, mackerel and other inputs to the fish oil and fish meal industry experienced a significant reduction in the number of vessels during 1970 to 1990. This development was a result of the total disappearance of Norwegian Spring Spawning herring in Norwegian waters during this period. The number of purse seiners was reduced from 279 to 105. Of these, 68 were sold abroad. Between 1975 and 1990, 83 vessels were scrapped under a government program financing withdrawal from the fisheries on the condition that the vessel was scrapped.
In 1992, the capacity of this fleet segment was still estimated as being too high compared to the available resources and a capacity reduction of about 25% seemed necessary to balance capacity to the long term resource situation. As of 2003, 88 vessels hold a license for purse seining (Table 7.10). Further, their recent economic performance shows the highest operating profit among all Norwegian vessel groups indicating a vessel group fairly well adapted to the current resource base.
In that sense it is appropriate to draw attention to the very positive stock and hence quota development as well as increased prices the purse seine fleet has experienced during the last five years. During this period the fleet had a combination of high quotas on herring, mackerel, capelin and blue whiting as well as favourable prices.
Table 7.10. Purse Seiners 1998-2003
1998 1999 2000 2001 2002 2003 Vessels/licenses 99 100 97 94 94 88 All year run vessels 91 95 95 91 93 … Operating profit (%)1 18.1 20.5 15.7 28.0 26.6 … Average age (all) 24.8 21.9 19.8 17.2 17.4 15.8 Group quota No. Spring Spawn. Herring
421 200 421 200 400 600 246 200 244 900 208 433
Group quota Capelin in Barents sea
0 36 700 201 290 283 810 294 910 183 000
Group quota Capelin at Iceland, Greenland and Jan Mayen
159 150 129 600 107 000 98 570 119 556 115 556
Group quota Mackerel 123 700 123 700 138 270 142 490 143 005 124 932 1 Average operating profit is the economic result of activities of the firm; defined as average operating revenues over average operating expenses. Average profit on ordinary activities before taxation is defined as the sum of average operating profit and net financial items. The operating margin express how much is earned on every NOK 100 in sale.
Source: Directorate of Fisheries 2004.
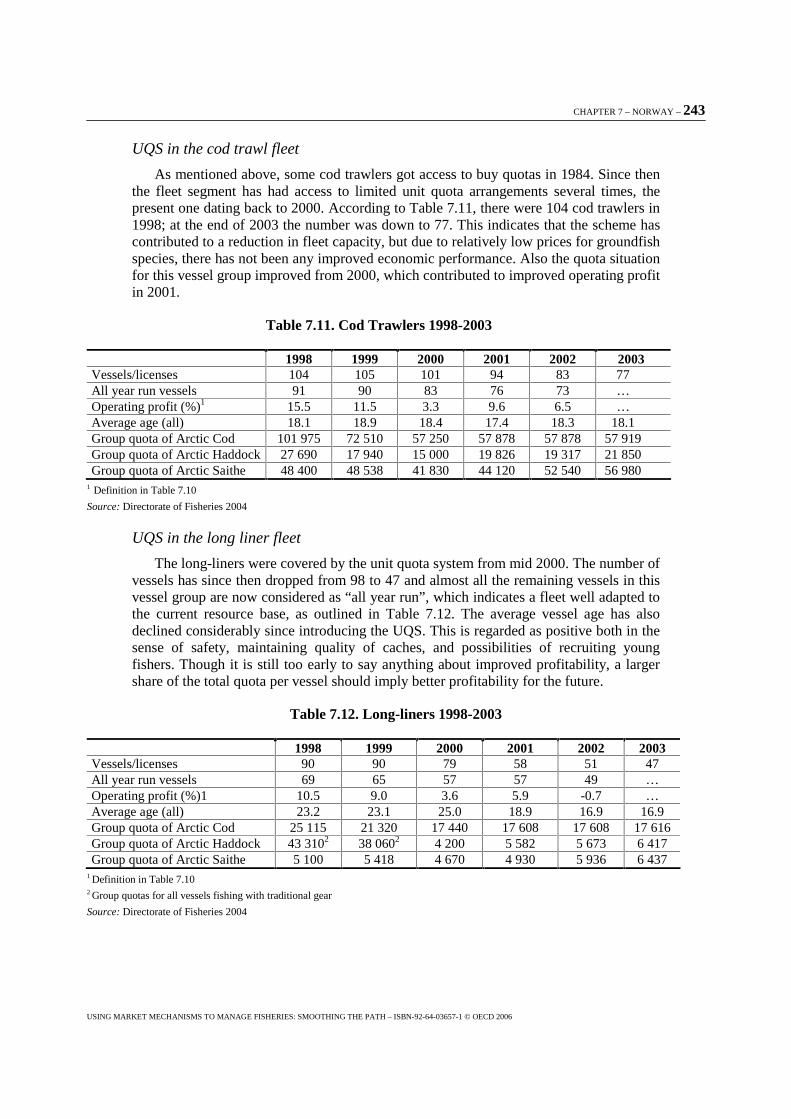
CHAPTER 7 – NORWAY – 243
USING MARKET MECHANISMS TO MANAGE FISHERIES: SMOOTHING THE PATH – ISBN-92-64-03657-1 © OECD 2006
UQS in the cod trawl fleet
As mentioned above, some cod trawlers got access to buy quotas in 1984. Since then the fleet segment has had access to limited unit quota arrangements several times, the present one dating back to 2000. According to Table 7.11, there were 104 cod trawlers in 1998; at the end of 2003 the number was down to 77. This indicates that the scheme has contributed to a reduction in fleet capacity, but due to relatively low prices for groundfish species, there has not been any improved economic performance. Also the quota situation for this vessel group improved from 2000, which contributed to improved operating profit in 2001.
Table 7.11. Cod Trawlers 1998-2003
1998 1999 2000 2001 2002 2003 Vessels/licenses 104 105 101 94 83 77 All year run vessels 91 90 83 76 73 … Operating profit (%)1 15.5 11.5 3.3 9.6 6.5 … Average age (all) 18.1 18.9 18.4 17.4 18.3 18.1 Group quota of Arctic Cod 101 975 72 510 57 250 57 878 57 878 57 919 Group quota of Arctic Haddock 27 690 17 940 15 000 19 826 19 317 21 850 Group quota of Arctic Saithe 48 400 48 538 41 830 44 120 52 540 56 980
1 Definition in Table 7.10
Source: Directorate of Fisheries 2004
UQS in the long liner fleet
The long-liners were covered by the unit quota system from mid 2000. The number of vessels has since then dropped from 98 to 47 and almost all the remaining vessels in this vessel group are now considered as “all year run”, which indicates a fleet well adapted to the current resource base, as outlined in Table 7.12. The average vessel age has also declined considerably since introducing the UQS. This is regarded as positive both in the sense of safety, maintaining quality of caches, and possibilities of recruiting young fishers. Though it is still too early to say anything about improved profitability, a larger share of the total quota per vessel should imply better profitability for the future.
Table 7.12. Long-liners 1998-2003
1998 1999 2000 2001 2002 2003 Vessels/licenses 90 90 79 58 51 47 All year run vessels 69 65 57 57 49 … Operating profit (%)1 10.5 9.0 3.6 5.9 -0.7 … Average age (all) 23.2 23.1 25.0 18.9 16.9 16.9 Group quota of Arctic Cod 25 115 21 320 17 440 17 608 17 608 17 616 Group quota of Arctic Haddock 43 3102 38 0602 4 200 5 582 5 673 6 417 Group quota of Arctic Saithe 5 100 5 418 4 670 4 930 5 936 6 437
1 Definition in Table 7.10 2 Group quotas for all vessels fishing with traditional gear
Source: Directorate of Fisheries 2004
244 – CHAPTER 7 – NORWAY
USING MARKET MECHANISMS TO MANAGE FISHERIES: SMOOTHING THE PATH – ISBN-92-64-03657-1 © OECD 2006
Experiences with Structural Quota System (SQS)
The coastal vessels less than 28 meters hold a 61% share of the quota of Arctic Cod and, as described earlier, these vessels play an important role in coastal communities. However, market-based management systems like the Unit Quota System may have a negative effect on settlement and can lead to a concentration of licenses. The fear of these negative effects is the main reason for the hesitation to introduce this type of instrument to the coastal fleet.
A reform process started in 2000 in order to analyse and develop measures to meet the growing capacity within the coastal fleet. After the closure of the open access of the most important fisheries for the coastal fleet, the Atlantic Cod fisheries, in 1990, the TAC rose by 350% to a peak in 1997. During that period the increase in capacity in the coastal fleet was over-shadowed by the increase of stock. From 1998 and onwards, the decline in the TAC of the Atlantic Cod stock did not lead to an immediate decline in income for the coastal fleet due to higher market prices for Atlantic Cod as well as other fish species important for the coastal fleet. However, from the beginning of this decade, it became evident that the coastal fleet also had to reduce its fishing capacity to meet the new century, where an aging fishing fleet and lower income leading to labour shortages amongst new recruited fishers, would be the main challenges. The reform process led to the development of the Structural Quota System (SQS) and the Quota Exchange System (QES).
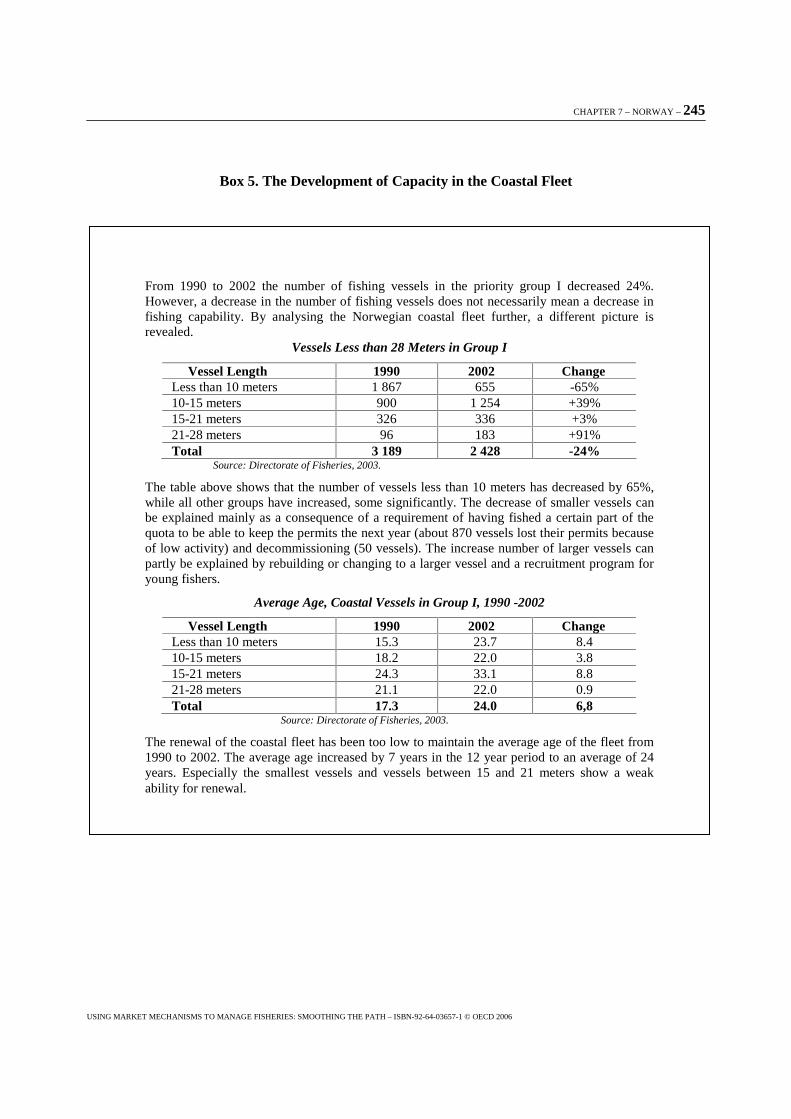
CHAPTER 7 – NORWAY – 245
USING MARKET MECHANISMS TO MANAGE FISHERIES: SMOOTHING THE PATH – ISBN-92-64-03657-1 © OECD 2006
Box 5. The Development of Capacity in the Coastal Fleet
From 1990 to 2002 the number of fishing vessels in the priority group I decreased 24%. However, a decrease in the number of fishing vessels does not necessarily mean a decrease in fishing capability. By analysing the Norwegian coastal fleet further, a different picture is revealed.
Vessels Less than 28 Meters in Group I
Vessel Length 1990 2002 Change Less than 10 meters 1 867 655 -65% 10-15 meters 900 1 254 +39% 15-21 meters 326 336 +3% 21-28 meters 96 183 +91% Total 3 189 2 428 -24%
Source: Directorate of Fisheries, 2003.
The table above shows that the number of vessels less than 10 meters has decreased by 65%, while all other groups have increased, some significantly. The decrease of smaller vessels can be explained mainly as a consequence of a requirement of having fished a certain part of the quota to be able to keep the permits the next year (about 870 vessels lost their permits because of low activity) and decommissioning (50 vessels). The increase number of larger vessels can partly be explained by rebuilding or changing to a larger vessel and a recruitment program for young fishers.
Average Age, Coastal Vessels in Group I, 1990 -2002
Vessel Length 1990 2002 Change Less than 10 meters 15.3 23.7 8.4 10-15 meters 18.2 22.0 3.8 15-21 meters 24.3 33.1 8.8 21-28 meters 21.1 22.0 0.9 Total 17.3 24.0 6,8
Source: Directorate of Fisheries, 2003.
The renewal of the coastal fleet has been too low to maintain the average age of the fleet from 1990 to 2002. The average age increased by 7 years in the 12 year period to an average of 24 years. Especially the smallest vessels and vessels between 15 and 21 meters show a weak ability for renewal.
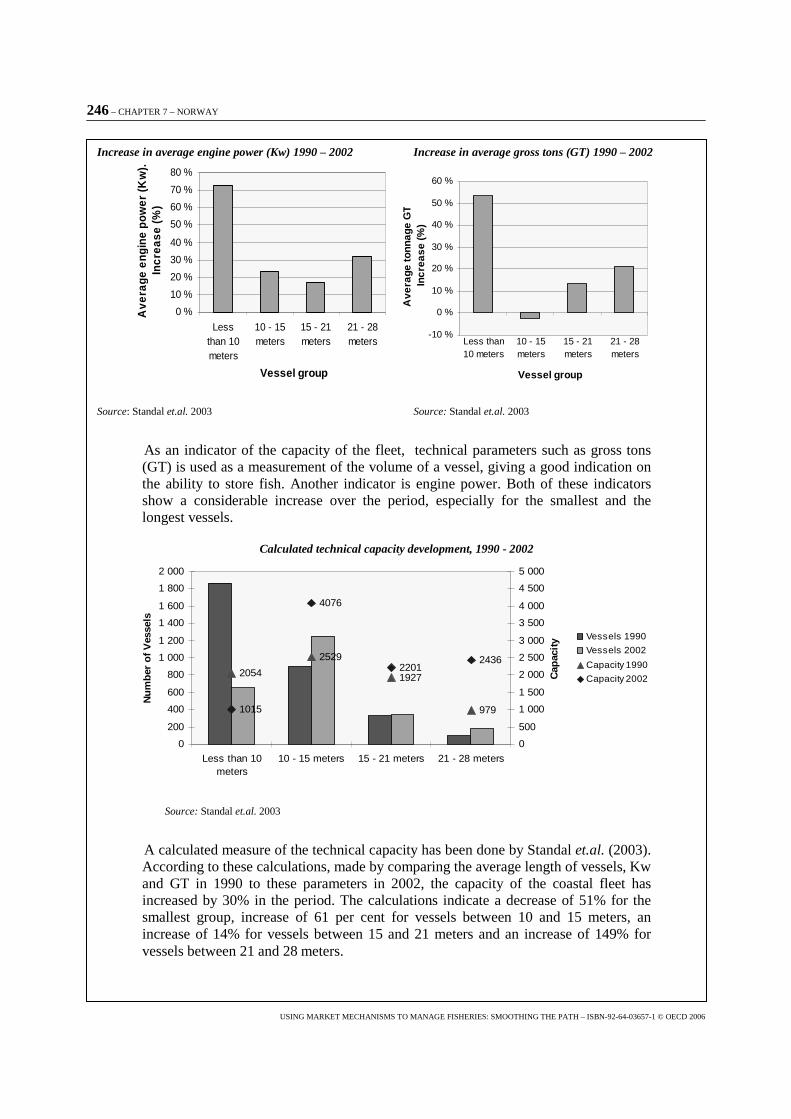
246 – CHAPTER 7 – NORWAY
USING MARKET MECHANISMS TO MANAGE FISHERIES: SMOOTHING THE PATH – ISBN-92-64-03657-1 © OECD 2006
Increase in average engine power (Kw) 1990 – 2002 Increase in average gross tons (GT) 1990 – 2002
0 %
10 %
20 %
30 %
40 %
50 %
60 %
70 %
80 %
Lessthan 10meters
10 - 15meters
15 - 21meters
21 - 28meters
Vessel group
Ave
rage
eng
ine
pow
er (K
w).
Incr
ease
(%)
-10 %
0 %
10 %
20 %
30 %
40 %
50 %
60 %
Less than10 meters
10 - 15meters
15 - 21meters
21 - 28meters
Vessel group
Ave
rage
tonn
age
GT
Incr
ease
(%)
Source: Standal et.al. 2003 Source: Standal et.al. 2003
As an indicator of the capacity of the fleet, technical parameters such as gross tons (GT) is used as a measurement of the volume of a vessel, giving a good indication on the ability to store fish. Another indicator is engine power. Both of these indicators show a considerable increase over the period, especially for the smallest and the longest vessels.
Calculated technical capacity development, 1990 - 2002
2054
2529
1927
9791015
4076
22012436
0
200
400
600
800
1 000
1 200
1 400
1 600
1 800
2 000
Less than 10meters
10 - 15 meters 15 - 21 meters 21 - 28 meters
Nu
mb
er o
f V
esse
ls
0
500
1 000
1 500
2 000
2 500
3 000
3 500
4 000
4 500
5 000
Cap
acit
y Vessels 1990
Vessels 2002
Capacity 1990
Capacity 2002
Source: Standal et.al. 2003
A calculated measure of the technical capacity has been done by Standal et.al. (2003). According to these calculations, made by comparing the average length of vessels, Kw and GT in 1990 to these parameters in 2002, the capacity of the coastal fleet has increased by 30% in the period. The calculations indicate a decrease of 51% for the smallest group, increase of 61 per cent for vessels between 10 and 15 meters, an increase of 14% for vessels between 15 and 21 meters and an increase of 149% for vessels between 21 and 28 meters.
CHAPTER 7 – NORWAY – 247
USING MARKET MECHANISMS TO MANAGE FISHERIES: SMOOTHING THE PATH – ISBN-92-64-03657-1 © OECD 2006
The SQS has been introduced for coastal vessels between 15 and 28 meters from 2004. As described above, the SQS is designed for the coastal fleet, and may be seen as a customised version of the UQS, however with more restrictions. The restrictions ensure a long-term regional stability to avoid regional concentration of permits.
Table 7.13 indicates a fleet segment with a current average age about twice the one of the offshore fleet (see Experiences with the Unit Quota System under section 4).
Table 7.13. Coastal Vessels Between 15 and 28 Meters in Group I, 1998-2003
1998 1999 2000 2001 2002 2003 Vessels/licenses 539 All year run vessels 418 Operating profit (%)1 13.2 Average age (all) 29.8 Group quota of Arctic Cod 160 9102 Group quota of Arctic Haddock 43 3102 Group quota of Arctic Saithe 36 550
1 Definition in Table 7.10 2 Group quota for all vessels fishing with traditional gear 3 Group quota for all vessels less than 28 meters in Group I
Source: Directorate of Fisheries 2004
It is at present (March 2004) too early to say anything about the effect of the SQS on the number of vessels in the coastal fleet between 15 and 28 meters. However, we know something about the effect the UQS has had. The SQS may be considered to be a little more favourable than the UQS because it gives the additional quota indefinitely. On the other hand, the restrictions of the system (c.f. Box 3) may decrease the attractiveness of the SQS.
Table 7.14. Estimated Number of Scrapped and Remaining Vessels with a 10 to 40% Effect of SQS
Vessel groups
Vessels 2003 10 % effect 20 % effect 30 % effect 40 % effect
Scrapped Remain- ing
Scrapped Remain- ing
Scrapped Remain- ing
Scrapped Remain- ing
21 to 28 m 185 19 166 37 148 56 129 74 111 15 to 21 m 340 34 306 68 272 102 238 136 204
Total 525 53 475 105 420 158 367 210 315
Source: Ministry of Fisheries 2003
According to Table 7.14, if SQS reaches a 30% effect the fleet will be reduced by 158 vessels, leaving each of the remaining 367 vessels in the group with an increased share of the TAC of cod, haddock and saithe per vessel.
If it is assumed that vessels using SQS will increase their quotas by 80%, and that the remaining 20% of the scrapped vessels’ quotas are shared between the remaining vessels, then it is possible to estimate the increase in quotas with a 10 to 40% effect of SQS. This is illustrated in Table 7.15.
248 – CHAPTER 7 – NORWAY
USING MARKET MECHANISMS TO MANAGE FISHERIES: SMOOTHING THE PATH – ISBN-92-64-03657-1 © OECD 2006
Table 7.15. Increased Quotas (%) for the Remaining Vessels with a 10 to 40% Effects of SQS
Effect SQS Vessels Others 10 % 82.2 2.2 20 % 85.0 5.0 30 % 88.6 8.6 40 % 93.3 13.3
Source: Ministry of Fisheries 2003.
According to Table 7.15, an estimated effect with 30% use of SQS will increase the quota by 88.6% for those vessels having used SQS and 8.6% for those that have not.
In Table 7.16 the data from Table 7.15 are translated into the amount of additional fish each vessel may catch based on the 2003 Atlantic Cod quota. The table shows how many extra tons of cod that vessels having used SQS and those that have not may catch the next year.
Table 7.16. Increased Quotas of Atlantic Cod for Remining Vessels with a 10 to 40% Effect of SQS
Vessel groups 21 – 28 meters
(Quota: 137 tons) 15 – 21 meters
(Quota: 105 tons) SQS Vessels Others SQS Vessels Others
10 % 99.5 2.7 71.5 1.9 20 % 102.9 6.0 74.0 4.4 30 % 107.2 10.4 77.1 7.5 40 % 112.9 16.1 81.2 11.6
Source: Ministry of Fisheries 2003.
With the example of a 30% use of SQS, 56 vessels in the 21 to 28 meters group will be scrapped leaving 129 vessels left in the group (Table 7.14.). In other words, if 56 vessel owners have used SQS, then these vessels will have increased their quota by 88.6%, and the remaining 73 vessels have increased their quota by 8.6% (Table 7.15). In terms of cod, they have respectively increased their quota by 107.2 tons and 10.4 tons respectively (Table 7.16).
As a consequence of the introduction of SQS, the decreased number of vessels will have an effect on the employment of fishers in Norway. Vessels between 15 and 28 meters normally employ between three to eight people. By assuming that vessels between 15 and 21 meters employ three fishers each, and vessels between 21 and 28 meters employ six fishers each, an effect of 30% use of SQS will decrease the employment by 630 fishers (Table 7.17).
CHAPTER 7 – NORWAY – 249
USING MARKET MECHANISMS TO MANAGE FISHERIES: SMOOTHING THE PATH – ISBN-92-64-03657-1 © OECD 2006
Table 7.17. SQS’s Effect on Employment
Vessel groups
Employed 2003
10 % effect
20 % effect
30 % effect
40 % effect
Less Left Less Left Less Left Less Left 21 to 28 m 1 100 110 990 220 880 330 770 440 660 15 to 21 m 1 000 100 900 200 800 300 700 400 600
Total 2 100 210 1 890 420 1 680 630 1 470 840 1 260
Source: Ministry of Fisheries 2003.
Considering the vessels‘ origin along the Norwegian coast, there are not likely to be systematic geographical differences in the use of SQS. As a consequence of restrictions (as elaborated above), the market of buying or selling is limited to vessels within the same county. More permits in fewer hands may be the situation within counties, but concentration on the distribution of permits between the different counties will be fairly limited.
Experiences with Quota Exchange System (QES)
The Quota Exchange System is not designed to reduce capacity, but to enable the fishers to make different quota arrangements in accordance with their special needs. As described above, fishers can use the QES as a temporary arrangement in situations where it is more profitable or convenient to cooperate with other vessel owners in fishing more than one quota, or to specialise in certain fisheries.
QES has been implemented as a temporary arrangement for the coastal fleet for 2004. It is at present (March 2004) too early to say anything about the effect of the QES. Based on an evaluation to be done in 2004, a recommendation will be forwarded to the Norwegian Parliament on the future of the QES.
QES may be quite similar to an ITQ system. However, the limitations in the QES, such as only being able to use the system for three out of five years, decrease the transferability. The overall idea behind the QES is to provide a more flexible and economically efficient system than today’s regulation regime, to enable the small-scale coastal fleet to fish more in accordance with seasonal variations and geographical differences. Even if the system does not reduce capacity, it is expected to increase the effectiveness and decrease the cost of fishing.
Since QES only allows temporary arrangements, the system will have no permanent effect on employment or concentration of permits.
Effects of market-based incentives systems implemented
The Unit Quota System has led to a reduction of 34% of the cod trawler fleet during the 8 years it has been in effect. That may be considered as moderate, bearing in mind that the overcapacity in this fleet is still considerable. However, since the last adjustment of the UQS in 2000, the fleet has been reduced by 27% and will probably be reduced further in the coming years.
For the purse seine fleet, the UQS led to a 15% decrease over the last 8 years, whereas 12% relates to the present regime. The recent economic performance of the purse seine fleet shows the highest operating profit among all Norwegian vessel groups, which
250 – CHAPTER 7 – NORWAY
USING MARKET MECHANISMS TO MANAGE FISHERIES: SMOOTHING THE PATH – ISBN-92-64-03657-1 © OECD 2006
should indicate a vessel group fairly well adapted to the current resource base. However, decommissioning schemes reduced the number of purse seiners by more than 60% before the UQS was introduced to the fleet. The favourable resource situation for this fleet must also be considered before judging how the UQS has fared.
The long liner fleet has since been reduced by 52% the introduction of UQS in 2000, and has in the same period reduced the average vessel age from 25 to about 18 years.
The last example shows that the UQS has effects on the capacity situation in the fleet.
It is too early to draw any conclusions on the effect of the SQS. The analysis of the fleet done in the chapter indicates a coastal fleet with overcapacity, and the SQS is designed to change this. The introduction of the SQS will not change the number of annual permits of groundfish species held by the coastal fleet located in the northern counties. There will probably be a centralisation within the county, as some communities have competitive advantages towards others when meeting new market demands, and the implementation of SQS will probably speed up that process. But increased income will in the long run benefit the coastal communities.
5. The Reform Process Towards Using Market-like Instruments
The fishery sector is an important political issue, and the government has to consider this in its fishery policy decisions. Moreover, the fact that the fishery sector is so concentrated regionally strengthens this importance. The opposition from the fishery industry was a decisive factor behind Norway’s decision not to join the European Community in 1972 as well as in 1994. Fisheries will probably continue to be one of the main issues in the discussions on a possible membership to the European Union in the future as well.
The fishers early on understood that political influence depended on cooperation. Already in 1926, the Norwegian Fishermen’s Association (NFA) was established. NFA organises vessel owners as well as crew members and has traditionally a strong political influence and takes part in discussions and decisions on fishery management, e.g. quota decisions. Norway has a long tradition of user-participation, and the fishery policy is formed in accordance with the views of the fishers, represented by the NFA.
The process towards the implementation of market-based management systems to constrain the participation in fisheries started with a collapse in the herring fisheries in the 1960s, followed by an agreement on economic transfers to the industry in 1964, pay-back programs and licensing systems for the offshore fleet. A new resource crisis in the Atlantic Cod fishery in 1990 opened a debate on an Individual Transferable Quota system, and ended with an Individual Vessel Quota system, a closure of the access to coastal fishery, a process towards the long term allocation keys between different fleet groups and a massive reduction in subsidies. The recent years have been dominated by the development of systems to manage overcapacity, ending up with a Unit Quota System for the offshore fleet and Structural Quota System for the coastal fleet.
This section will describe part of this reform, focusing on how stakeholders have dealt with the changes and cooperated to the introduction of these instruments. Previous OECD papers2 have described economic transfers to the Norwegian fishing industry,
2 See AGR/FI(2000)10/FINAL, "Government financial transfers and resource sustainability, Case study
Norway".
CHAPTER 7 – NORWAY – 251
USING MARKET MECHANISMS TO MANAGE FISHERIES: SMOOTHING THE PATH – ISBN-92-64-03657-1 © OECD 2006
which is almost absent in 2004. Hence, this chapter will cover neither the establishment nor the abolishment of these transfers.
The debate on establishing an ITQ system in Norway
In the mid 1960s, Norwegian fishers experienced a total collapse in the herring fisheries. The resources were not inexhaustible and the economic consequences of overcapacity became evident, especially through a system where the fishers could claim subsidies to compensate for lack of profitability. The fleet had to be reduced. At that time “limited entry” was the internationally accepted remedy and, through a new law regulating participation in fisheries in 1972 (Act on the Regulation and Participation in Fisheries), the principle was introduced in Norwegian fisheries.
There were four different objectives attached to the implementation of the law:
� Fishing capacity had to be adjusted to the carrying capacity of the resources.
� Profitability had to be achieved by the fleet as well as the individual operator.
� The license regime should contribute to a “reasonable (geographical) distribution of the fleet”.
� The exclusive access rights of bona fide fishers should be protected.
The geographical distribution objective clearly indicated that the fisheries policy was part of a regional policy, which in a Norwegian setting meant that the fisheries should contribute to maintaining the settlement pattern.
In 1988/89, it was evident that a “cod crisis” was looming. Consequently, the issue of over-capacity was again put on the agenda, and this time it affected the coastal fleet. The issue of an Individual Transferable Quota system (ITQ) was introduced through a report from a working group on the structure of the harvesting sector. The group comprised representatives from the Norwegian Ministry of Fisheries, the Directorate of Fisheries, and the Norwegian Fishermen’s Association (NFA). The original idea was to introduce enterprise allocations to the offshore fleet, thereby making it possible for companies with two or more vessels to rationalize the actual catching and then, make it possible for two or more companies to co-operate in reducing effort. This was, by most fishers and politicians, considered to be more or less similar to ITQs. The proposal created a heated debate, with strong opposition from the coastal fishers and politicians. The proposal was not acceptable to the fishers because the fisheries policy was perceived as a regional policy contributing to the settlement pattern.
Faced with opposition to the proposal, the Ministry of Fisheries decided to introduce a white paper to the Parliament. Four officials from the Ministry of Fisheries were assigned to draft the first discussion paper, in co-operation with biologists from the Norwegian Institute of Marine Research, and economists and social scientists from Norwegian universities. The report described the existing ITQ-schemes in Australia, New Zealand, Iceland and Canada, and the group presented an overview of different forms of ITQ. The group ended up by recommending different forms of ITQ-systems with strong geographical limitations on transferability. The report discussed various forms of “transferability”, including:
252 – CHAPTER 7 – NORWAY
USING MARKET MECHANISMS TO MANAGE FISHERIES: SMOOTHING THE PATH – ISBN-92-64-03657-1 © OECD 2006
� The traditional trading of quotas
� Transfer of vessels with quota
� Enterprise allocations to be “traded” within the company
� Renting quotas on an annual basis
� Co-operative fishing where several owners may decide to use one boat to catch several quotas
The Ministry’s preferred version (pertaining to vessels more than 8 meters) was based on TAC allocation to various groups (vessels and regions) based on historical catch. Individual quotas, given as a share of TAC, would be allocated for a limited period of time (five years) and be subject to an annual resource fee, paid to the government. Quotas should be tradable within groups and regions, while transfers across vessel groups and regions would require permission from the Ministry.
By taking the demand for larger flexibility and the need for regional stability into consideration, the Ministry thought the proposal would meet acceptance, not only by the fishers, but by regional politicians as well. However, “the overwhelming majority of those consulted were strongly against ITQs, even in the modified version suggested in the draft” (Apostle et al. 1998). The main reason for the skepticism was fear of privatization of the commons. The Labour Party (at the time in Cabinet) and a task force within the party found that the question of ITQs was a non-issue on the political agenda. In the revised and final version of the white paper presented to the Parliament, the question of transferability was considerably watered down. In the report from the Standing Committee on Fisheries, the majority rejected an ITQ option.
The establishment of the Individual Vessel Quota (IVQ) system
The question of Individual Transferable Quotas (ITQs) has, since the debate in the Parliament in 1992, not been on the political agenda. However, an alternative to the ITQ-system, the Individual Vessel Quota system (IVQ), was established and implemented to most of the Norwegian fishing fleet.
As mentioned, the Atlantic Cod stock was in a serious state in the late 1980s. Due to a sudden and unexpected decline in the size of the Atlantic Cod stock, the TAC was set at 340 000 tons in 1989, down from 630 000 tons the previous year. In 1989, the coastal fisheries were closed after only three and a half months. Because of this, an individual quota system was established during the fall of 1989 and implemented for the 1990 season in the coastal fleet.
The fishers, represented through the Norwegian Fishermen’s association, had a relatively strong position in the process. The key policy arena for negotiating the IVQ regime was the Advisory Board for Fisheries Regulations3, established in 1983 as the meeting place between the industry representatives and the fisheries authorities on resource management issues (Hoel et al. 1996). While the Council formally only had a role vis-à-vis the Minister of Fisheries, the Council’s decision would usually, and particularly if it was unanimous, be very influential (Hersoug, 2003). In this case, the government decision was made during the fall of 1989, based on the recommendation of the Advisory Board for Fisheries Regulations.
3 See section 2 under Resource Management.
CHAPTER 7 – NORWAY – 253
USING MARKET MECHANISMS TO MANAGE FISHERIES: SMOOTHING THE PATH – ISBN-92-64-03657-1 © OECD 2006
The IVQ system was a two-tiered system. The most active vessels, as measured by the quantity of Atlantic Cod landed in the 1987-89 period, were put under a vessel quota regime (the priority Group I vessels). These quotas were exclusive, so that the vessel owner had full discretion to decide when or where fish. On the other hand, the less active vessels were allowed to fish competitively under a group quota (Group II vessels). There were no restrictions on participation to this fishery, as long as the fisher fulfilled the requirements of being a registered fisher. However, the allocation to this group was about 10% of the quota given to the coastal vessels in Group I.
When the IVQ system was implemented, the dramatic condition of the Atlantic Cod stock made it inevitable to take steps to improve the situation for the full-time fishers. However, the IVQ regime was initiated as a response to the resource crisis, and initially the idea was to abolish the system once the situation returned to normal. This may have been the main reason why the IVQ system was adopted so quickly, with relatively few objections.
Even if both the fisheries authorities and the Fisherman’s Association regarded the IVQ system as transitional, the IVQ system became permanent. When the crisis passed, the established regime remained. During the 1980s, the annual landings from the coastal fleet averaged about 180 000 tons. Assuming this represents a “normal” situation in the fishery, the crisis was over in 1993 when landings returned to about this level. Despite this, with reference to the over-capacity in the coastal fleet, the Ministry of Fisheries argued that the quota was still not large enough to allow all vessels to have a normal level of operation. In spite of its earlier position, the Fisherman’s Association supported this view. One reason for the change of view is suggested by Holm et al. (1996) explaining that the owners of vessels in priority Group I, discovered the benefit of being inside a closed group. It allowed them to fish their quota when it suited them, or to sell the vessel with the additional quota value.
The establishment of long-term allocation keys
While TACs in the important Atlantic Cod fisheries were already introduced before the establishment of the Norwegian EEZ, there was no effective allocation to different fleet groups. All cod trawlers got IVQ’s from 1976 and onwards, but the coastal fleet could fish with only minor restrictions until 1986, due to an agreement between Norway and the former Soviet Union. However, following the 1989 Atlantic Cod stock crisis, a fixed allocation key was required. Overcapacity was considered the main problem, but representatives from the offshore fleet were reluctant to start restructuring as long as there was open access in the coastal fleet. They feared that new entrants to the coastal fleet would immediately consume any effect of their restructuring. Hence, a fixed allocation key was needed. This was also acknowledged by the NFA. After intense debate, the so-called “trawler ladder”, an allocation key providing the sharing formula between the offshore fleet and the coastal fleet, was finally decided in 1989. Based on the five-year allocation key, imposed and followed up by the Ministry of Fisheries, the task of scaling down the trawler fleet could start. The “Unit Quota System” was introduced in 1990.
Overcapacity proved also to be a problem in the pelagic fleet as technical improvements increases efficiency. In 1994, a new long-term allocation key was proposed, this time comprising of more species (including herring, mackerel, capelin as well as saithe and haddock). Within the NFA this caused a dramatic conflict, especially on the allocation of Atlantic Cod. On one side, there were owners of offshore vessels, demanding a larger quota share and on the other, coastal fishers, demanding what they
254 – CHAPTER 7 – NORWAY
USING MARKET MECHANISMS TO MANAGE FISHERIES: SMOOTHING THE PATH – ISBN-92-64-03657-1 © OECD 2006
considered to be the fair share based on historical catches. However, a compromise was reached, leaving the Ministry of Fisheries with a solution that was easy to adapt. At the same time the solution was difficult to counter, as it was already a negotiated solution by the industry itself of a politically very sensitive question. To move even a single per cent of quota from one group to another in only one fishery, would probably break the fragile agreement. The allocation keys were implemented in the industry in 1994 and lasted for 7 years.
In 2001, the allocation keys were up for new discussion. This time the threats of breaking up and leaving the organization was clearly pronounced by the subordinate organization of the offshore fleet, centering on even minimal changes to the previous allocation keys. The case had been thoroughly prepared through a large committee, consisting of fishers from most fleet segments. The committee managed to obtain a compromise and after days of negotiation, a similar compromise was reached in the NFA, now binding the allocation for the next six years.
As a part of the agreement, the Ministry was requested to close access to a number of fisheries, that is, to limit the participation according to certain criteria. It was also a request that led to the so-called “Finnmark model”, whereby the coastal fleet is divided into four length-groups, each group being allocated a quota according to a historical share. These requests did go very well along the lines of the Ministry of Fisheries work to take further steps to reduce capacity in the coastal fleet. The “Finnmark-model”4 was implemented from 2002, as well as the new allocation keys.
The establishment of quota-transfer systems in the coastal fleet
During 2002, the Ministry of Fisheries introduced three important changes to the Norwegian access regime.
The first was a public document presented in the spring of 2002, proposing to close the remaining open access fisheries. In the northern part of the country, the saithe and haddock fisheries had remained open, even if the most important demersal fishery, the Atlantic Cod fishery, was closed in 1990. The Ministry argued that no further restructuring in the coastal fleet could take place before there was a de facto closed access to all the fisheries.
The proposal suggested a dual structure, as already implemented in the Atlantic Cod fisheries, giving the priority Group I vessels of the cod fisheries an individual vessel quota on saithe and haddock according to vessel size. Vessels not holding a permit in the Atlantic Cod fisheries had to qualify according to their historical catch of saithe or/and haddock or/and cod to be given a permit to the new Group I, now enlarged to include cod, saithe and haddock. Vessels not qualified were given access in the open fisheries of Atlantic Cod, saithe and haddock in the so-called Group II.
The proposal was supported by the NFA, and the protesting groups were weak, being represented by the Norwegian Coastal Fishermen’s Union (NCFU) and various local politicians (Hersoug 2003). It is also claimed that the concern of the NCFU had to be considered, as these fisheries have constituted the backbone of many small-scale and part time fishers in marginal regions (Hersoug 2003). During 2002, the last open fishery of mackerel was closed, as well as the coastal fisheries of Norwegian Spring Spawning herring.
4 Named after the northernmost county of Norway, where the system was invented.
CHAPTER 7 – NORWAY – 255
USING MARKET MECHANISMS TO MANAGE FISHERIES: SMOOTHING THE PATH – ISBN-92-64-03657-1 © OECD 2006
The second proposal concerned a decommissioning scheme for the coastal fleet partly financed by a fee on first hand sales of fish. The idea is to build up a so-called Structural Fund over a five year period aimed at buying out and scrapping coastal vessels less than 15 meters. This is contrary to tradition in Norway, where the Government has financed all decommissioning schemes up until now. The principle “All pay, some receive” was chosen to establish a fund big enough to have an effect, however keeping the fee as low as possible.
This proposal was also supported by the NFA, on the condition that the government had to contribute to the fund at least as much as the industry themselves. The government has so far done that (for the years 2003 and 2004), but has given no guarantee for further contributions to the fund.
The third proposal concerned the actual restructuring of the coastal fleet, considered having substantial overcapacity (see Box III.7.5). From the Ministry’s point of view, it was important to offer the coastal fleet an option that they would choose to use, depending on each vessel owner’s individual situation.
In the summer of 2002, after a period with some consultation with stakeholders, the Ministry send out a public document suggesting two main directions of policy: either co-operation through the exchange of quotas between various vessels (the Quota Exchange System), or a more permanent restructuring through the merging of vessels that each holds a fishing permit (the Structural Quota System) (cf. Quota-transfer systems implemented to the coastal fishing fleet under section 3). The public document, together with the public document on the Structural Fund, quickly became the main topic discussed in the fisheries media. It was especially three groups who opposed the proposals - the Norwegian Coastal Fishermen’s Union, various local politicians and some representatives from different academic institutions. They argued that these systems were too close to an ITQ system, that there was no overcapacity in the smaller coastal vessels (a number of small-scale fishers have a technical capacity which they choose not to apply), and that it would not go along with the policy on employment and settlement in remote areas. Finally, there were arguments that the consequences of this new proposal was not discussed thoroughly enough in the public document. Nevertheless, the NFA asked for some extra time to be able to have a thorough discussion on the proposals within the organization, ending up with supporting all the proposals with some minor suggestions for change.
To come to terms with the criticism, the Ministry of Fisheries decided in December 2002 to present the proposals to the Parliament. In May 2003, the government presented the white paper “Structural measures towards the coastal fishing fleet”. In the white paper the Ministry of Fisheries gave a review on the policy towards the coastal fleet, trough a description of the different proposals, arguing why it was necessary to reduce the capacity in the coastal fleet, and the expected long-term effect these new instruments would have on employment and settlement in the coastal areas. The Parliament did not immediately embrace the proposals; however the position taken by the NFA was given a great emphasis. After thorough consideration, the majority went along with all the proposals with only one minor change during the spring of 2003.
This led to the implementation of the jointly funded decommissioning scheme from the summer of 2003, the SQS and a trial period for the QES from 2004. All together, these new regimes are considered important reforms, affecting about 3 200 vessels.
256 – CHAPTER 7 – NORWAY
USING MARKET MECHANISMS TO MANAGE FISHERIES: SMOOTHING THE PATH – ISBN-92-64-03657-1 © OECD 2006
From open to closed access
As described in The debate on establishing an ITQ system in Norway in section 5, the Norwegian Government presented a white paper to the Parliament discussing ITQs in 1992. The outcome of the discussion at that time made it evident that it is necessary to have TACs and closed access, and that the exclusive right to fish is distributed to a limited number of fishers based on tradition. However, it was not considered legitimate that someone should be given an exclusive right to trade and make profit from the fisheries resource, without actually fishing. The pure forms of an ITQ system have therefore not been implemented in Norwegian fisheries.
As of today, the focus is on profitability within each vessel group. Approximately 95% of the catch value comes from access-regulated fisheries. The TACs are distributed to the various vessel groups through fixed allocation keys, and are further allocated as IVQs. Different quota-transfer systems such as the UQS, the SQS and the QES have been developed to meet the challenge of an increasing overcapacity due to technical development of vessels, gear and equipment. The management instruments implemented leave the responsibility for adjusting the fishing capacity to the available resources to the industry, and thus secure higher profitability. However, it has been a rough and slow process and required a step-by-step approach.
Norway has a varied and technologically advanced fishing fleet, encompassing both small coastal vessels and large off-shore trawlers and purse seiners. A fleet composed of a variety of sizes has been seen to be vitally important to keep up both employment and livelihood in many coastal communities, but also because a varied fleet of smaller and larger vessels has the advantage of being able to exploit all parts of the fish-stocks, inshore as well as offshore, in a rational fuel- and cost- efficient way.
However, the varied fishing fleet has created challenges in designing efficient instruments to managing overcapacity. For Norway, the key to overcome these challenges has been continuous and efficient cooperation between the authorities and the stakeholders in the fishing industry and other affected organisations/institutions.
CHAPTER 7 – NORWAY – 257
USING MARKET MECHANISMS TO MANAGE FISHERIES: SMOOTHING THE PATH – ISBN-92-64-03657-1 © OECD 2006
BIBLIOGRAPHY
Apostle, R., G. Barret, P. Holm, S. Jentoft, L. Manzany, B. McCay, and K. Mikalsen (1998): Community, State, and Market on the North Atlantic Rim. Toronto, University of Toronto Press.
Hersoug, B., (2002): "The closing of the Norwegian commons". Paper presented at the 11th biennial conference of the IIEFET, august 19-22, Wellington, New Zealand.
Hoel, A.H., S. Jentoft, K. Mikalsen (1996). User-Groups Participation in Norwegian Fisheries Management. In M. Chang Zhang, M. L. Windsor, B. McClay, L. Husak and R. Muth (Ed.) Fisheries Utilization and Policy. Theme 2. Proceedings from the World Fisheries Congress. In press. New Dehli: Oxford and IBH Publishing Co.
Holm P., S.A. Raanes and B. Hersoug (1996): "Political Attributes of Right-Based Management Systems: The case of Individual Vessel Quotas in the Norwegian Coastal Cod Fishery" in Symes, D. (Ed.) Property rights and Regulatory Systems in fisheries, Oxford, Fishing News Books.
Norwegian Ministry of Fisheries, St.meld. nr. 58 (1991-92), “On structure- and regulation politics towards the fishing fleet.”.
Norwegian Ministry of Fisheries, St.meld. nr. 20 (2002-03), “Structural measures towards the coastal fishing fleet”.
Standal D., H Aasjord, B. Enerhaug 2003. Appendiks 8 in, St.meld. nr. 20 (2002-03), “Structural measures to the coastal fishing fleet”, Norwegian Ministry of Fisheries.
CHAPTER 8 – SPAIN – 259
USING MARKET MECHANISMS TO MANAGE FISHERIES: SMOOTHING THE PATH – ISBN-92-64-03657-1 © OECD 2006
Chapter 8
Spain1 The management of the Spanish Fishing Fleet operating in the Atlantic
Community Waters (The 300s fleet)
1. The 300s fleet
Today, a significant part of the Spanish fleet fishes in the Atlantic waters of the European Community. Even though only around 900 vessels (Spain has a total of around 15 000 vessels) operate in these waters2, these vessels are responsible for an important part of the volume and value generated.
Spanish vessels fishing in Atlantic Community waters include a Demersal fleet (the so-called 300s fleet), a specialised in-shore fleet3 and a fleet operating in Portuguese waters.
The Demersal fleet operating in the EU’s Atlantic Exclusive Economic Zone (EEZ) is commonly called the “300s fleet”, as this was the number of vessels the Community permitted to fish in its waters as part of Spain’s 1986 Accession Treaty.
This case study attempts to explain the historical evolution of the Spanish 300s fleet through the use of data and indicators. It will also analyse the problem of management as a cost and particularly when budget restrictions occur using the fishing industry as an example.
Fishing has a long tradition in Spain as for many centuries Spanish fishermen have been fishing in Atlantic waters. Fish provides protein for a country with few livestock as a result of geographical factors. Furthermore, in response to the Iberian Peninsula’s resemblance to an island, populations have long sought their food from the sea. The present European Community waters were originally international waters before the adoption of UNCLOS. Prior to this, 500 Spanish vessels fished where the 300s fleet does now.
1 Written by Professor Ramon Franquesa of the University of Barcelona with the permission of the Secretary General of Maritime Fisheries to access its data base. Professor Franquesa can be contacted: Tel: (34 93) 285 68 03, Email: [email protected].
2 Most of them fish either in Community or national waters (Carlos Iglesias Malvido, 2000). Community waters are the EEZs of EU Member States, up to the 12 mile limit of each country.
3 This in-shore fleet is divided into deep long-liners less than 100 GRT, polers less than 50 GRT, seiners, fish potters and vessels targeting demersal species requiring no quota.
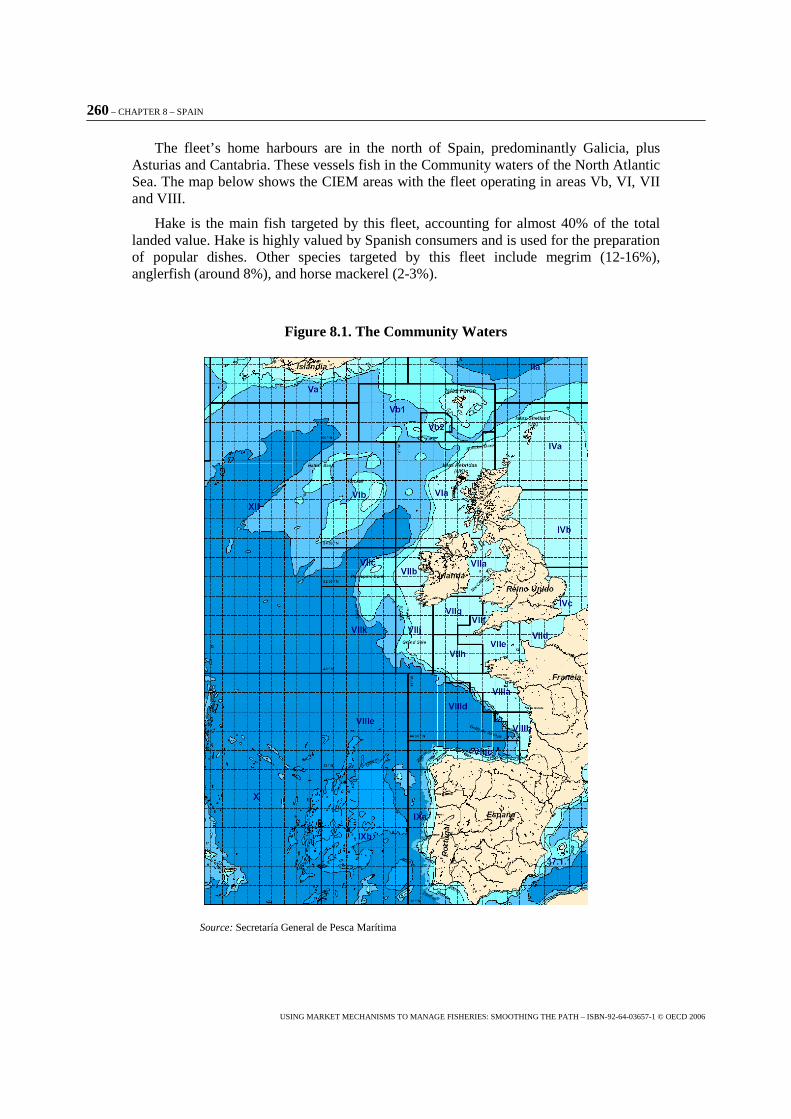
260 – CHAPTER 8 – SPAIN
USING MARKET MECHANISMS TO MANAGE FISHERIES: SMOOTHING THE PATH – ISBN-92-64-03657-1 © OECD 2006
The fleet’s home harbours are in the north of Spain, predominantly Galicia, plus Asturias and Cantabria. These vessels fish in the Community waters of the North Atlantic Sea. The map below shows the CIEM areas with the fleet operating in areas Vb, VI, VII and VIII.
Hake is the main fish targeted by this fleet, accounting for almost 40% of the total landed value. Hake is highly valued by Spanish consumers and is used for the preparation of popular dishes. Other species targeted by this fleet include megrim (12-16%), anglerfish (around 8%), and horse mackerel (2-3%).
Figure 8.1. The Community Waters
Source: Secretaría General de Pesca Marítima
CHAPTER 8 – SPAIN – 261
USING MARKET MECHANISMS TO MANAGE FISHERIES: SMOOTHING THE PATH – ISBN-92-64-03657-1 © OECD 2006
2. The 300s fleet before Spain joined the EEC
Community authorities established the 200 mile EEZ on January 1, 1977. This decision ended open access to Atlantic fishing resources. The main part of these resources was exploited by the Spanish fleet until then.
Between 1977 and 1981, the Community established a number of licences that were given to those vessels previously identified on a base list. For the distribution of these licences, the vessel’s capacity and type of fishing in the fishing zone was taken into account, which limited the number of vessels that could fish simultaneously.
It also introduced a device to communicate entrances and exits to the fishing ground for each vessel. This device imposed an additional cost on fishing enterprises (communication costs) and the authorities (to manage this information). The device was maintained in subsequent agreements until the 1996 revision and introduction of satellite control.
On June 12, 1981, the allocation of fishing rights was established by means of a Spanish Ministerial Order and a list of vessels with fishing rights in Community waters was published. The number of recognised high seas trawlers and long-line vessels, permitted to fish in Community waters in 1981 was set at 416 units.
This agreement represented a 20% reduction in the fleet. The Spanish authorities had to decide on a process for this reduction, and after consulting with fishermen’s organisations, decided to distribute it amongst the various operators using historical rights as a starting point. In many cases, the operators owned numerous vessels. In such cases, firms decommissioned 20% of their vessels. In others, a market for fishing rights was created between those buying and selling vessels that had a historical right to fish.
3. The 300s fleet: entrance to the EEC and the transition period
In 1986 when Spain joined the EEC, one of the most difficult aspects of its accession was the regulation of fishing activity and particularly fishing access to Community waters. Chapter IV of the Spanish Accession Treaty, signed in 1985, addresses this issue.
With the accession of Spain, the Community fishing sector increased its number of vessels by 32%, employment in fisheries by 65% and catches by 25% (Agroconsulting, 1996, pp 139-140). Member States' concern regarding the Spanish fishing potential resulted in an Agreement, which included a series of conditions for Spain - some of them transitory - in order to be able to fish in Community waters.
Article 158 of the Treaty established a nominal base list of 300 Spanish vessels that were allowed to fish in Community waters, but only 150 standard vessels could fish simultaneously.
Out of these vessels, 201 were trawlers and 99 long-liners. A “standard vessel” was considered a vessel with a braking power of 700 Horse Power (HP). For vessels with alternative braking power, conversion coefficients were defined in order to find equivalents in standard vessels.
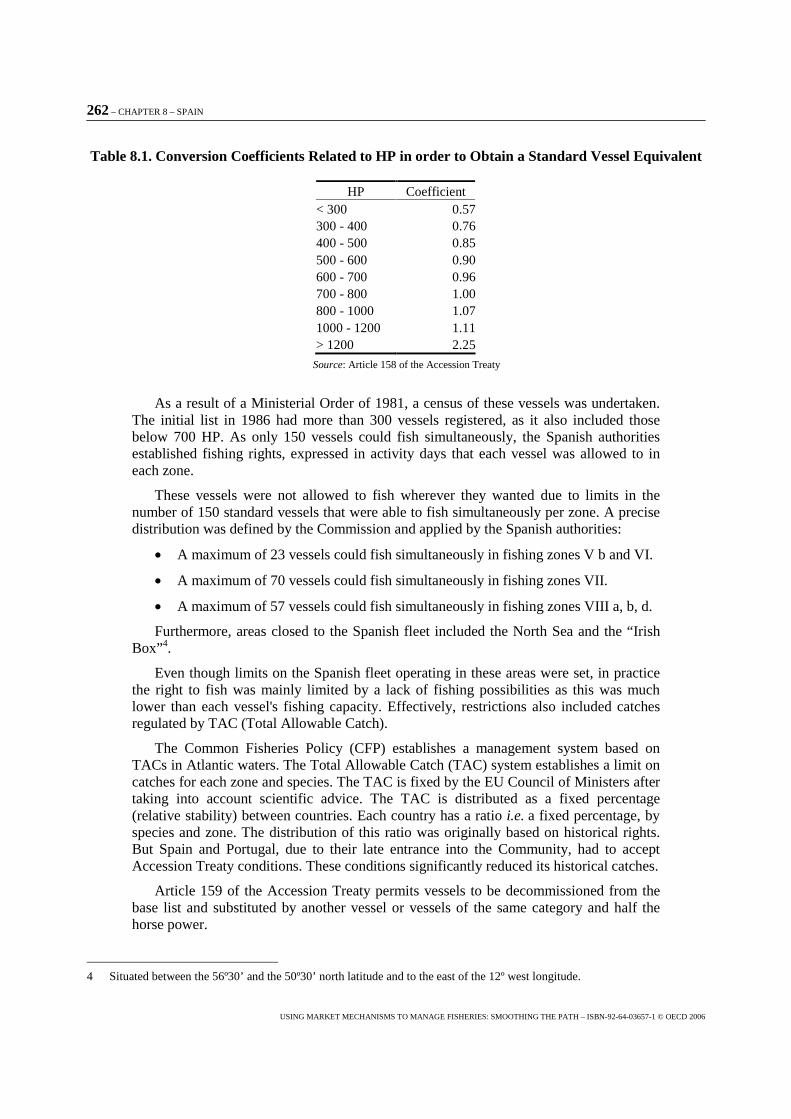
262 – CHAPTER 8 – SPAIN
USING MARKET MECHANISMS TO MANAGE FISHERIES: SMOOTHING THE PATH – ISBN-92-64-03657-1 © OECD 2006
Table 8.1. Conversion Coefficients Related to HP in order to Obtain a Standard Vessel Equivalent
HP Coefficient < 300 0.57300 - 400 0.76400 - 500 0.85500 - 600 0.90600 - 700 0.96700 - 800 1.00800 - 1000 1.071000 - 1200 1.11> 1200 2.25
Source: Article 158 of the Accession Treaty
As a result of a Ministerial Order of 1981, a census of these vessels was undertaken. The initial list in 1986 had more than 300 vessels registered, as it also included those below 700 HP. As only 150 vessels could fish simultaneously, the Spanish authorities established fishing rights, expressed in activity days that each vessel was allowed to in each zone.
These vessels were not allowed to fish wherever they wanted due to limits in the number of 150 standard vessels that were able to fish simultaneously per zone. A precise distribution was defined by the Commission and applied by the Spanish authorities:
� A maximum of 23 vessels could fish simultaneously in fishing zones V b and VI.
� A maximum of 70 vessels could fish simultaneously in fishing zones VII.
� A maximum of 57 vessels could fish simultaneously in fishing zones VIII a, b, d.
Furthermore, areas closed to the Spanish fleet included the North Sea and the “Irish Box”4.
Even though limits on the Spanish fleet operating in these areas were set, in practice the right to fish was mainly limited by a lack of fishing possibilities as this was much lower than each vessel's fishing capacity. Effectively, restrictions also included catches regulated by TAC (Total Allowable Catch).
The Common Fisheries Policy (CFP) establishes a management system based on TACs in Atlantic waters. The Total Allowable Catch (TAC) system establishes a limit on catches for each zone and species. The TAC is fixed by the EU Council of Ministers after taking into account scientific advice. The TAC is distributed as a fixed percentage (relative stability) between countries. Each country has a ratio i.e. a fixed percentage, by species and zone. The distribution of this ratio was originally based on historical rights. But Spain and Portugal, due to their late entrance into the Community, had to accept Accession Treaty conditions. These conditions significantly reduced its historical catches.
Article 159 of the Accession Treaty permits vessels to be decommissioned from the base list and substituted by another vessel or vessels of the same category and half the horse power.
4 Situated between the 56º30’ and the 50º30’ north latitude and to the east of the 12º west longitude.
CHAPTER 8 – SPAIN – 263
USING MARKET MECHANISMS TO MANAGE FISHERIES: SMOOTHING THE PATH – ISBN-92-64-03657-1 © OECD 2006
The transitory fishing regime imposed under the Accession Treaty was revised on January 1, 1996 in order to equate Spain and Portugal with the other European Member States for the purpose of negotiating enlargement of the European Union to include Norway, Sweden, Finland and Austria, and remained valid until 2002.
Today, different EU member countries fish in this area. In 2001, the distribution of vessels was: Spain 198, Ireland 137, UK 879, France 2143 and Belgium 93. Spanish vessels fish solely in this area, while UK and Belgian fleets also have important commercial activities in other areas such as the North Sea5.
Council Regulation 685/95 of March 27, 1995, enacted a new fishing effort management regime appointing the maximum amount of fishing effort for each Member State and fishery, in accordance with the fishing possibilities recommended by the Scientific, Technical and Economic Committee for Fisheries (STECF).
As a result, Member States must report a list of vessels authorised to fish to the Commission, an evaluation of the fishing effort level and the regulatory scheme controlling effort.
Even though the system of licenses and quotas in Spain has not been altered but retains the same amount of vessels per zone, it brought to an end the prohibition to fish in the Irish Box. Although the Irish Box is in zone VII where 70 vessels are normally allowed to fish simultaneously in that zone, the number of vessels authorised to fish simultaneously in the Irish Box6 has been limited to only 40 vessels7.
So, since 1996, the EU Council of Ministers has fixed the TACs for different fish stocks, and the maximum level of effort permitted according to assessed harvesting capacity. This is estimated according to the number of fishing days held by vessels with access to Community resources, multiplied by the horse power. The use of the licenses system was implemented so that the discards that the TAC system generated would be reduced8.
The Community regime determined that licenses are bound to vessels. Licenses are compulsory, so fishing in these zones is forbidden by vessels that do not have a license9. The administration of this is the responsibility of Member States10, who are also in charge of temporary suspensions and the retirement of licenses11.
These measures were established by the Community for all its Member States. The present situation (post 1996) is that the applicable legislation is applied to all Member States with a similar regime to the one that Spain and Portugal were bound to as part of their Accession Treaty.
During 1997, Law 23/1997 and Royal Decree 1915/1997 were approved by the Spanish Government in order to allow the transference of access rights amongst the
5 Marcos Dominguez (2003) pp 104-105.
6 Carlos Iglesias (2000). pp. 321, Agroconsulting Internacional (1996) volume 1
7 In Zones VIIj & g, whilst zones VIIa & f are reserved for coastal fleets.
8 Gonzalez Laxe (1996) pp 62-68.
9 Article 1 of the Council Regulation 3690/93 of the 20th of December.
10 Article 3 of the Council Regulation 3690/93 of the 20th of December.
11 Article 5 of the Council Regulation 3690/93 of the 20th of December.
264 – CHAPTER 8 – SPAIN
USING MARKET MECHANISMS TO MANAGE FISHERIES: SMOOTHING THE PATH – ISBN-92-64-03657-1 © OECD 2006
vessels making up the fleet. The overall objective was to ensure that vessels included in the census would have sufficient days to fish in reasonable conditions. Recently, Royal Decree 1596/2004, modifying RD 1915, has established a minimum of fishing rights that any vessel must own in order to be allowed to fish.
Over the last few years, the Spanish Administration has introduced an additional restriction consisting of a compulsory temporary stop of one month per year for each vessel, which can be divided into two periods of 15 days. The need to maintain this measure is re-evaluated each year, depending on the TAC approved by the European Council.
The 300s fleet and the duties of the Spanish authorities
With the accession of Spain to the Community Protocol, new regulations of access12 were established. The new regime brought in more restrictive regulations for the new members (Spain and Portugal) during a transition period. This transitory regime obliged the authorities of the new members to:
� Communicate entrances and exits from the CIEM zones (Regulation 3531/85).
� Establish quotas and fishing days per vessel and agree an acceptable calendar for each vessel.
� Monitor compliance
� Monitor catches and forward results of these in comparison to TACs, and vessel inspections, surveillance and notifications, to the European Commission.
� Publish the base and periodical list of vessels that can fish in the different zones.
� Administer license concessions, temporal suspensions and decommissions (Regulation 3690/93).
The Spanish authorities have the responsibility of distributing quota amongst the vessels. To facilitate transparency and ensure the allocation of a set number of days on which to fish, licenses are allocated per day to each vessel. 13
Vessel owners may transfer these by private arrangement. No data on transfer costs is required. When two vessels (old and new owners) communicate the transfer of their fishing rights from one to the other, the transfer is deemed valid by the authorities.
In addition, a vessel’s fishing rights can be “acquired” by buying it and then decommissioning it (or leasing it to an association or firm). Because the system permits such transfer of fishing rights linked to the most efficient vessels and not the user, it encourages technological innovation and the improves the use of capital.
With the Reform of the Common Fisheries Policy (CFP) in 1996, the transition regime was completed and controls across the European Community fleets were unified. At present, controls consist of:
� Captains communicating to their Member State an Effort Report.
� An evaluation of the global fishing effort by the vessels of each Member State.
12 Regulation EEC 3531 of 1985.
13 OECD, Towards Sustainable Fisheries: Country Reports. OCDE/GD(97)119
CHAPTER 8 – SPAIN – 265
USING MARKET MECHANISMS TO MANAGE FISHERIES: SMOOTHING THE PATH – ISBN-92-64-03657-1 © OECD 2006
� Communicating the nominative list, fishing effort evolution and the mechanism of fishing effort control to the European Commission.
� Member State control of their catches and ensuring the TAC observance. This includes vessel inspections, search and notifications to the Commission.
� Member State responsibility for the concession and administration of licenses, as well as temporal suspension or retirement.
At the time of implementation of the new scheme in 1986, higher costs would be incurred by national authorities as a result of increased used of labour, time and resources in order to guarantee a good fulfilment of their obligations. Nevertheless, it is difficult to directly measure such costs, particularly as the officers dealing with this fleet also undertook other tasks, for example, the maintenance of basic data for the whole of the Spanish fleet.
However, accurate evaluation of the time and human resources devoted to this activity in particular is a difficult task. Meanwhile, a 60% reduction in the number of vessels in existence after fleet adjustment from 1975 to the present time (from 500 to 198 vessels), has meant a better rationalisation of fleet management.
4. The Evolution of the 300s fleet
In 1992, the baseline of 300 vessels permitted to fish in Community waters as a result of the Treaty of Accession in 1986, was reduced to 259 vessels14, i.e. a reduction of 14.70% in the GRT and 9.89% in the HP. Today the number of vessels is less than 200, demonstrating a further reduction in the fleet.
In a stable TAC environment, this implies an increase in the efficiency and productivity per vessel and in effort (GRT, HP, etc.).
The internal adjustment of the 300s fleet has been mainly realised through market mechanisms. This process has been achieved via the transfer of fishing rights.
As the system allows concentration of fishing rights in the most efficient vessels, the process has led to a reduction in the number of vessels and an improved use of the remaining vessels.
The adjustment has been smooth as those who retire from the fishery receive some compensation in order to renounce their fishing rights. This has proven satisfactory from a social point of view. Figure 8.2 shows the evolution of the number of vessels from 1986
14 Boletin Oficial del Estado num. 88, 13 April 1994
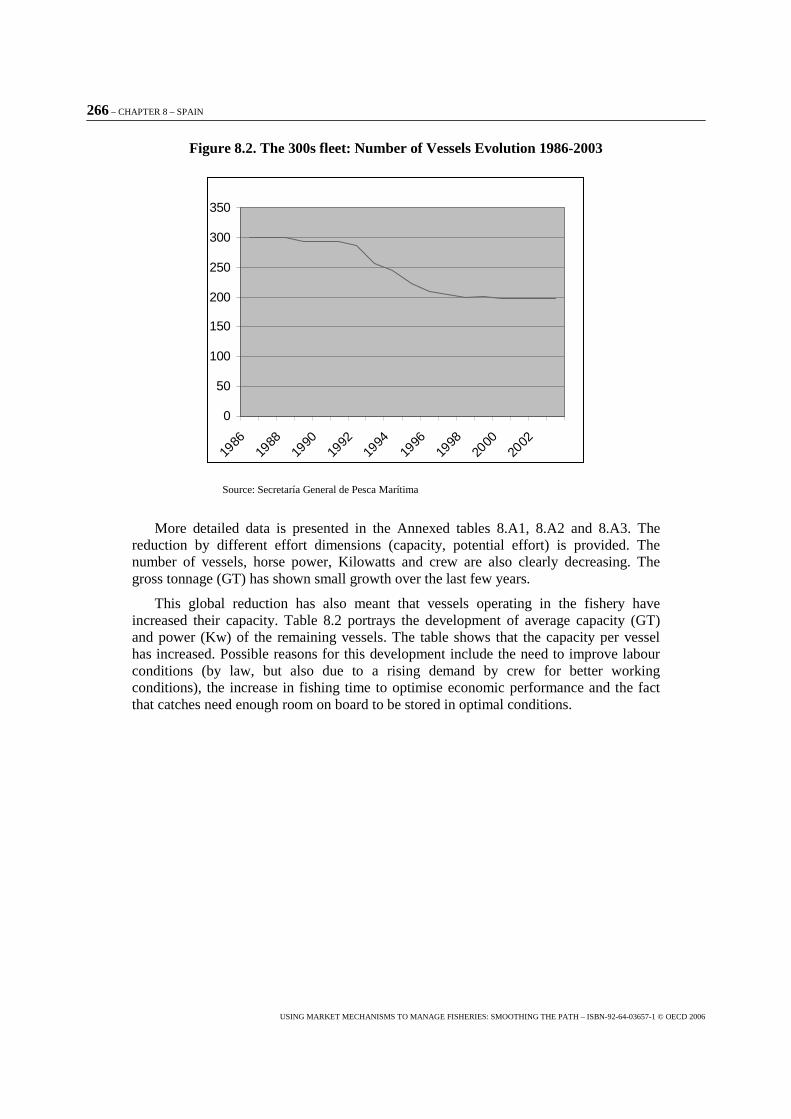
266 – CHAPTER 8 – SPAIN
USING MARKET MECHANISMS TO MANAGE FISHERIES: SMOOTHING THE PATH – ISBN-92-64-03657-1 © OECD 2006
Figure 8.2. The 300s fleet: Number of Vessels Evolution 1986-2003
0
50
100
150
200
250
300
350
1986
1988
1990
1992
1994
1996
1998
2000
2002
Source: Secretaría General de Pesca Marítima
More detailed data is presented in the Annexed tables 8.A1, 8.A2 and 8.A3. The reduction by different effort dimensions (capacity, potential effort) is provided. The number of vessels, horse power, Kilowatts and crew are also clearly decreasing. The gross tonnage (GT) has shown small growth over the last few years.
This global reduction has also meant that vessels operating in the fishery have increased their capacity. Table 8.2 portrays the development of average capacity (GT) and power (Kw) of the remaining vessels. The table shows that the capacity per vessel has increased. Possible reasons for this development include the need to improve labour conditions (by law, but also due to a rising demand by crew for better working conditions), the increase in fishing time to optimise economic performance and the fact that catches need enough room on board to be stored in optimal conditions.
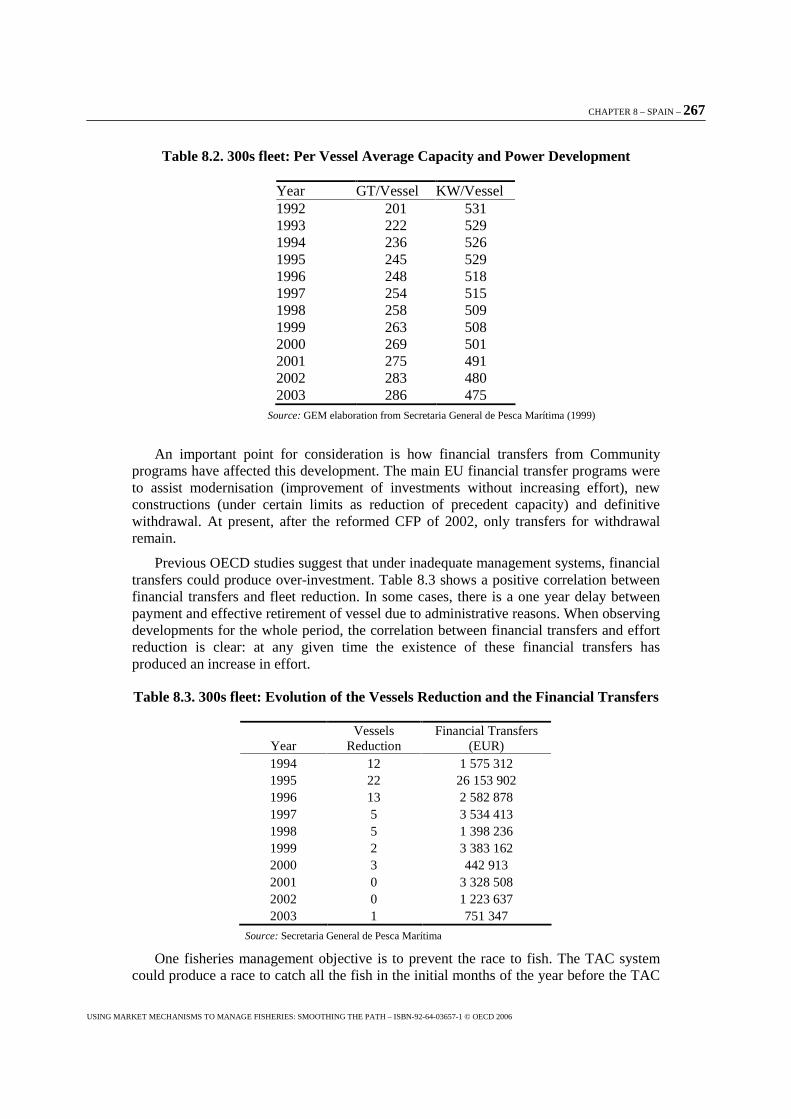
CHAPTER 8 – SPAIN – 267
USING MARKET MECHANISMS TO MANAGE FISHERIES: SMOOTHING THE PATH – ISBN-92-64-03657-1 © OECD 2006
Table 8.2. 300s fleet: Per Vessel Average Capacity and Power Development
Year GT/Vessel KW/Vessel 1992 201 531 1993 222 529 1994 236 526 1995 245 529 1996 248 518 1997 254 515 1998 258 509 1999 263 508 2000 269 501 2001 275 491 2002 283 480 2003 286 475
Source: GEM elaboration from Secretaria General de Pesca Marítima (1999)
An important point for consideration is how financial transfers from Community programs have affected this development. The main EU financial transfer programs were to assist modernisation (improvement of investments without increasing effort), new constructions (under certain limits as reduction of precedent capacity) and definitive withdrawal. At present, after the reformed CFP of 2002, only transfers for withdrawal remain.
Previous OECD studies suggest that under inadequate management systems, financial transfers could produce over-investment. Table 8.3 shows a positive correlation between financial transfers and fleet reduction. In some cases, there is a one year delay between payment and effective retirement of vessel due to administrative reasons. When observing developments for the whole period, the correlation between financial transfers and effort reduction is clear: at any given time the existence of these financial transfers has produced an increase in effort.
Table 8.3. 300s fleet: Evolution of the Vessels Reduction and the Financial Transfers
Year Vessels
Reduction Financial Transfers
(EUR) 1994 12 1 575 312 1995 22 26 153 902 1996 13 2 582 878 1997 5 3 534 413 1998 5 1 398 236 1999 2 3 383 162 2000 3 442 913 2001 0 3 328 508 2002 0 1 223 637 2003 1 751 347
Source: Secretaria General de Pesca Marítima
One fisheries management objective is to prevent the race to fish. The TAC system could produce a race to catch all the fish in the initial months of the year before the TAC
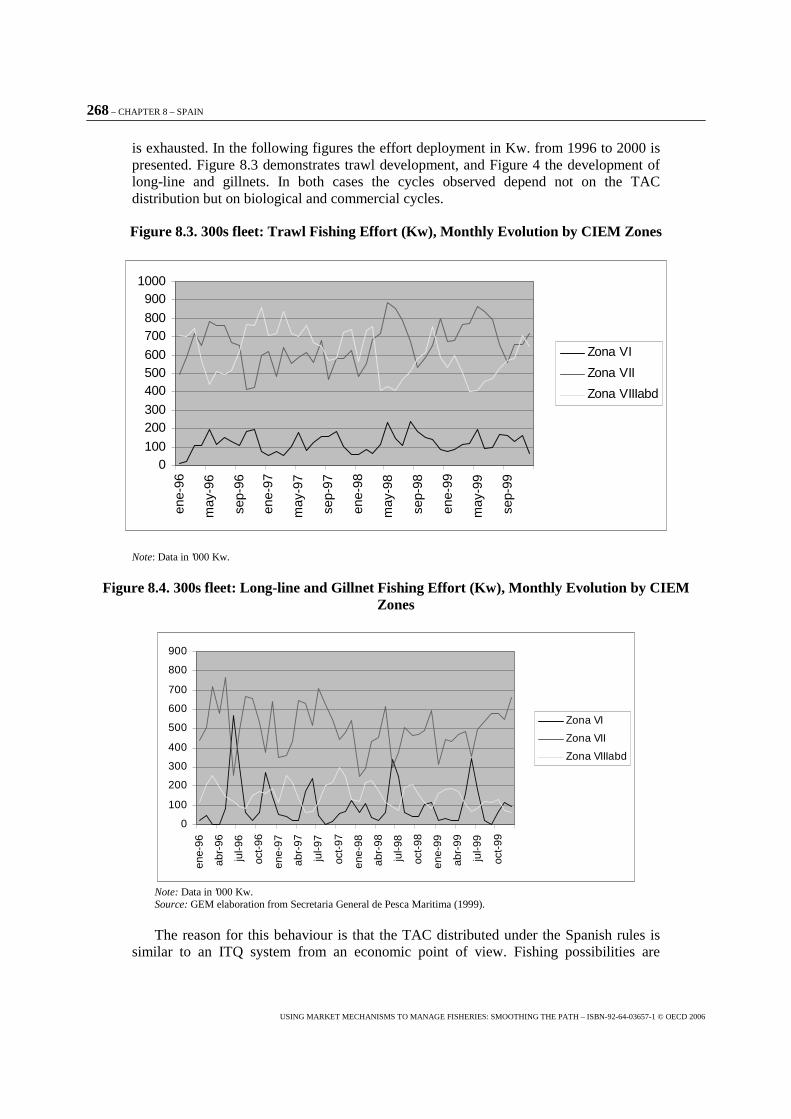
268 – CHAPTER 8 – SPAIN
USING MARKET MECHANISMS TO MANAGE FISHERIES: SMOOTHING THE PATH – ISBN-92-64-03657-1 © OECD 2006
is exhausted. In the following figures the effort deployment in Kw. from 1996 to 2000 is presented. Figure 8.3 demonstrates trawl development, and Figure 4 the development of long-line and gillnets. In both cases the cycles observed depend not on the TAC distribution but on biological and commercial cycles.
Figure 8.3. 300s fleet: Trawl Fishing Effort (Kw), Monthly Evolution by CIEM Zones
0100
200300
400500600
700800
9001000
ene-
96
may
-96
sep-
96
ene-
97
may
-97
sep-
97
ene-
98
may
-98
sep-
98
ene-
99
may
-99
sep-
99
Zona VI
Zona VII
Zona VIIIabd
Note: Data in ’000 Kw.
Figure 8.4. 300s fleet: Long-line and Gillnet Fishing Effort (Kw), Monthly Evolution by CIEM Zones
0
100
200
300
400
500
600
700
800
900
ene-
96
abr-
96
jul-9
6
oct-
96
ene-
97
abr-
97
jul-9
7
oct-
97
ene-
98
abr-
98
jul-9
8
oct-
98
ene-
99
abr-
99
jul-9
9
oct-
99
Zona VI
Zona VII
Zona VIIIabd
Note: Data in ’000 Kw. Source: GEM elaboration from Secretaria General de Pesca Maritima (1999).
The reason for this behaviour is that the TAC distributed under the Spanish rules is similar to an ITQ system from an economic point of view. Fishing possibilities are
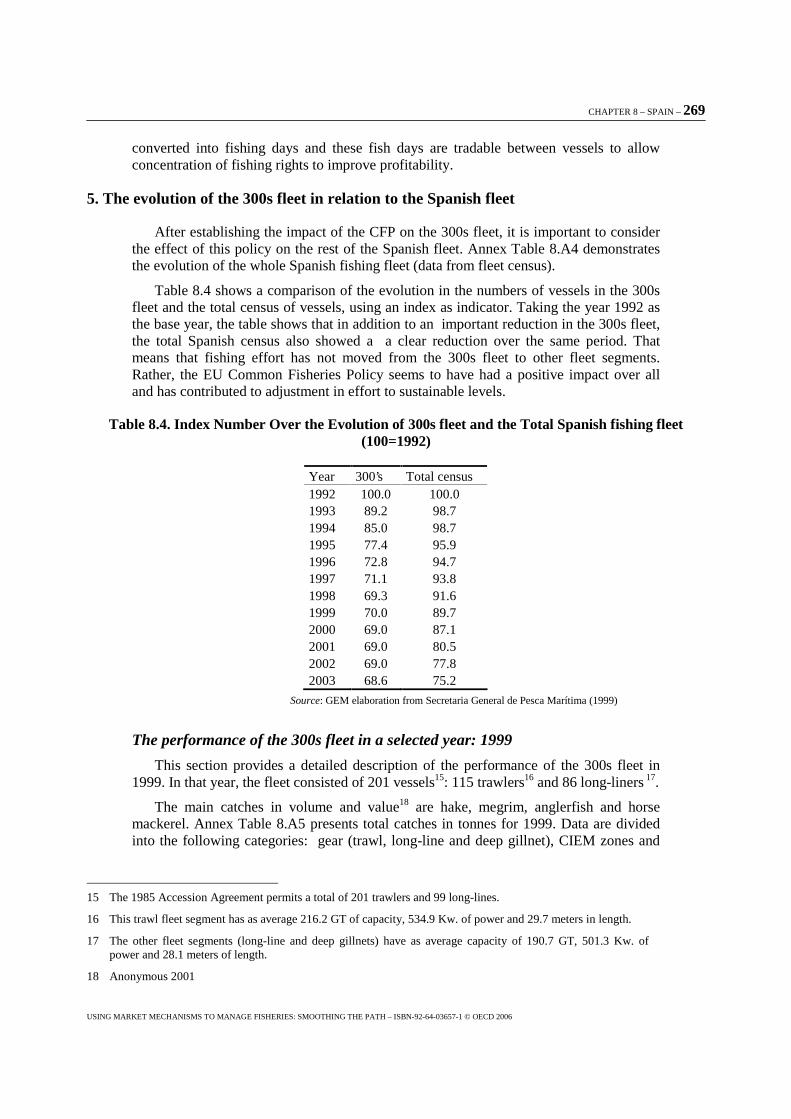
CHAPTER 8 – SPAIN – 269
USING MARKET MECHANISMS TO MANAGE FISHERIES: SMOOTHING THE PATH – ISBN-92-64-03657-1 © OECD 2006
converted into fishing days and these fish days are tradable between vessels to allow concentration of fishing rights to improve profitability.
5. The evolution of the 300s fleet in relation to the Spanish fleet
After establishing the impact of the CFP on the 300s fleet, it is important to consider the effect of this policy on the rest of the Spanish fleet. Annex Table 8.A4 demonstrates the evolution of the whole Spanish fishing fleet (data from fleet census).
Table 8.4 shows a comparison of the evolution in the numbers of vessels in the 300s fleet and the total census of vessels, using an index as indicator. Taking the year 1992 as the base year, the table shows that in addition to an important reduction in the 300s fleet, the total Spanish census also showed a a clear reduction over the same period. That means that fishing effort has not moved from the 300s fleet to other fleet segments. Rather, the EU Common Fisheries Policy seems to have had a positive impact over all and has contributed to adjustment in effort to sustainable levels.
Table 8.4. Index Number Over the Evolution of 300s fleet and the Total Spanish fishing fleet (100=1992)
Year 300’s Total census 1992 100.0 100.0 1993 89.2 98.7 1994 85.0 98.7 1995 77.4 95.9 1996 72.8 94.7 1997 71.1 93.8 1998 69.3 91.6 1999 70.0 89.7 2000 69.0 87.1 2001 69.0 80.5 2002 69.0 77.8 2003 68.6 75.2
Source: GEM elaboration from Secretaria General de Pesca Marítima (1999)
The performance of the 300s fleet in a selected year: 1999
This section provides a detailed description of the performance of the 300s fleet in 1999. In that year, the fleet consisted of 201 vessels15: 115 trawlers16 and 86 long-liners 17.
The main catches in volume and value18 are hake, megrim, anglerfish and horse mackerel. Annex Table 8.A5 presents total catches in tonnes for 1999. Data are divided into the following categories: gear (trawl, long-line and deep gillnet), CIEM zones and
15 The 1985 Accession Agreement permits a total of 201 trawlers and 99 long-lines.
16 This trawl fleet segment has as average 216.2 GT of capacity, 534.9 Kw. of power and 29.7 meters in length.
17 The other fleet segments (long-line and deep gillnets) have as average capacity of 190.7 GT, 501.3 Kw. of power and 28.1 meters of length.
18 Anonymous 2001
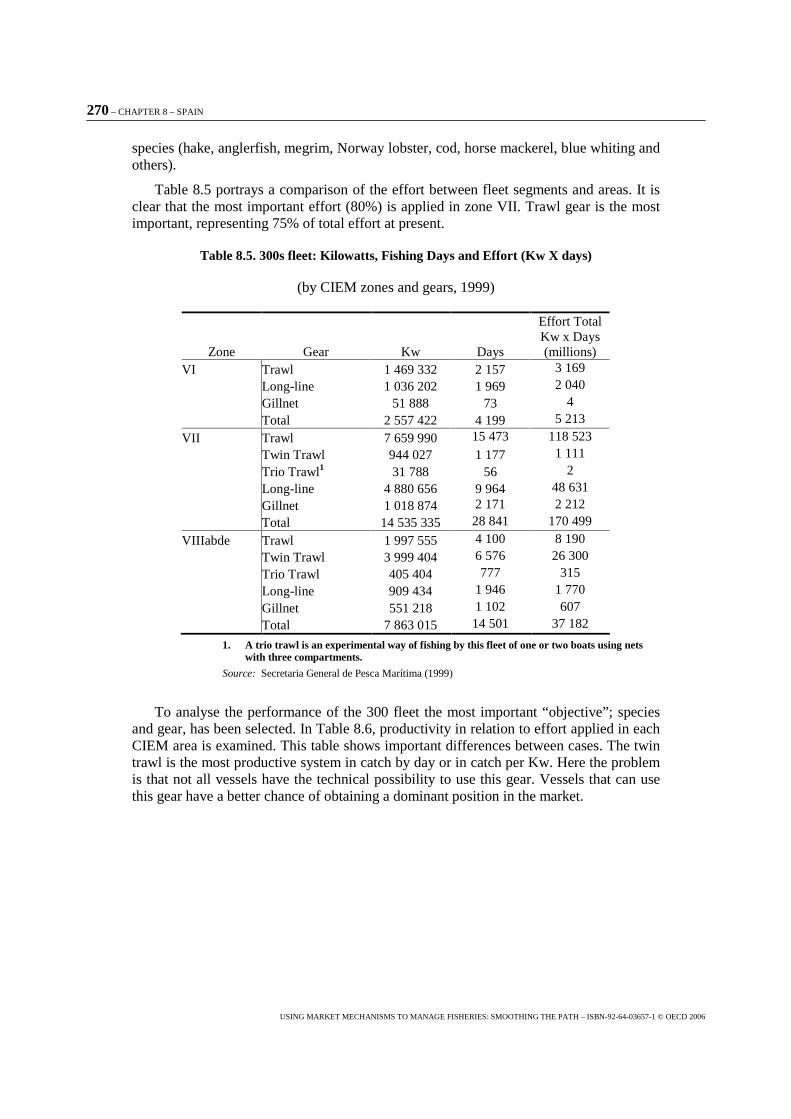
270 – CHAPTER 8 – SPAIN
USING MARKET MECHANISMS TO MANAGE FISHERIES: SMOOTHING THE PATH – ISBN-92-64-03657-1 © OECD 2006
species (hake, anglerfish, megrim, Norway lobster, cod, horse mackerel, blue whiting and others).
Table 8.5 portrays a comparison of the effort between fleet segments and areas. It is clear that the most important effort (80%) is applied in zone VII. Trawl gear is the most important, representing 75% of total effort at present.
Table 8.5. 300s fleet: Kilowatts, Fishing Days and Effort (Kw X days)
(by CIEM zones and gears, 1999)
Zone Gear Kw Days
Effort Total Kw x Days (millions)
VI Trawl 1 469 332 2 157 3 169
Long-line 1 036 202 1 969 2 040
Gillnet 51 888 73 4
Total 2 557 422 4 199 5 213
VII Trawl 7 659 990 15 473 118 523
Twin Trawl 944 027 1 177 1 111
Trio Trawl1 31 788 56 2
Long-line 4 880 656 9 964 48 631
Gillnet 1 018 874 2 171 2 212
Total 14 535 335 28 841 170 499
VIIIabde Trawl 1 997 555 4 100 8 190
Twin Trawl 3 999 404 6 576 26 300
Trio Trawl 405 404 777 315
Long-line 909 434 1 946 1 770
Gillnet 551 218 1 102 607
Total 7 863 015 14 501 37 182
1. A trio trawl is an experimental way of fishing by this fleet of one or two boats using nets with three compartments.
Source: Secretaria General de Pesca Marítima (1999)
To analyse the performance of the 300 fleet the most important “objective”; species and gear, has been selected. In Table 8.6, productivity in relation to effort applied in each CIEM area is examined. This table shows important differences between cases. The twin trawl is the most productive system in catch by day or in catch per Kw. Here the problem is that not all vessels have the technical possibility to use this gear. Vessels that can use this gear have a better chance of obtaining a dominant position in the market.
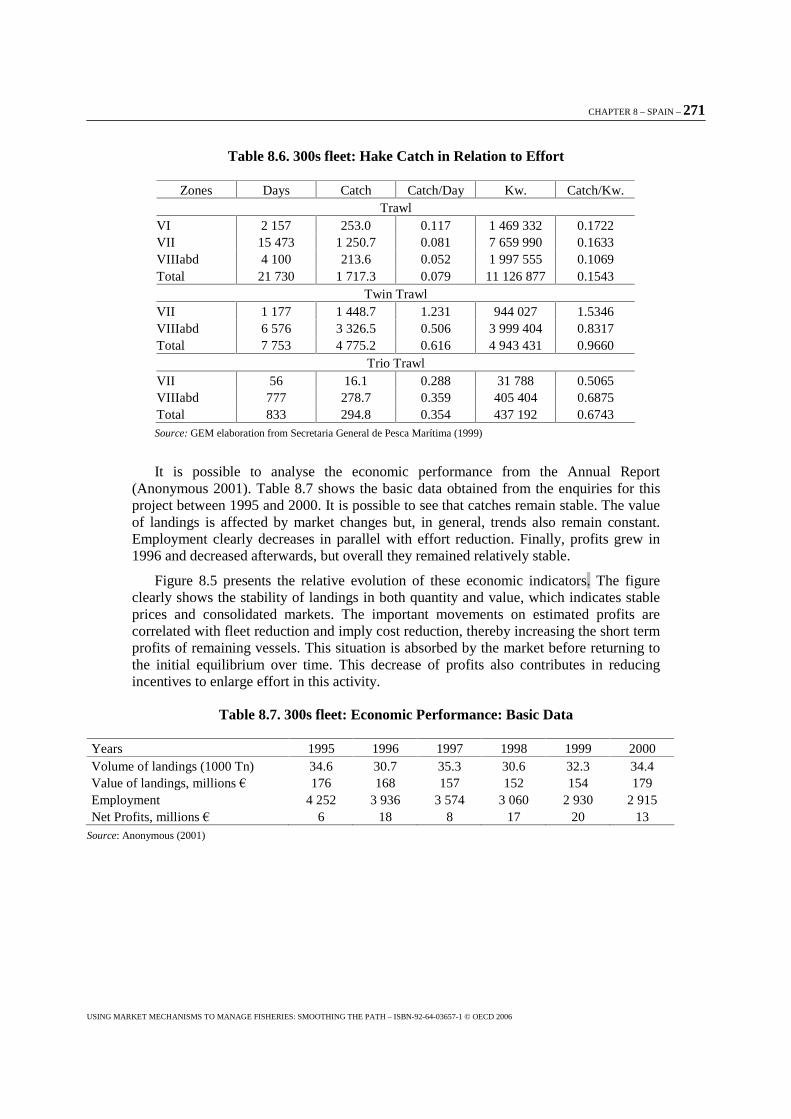
CHAPTER 8 – SPAIN – 271
USING MARKET MECHANISMS TO MANAGE FISHERIES: SMOOTHING THE PATH – ISBN-92-64-03657-1 © OECD 2006
Table 8.6. 300s fleet: Hake Catch in Relation to Effort
Zones Days Catch Catch/Day Kw. Catch/Kw. Trawl
VI 2 157 253.0 0.117 1 469 332 0.1722 VII 15 473 1 250.7 0.081 7 659 990 0.1633 VIIIabd 4 100 213.6 0.052 1 997 555 0.1069 Total 21 730 1 717.3 0.079 11 126 877 0.1543
Twin Trawl VII 1 177 1 448.7 1.231 944 027 1.5346 VIIIabd 6 576 3 326.5 0.506 3 999 404 0.8317 Total 7 753 4 775.2 0.616 4 943 431 0.9660
Trio Trawl VII 56 16.1 0.288 31 788 0.5065 VIIIabd 777 278.7 0.359 405 404 0.6875 Total 833 294.8 0.354 437 192 0.6743
Source: GEM elaboration from Secretaria General de Pesca Marítima (1999)
It is possible to analyse the economic performance from the Annual Report (Anonymous 2001). Table 8.7 shows the basic data obtained from the enquiries for this project between 1995 and 2000. It is possible to see that catches remain stable. The value of landings is affected by market changes but, in general, trends also remain constant. Employment clearly decreases in parallel with effort reduction. Finally, profits grew in 1996 and decreased afterwards, but overall they remained relatively stable.
Figure 8.5 presents the relative evolution of these economic indicators. The figure clearly shows the stability of landings in both quantity and value, which indicates stable prices and consolidated markets. The important movements on estimated profits are correlated with fleet reduction and imply cost reduction, thereby increasing the short term profits of remaining vessels. This situation is absorbed by the market before returning to the initial equilibrium over time. This decrease of profits also contributes in reducing incentives to enlarge effort in this activity.
Table 8.7. 300s fleet: Economic Performance: Basic Data
Years 1995 1996 1997 1998 1999 2000 Volume of landings (1000 Tn) 34.6 30.7 35.3 30.6 32.3 34.4 Value of landings, millions � 176 168 157 152 154 179 Employment 4 252 3 936 3 574 3 060 2 930 2 915 Net Profits, millions � 6 18 8 17 20 13
Source: Anonymous (2001)
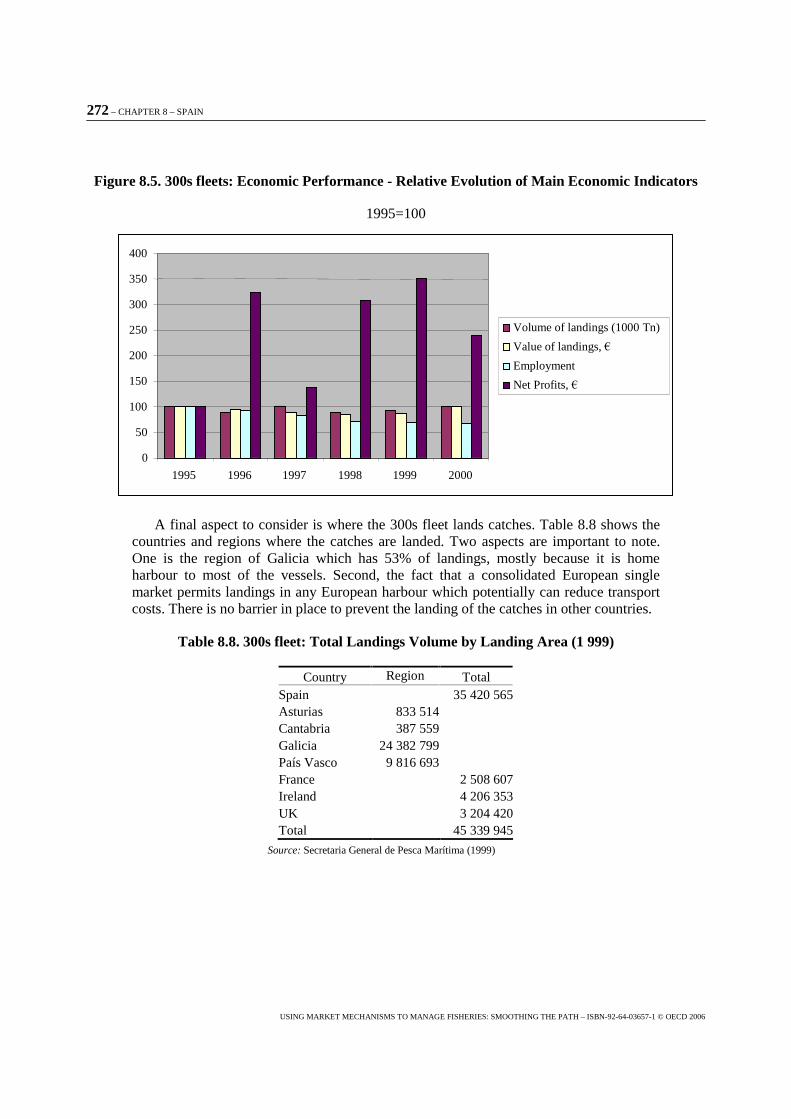
272 – CHAPTER 8 – SPAIN
USING MARKET MECHANISMS TO MANAGE FISHERIES: SMOOTHING THE PATH – ISBN-92-64-03657-1 © OECD 2006
Figure 8.5. 300s fleets: Economic Performance - Relative Evolution of Main Economic Indicators
1995=100
A final aspect to consider is where the 300s fleet lands catches. Table 8.8 shows the countries and regions where the catches are landed. Two aspects are important to note. One is the region of Galicia which has 53% of landings, mostly because it is home harbour to most of the vessels. Second, the fact that a consolidated European single market permits landings in any European harbour which potentially can reduce transport costs. There is no barrier in place to prevent the landing of the catches in other countries.
Table 8.8. 300s fleet: Total Landings Volume by Landing Area (1 999)
Country Region Total Spain 35 420 565Asturias 833 514Cantabria 387 559Galicia 24 382 799País Vasco 9 816 693France 2 508 607Ireland 4 206 353UK 3 204 420Total 45 339 945
Source: Secretaria General de Pesca Marítima (1999)
0
50
100
150
200
250
300
350
400
1995 1996 1997 1998 1999 2000
Volume of landings (1000 Tn) Value of landings, � Employment Net Profits, �
CHAPTER 8 – SPAIN – 273
USING MARKET MECHANISMS TO MANAGE FISHERIES: SMOOTHING THE PATH – ISBN-92-64-03657-1 © OECD 2006
6. Conclusions
Before the UNCLOS regulation and the adoption of EEZ, the number of vessels constituting the 300s fleet was around 500. Before Spain joined the EEC, the number was 416 vessels. In 1986, as a result of the Treaty, a base list of 300 Spanish vessels was permitted to fish in Community waters. It was further reduced to 259 vessels in 1992. At present the fleet comprises only 198 vessels. This restructuring process has permitted the maintenance of resources and the profitability of remaining enterprises.
From the experience of the 300s fleet, some conclusions can be drawn:
� The Spanish system governing the 300 fleet contributes to a rationalisation of fisheries exploitation. In fact, the system has been transformed into a semi-ITQ system, where the fishing rights are expressed in fishing days and their transfer is possible.
� An analysis of the 300s fleet history shows that financial transfers have not been the main problem. On the contrary, financial transfers have proved necessary after a redistribution of fishing rights (EEZ application) that created the need to restructure the sector.
� The existence of these financial transfers in a limited period of time has contributed to solve a critical problem of over-investment.
� In the 300s fleet, the use of financial transfers to restructure this segment has not produced any impact over other national segments. The use of other measures such as closed census and an effective deployment of the monitoring systems explain this behaviour.
� In the framework of the management system a “race to fish” has not materialised. On the contrary, this fleet provides fish on a regular basis in response to market demand.
� The application of global management measures has allowed a rationalisation in the use of time and human resources.
274 – CHAPTER 8 – SPAIN
USING MARKET MECHANISMS TO MANAGE FISHERIES: SMOOTHING THE PATH – ISBN-92-64-03657-1 © OECD 2006
Bibliography
Anonymous (2001), "Economic Performance of Selected European Fishing Fleets". Annual Report. SJFI, Denmark. European Commission Project 00/32.
Agroconsulting Internacional (1996), El Sector Pesquero Español en la Unión Europea. 2 volumes. Fundación Alfonso Martín Escudero. Madrid.
European Commission (1985), Spanish Adherence Treaty, Brussels.
Dominguez, C Marcos (2003) "La gestión de recursos pesqueros en el marco de la PCP: análisis de cooperación". Doctoral Thesis. Universidad de Vigo. Vigo.
Gonzalez Laxe, F. & Macau i Nadal, J., (1996) "Fortalezas y Debilidades de la Europa Azul. Series Estudios Sectoriales 11". Fundación CaixaGalicia. Vigo.
Iglesias, Carlos (2000). "Análisis Económico de la Regulación de Pesquerías en la Europa Azul: Experiencias y Alternativas: . Doctoral Thesis. Universidad de Vigo. Vigo.
MAPA (1990), Legislación pesquera, Régimen jurídico de la pesca marítima. Edición 1990. Madrid
MAPA (1998), Legislación pesquera, Régimen jurídico de la pesca marítima. Edición 1998. Madrid
OECD (1997), Towards Sustainable Fisheries: Country Reports. OCDE/GD(97)119
SGPM (1999) "Informe de gestión de la flota pesquera española que faena en aguas de la UE". Madrid.
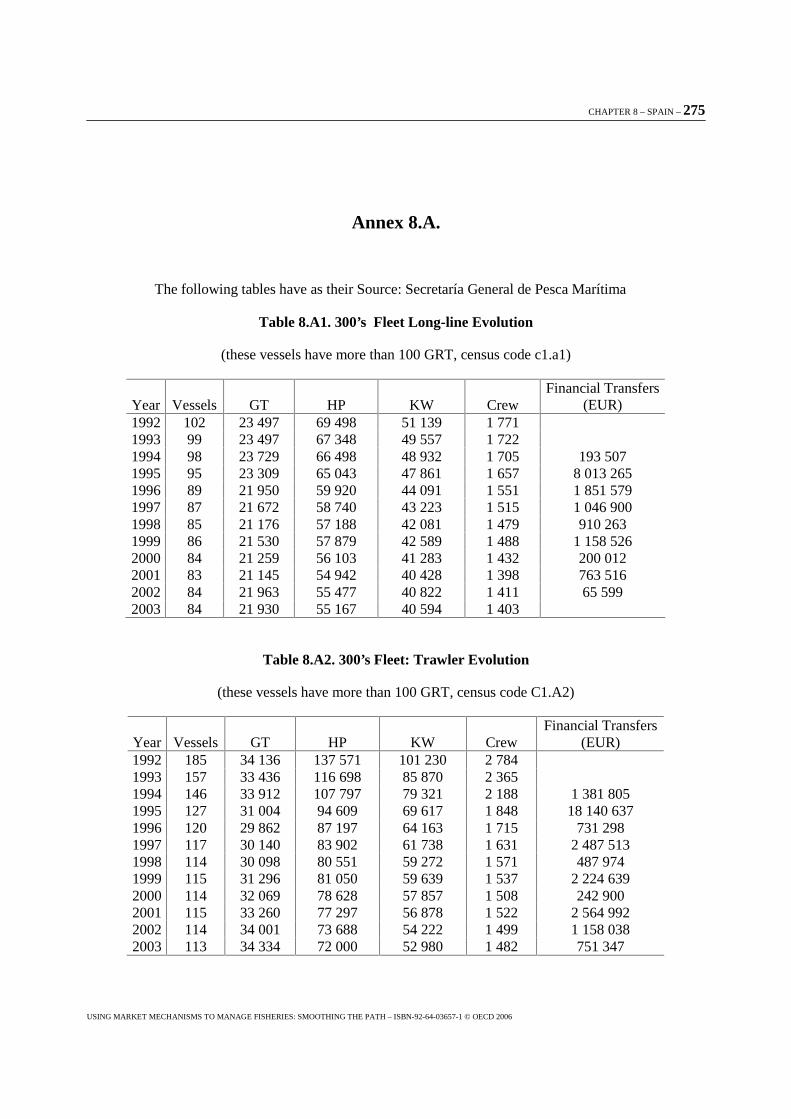
CHAPTER 8 – SPAIN – 275
USING MARKET MECHANISMS TO MANAGE FISHERIES: SMOOTHING THE PATH – ISBN-92-64-03657-1 © OECD 2006
Annex 8.A.
The following tables have as their Source: Secretaría General de Pesca Marítima
Table 8.A1. 300’s Fleet Long-line Evolution
(these vessels have more than 100 GRT, census code c1.a1)
Year Vessels GT HP KW Crew Financial Transfers
(EUR) 1992 102 23 497 69 498 51 139 1 771 1993 99 23 497 67 348 49 557 1 722 1994 98 23 729 66 498 48 932 1 705 193 507 1995 95 23 309 65 043 47 861 1 657 8 013 265 1996 89 21 950 59 920 44 091 1 551 1 851 579 1997 87 21 672 58 740 43 223 1 515 1 046 900 1998 85 21 176 57 188 42 081 1 479 910 263 1999 86 21 530 57 879 42 589 1 488 1 158 526 2000 84 21 259 56 103 41 283 1 432 200 012 2001 83 21 145 54 942 40 428 1 398 763 516 2002 84 21 963 55 477 40 822 1 411 65 599 2003 84 21 930 55 167 40 594 1 403
Table 8.A2. 300’s Fleet: Trawler Evolution
(these vessels have more than 100 GRT, census code C1.A2)
Year Vessels GT HP KW Crew Financial Transfers
(EUR) 1992 185 34 136 137 571 101 230 2 784 1993 157 33 436 116 698 85 870 2 365 1994 146 33 912 107 797 79 321 2 188 1 381 805 1995 127 31 004 94 609 69 617 1 848 18 140 637 1996 120 29 862 87 197 64 163 1 715 731 298 1997 117 30 140 83 902 61 738 1 631 2 487 513 1998 114 30 098 80 551 59 272 1 571 487 974 1999 115 31 296 81 050 59 639 1 537 2 224 639 2000 114 32 069 78 628 57 857 1 508 242 900 2001 115 33 260 77 297 56 878 1 522 2 564 992 2002 114 34 001 73 688 54 222 1 499 1 158 038 2003 113 34 334 72 000 52 980 1 482 751 347
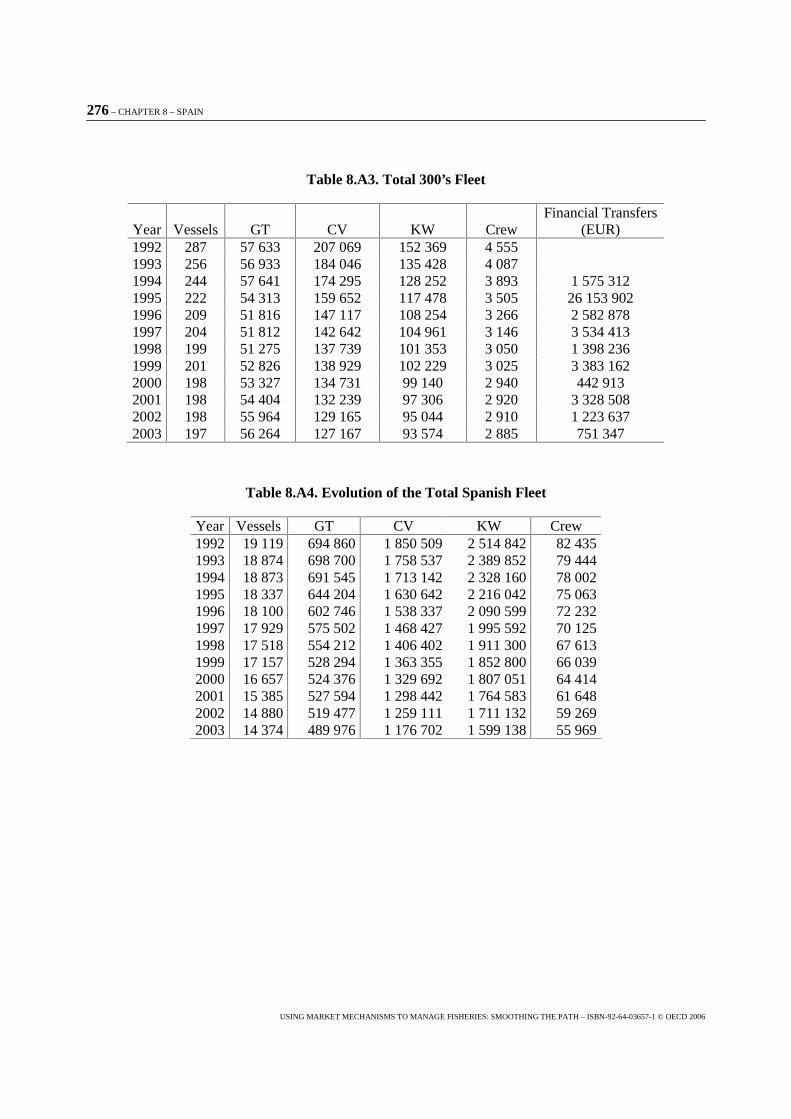
276 – CHAPTER 8 – SPAIN
USING MARKET MECHANISMS TO MANAGE FISHERIES: SMOOTHING THE PATH – ISBN-92-64-03657-1 © OECD 2006
Table 8.A3. Total 300’s Fleet
Year Vessels GT CV KW Crew Financial Transfers
(EUR) 1992 287 57 633 207 069 152 369 4 555 1993 256 56 933 184 046 135 428 4 087 1994 244 57 641 174 295 128 252 3 893 1 575 312 1995 222 54 313 159 652 117 478 3 505 26 153 902 1996 209 51 816 147 117 108 254 3 266 2 582 878 1997 204 51 812 142 642 104 961 3 146 3 534 413 1998 199 51 275 137 739 101 353 3 050 1 398 236 1999 201 52 826 138 929 102 229 3 025 3 383 162 2000 198 53 327 134 731 99 140 2 940 442 913 2001 198 54 404 132 239 97 306 2 920 3 328 508 2002 198 55 964 129 165 95 044 2 910 1 223 637 2003 197 56 264 127 167 93 574 2 885 751 347
Table 8.A4. Evolution of the Total Spanish Fleet
Year Vessels GT CV KW Crew 1992 19 119 694 860 1 850 509 2 514 842 82 435 1993 18 874 698 700 1 758 537 2 389 852 79 444 1994 18 873 691 545 1 713 142 2 328 160 78 002 1995 18 337 644 204 1 630 642 2 216 042 75 063 1996 18 100 602 746 1 538 337 2 090 599 72 232 1997 17 929 575 502 1 468 427 1 995 592 70 125 1998 17 518 554 212 1 406 402 1 911 300 67 613 1999 17 157 528 294 1 363 355 1 852 800 66 039 2000 16 657 524 376 1 329 692 1 807 051 64 414 2001 15 385 527 594 1 298 442 1 764 583 61 648 2002 14 880 519 477 1 259 111 1 711 132 59 269 2003 14 374 489 976 1 176 702 1 599 138 55 969
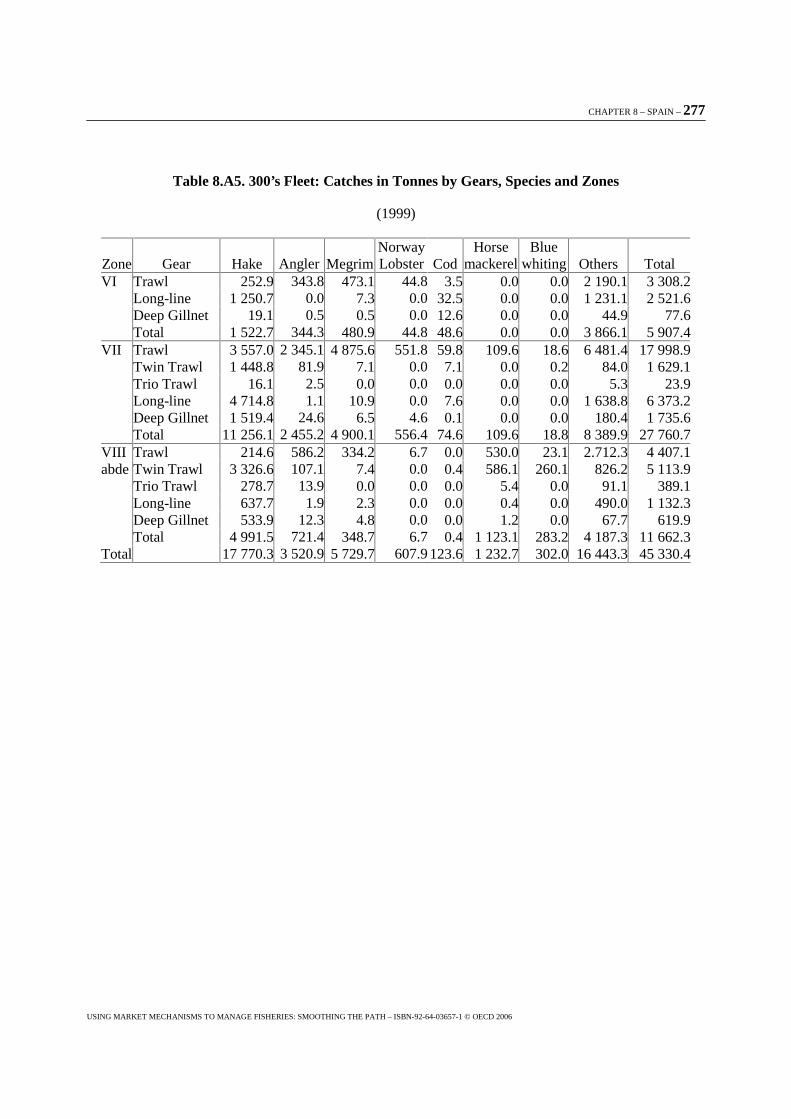
CHAPTER 8 – SPAIN – 277
USING MARKET MECHANISMS TO MANAGE FISHERIES: SMOOTHING THE PATH – ISBN-92-64-03657-1 © OECD 2006
Table 8.A5. 300’s Fleet: Catches in Tonnes by Gears, Species and Zones
(1999)
Zone Gear Hake
Angler Megrim Norway Lobster Cod
Horse mackerel
Blue whiting Others Total
VI Trawl 252.9 343.8 473.1 44.8 3.5 0.0 0.0 2 190.1 3 308.2 Long-line 1 250.7 0.0 7.3 0.0 32.5 0.0 0.0 1 231.1 2 521.6 Deep Gillnet 19.1 0.5 0.5 0.0 12.6 0.0 0.0 44.9 77.6 Total 1 522.7 344.3 480.9 44.8 48.6 0.0 0.0 3 866.1 5 907.4VII Trawl 3 557.0 2 345.1 4 875.6 551.8 59.8 109.6 18.6 6 481.4 17 998.9 Twin Trawl 1 448.8 81.9 7.1 0.0 7.1 0.0 0.2 84.0 1 629.1 Trio Trawl 16.1 2.5 0.0 0.0 0.0 0.0 0.0 5.3 23.9 Long-line 4 714.8 1.1 10.9 0.0 7.6 0.0 0.0 1 638.8 6 373.2 Deep Gillnet 1 519.4 24.6 6.5 4.6 0.1 0.0 0.0 180.4 1 735.6 Total 11 256.1 2 455.2 4 900.1 556.4 74.6 109.6 18.8 8 389.9 27 760.7VIII Trawl 214.6 586.2 334.2 6.7 0.0 530.0 23.1 2.712.3 4 407.1abde Twin Trawl 3 326.6 107.1 7.4 0.0 0.4 586.1 260.1 826.2 5 113.9 Trio Trawl 278.7 13.9 0.0 0.0 0.0 5.4 0.0 91.1 389.1 Long-line 637.7 1.9 2.3 0.0 0.0 0.4 0.0 490.0 1 132.3 Deep Gillnet 533.9 12.3 4.8 0.0 0.0 1.2 0.0 67.7 619.9 Total 4 991.5 721.4 348.7 6.7 0.4 1 123.1 283.2 4 187.3 11 662.3Total 17 770.3 3 520.9 5 729.7 607.9 123.6 1 232.7 302.0 16 443.3 45 330.4
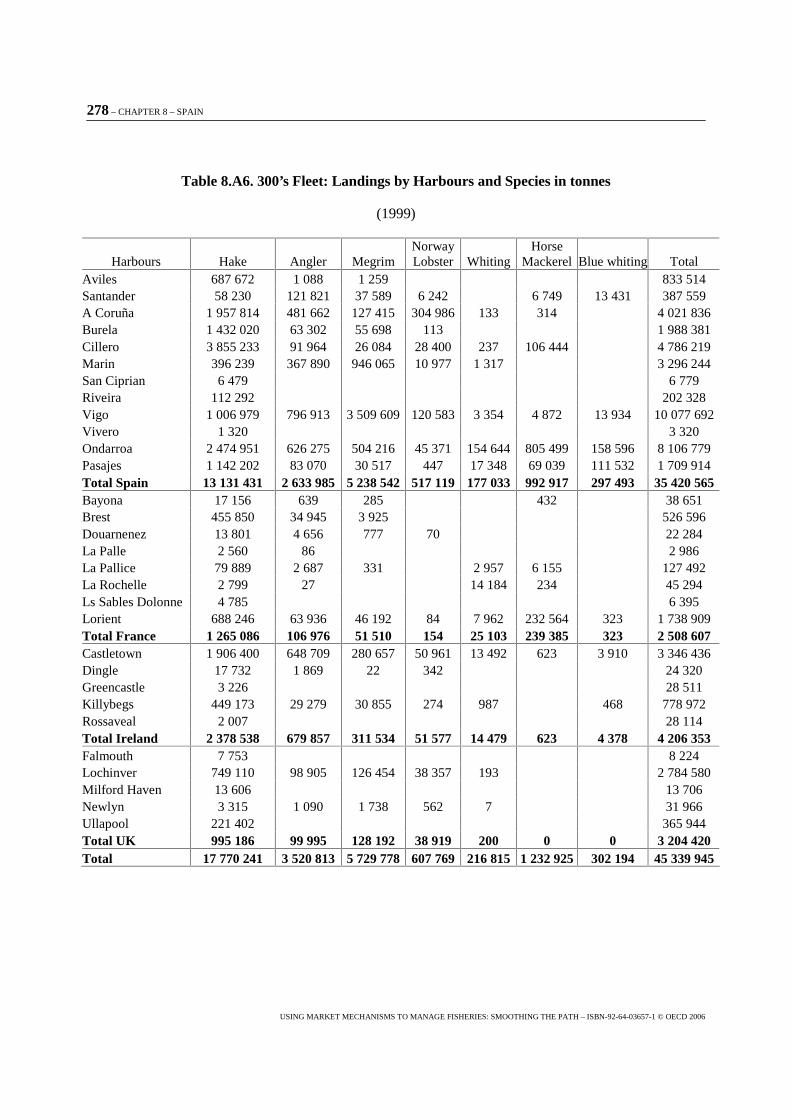
278 – CHAPTER 8 – SPAIN
USING MARKET MECHANISMS TO MANAGE FISHERIES: SMOOTHING THE PATH – ISBN-92-64-03657-1 © OECD 2006
Table 8.A6. 300’s Fleet: Landings by Harbours and Species in tonnes
(1999)
Harbours Hake Angler Megrim Norway Lobster Whiting
Horse Mackerel Blue whiting Total
Aviles 687 672 1 088 1 259 833 514 Santander 58 230 121 821 37 589 6 242 6 749 13 431 387 559 A Coruña 1 957 814 481 662 127 415 304 986 133 314 4 021 836 Burela 1 432 020 63 302 55 698 113 1 988 381 Cillero 3 855 233 91 964 26 084 28 400 237 106 444 4 786 219 Marin 396 239 367 890 946 065 10 977 1 317 3 296 244 San Ciprian 6 479 6 779 Riveira 112 292 202 328 Vigo 1 006 979 796 913 3 509 609 120 583 3 354 4 872 13 934 10 077 692 Vivero 1 320 3 320 Ondarroa 2 474 951 626 275 504 216 45 371 154 644 805 499 158 596 8 106 779 Pasajes 1 142 202 83 070 30 517 447 17 348 69 039 111 532 1 709 914 Total Spain 13 131 431 2 633 985 5 238 542 517 119 177 033 992 917 297 493 35 420 565 Bayona 17 156 639 285 432 38 651 Brest 455 850 34 945 3 925 526 596 Douarnenez 13 801 4 656 777 70 22 284 La Palle 2 560 86 2 986 La Pallice 79 889 2 687 331 2 957 6 155 127 492 La Rochelle 2 799 27 14 184 234 45 294 Ls Sables Dolonne 4 785 6 395 Lorient 688 246 63 936 46 192 84 7 962 232 564 323 1 738 909 Total France 1 265 086 106 976 51 510 154 25 103 239 385 323 2 508 607 Castletown 1 906 400 648 709 280 657 50 961 13 492 623 3 910 3 346 436 Dingle 17 732 1 869 22 342 24 320 Greencastle 3 226 28 511 Killybegs 449 173 29 279 30 855 274 987 468 778 972 Rossaveal 2 007 28 114 Total Ireland 2 378 538 679 857 311 534 51 577 14 479 623 4 378 4 206 353 Falmouth 7 753 8 224 Lochinver 749 110 98 905 126 454 38 357 193 2 784 580 Milford Haven 13 606 13 706 Newlyn 3 315 1 090 1 738 562 7 31 966 Ullapool 221 402 365 944 Total UK 995 186 99 995 128 192 38 919 200 0 0 3 204 420 Total 17 770 241 3 520 813 5 729 778 607 769 216 815 1 232 925 302 194 45 339 945
CHAPTER 9 – UNITED KINGDOM – 279
USING MARKET MECHANISMS TO MANAGE FISHERIES: SMOOTHING THE PATH – ISBN-92-64-03657-1 © OECD 2006
Chapter 9
United Kingdom The Move Towards Market Mechanisms in the United Kingdom
This paper summarises the development of the quota management system in the UK and then focuses on one of the key features of market based instruments: transferability of quota. It looks at how the transferability of quota has increased due to changes made to the system in 2002.
1. Background1
When the resource conservation component of the Common Fisheries Policy (CFP) was put in place in 1983, the UK Government already had a history of quota management arrangements for a number of stocks for which quotas had previously been agreed under the auspices of the North East Atlantic Fisheries Commission (NEAFC). In addition, since 1980 separate allocations from the quotas for mackerel and the main herring stocks had been reserved for the relatively small pelagic freezer trawler sector (these vessels, together with the big purse-seiners, were the only UK fleet sectors to come under restrictive licensing before 1984, when the “pressure stock” licensing system(2) was introduced).
In 1983 a much wider range of stocks became subject to quotas under the CFP. As fishing effort increased over the next few years by an industry which was still expanding in domestic waters, particularly in the Area VII demersal fisheries, weekly (later to become monthly) landings limits were extended to cover fishing for quota stocks by all vessels over 10 metres in length.
Early in 1984, however, the Shetland Fish Producers’ Organisation (SFPO), one of 14 POs then established in the UK, successfully applied to the Government to be given its own annual allocations from the Area IV and VI haddock quotas to manage on behalf of its members. These allocations were based on the historic share of the UK’s haddock catches landed by SFPO members. Later that year a number of other POs (as well as a few of the larger fishing firms) were given allocations from the Area IV and VI cod quotas on a similar basis, while in 1985 annual quotas were allocated to POs for Area
1 This is an extract from Future Options for UK fish quota management (A Hatcher, S Pascoe, R Banks and R Arnason, 2002).
2 The development of the UK’s restrictive licensing system, to which the quota management system is linked, is described in Appendix I.
280 – CHAPTER 9 – UNITED KINGDOM
USING MARKET MECHANISMS TO MANAGE FISHERIES: SMOOTHING THE PATH – ISBN-92-64-03657-1 © OECD 2006
IV/VI cod, haddock, whiting and saithe as well as Area IV herring. By the following year, most of the POs whose members were active in the North Sea and West of Scotland areas were receiving annual quota allocations for most of the stocks in these areas. Also from 1985, annual allocations from the main mackerel and herring quotas were granted to individual freezer trawlers and purse-seiners instead of parts of the quotas being reserved for these sectors as a whole.
The system of PO quota allocations was extended, at the industry’s request, to cover quotas in the Irish Sea in 1990 and then the remainder of Area VII in 1991. By this time all the UK POs were managing quota allocations on behalf of their members. Annual allocations were now routinely based on the combined landings track records of each PO’s over-10-metre vessel membership during the previous three years (calculated as a percentage of the total landings by UK vessels over the same reference period).(3) Fishing for quota stocks by vessels not belonging to a PO, as well as by PO member vessels whose PO had not requested an allocation for a particular stock, continued to be regulated directly by the Government by means of (in most cases) monthly landings limits. The uptake of the quota shares reserved for the inshore (10 metre and under) sector was not regulated unless the level of estimated landings dictated an early fishery closure.(4)
Before 1995 the POs could more or less freely decide each year which quotas they wished to manage. Given the track-record based allocation system, this allowed for a degree of strategic behaviour. For example, it was possible for POs to “build up” relatively strong track records for particular stocks while fishing against the Government’s monthly landings limits before requesting a sectoral allocation. Conversely, it was possible for a PO to decline an allocation if its catch performance in the preceding three years would result in stricter quota controls for its members than they would face fishing against anticipated non-sector monthly limits. In addition, vessels in some POs had allegedly been reporting catches as coming from areas in which the PO had not taken allocations instead of counting those catches against their sectoral quotas.
In 1995, in order to simplify the system and to press the POs into taking more management responsibility, the Government obliged the POs to accept allocations for all demersal species quotas (however small some of the allocations might be), although the management of the various pelagic quotas remained optional. From 1999, however, POs and other groups choosing to receive sectoral allocations for demersal stocks were similarly obliged to take allocations for all pelagic stocks.
Under the sectoral quota system each of the POs was free to decide on the means by which they managed their quota allocations. Some chose to operate a common quota pool and set monthly landings limits for the membership, others allocated individual annual quotas to member vessels or companies for some or all stocks, normally based on each vessel’s track record. Individual vessel allocations were granted directly by the Government only to purse-seiners and freezer trawlers in respect of the main mackerel and herring stocks (where the vessels were not in membership of a PO taking a quota allocation for these stocks).
3 The reference period was two years in the case of some pelagic stocks.
4 More recently temporary stops, and lately monthly limits, have been imposed for a few stocks in an attempt to spread a fishery over 12 months.
CHAPTER 9 – UNITED KINGDOM – 281
USING MARKET MECHANISMS TO MANAGE FISHERIES: SMOOTHING THE PATH – ISBN-92-64-03657-1 © OECD 2006
2. Current management arrangements
Quota management rules
The principal features of the quota management arrangements as they operated in 2001 are set out below.5 Firstly, the allocation mechanism can be summarised as follows:
� Quota allocations are made to POs in respect of the vessels over 10m in length in their membership6 in proportion to the total number of FQA units associated with those vessels’ licences. POs opting to manage demersal species quotas or pelagic species quotas must accept allocations for all demersal stocks and all pelagic stocks respectively. In the case of pelagic stocks allocations can also be made to groups of vessels other than POs (currently this applies to just one fishing company).
� For each stock a “non-sector” allocation is reserved for those over 10m vessels not in membership of a PO, in proportion to the total number of units associated with those vessels’ licences (but see below).
� Allocations are set aside for the 10m and under fleet on the basis of the total number of units assigned to this group (but see below).(7)
Management of the non-sector and 10m and under vessels
The Government Fisheries Departments regulate the uptake of quota allocations by the non-sector and the 10m and under fleet by varying the amounts these vessels are allowed to catch and land by virtue of the conditions attached to their licences. In the case of the non-sector (over 10m vessels) landings for most stocks are restricted to monthly limits (or per trip limits in the case of some pelagic stocks) which are varied as necessary, in consultation with the industry. Although in the past limits were often set according to vessel length, the size and composition of the non-sector is now such that all limits are flat-rate, i.e., the same for all vessels. Landings by the 10m and under fleet have until recently generally been unrestricted although temporary fishery closures were sometimes imposed for certain species (notably sole and Nephrops). Towards the end of 1999, however, monthly catch limits were imposed for Nephrops in the North Sea and these were extended to other areas in 2000.
Quota management by the POs
There are now 20 sea fishing POs established and officially recognised in the United Kingdom. In 2001 their combined membership accounted for nearly 70% of the total number of over 10m vessels active in the UK fleet, but in terms of total physical capacity (measured in VCUs)(8) and aggregate engine power the figure was around 85%.
5 Based on the Rules for the management of the UK’s fisheries quotas in Areas IV, VI and VII (and associated areas) for 2001 issued by the Fisheries Departments in the UK, November 2000.
6 as at 1 January each year.
7 Note that at the time of introduction of FQAs individual track records were not held by the inshore fleet, but a track record was established for the group as a whole for the period 1994-96.
8 Total tonnage figures could not be calculated due to the incomplete transition from the “GRT” to the “GT” measure of vessel tonnage. VCUs are explained in Appendix I.
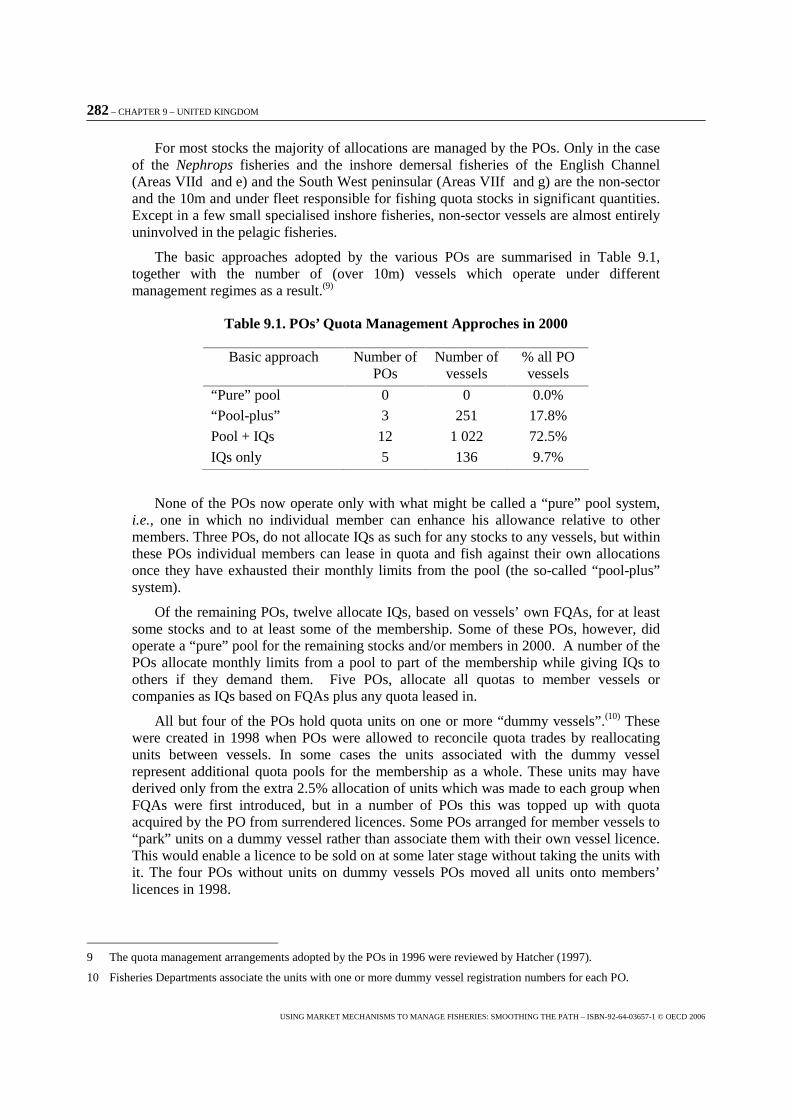
282 – CHAPTER 9 – UNITED KINGDOM
USING MARKET MECHANISMS TO MANAGE FISHERIES: SMOOTHING THE PATH – ISBN-92-64-03657-1 © OECD 2006
For most stocks the majority of allocations are managed by the POs. Only in the case of the Nephrops fisheries and the inshore demersal fisheries of the English Channel (Areas VIId and e) and the South West peninsular (Areas VIIf and g) are the non-sector and the 10m and under fleet responsible for fishing quota stocks in significant quantities. Except in a few small specialised inshore fisheries, non-sector vessels are almost entirely uninvolved in the pelagic fisheries.
The basic approaches adopted by the various POs are summarised in Table 9.1, together with the number of (over 10m) vessels which operate under different management regimes as a result.(9)
Table 9.1. POs’ Quota Management Approches in 2000
Basic approach Number of POs
Number of vessels
% all PO vessels
“Pure” pool 0 0 0.0%
“Pool-plus” 3 251 17.8%
Pool + IQs 12 1 022 72.5%
IQs only 5 136 9.7%
None of the POs now operate only with what might be called a “pure” pool system, i.e., one in which no individual member can enhance his allowance relative to other members. Three POs, do not allocate IQs as such for any stocks to any vessels, but within these POs individual members can lease in quota and fish against their own allocations once they have exhausted their monthly limits from the pool (the so-called “pool-plus” system).
Of the remaining POs, twelve allocate IQs, based on vessels’ own FQAs, for at least some stocks and to at least some of the membership. Some of these POs, however, did operate a “pure” pool for the remaining stocks and/or members in 2000. A number of the POs allocate monthly limits from a pool to part of the membership while giving IQs to others if they demand them. Five POs, allocate all quotas to member vessels or companies as IQs based on FQAs plus any quota leased in.
All but four of the POs hold quota units on one or more “dummy vessels”.(10) These were created in 1998 when POs were allowed to reconcile quota trades by reallocating units between vessels. In some cases the units associated with the dummy vessel represent additional quota pools for the membership as a whole. These units may have derived only from the extra 2.5% allocation of units which was made to each group when FQAs were first introduced, but in a number of POs this was topped up with quota acquired by the PO from surrendered licences. Some POs arranged for member vessels to “park” units on a dummy vessel rather than associate them with their own vessel licence. This would enable a licence to be sold on at some later stage without taking the units with it. The four POs without units on dummy vessels POs moved all units onto members’ licences in 1998.
9 The quota management arrangements adopted by the POs in 1996 were reviewed by Hatcher (1997).
10 Fisheries Departments associate the units with one or more dummy vessel registration numbers for each PO.
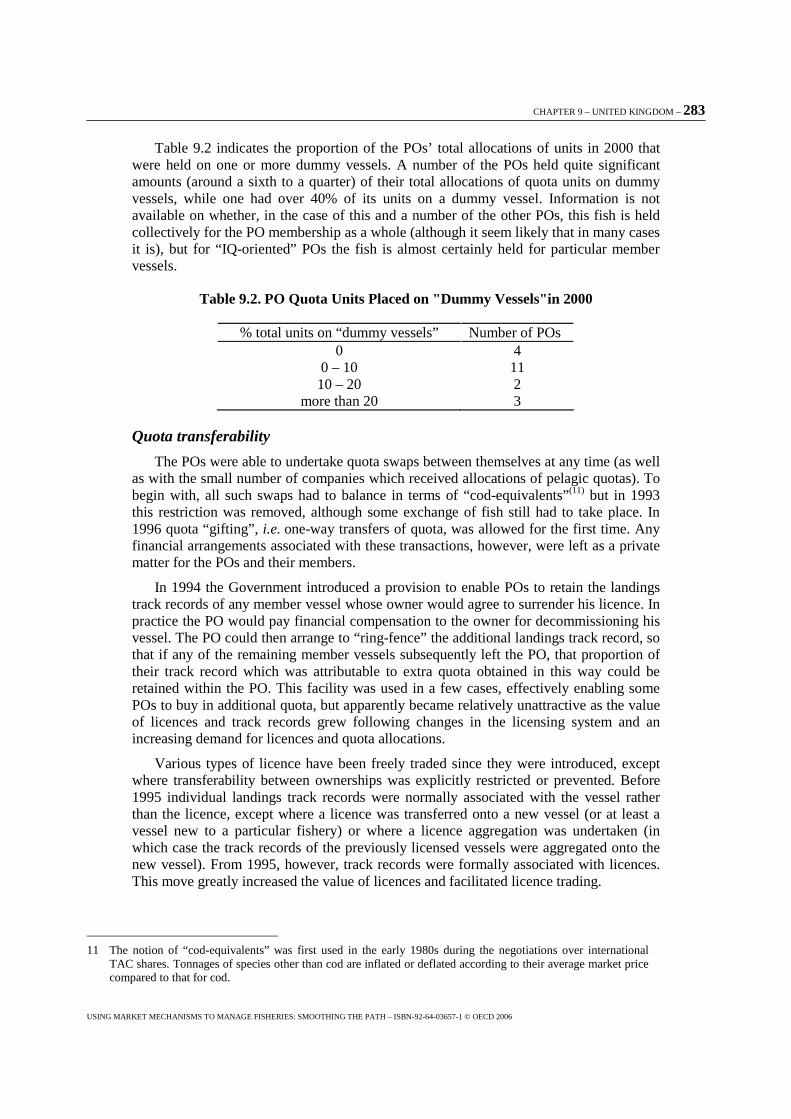
CHAPTER 9 – UNITED KINGDOM – 283
USING MARKET MECHANISMS TO MANAGE FISHERIES: SMOOTHING THE PATH – ISBN-92-64-03657-1 © OECD 2006
Table 9.2 indicates the proportion of the POs’ total allocations of units in 2000 that were held on one or more dummy vessels. A number of the POs held quite significant amounts (around a sixth to a quarter) of their total allocations of quota units on dummy vessels, while one had over 40% of its units on a dummy vessel. Information is not available on whether, in the case of this and a number of the other POs, this fish is held collectively for the PO membership as a whole (although it seem likely that in many cases it is), but for “IQ-oriented” POs the fish is almost certainly held for particular member vessels.
Table 9.2. PO Quota Units Placed on "Dummy Vessels"in 2000
% total units on “dummy vessels” Number of POs 0 4
0 – 10 11 10 – 20 2
more than 20 3
Quota transferability
The POs were able to undertake quota swaps between themselves at any time (as well as with the small number of companies which received allocations of pelagic quotas). To begin with, all such swaps had to balance in terms of “cod-equivalents”(11) but in 1993 this restriction was removed, although some exchange of fish still had to take place. In 1996 quota “gifting”, i.e. one-way transfers of quota, was allowed for the first time. Any financial arrangements associated with these transactions, however, were left as a private matter for the POs and their members.
In 1994 the Government introduced a provision to enable POs to retain the landings track records of any member vessel whose owner would agree to surrender his licence. In practice the PO would pay financial compensation to the owner for decommissioning his vessel. The PO could then arrange to “ring-fence” the additional landings track record, so that if any of the remaining member vessels subsequently left the PO, that proportion of their track record which was attributable to extra quota obtained in this way could be retained within the PO. This facility was used in a few cases, effectively enabling some POs to buy in additional quota, but apparently became relatively unattractive as the value of licences and track records grew following changes in the licensing system and an increasing demand for licences and quota allocations.
Various types of licence have been freely traded since they were introduced, except where transferability between ownerships was explicitly restricted or prevented. Before 1995 individual landings track records were normally associated with the vessel rather than the licence, except where a licence was transferred onto a new vessel (or at least a vessel new to a particular fishery) or where a licence aggregation was undertaken (in which case the track records of the previously licensed vessels were aggregated onto the new vessel). From 1995, however, track records were formally associated with licences. This move greatly increased the value of licences and facilitated licence trading.
11 The notion of “cod-equivalents” was first used in the early 1980s during the negotiations over international TAC shares. Tonnages of species other than cod are inflated or deflated according to their average market price compared to that for cod.
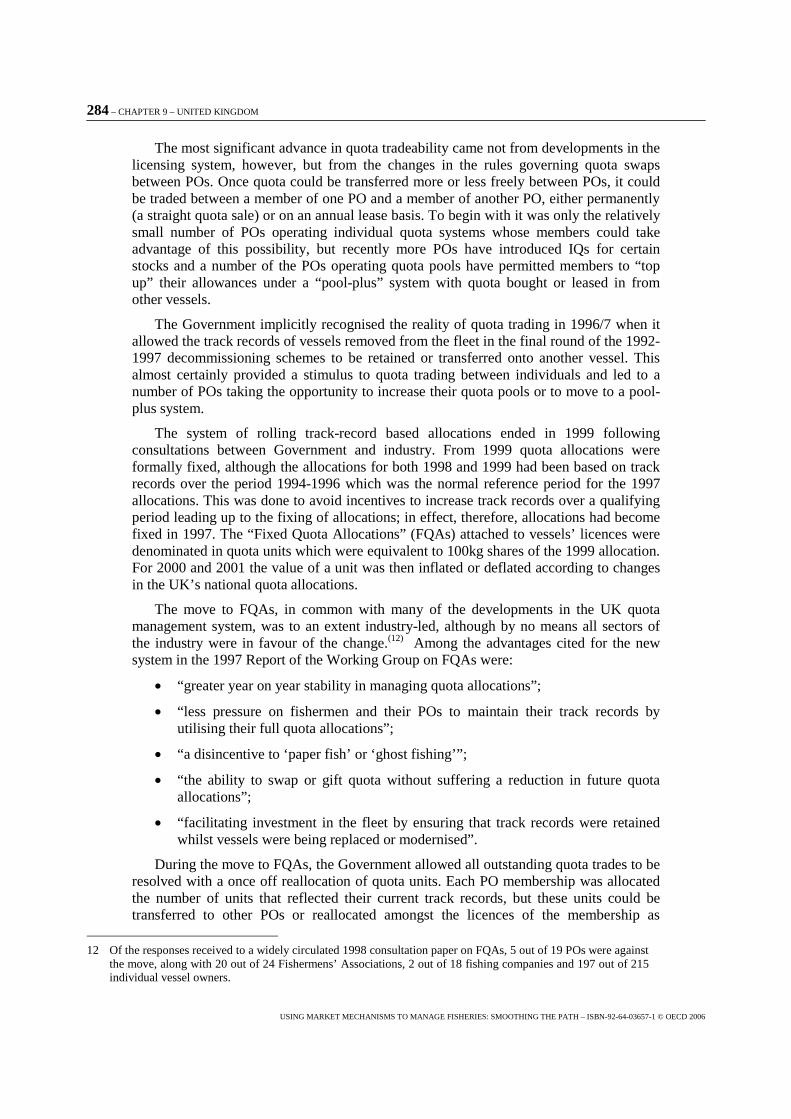
284 – CHAPTER 9 – UNITED KINGDOM
USING MARKET MECHANISMS TO MANAGE FISHERIES: SMOOTHING THE PATH – ISBN-92-64-03657-1 © OECD 2006
The most significant advance in quota tradeability came not from developments in the licensing system, however, but from the changes in the rules governing quota swaps between POs. Once quota could be transferred more or less freely between POs, it could be traded between a member of one PO and a member of another PO, either permanently (a straight quota sale) or on an annual lease basis. To begin with it was only the relatively small number of POs operating individual quota systems whose members could take advantage of this possibility, but recently more POs have introduced IQs for certain stocks and a number of the POs operating quota pools have permitted members to “top up” their allowances under a “pool-plus” system with quota bought or leased in from other vessels.
The Government implicitly recognised the reality of quota trading in 1996/7 when it allowed the track records of vessels removed from the fleet in the final round of the 1992-1997 decommissioning schemes to be retained or transferred onto another vessel. This almost certainly provided a stimulus to quota trading between individuals and led to a number of POs taking the opportunity to increase their quota pools or to move to a pool-plus system.
The system of rolling track-record based allocations ended in 1999 following consultations between Government and industry. From 1999 quota allocations were formally fixed, although the allocations for both 1998 and 1999 had been based on track records over the period 1994-1996 which was the normal reference period for the 1997 allocations. This was done to avoid incentives to increase track records over a qualifying period leading up to the fixing of allocations; in effect, therefore, allocations had become fixed in 1997. The “Fixed Quota Allocations” (FQAs) attached to vessels’ licences were denominated in quota units which were equivalent to 100kg shares of the 1999 allocation. For 2000 and 2001 the value of a unit was then inflated or deflated according to changes in the UK’s national quota allocations.
The move to FQAs, in common with many of the developments in the UK quota management system, was to an extent industry-led, although by no means all sectors of the industry were in favour of the change.(12) Among the advantages cited for the new system in the 1997 Report of the Working Group on FQAs were:
� “greater year on year stability in managing quota allocations”;
� “less pressure on fishermen and their POs to maintain their track records by utilising their full quota allocations”;
� “a disincentive to ‘paper fish’ or ‘ghost fishing’”;
� “the ability to swap or gift quota without suffering a reduction in future quota allocations”;
� “facilitating investment in the fleet by ensuring that track records were retained whilst vessels were being replaced or modernised”.
During the move to FQAs, the Government allowed all outstanding quota trades to be resolved with a once off reallocation of quota units. Each PO membership was allocated the number of units that reflected their current track records, but these units could be transferred to other POs or reallocated amongst the licences of the membership as
12 Of the responses received to a widely circulated 1998 consultation paper on FQAs, 5 out of 19 POs were against the move, along with 20 out of 24 Fishermens’ Associations, 2 out of 18 fishing companies and 197 out of 215 individual vessel owners.
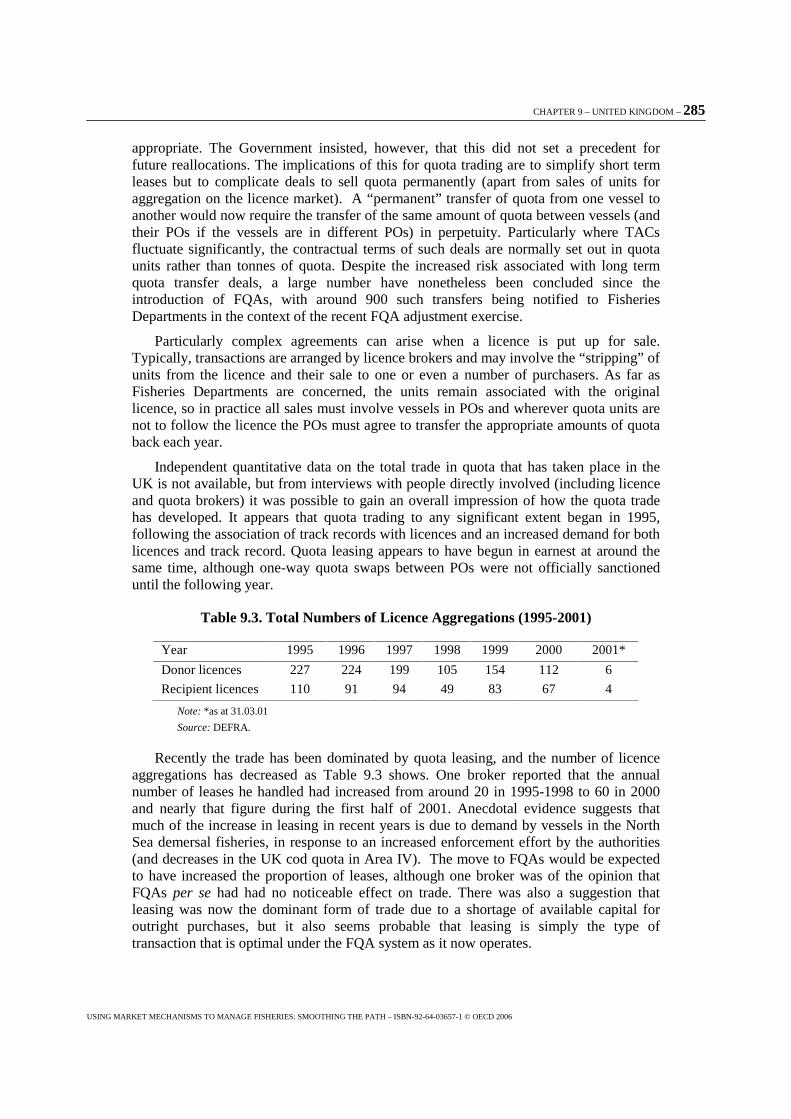
CHAPTER 9 – UNITED KINGDOM – 285
USING MARKET MECHANISMS TO MANAGE FISHERIES: SMOOTHING THE PATH – ISBN-92-64-03657-1 © OECD 2006
appropriate. The Government insisted, however, that this did not set a precedent for future reallocations. The implications of this for quota trading are to simplify short term leases but to complicate deals to sell quota permanently (apart from sales of units for aggregation on the licence market). A “permanent” transfer of quota from one vessel to another would now require the transfer of the same amount of quota between vessels (and their POs if the vessels are in different POs) in perpetuity. Particularly where TACs fluctuate significantly, the contractual terms of such deals are normally set out in quota units rather than tonnes of quota. Despite the increased risk associated with long term quota transfer deals, a large number have nonetheless been concluded since the introduction of FQAs, with around 900 such transfers being notified to Fisheries Departments in the context of the recent FQA adjustment exercise.
Particularly complex agreements can arise when a licence is put up for sale. Typically, transactions are arranged by licence brokers and may involve the “stripping” of units from the licence and their sale to one or even a number of purchasers. As far as Fisheries Departments are concerned, the units remain associated with the original licence, so in practice all sales must involve vessels in POs and wherever quota units are not to follow the licence the POs must agree to transfer the appropriate amounts of quota back each year.
Independent quantitative data on the total trade in quota that has taken place in the UK is not available, but from interviews with people directly involved (including licence and quota brokers) it was possible to gain an overall impression of how the quota trade has developed. It appears that quota trading to any significant extent began in 1995, following the association of track records with licences and an increased demand for both licences and track record. Quota leasing appears to have begun in earnest at around the same time, although one-way quota swaps between POs were not officially sanctioned until the following year.
Table 9.3. Total Numbers of Licence Aggregations (1995-2001)
Year 1995 1996 1997 1998 1999 2000 2001*
Donor licences 227 224 199 105 154 112 6
Recipient licences 110 91 94 49 83 67 4
Note: *as at 31.03.01
Source: DEFRA.
Recently the trade has been dominated by quota leasing, and the number of licence aggregations has decreased as Table 9.3 shows. One broker reported that the annual number of leases he handled had increased from around 20 in 1995-1998 to 60 in 2000 and nearly that figure during the first half of 2001. Anecdotal evidence suggests that much of the increase in leasing in recent years is due to demand by vessels in the North Sea demersal fisheries, in response to an increased enforcement effort by the authorities (and decreases in the UK cod quota in Area IV). The move to FQAs would be expected to have increased the proportion of leases, although one broker was of the opinion that FQAs per se had had no noticeable effect on trade. There was also a suggestion that leasing was now the dominant form of trade due to a shortage of available capital for outright purchases, but it also seems probable that leasing is simply the type of transaction that is optimal under the FQA system as it now operates.
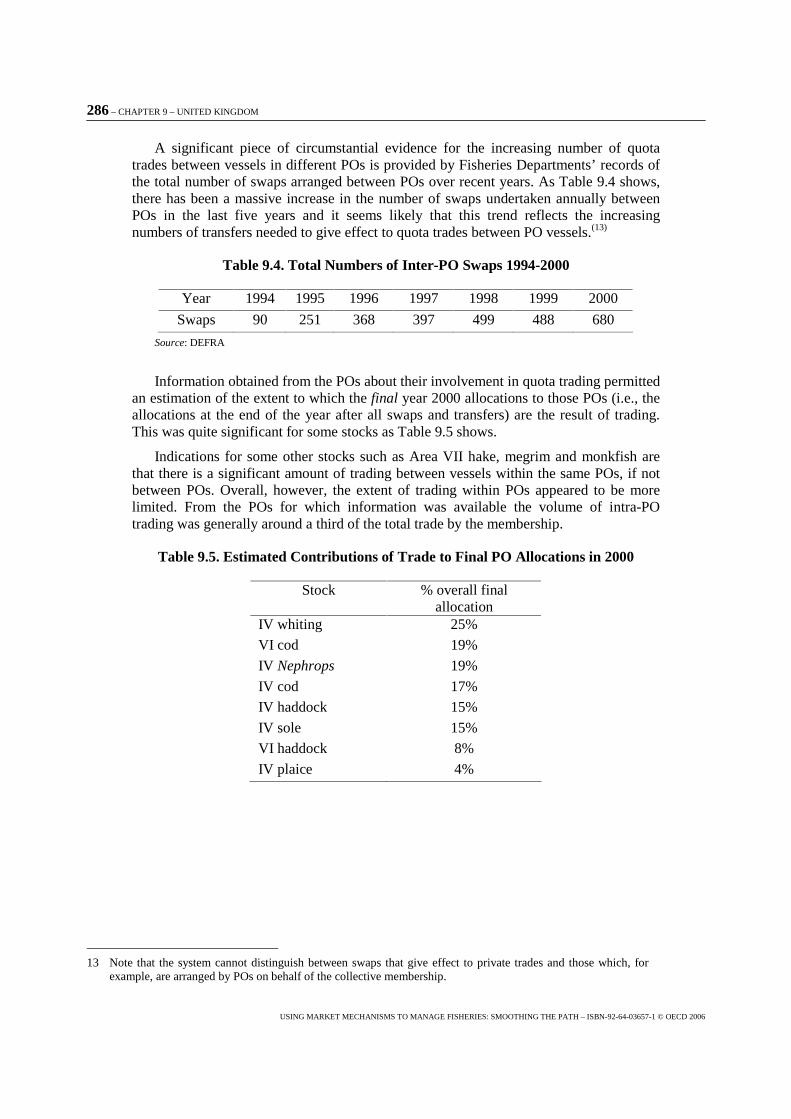
286 – CHAPTER 9 – UNITED KINGDOM
USING MARKET MECHANISMS TO MANAGE FISHERIES: SMOOTHING THE PATH – ISBN-92-64-03657-1 © OECD 2006
A significant piece of circumstantial evidence for the increasing number of quota trades between vessels in different POs is provided by Fisheries Departments’ records of the total number of swaps arranged between POs over recent years. As Table 9.4 shows, there has been a massive increase in the number of swaps undertaken annually between POs in the last five years and it seems likely that this trend reflects the increasing numbers of transfers needed to give effect to quota trades between PO vessels.(13)
Table 9.4. Total Numbers of Inter-PO Swaps 1994-2000
Year 1994 1995 1996 1997 1998 1999 2000
Swaps 90 251 368 397 499 488 680
Source: DEFRA
Information obtained from the POs about their involvement in quota trading permitted an estimation of the extent to which the final year 2000 allocations to those POs (i.e., the allocations at the end of the year after all swaps and transfers) are the result of trading. This was quite significant for some stocks as Table 9.5 shows.
Indications for some other stocks such as Area VII hake, megrim and monkfish are that there is a significant amount of trading between vessels within the same POs, if not between POs. Overall, however, the extent of trading within POs appeared to be more limited. From the POs for which information was available the volume of intra-PO trading was generally around a third of the total trade by the membership.
Table 9.5. Estimated Contributions of Trade to Final PO Allocations in 2000
Stock % overall final allocation
IV whiting 25%
VI cod 19%
IV Nephrops 19%
IV cod 17%
IV haddock 15%
IV sole 15%
VI haddock 8%
IV plaice 4%
13 Note that the system cannot distinguish between swaps that give effect to private trades and those which, for example, are arranged by POs on behalf of the collective membership.
CHAPTER 9 – UNITED KINGDOM – 287
USING MARKET MECHANISMS TO MANAGE FISHERIES: SMOOTHING THE PATH – ISBN-92-64-03657-1 © OECD 2006
3. Changes to quota transferability since September 2002
From 1 September 2002 it became possible to separate FQA units from a vessel licence, as part of a licensing transaction. These units may be transferred to:
� licences already on fishing vessels (including vessels 10 metres and under);
� other licence entitlements;
� "dummy licences" held by producer organisations;
� a holding statement under the replacement vessel provisions (see paragraph 18).
During the life of a licence entitlement there is no restriction on the number of occasions on which FQA units may be transferred from the entitlement. All or some of the units may be transferred and may be split between more than one recipient.
These arrangements are subject to the following conditions:
� a licence entitlement cannot be placed back by the original holder of the entitlement, or any subsequent holder, onto the vessel from which it arose if any of the FQA units have been transferred from the entitlement. The only exceptions are if the entitlement holder is able either to reinstate the units which had been transferred from the licence; or to add to the entitlement other FQA units which have the cod equivalent of those which had been removed;
� a licence entitlement, from which FQA units have been separated, may not be placed on a vessel fishing in the non-sector, either singly or as part of a licence aggregation. This restriction prevents the owner of a PO vessel from removing its FQA units and joining the non-sector. Therefore, from 1 September 2002, no vessel will be allowed to fish in the non-sector unless its licence carries the units associated with that licence at 1 January 1999.
Replacement vessels
Special arrangements were made to allow a vessel owner to retain his FQA units where the vessel owner is disposing of the existing vessel together with its licence or disposing of the existing vessel and licence separately, and intends to acquire a replacement vessel. In these circumstances the owner may retain separately on a temporary basis some or all of his FQA units for the purpose of associating them with the licence of a replacement vessel.
Under the replacement vessel arrangements there is a one-off opportunity to transfer all or some FQA units to other licence entitlements/licences/PO dummy licences or to other fishermen holding units under the replacement vessel provisions.
Sectoral management of vessels 10m and under
From 1 September 2002, POs were able to manage "sectoral" quota allocations for vessels of 10m and under in the same way as for vessels over 10m. No quota transfer will be made to POs from the 10m and under fleet’s "pool" of quota allocations in respect of vessels fishing against PO allocations. Instead, such vessels will have to fish against quota either made available by the PO from its existing quota allocations, leased in by the vessel owners or by the PO, or generated by FQA units acquired by 10m and under vessel owners.
CHAPTER 10 – UNITED STATES – 289
USING MARKET MECHANISMS TO MANAGE FISHERIES: SMOOTHING THE PATH – ISBN-92-64-03657-1 © OECD 2006
Chapter 10
United States Domestic Fisheries Experiences in the Transition to Rational Fisheries1 2
1. Introduction
Nearly all fisheries managed by the National Marine Fisheries Service (NOAA Fisheries) have excess and overcapacity. Even though rebuilding programs are ending overfishing (a net positive gain of 17 out of 909 stocks considered), many fish stocks remain overfished (76) or are experiencing overfishing (60).3
The traditional method of rebuilding an overfished stock is to reduce total allowable catch (TAC) rates until the stock rebuilds to a target level that is considered sustainable. In most U.S. fisheries, this management approach results in a race for fish as fishermen in limited entry or regulated open access fisheries overinvest in capital and labor to maintain their market share of the resource. The primary problem with this management approach is that the nation experiences a significant loss in potential net benefits each year.
In spite of the potential net benefits to be gained, only a few have made the transition to rational4 fisheries:
1 This case study was co-authored by : John M. Ward, Senior Economist, Office of Constituent Services, National Marine Fisheries Service, 1315 East-West Highway, Silver Spring, Maryland 20910, USA, Email: [email protected] ; Rebecca Metzner, Policy Analyst, Fishery Policy and Planning Division (FIPP), Fisheries Department, Food and Agriculture Organization (FAO) of the United Nations, Viale delle Terme di Caracalla, 00100 Rome, Italy Email: [email protected] ; Walther Keithly, Professor, Coastal Fisheries Institute, Louisiana State University, Office of Sea Grant Development, Center for Wetland Resources, Baton Rouge, LA 70803-7503, Email: [email protected] ; Gina Shamshak, Knauss Fellowship Intern, Office of Constituent Services, National Marine Fisheries Service, 1315 East-West Highway, Silvery Spring, Maryland 20910 USA, Email: [email protected] ; and Greg Schneider, Senior Policy Analyst, Office of International Affairs, National Marine Fisheries Service, 1315 East-West Highway, Silver Spring, Maryland 20910 USA, Email: [email protected] .
2 The views expressed in this paper are strictly those of the authors and do not necessarily reflect the views of the U.S. NOAA National Marine Fisheries Service (NMFS) or the Food and Agriculture Organization (FAO) of the United Nations. The authors are grateful for comments from Phil Logan, Jim Waters, Gordon Helm, Michael Kelly, Linda Chaves, and Juan Agar, however, any remaining errors are the sole responsibility of the authors.
3 National Marine Fisheries Service (2004). “Sustaining and Rebuilding.” Report to Congress, May, www.nmfs.noaa.gov/sfa/sfweb/index.htm.
4 The term rational fisheries is a reference to the basic underlying assumption of economic behavior. It states that individual people or firms maximize satisfaction from consuming goods and services subject to their budget constraint or maximize profits from producing goods and services in perfectly competitive markets,
290 – CHAPTER 10 – UNITED STATES
USING MARKET MECHANISMS TO MANAGE FISHERIES: SMOOTHING THE PATH – ISBN-92-64-03657-1 © OECD 2006
� halibut/sablefish, surf clams, wreckfish, and the tuna purse seine fisheries have developed individual transferable quota (ITQ) programs;
� crab fishermen in Alaska have adopted processors individual fisherman quotas (IFQs); and
� a cooperative for a portion of the Alaskan pollock fishery was created under the American Fisheries Act.
Additionally, red snapper is a fishery in the southeast region that has been considered for an ITQ fishery over the last decade, but this transition has met considerable resistance by fishers, managers, and Congress.
None of these examples have been declared a complete success (Bromley, 2004 and Macinko and Bromley, 2001), but when evaluating the operation of these new fishery management programs, the existing management environment has to be taken into consideration. This is particularly true for understanding or explaining the transition to rational fisheries. The management environment will affect the transition path to the rationalized fishery. If, for example, stock conservation is the management goal, the outcome of rationalization will be different than if economic efficiency is the sole management objective because the biomass at maximum sustainable yield is – by definition - less than the biomass at maximum economic yield.5
To set the scene for the case studies describing the transition to rational fisheries, the next section provides an overview of some of the complexity of the fisheries management environment and some of the legislative and regulatory challenges and balancing acts with which fisheries managers must cope. The third section examines some of the economic and social reasons that support the rationalization of fisheries. Following that, the case studies look at the development of rationalized fisheries for wreckfish, halibut/sablefish, and red snapper and include a discussion that focuses on the winners and losers along the different transition paths from the initial allocation to achieving economic efficiency.6 Section 5 provides an in-depth discussion of the transition process that has and is presently occurring in the Gulf of Mexico red snapper fishery. Concerns about the initial allocation process and the possibilities for windfall gains to share holders are discussed in the next section. Finally, similarities amongst the transition processes for different fisheries are summarized.
2. The Fisheries Management Environment
The primary reason fishery management is so difficult in practice is that fisheries are extremely complex. Many different laws and international agreements have been enacted to provide the authority to manage fish stocks and many different national and international agencies have been established to enforce these laws. Moreover, fisheries consist not only of many fish species, but of many different consumptive and nonconsumptive user groups with different objectives and goals for the utilization of these fish stocks.
respectively. This is distinct from an open access fishery where individuals maximize satisfaction or profits in imperfect markets that exist without property rights for the fish-in-the-sea. It should not be considered a reference to abnormal psychological behavior in any way, shape, or form.
5 Clark (1973) also found this result to hold in a dynamic context for a reasonable range of market interest rates.
6 The transition process is well developed in NOAA Fisheries and documented, but is not well understood.
CHAPTER 10 – UNITED STATES – 291
USING MARKET MECHANISMS TO MANAGE FISHERIES: SMOOTHING THE PATH – ISBN-92-64-03657-1 © OECD 2006
Fishery managers have to interpret the results of independently developed analyses based on different scientific approaches and underlying assumptions to make management decisions that affect both the fisheries stakeholders and the stocks of fish. In addition, the problems faced by fishery managers have many facets and require constant adjustment once regulations to control them are in place.
User Groups
Fisheries consist of many different consumptive and nonconsumptive user groups with different objectives and goals for the utilization of fish stocks.
Consumptive user groups include commercial, quasi-commercial, subsistence, and recreational fishermen and there is also heterogeneity within user groups. Consumptive fishermen are a diverse group with different education levels, ethic backgrounds, and ages, who use different gear types on vessels of various sizes and styles operating out of different home ports to land their catch in different states for commercial or recreational purposes. They may also specialize in the harvest of a particular species of fish or move between fisheries by switching gear or areas fished. Ward and Nance (1994) found that some commercial fishermen employed more than five different gear types in the course of a single fishing year and made landings in more than three different states in the Gulf of Mexico.
Recreational anglers range from those who release all their catch alive to those who fish solely for the meat. They operate off private boats, fishing piers, jetties and wharfs, bridges, and from the beach. Although they account for far less catch than commercial fishermen in total, landings in some fisheries by recreational participants are greater than the levels landed in commercial operations (NMFS, 2000).
Charter and party boat operators are a hybrid of commercial fishermen and recreational anglers who provide a recreational fishing experience as a commercial enterprise. Subsistence fishermen in the U.S. may be retirees attempting to augment their income by consuming or selling their catch.
In many other parts of the world, subsistence fishers may be people who have no other choice for employment and, in this sense, some commercial fishermen may be considered subsistence fishermen in the U.S.
Nonconsumptive user groups also exist. They include people who value viewing the living marine resource and others who simply treasure its existence as well as sport divers who enjoy swimming among fish and enjoy a rich and diverse ecosystem or value swimming with dolphins or sharks. There are individuals who value the knowledge that marine mammals, turtles, or fish stocks exist and are willing to pay non-governmental, environmental or conservation organisations to ensure that consumptive user groups do not reduce stock sizes below some minimum safe level (Bishop, 1978).
While one group gets value from consuming fish, this consumption reduces the value the nonconsumptive group has for keeping the resource in a pristine state. The maximization of the benefits derived from fish stocks to society requires an allocation of this resource between these different groups, although fishery managers in the United States traditionally focus on the consumptive user groups because of their emphasis on stock conservation.
292 – CHAPTER 10 – UNITED STATES
USING MARKET MECHANISMS TO MANAGE FISHERIES: SMOOTHING THE PATH – ISBN-92-64-03657-1 © OECD 2006
Multi-Disciplinary Science
Fishery management depends on a multi-disciplinary science that adds its own level of complexity to the management of marine fisheries. Typically, fishery scientists trained in different fields of the physical, social, and natural sciences such as biology, economics, sociology, or anthropology all face the same types of problems when managing fish stocks.
Different biological characteristics of various fish stocks are further confounded by an often complex regulatory environment and flawed distributional markets for the catch. Predator-prey and competitor relationships exist between stocks of fish that are often in the same multiple species fishery with multiple cohorts characterized by variable recruitment and abundance levels. The shrimp stocks in the Gulf of Mexico typically are comprised of short-lived prey species with highly variable annual recruitment where little relationship seems to exist between fishing mortality and stock abundance in subsequent years. Alternatively, the cod in New England is a long lived species, competes with skates and dog fish for its prey species, and has a well-developed relationship between fishing mortality and stock abundance.
These different fishery sciences focus on different elements of fisheries when they are trying to understand fisheries and generate information intended to aid fishery managers in making decisions. Fishery biologists are primarily concerned with stock abundance given a constant fishing mortality, but fishery economists are more concerned with the effect a fixed stock abundance has on levels of fishing effort as market conditions change and focus on the individual commercial or recreational fisherman. Sociologists focus on the fishing community.
Fishery managers are placed in the position of having to interpret the results of independently developed scientific analyses based on different assumptions to make management decisions. Interpreting these different analyses requires fishery managers to rely on their own experience and may cause them to give added consideration to analyses that come from their own fields of expertise.
Influencing U.S. Fisheries Management
There are domestic and international fishery management organisations that cooperate and compete for control over living marine resources at different levels in their respective spheres of influence. Domestic U.S. management organisations include eight fishery management councils, fish and wildlife agencies in each of the 23 coastal states, regional Fishery Management Commissions, and other federal agencies that share jurisdiction or have review authority over inshore, near-shore, and offshore fisheries out to 200 miles.
Federal agencies include the Department of Interior, the Small Business Administration under the Regulatory Flexibility Act, the Office of Management and Budget, and the National Marine Fisheries Service in the Department of Commerce. In addition, the General Accounting Office and the Congressional Research Service undertake special reviews of federal government fishery management programs.
Myriad fisheries management goals are set by national and international agreements. United States mandates include those outlined in:
The Regulatory Flexibility Act, Executive Order 12866, the American Fisheries Act, the Magnuson-Stevens Fisheries Conservation and Management Act (MSFCMA), the National Environmental Policy Act, the Endangered Species Act, the Unfunded
CHAPTER 10 – UNITED STATES – 293
USING MARKET MECHANISMS TO MANAGE FISHERIES: SMOOTHING THE PATH – ISBN-92-64-03657-1 © OECD 2006
Mandates Act of 1995, the Marine Mammal Protection Act, and the Congressional Review of Agency Rule Making.
International agreements that outline additional fisheries management mandates include:
The International Plan of Action (IPOA) for Reducing Incidental Catch of Seabirds in Longline Fisheries, the IPOA for the Conservation and Management of Sharks, the IPOA for the Management of Fishing Capacity, and the IPOA to Prevent, Deter and Eliminate Illegal, Unreported and Unregulated Fishing. Additionally, along with the United Nationals Convention on the Law of the Sea of 10 December 1982 (UNCLOS), there is the 1995 Agreement for the Implementation of the Provisions of the UNCLOS relating to the Conservation and Management of Straddling Fish Stocks and Highly Migratory Fish Stocks, “the Fish Stocks Agreement”, as well as The Agreement to Promote Compliance with International Conservation and Management Measures by Fishing Vessels on the High Seas (Resolution 15/93), “the Compliance Agreement”.
Some of the international organisations with which the U.S. cooperates in the management of fish stocks it exploits include:
The Inter-American Tropical Tuna Commission (IATTC), International Commission for the Conservation of Atlantic Tunas (ICCAT), Indian Ocean Tuna Commission (IOTC), South Pacific Commission (SPC), the Food and Agricultural Organization (FAO) of the United Nations, The World Bank’s Fisheries Forum, the European Commission, the World Trade Organization, Asian Pacific Economic Community (APEC), Organization for Economic Cooperation and Development (OECD), World Resources Institute, World Fish Center (formerly International Center for Living Aquatic Resources Management (ICLARM)), and the fishery agencies of various independent countries and states with straddling stocks in their jurisdiction or fishermen who compete with U.S. fishermen in high seas fisheries.
Additional non-governmental organisations represent user groups who have an interest in conserving or exploiting fish stocks. Conservation groups include the World Wildlife Fund, The World Resource Institute, The World Conservation Union, Environmental Defense, Green Peace, and The Ocean Conservancy, while industry interest groups include the National Fisheries Institute and the American Sportfishing Association.
Conflicting Objectives and Goals
These international agreements, domestic laws, the governmental agencies that enforce them and non-governmental organisations have their own management objectives and goals. While some objectives and goals are complementary, many are contradictory.
For example, the statutory basis for fishery management in the United States is the Magnuson-Stevens Fisheries Conservation and Management Act (NMFS, 1996). This Act establishes, among other things, ten national standards that can be argued to be the objectives of fishery management.
294 – CHAPTER 10 – UNITED STATES
USING MARKET MECHANISMS TO MANAGE FISHERIES: SMOOTHING THE PATH – ISBN-92-64-03657-1 © OECD 2006
National Standard 1 is that conservation and management measures shall prevent overfishing while achieving the optimum yield7 on a continuing basis from each fishery for the U.S. fishing industry. While explicitly making stock conservation a priority for managers, this national standard also seems to imply that maximum economic yield is an acceptable target. However, National Standard 5 states that conservation and management measures shall consider economic efficiency in the utilization of fishery resources, but economic allocation cannot be its sole purpose. Furthermore, National Standard 8 provides for the sustained participation of fishing communities and to the extent practicable minimizes adverse economic impacts on such communities.
Both National Standard 5 and 8 weaken the implicit argument that MEY is an acceptable management target since many fishing communities could disappear under a rights-based management program (McCay and Jentof, 1998) that achieved economic efficiency at MEY.8 This also weakens the stock conservation as a management objective in National Standard 1 in that those rebuilding plans should not result in an adverse economic impact on fishing communities.
This inner conflict between objectives in the MSFCMA reflects a need to maintain social objectives that retain the financial status quo, while biological and, to a lesser extent, economic objectives are pursued to improve stock size(s) and efficiency in a fishery.
External conflicts also exist between other laws and Executive Orders. Executive Order 12866 requires that, in choosing among regulatory approaches that have a significant effect on the economy, those that maximize net benefits or minimize costs should be selected. Regulatory approaches having a significant effect are defined to mean that they have an impact in excess of USD 100 million in a year, have a significant impact on a specific industry, or that the regulation raises novel legal or policy issues. While fishery regulations are unlikely to develop impacts in excess of USD 100 million in any given year, they certainly do have a significant impact on the harvesting sector as indicated by the large number of lawsuits that have been brought before the courts.
Regardless of whether or not a significant impact can be argued to exist, a cost benefit analysis has to be conducted to indicate whether a proposed regulation could have such an impac. Also, in the case of a novel policy issue, an analysis to determine the cost and benefits and economic impacts of the proposed regulation is required.
Estimation of economic impacts on small entities is also required under the Regulatory Flexibility Act; however, this Act further stipulates that such impacts do not preclude the adoption of the regulation. It is only necessary that the federal agency knows that they will be incurred by the small entity and that steps have been considered that would mitigate their impact.
7 Optimum yield is defined to mean the amount of fish which provides the greatest overall benefit to the nation, is based on maximum sustainable yield (MSY) as reduced by any relevant economic, social, or ecological factor, and provides for the rebuilding of the stock to a level consistent with MSY.
8 Just as fishermen overcapitalize in open access fisheries and processors overinvest in cold storage holding facilities, society may overinvest in fishing communities that, once the market failure is corrected, would disappear.
CHAPTER 10 – UNITED STATES – 295
USING MARKET MECHANISMS TO MANAGE FISHERIES: SMOOTHING THE PATH – ISBN-92-64-03657-1 © OECD 2006
Fisheries Management Challenges
Fishery managers face many problems in this complex management environment. Overfishing, overcapacity, preservation of fishing communities, safety at sea, the discarding of fish, marine turtle, marine mammal, and sea bird bycatch, excessive ecosystem damage, habitat conservation, and the overexploitation of species resulting in endangered and threatened species often need to be addressed simultaneously.
Management problems can be created or exacerbated if some component of the management framework is ignored. For example, a restrictive total allowable catch set to rebuild an overfished stock could result in increased harvest capacity. Ignoring overcapacity could result in excessive bycatch. Correcting overcapacity could result in financial hardship for fishing communities. Habitat degradation due to excessive fishing effort levels is also caused by this open access management approach which treats the economic component of the management problem as a secondary issue.
In addition, most problems in fisheries are dynamic in nature. Long-run outcomes differ from short-run results. Ward and Macinko (1996) demonstrated that short-run improvements in stock size from bycatch reduction devices disappeared over the long-run as fishing effort increased in the fishery further exacerbating other management problems. As a result, managers often trade off management objectives in their short-term efforts to achieve some of their long-term multi-objective fishery management goals.
Fisheries need to be understood in the broadest possible context using a multi-disciplinary scientific framework to analyze fishery management regulations. For the economist, the fishery manager’s objective is to maximize the net present value from commercial and recreational fishing activities. In this framework, commercial fishermen are attempting to maximize profits in commercial fishing operations while recreational fishermen are maximizing fishing satisfaction (utility) in recreational fishing operations. Both groups are subject to the population dynamics of the exploited fish stocks and the recreational user groups are also constrained by their income levels.
The dissatisfaction or disutility nonconsumptive user groups experience from the fish harvesting operations of consumptive users can also be factored into this management problem. Managers reallocate harvested fish between different user groups until the discounted net benefits are maximized. As larger stocks of fish have a lower cost per pound of fish harvested, this objective complies with the precautionary approach to fishery management.
Although simple in concept, the practical application of this multi-disciplinary scientific approach is extraordinarily complex given the myriad goals the legal environment has created for fishery managers and the regulations managers have established to achieve these objectives.
Indeed, the management problem can be restated from the single objective of maximizing net benefits to a multiple objective management approach which allows the multiple objectives of different management and user groups to be made comparable. Stated or implicit objectives to maximize employment, rebuild stocks, expand recreational activities, preserve communities, preserve critical habitat, and save endangered species can be evaluated and compared using consistent metrics.
Although this framework offers a second best approach in the sense that the economic objective of maximizing net benefits will not be achieved, the framework does allow decision makers to understand the impacts of proposed management regulations before
296 – CHAPTER 10 – UNITED STATES
USING MARKET MECHANISMS TO MANAGE FISHERIES: SMOOTHING THE PATH – ISBN-92-64-03657-1 © OECD 2006
they are imposed on different user groups, and it identifies if management targets are being achieved or can be achieved over time.
3. Reasons for Transitioning to Rational Fisheries
The primary reason to transition to rational fisheries is to increase the net benefits that society receives from the consumptive and non-consumptive uses of living marine resources. Common property, open access, or regulated open access fisheries operate within a market characterized by weak or nonexistent property rights9 for the in situ resource. Some outcomes of the resulting market failure to allocate resources efficiently is the overinvestment in capital and labor used to harvest fish (overcapacity) that results in a race-to-fish and the overfishing of fish stocks.
Both excess and overcapacity10 have been cited as the primary cause of overfishing of fish stocks globally. The negative impacts of such excessive levels of harvesting capacity are not limited to the financial well-being of participants in fisheries in terms of their overinvestment in the capital and labor used to harvest fish (Ward and Metzner, 2002). Excessive levels of harvesting capacity also have substantial social costs for fishing nations. These social costs can include serious ecological, human, and food security impacts.
Similarly, the practices of discarding incidentally caught marine mammals, turtles, and finfish have also been attributed to excess and overcapacity in directed fisheries. Habitat degradation caused by the excessive use of superfluous fishing gear has been attributed to excess and overcapacity in the fishing industry. Still another type of social cost is the impact on different groups of participants in the fisheries, such as the displacement of artisanal fishers by industrial fleets in coastal waters.
The Fiscal Benefits of Rational Fisheries
One of the earliest studies of the benefits from transition to rational fisheries (Sissenwine, 1992) indicated that the value of the estimated long term potential yield (LTPY) for 232 U.S. fishery resources was USD 6.9 billion. This was USD 1.8 billion more than the value of the recent average yield (RAY), which was USD 4.7 billion. The potential net value (PNV) estimated by adjusting the size of the fishing fleet to reflect controlled access management and the recovery of overfished stocks was USD 2.9 billion.
This USD 1.1 billion difference indicates that substantial net benefits could result from reducing the number of vessels, used as a measure of fishing costs, beyond the benefits accrued from just increasing the yield from RAY to LTPY. In addition, the USD 1.8 billion increase according to Sissenwine (1992) resulting from the achievement of LTPY would result in an increase to gross national product (GNP) of USD 25.4 billion and would increase employment by at least 500 000 and perhaps as much as 628 000
9 The use of the term property rights refers to the perfectly competitive market assumption that inputs and outputs are freely transferable. This requires clearly defined and enforceable property rights for the inputs and outputs. ITQs and IFQs is a form of access privilege that causes participants in an open access fishery to behave as if clearly defined and enforceable property rights for fish-in-the-sea exist.
10 Ward, Thunberg, and Mace (2005) provide a definition of overcapacity that is a long run economic phenomenon that persists because of a market failure to efficiently allocate resources. This definition of overcapacity differs from excess capacity which remains a short-run, self-correcting, economic phenomenon that results from fluctuations in input and output prices.
CHAPTER 10 – UNITED STATES – 297
USING MARKET MECHANISMS TO MANAGE FISHERIES: SMOOTHING THE PATH – ISBN-92-64-03657-1 © OECD 2006
jobs.11 The USD 2.9 billion in foregone PNV can be considered the annual cost to society from not rationally managing U.S. fishery resources. Since 1992 when this study was completed, the cost to the U.S. fishing industry of not adopting controlled access management has been approximately USD 38 billion or one and one-half times the annual contribution to GNP of achieving LTPY.
A more recent example of a fishery that is managed as close to an open access fishery as is possible is the U.S. shrimp fishery in the Gulf of Mexico. Since the initial annual estimate of USD 216 million 1991 dollars in PNV for the brown, white, and pink shrimp fishery in the Gulf of Mexico (Sissenwine, 1992), additional studies have been conducted. Kirkley, et al., (2002) found overcapacity to be a severe problem in the U.S., federally managed, shrimp fishery. The shrimp fishery would require a USD 329.9 million (2002 dollars) buyback program to purchase 875 vessels to eliminate overcapacity in this fishery.12 However, the potential net benefits that could be generated with a change in the management approach with the elimination of overcapacity is substantial greater than these expected program costs. The change in net present value (NPV) due to the adoption of individual transferable quotas in a fishery with highly variable recruitment found by Ward and Keithly (1999) was USD 2.1 billion (1977 base year); a benefit to cost ratio of 2.02 relative to the present, open access, status quo.13
Finally, the development of a management options paper for the shrimp fishery in the southeastern U.S. (Ward et al., 2004) revealed that cooperatives in the shrimp fishery could potentially generate USD 630 million (2002 base year) in NPV while reducing sales (USD 528 million), income (USD 178 million), and jobs (4.4 thousand). Fractional licenses, another form of controlled access, could increase NPV between 80 and 314 million dollars with a less severe decline in jobs (2 100), income (USD 86 million), and sales (USD 254 million).14
The Social Benefits of Rational Fisheries
Bycatch reduction
One social cost of excessive investment in capital and labor for the directed harvest of fish is the indirect effect of bycatch on related commercially and recreationally valuable stocks which could be reduced or eliminated by a transition to rational fisheries.
Ward (1994) and Ward and Macinko (1996) initially investigated the harvesting of finfish in shrimp fishing operations, known as incidental take or bycatch, and found it to
11 According to the author, “The estimated total increase in employment is probably an overestimate considering that, the conversion of most, if not all, fisheries from open access to controlled access fishery management would, in theory, result in a more efficient harvesting sector that employed fewer fishermen to harvest the yield... it will likely require no more (and likely fewer) fishermen than at present to harvest the yield. Although the harvesting sector may decline ... the majority of the potential employment benefits (85%) is attributable to increases in employment in sectors other than the harvest sector...”
12 Additional costs would also be incurred if the management approach to this fishery is not changed to prevent new investment from occurring in this fishery, once the buyback program is completed.
13 This estimate reflects a 6% decline in fleet size and an increase of 1 thousand pounds per vessel in annual landings and a seven cent per pound increase in average shrimp price.
14 While not always the case, increases in net present value are generally accompanied by declines in economic impacts because expenditures by firms that would have been transferred to other sectors of the economy are reduced and act to increase profits under the controlled access or rights-based, managed fishery causing net benefits to increase.
298 – CHAPTER 10 – UNITED STATES
USING MARKET MECHANISMS TO MANAGE FISHERIES: SMOOTHING THE PATH – ISBN-92-64-03657-1 © OECD 2006
be a complex multidisciplinary and international fisheries management problem. The discarded bycatch problem in commercial shrimp fisheries has been addressed internationally with annual estimates of finfish bycatch ranging from 64 000 tons to 1 million tons with potential benefits ranging from USD 28 million to USD 1.273 billion. Finfish bycatch is also a significant domestic fishery management problem with annual estimates varying from 700 million to 1.7 billion pounds. Hoagland, et al. (1996) proposed the use of market based incentives to aid in the resolution of fishery bycatch problems. Using the approach suggested by Hoagland, et al. (1996), managing for optimal yield in the shrimp fishery resulted in a 12% reduction in bycatch with a 7.3% reduction in fleet size and a USD 1.9 billion increase in the NPV (GMFMC, 1996). Market-based incentives have several advantages over more traditional command and control approaches, including cost effective allocations of environmental controls, incentives for firms to seek technological solutions, flexibility, returns to the public for the use of its resources, and, in some cases, lower administrative costs (Hoagland, et al., 1996).
Taking Care of Endangered Species
Another social cost incurred by regulated open access fisheries are the costs imposed by the potential extinction of socially valuable species.
Loomis and Larson (1994) conducted a survey, which found that both visitors and households provided estimates of total economic value (including non-use or existence values) for 50 and 100% increases in gray whale populations that were consistent with consumer theory. Day (1988) measured the non-consumptive use value of whale watching using travel cost and contingent value techniques. The consumer surplus estimate of USD 23.00 from the travel cost techniques was approximately equivalent to the contingent value technique estimate of USD 21.11 for a capitalized value between USD 66 and USD 118 million
Marine turtles are another example, which were found to have a significant, non-consumptive, existence value in the U.S. by Whitehead (1992) and Cabot (1996). The closing of the marine turtle fishery in the Gulf of Mexico because of overexploitation in the fishery and on nesting beaches, and the development of nesting beaches for other uses resulted in a significant loss of jobs, income, and sales in the southeastern U.S. directed fishery (Cato, Prochaska, and Pritchard, 1978). Costs have also been imposed to reduce incidental marine turtle take in the Gulf of Mexico shrimp fishery (Griffin and Oliver, 1991)) and the northwest Atlantic pelagic longline fishery (Scott, 2004).
Synopsis
Given the myriad of management goals and objectives required by federal and state laws as well as international agreements, and the regulated open access management institution used to control the exploitation of fish stocks in the U.S., significant costs have been imposed on both society and the fishing industry. These costs take the form of foregone net benefits that could be captured with a change in the management institution and the direct costs of command and control management regulations designed to mitigate undesirable outcomes. A change to rationally managed fisheries in the form of ITQs, IFQs, or cooperatives would not necessarily cause fishers to behave in a manner that corrected all these wrongs, especially given the complex and competing management goals and objectives. However, with the establishment of appropriate management institutions, rationalization could substantially reduce the costs to the industry and society
CHAPTER 10 – UNITED STATES – 299
USING MARKET MECHANISMS TO MANAGE FISHERIES: SMOOTHING THE PATH – ISBN-92-64-03657-1 © OECD 2006
by reducing fishing effort, internalizing some of the other social costs, and improving the financial performance of the fishing fleet. Within a second best economic context, rational fisheries management could increase economic efficiency while maintaining the status quo in fishing communities.
4. Completed Transitions to Rational Fisheries: Two Case Studies
Most U.S. fisheries are actually multi-species, multi-gear, multi-user group activities. Various types of fishing behavior are observed based on different gear types, switching between fisheries, and mobility or movements between geographical areas.
Most ITQ programs in U.S. fisheries are focused on a single species in these heterogeneous fisheries, but few quantitative analyses (Richardson, 1994) have been done, and most comparisons are based on qualitative assessments. As such, comparisons between fisheries (or even within fisheries) before and after rational fisheries management has been adopted are difficult at best.
The following two case studies – of the wreckfish fishery and the Alaskan halibut and sablefish fishery - will focus on what has been learned in the process of transition between regulated open access management and subsequent rational management.
The Wreckfish Fishery
The fishery for wreckfish (Polyprion americanus) is actually a component of a larger, multi-species fishery for swordfish, reef fish, and shrimp.
The fishery was initially developed by hook and line fishers using hydraulic reels spooled with steel wire and terminal rigs of monofilament spine and eight to twelve circle hooks, each on its own monofilament leader, baited primarily with squid. Since wreckfish on the Blake Plateau is a deep water fishery, 12 to 45 pound lead weights were used to sink the gear to the ocean floor. Vessels ranged from 30 to 80 feet in length and were typically equipped with from four to six hydraulic reels.
As a common pool resource, the fishery developed rapidly from two vessels initially landing fewer than 30 000pounds in 1987 to six vessels landing over 300 000 pounds in 1988. By 1989, over 2 million pounds were caught by approximately 25 vessels. This increased to over four million pounds landed by over 40 vessels in 1990 (Sedberry et al., 1993). With ex-vessel prices between USD 0.90 and USD 1.35 per pound, wreckfish became one of the largest revenue generating, fishing opportunities in the southeast.
Management History
After 1990, refitted shrimp trawlers and the introduction of bottom longline gear resulted in an increase in fleet size to between 60 and 70 vessels and a commensurate increase in landings with some harvester conflicts (SAFMC, 1990). At the time vessels were first required to have a permit, there were approximate 90 vessels permitted to operate in the wreckfish fishery (Gauvin, et al., 1994).
Typical command and control management measures were enacted by the South Atlantic Fisheries Management Council (SAFMC) to try to control landings of wreckfish as the fishery expanded, but these measures failed to address declines in economic returns. Regulations established a fishing season, a two million pound TAC, a prohibition on the use of bottom longline gear, and a 10,000 pound trip limit per vessel. These regulations lead to a race for fish that resulted in an overrun of the TAC in 1990-91
300 – CHAPTER 10 – UNITED STATES
USING MARKET MECHANISMS TO MANAGE FISHERIES: SMOOTHING THE PATH – ISBN-92-64-03657-1 © OECD 2006
fishing year, calls by fishers for an expanded TAC to offset a decline in earnings, and increased user conflicts on the restricted area fishing grounds (SAFMC, 1991).
Primarily to control fleet expansion and to avoid the costs associated with the continuous monitoring of the fishery, ITQs were proposed and developed for this fishery in 1991. Since the adoption of ITQs in the wreckfish fishery, TAC has not been exceeded and demands for increases in TAC levels from industry have ended.
The ITQ program itself was relatively free of restrictions. The MSFCMA precludes the charging of fees in excess of administrative costs of issuing permits or share certificates, so resource rents could not be captured through taxes on landings or royalty fees; a real concern for many SAFMC members who feared fishers would receive a windfall through the initial allocation. While not a property right since ownership of the wreckfish resource remained with the government and could be rescinded by amendment, the ITQ did grant an access right to the fishery of indefinite duration.
Initial Allocation
The initial allocation strategy was based on a series of four SAFMC meetings and seven public hearings in which classic rent seeking behavior (Buchanan, 1980) was evident:
� Early entrants - who described themselves as the developers of the fishery - felt a fair initial allocation of shares should be based on historical landings and favored the ITQ program as a means to improve their financial performance.
� Later entrants favored an initial allocation scheme that granted equal shares to each participant so that they could be ensure the ability to recapture a fair rate of return on their capital investment in vessels and gear.
� Processors15 feared the creation of market power by fishermen under the ITQ system and were generally opposed to a program unless it covered all fish species in the multi-species fishery of which wreckfish was a part.
Given the large number of substitute products for wreckfish, the market power arguments were dismissed by the SAFMC16, and a compromise between the two initial allocation schemes was reached. Half the initial shares received by individuals were divided based on historical catch from 1987 to 1990 and, provided no individual received more than 10%, the other half were divided evenly among all qualified participants; i.e. those with documented landings between 1989 and 1990. Although no “hold back” provision for shares was incorporated into the program, no legal challenges were made, indicating the initial allocation scheme represented a fair and equitable solution.
Transferability
Transferability to anyone and annual leases between permitted wreckfish fishermen were allowed. However, anyone who completed the necessary paperwork could become
15 Matulich et al. (1996) argue that processors have captured a sizeable portion of the resource rent through their pricing behavior.
16 In fact, the SAFMC (1991) amendment allowed for unlimited accumulation of shares once the initial allocation was completed. If excessive consolidations of shares did occur, it was the SAFMC intention that existing U.S. anti-trust law would be used to identify the problem and construct remedies.
CHAPTER 10 – UNITED STATES – 301
USING MARKET MECHANISMS TO MANAGE FISHERIES: SMOOTHING THE PATH – ISBN-92-64-03657-1 © OECD 2006
a permitted fisherman. During the initial allocation of ITQs to industry participants, a ten per cent limit was placed on share ownership by any individual in the fishery.
This initial restriction on share allocation was intended by the SAFMC to allow the ITQ market to determine the final participation level in the fishery. As required by the MSFCMA, the initial allocation of ITQ shares considered historical and current participation. Since the amendment acknowledged that more vessels operated in the fishery than the fishery could support, the implicit objective of the ITQ program was to allow free trade of shares to reduce overcapacity in the fishery and to resolve the associated problems caused by open access management. The intent of the Council was for the share market to compensate new entrants into the fishery for their investment in gear and vessels by promoting the exit of less efficient harvesters. The end result would be a more efficient and profitable fishery.
Consolidation
There was a consolidation of shares from 49 shareholders in 1992 to 31 in 1993 (Gauvin, et al., 1994) as a result of the wreckfish ITQ program. Average shares owned increased about 1.2%, with shares held by the ten largest shareholders increasing from 40% to 69%. Permitted wreckfish vessels declined from 91 to 22 and the number of vessels reporting landings fell from 44 to 14 between 1991 and 1994. As the size of the fleet declined, the number of monthly trips taken to catch wreckfish also declined. In addition, ex-vessel prices rose from USD 1.55 with high variability to USD 1.85 with lower variability, reflecting both the longer fishing season and the avoidance of market supply gluts caused by a race for fish. In short, the SAFMC objectives of reducing capacity and stabilizing prices were successfully achieved under the ITQ program.
However, consolidation in the fishery has continued. Today only one or two vessels report catch in the fishery. A number of reasons have been suggested for this phenomenon. One line of reasoning is that there needs to be a learning curve for fishermen before they are allowed to permanently trade quota shares in a market (Anderson, 2004). Indeed, one study suggested that the initial reallocation of shares occurred at extraordinary prices (Richardson, 1994), and another study suggested that the discount rate for ITQ shares and coupons was approximately 150% in 1994 (Gauvin, et al., 1994). A second argument is that the total allowable catch was set to high and the stock has become too depleted over time to sustain a commercial fishery. A third argument is that wreckfish shareholders are spending their time building their catch history in other sectors of this multi-species fishery that includes reef fish. This line of reasoning is plausible given that red snapper, one of the species in the fishery, has been under consideration for an ITQ program for the last decade.
The Alaskan Halibut and Sablefish Fishery
Unlike wreckfish, halibut and sablefish have long histories of exploitation by fishermen in Alaska. Beginning in the 1880’s, Pacific halibut was harvested using dories (IPHC, 1987). In the 1920’s, diesel-powered vessels and mechanical longline gear were introduced and the fishery expanded into the Gulf of Alaska. A three month closure to protect the spawning stock was instituted at this time.
Management History
The fishery became part of a multi-species fishery when trawlers, purse seiners, and salmon trollers and gillnetters used halibut as a part-time fishery in the 1930’s and 1940’s.
302 – CHAPTER 10 – UNITED STATES
USING MARKET MECHANISMS TO MANAGE FISHERIES: SMOOTHING THE PATH – ISBN-92-64-03657-1 © OECD 2006
Lower catch limits were instituted in the 1960’s in response to a perceived decline in stock abundance. Halibut prices began to rise in the 1970’s and a limited entry program in the salmon fisheries encouraged the entrance of a large number of small vessels into the fishery. As crab stocks declined in the 1980’s, many larger vessels turned to halibut to offset losses.17
An average of 3 275 vessel owners participated in the halibut fishery by 1990 with 70% of them also participating in other fisheries. Sablefish, however, are caught in deeper water causing the fishery to be further offshore, than the halibut fishery, and requires the use of larger vessels (Pautzke and Oliver, 1997). Alaska sablefish harvest was dominated by foreign fleets until the passage of the MSFCMA in 1976. After which the foreign fleets declined and the U.S. fleet grew by more than a factor of ten between 1981 and 1988. Nearly all (95%) of sablefish fishers are also active in other fisheries, which generate 65% of their income. By the time of the ITQ program, command and control regulations had reduced the fishery in many management areas to as little as 24 hours.
TAC and season limitation regulations created a number of problems for the halibut/sablefish fisheries:
� First, safety at sea was compromised since fishers often had to fish regardless of weather because of the single day season (NMFS, 1994).
� Second, seasonal limits were a crude measure for achieving TAC allocations since individual fishers were allowed unlimited catch during the open season.
� Third, fishers overinvested in capital to limit their downtime, creating overcapacity in the fisheries that was exacerbated by the regulated open access management regime.
� Fourth, gear loss was excessive as fishers attempted to maximize revenue in the fishery instead of profits (NMFS, 1994).
� Fifth, the abandoned gear was a significant contributor to fishing mortality. The ex-vessel value of this lost catch was estimated at between $2.4 and $4 million per year (NPFMC, 1992).
� Finally, the poor handling and storage of catch during the short fishing season and the need for cold storage holding facilities to store frozen catch through the off season resulted in reduced market prices for halibut.
These problems were not as pronounced in the sablefish fishery, but managers could see that trends in the fishery were leading them down the same path (Hartley and Fina, 2001). Some form of limited entry was needed for these fisheries.
The IFQ program for halibut and sablefish was developed after several years of in-depth social and economic analysis, public meetings, comment periods, regulatory development, and implementation procedures (Hartley and Fina, 2001). Economic efficiency was not the primary objective of the NPFMC for the IFQ program.
17 Halibut is particularly attractive because of the relatively small amount of specialized gear needed for entry and the innate vulnerability of the species to capture (IPHC, 1987).
CHAPTER 10 – UNITED STATES – 303
USING MARKET MECHANISMS TO MANAGE FISHERIES: SMOOTHING THE PATH – ISBN-92-64-03657-1 © OECD 2006
Initial Allocation
Seven policy objectives underlay the initial allocation of quota shares:
� First, and probably foremost, was the preservation of the size and character of the fishing fleet.
� Second, and related to the first objective, the NPFMC desired to limit and discourage corporate ownership of the fisheries.
� Third, active participants in the fishery were to be rewarded by the IFQ program initial allocation.
� Fourth, more of the rewards should go to long time participants in the fishery than relatively new comers.
� Fifth, those who invested in the fishery by purchasing vessels and gear should receive more of the rewards from an IFQ program than those who simply worked as crew onboard a vessel.
� Sixth, even though the MSFCMA precludes the collecting of resource rents, the NPFMC desired to limit windfall profits to fishers being distributed quota shares in the initial allocation.
� Finally, speculative entry into the fishery was to be discouraged.
In addition, quota shares were reserved as community development quotas (CDQs) for remote communities in the Aleutian Islands and Bering Sea because the program was designed to assist communities by allowing them access to the halibut/sablefish fisheries in the hope that they would develop active fishing fleets.
To achieve these objectives, IFQ shares were initially distributed based on the past landings history of fishers over multiple years to avoid hardships caused by illness or the Exxon Valdez oil spill.
The initial allocation did achieve at least two of the stated objectives of the NPFMC (Hartley and Fina, 2001). The size and character of the fishing fleet was essentially maintained to preserve the small fishing operation by allocating IFQ shares among participants based on their landings history over several years and because no payments for shares were required from fishers. This allocation scheme also brought more fishers into the program and is felt to have disbursed the windfall from the free allocation of shares.
Achieving Objectives
A related objective of developing participation in the halibut/sablefish fisheries in remote communities through CDQ had mixed success. While some communities developed fishing fleets and benefited from the revenues generated and from the creation of jobs, others sold or leased their shares creating income in the form of royalties paid by participating IFQ fishermen.
At the time of the adoption of the IFQ program, half of the Alaskan halibut fishers preferred the program over the existing regulated open access management system. The majority did not support IFQs because they did not expect their financial situation to improve under the program (Knapp, 1996). Less than one-third of the participants thought that the initial allocation of IFQ shares would be fair (Berman and Leask, 1994).
304 – CHAPTER 10 – UNITED STATES
USING MARKET MECHANISMS TO MANAGE FISHERIES: SMOOTHING THE PATH – ISBN-92-64-03657-1 © OECD 2006
However, most fishers including those who preferred other management programs did think that the fishery would be safer - which did in fact come to pass.
After the adoption of the IFQ program, the most satisfied fishers were those who had a long history in the fishery and got a substantially larger share of the quota than the new entrants, especially those who entered the fishery after the period of time used for qualifying for quota share. This result also reflected a stated goal of the initial IFQ allocation program:
� to reward those with the longest history in the fishery, and
� by excluding crews, to reward those who had invested in vessels and fishing gear to operate in the fishery.
5. Trying to Transition: the Red Snapper Fishery
Although still under deliberation, the ITQ program for red snapper deserves extra attention because it is the first to be implemented under the new guidelines - requiring greater industry involvement in the development of the ITQ program that were established by Congress in the reauthorization of the MSFCMA.18 The guidelines require referendums at each of two stages of program development to ensure industry approval for developing the ITQ program and for the adoption of a specifically developed program for that fishery.
The Gulf of Mexico Reef Fish Fishery Management Plan, submitted to the Secretary of Commerce in August 2001, was approved in June 1983 and implemented in November 1984. While encompassing a large number of managed species - 14 species of snappers [Lutijanidae], 15 species of groupers [Serranudae], four species of amberjacks (Carangidae), five species of tilefish (Malacanthidae), and gray triggerfish - a disproportionate amount of the Council’s activities have gravitated around the management of red snapper (Lutjanus campechanus).
The fishery, which is targeted by both commercial and recreational fishermen, was known to be overfished as early the late 1970's when evidence indicated that the fishery was primarily supported by younger fish aged one through three. This overfished status was determined to be the result both an excessive amount of directed effort on the species and a high level of bycatch mortality associated with shrimp trawling activities.
Management History
With an increasing awareness of the overfished status of many of the reef fish species throughout the U.S. Southeast (South Atlantic and Gulf of Mexico), particularly red snapper, the National Marine Fisheries Service (NMFS) announced in November 1989 that anyone entering the commercial reef fish fishery in the Gulf or South Atlantic after November 7, 1989 may not be assured of future access to the fishery. While not directly controlling effort in the red snapper fishery (or the overall reef fish fishery), the purpose of this amendment was to establish public awareness of potential eligibility criteria for future access to the reef fish resource.
In January 1990, the Gulf Council, through Amendment 1 to the Reef Fish Fishery Management Plan, established a 3.1 million pound quota for the commercial red snapper
18 The deliberation process is far enough advanced that lessons can be learned.
CHAPTER 10 – UNITED STATES – 305
USING MARKET MECHANISMS TO MANAGE FISHERIES: SMOOTHING THE PATH – ISBN-92-64-03657-1 © OECD 2006
fishery in the Gulf of Mexico. This quota did not prove to be a binding constraint on the commercial harvest for that year which totaled 2.7 million pounds. As such, the fishery remained open during the entire year.
With additional information being made available on the status of the stock, the commercial quota was reduced to 2.04 million pounds for 1991. This binding quota closed the commercial fishery on August 23, 1991, after 235 days of permitted activities. Given an increasing stock and a derby-fishing mentality, the 1992 quota (2.04 million pounds) was reached after only 53 days.19
The first comprehensive attempt to curtail effort expansion in the reef fish fishery of the Gulf of Mexico was enacted under Amendment 4 to the Reef Fish Fishery Management Plan. This Amendment, implemented in May 1992, established a maximum three-year moratorium on the issuance of new reef fish permits.20 To be eligible for a permit, furthermore, a 50% income criterion from fishing activities was established with a grace period which would allow one to establish the necessary criteria, if needed. Eligibility could be attached to either the owner or operator of a vessel.
The First Attempt to Move toward an ITQ System
Two efforts were made to develop an ITQ program in the red snapper fishery. The first was before and the second was after the Congressional mandated moratorium on ITQ programs. The initial attempt will be presented next, followed by the second attempt that is presently still in process.
The Council recognized the limitations afforded to it by enactment of the reef fish fishery moratorium and in September 1992 requested that the NMFS implement a series of measures to extend the commercial red snapper season.
The major component of this request included establishment of an endorsement system for qualified reef fish permittees.21 The purpose of the endorsement system was to forestall the recurrence of the 1992 derby situation during that period of time deemed necessary by the Council to develop and implement comprehensive effort management system. Essentially, two comprehensive effort management systems were considered. The first was a license-limitation system in conjunction with trip limits. The second was an ITQ program. The intent of the Council was to develop and implement this comprehensive effort management system prior to the expiration of the endorsement system. The endorsement system was scheduled to expire after 1995.
19 The commercial fishery season was reopened on April 3, 1992 by emergency rule due to the hardship conditions imposed with the early closure. This emergency rule, which extended through May 14, 1992, limited commercial harvest of red snapper to 1000 pounds per trip and resulted in an additional 600 thousand pounds being harvested.
20 While the moratorium could have been made retroactive to November 7, 1989 based on the November 1989 announcement by the National Marine Fishery Service, the Council chose not to do so.
21 Those people able to demonstrate that they caught 5000 pounds of red snapper in two of the three years during 1990-92 were issued an endorsement which would allow them to harvest 2000 pounds of red snapper per trip. Reef fish vessels that did not qualify for the endorsement yet demonstrated red snapper landings during the qualifying period would be allowed to harvest a maximum of 200 pounds of red snapper per trip.
306 – CHAPTER 10 – UNITED STATES
USING MARKET MECHANISMS TO MANAGE FISHERIES: SMOOTHING THE PATH – ISBN-92-64-03657-1 © OECD 2006
Some of the identified problems in the fishery that required a comprehensive effort management system included:
1. The harvest capability of the red snapper fleet is larger than that needed to harvest the commercial quota in an economically efficient manner;
2. The derby compromises vessel safety by encouraging fishermen to begin or continue trips under adverse weather conditions;
3. The total revenue derived from current landings is not reaching the highest possible level because the quota system creates a derby which tends to depress the average price paid to the fishermen;
4. A derby fishery tends to reduce producer surplus that would otherwise be available from the fishery and has an unknown but limited effect on consumer surplus derived from the fishery;
5. The current management system contains a number of regulations which in aggregate lead to high administration costs, difficulties in enforcement and compliance, inefficient production of available quota, frustration on the part of fishery participants, and difficulties in collecting timely data needed to track and manage the fishery;...22
Given the potential restrictiveness associated with any of the viable effort management systems under consideration by the Council, it elected to establish an Ad Hoc Red Snapper Advisory Panel (AHRSP). The purpose of this Panel was to advise the Council with respect to development of a comprehensive management program and, more specifically, allocation issues that might arise during the developmental stage.
When first convened in late 1993, the Panel indicated that there was considerable industry opposition to ITQ’s. This opposition, at least in part, dealt with uncertainty among individual fishermen regarding what their initial allocations would be under alternative initial allocation scenarios. The Panel recommended that the National Marine Fishery Service take the necessary actions needed to ascertain landing records of individual fishermen and allocations that would be forthcoming under alternative scenarios.
Other than holding a set of public hearings in late 1994, the Council took little action on Amendment 8 to the Reef Fish Fishery of the Gulf of Mexico fishery management plan (the Amendment)23 while waiting for NMFS to collect and analyze red snapper landing records. While generating less than full support, comments during the public hearing process revealed a greater acceptance for an ITQ program than had been expressed during previous public meetings. In fact, a number of fishermen who had previously spoken out in opposition to ITQs changed their position after receiving information on their respective shares.
In May 1995, the Council voted to adopt an ITQ program for the Gulf of Mexico red snapper fishery. It also voted to send Amendment 8 (creating the ITQ system) to the Secretary of Commerce for final approval with the goal of implementing the program at the beginning of 1996.
22 Amendment 8 to the Reef Fish Fishery Management Plan
23 Amendment 8 created the commercial red snapper ITQ system.
CHAPTER 10 – UNITED STATES – 307
USING MARKET MECHANISMS TO MANAGE FISHERIES: SMOOTHING THE PATH – ISBN-92-64-03657-1 © OECD 2006
Because of numerous delays, some of which were beyond the control of the Council, the 1996 commercial red snapper season was initially managed under a continuation of the endorsement system (with a 1.0 million pound quota) with the intention of moving to the ITQ program on April 1, 1996. Concerns regarding Congressional funding for the ITQ program, however, made it inadvisable for NMFS to implement the ITQ program. Shortly thereafter (October 1996), Congress, in its amendments to the Magnuson Stevens Act (HR5666), placed a moratorium on the creation of any new IFQ programs in the U.S. until 2000 and made this moratorium retroactive so as to preclude the Gulf Council from implementing its red snapper IFQ.24
Major Design Features of the First Attempt
The details of the aborted red snapper ITQ program can be found in Amendment 8 to the Reef Fish Fishery Management Plan. Some of the more salient features are outlined below.
Duration of the program
As indicated in Amendment 8, the proposed ITQ system would remain in effect for four years from the date that the system was implemented. The program was to be evaluated during this four-year period after which time it would be modified, extended as is, or terminated. In general, much of the rationale for the four-year period reflected uncertainty as to whether the ITQ system, at the time Amendment 8 was being developed, would achieve the stated objectives. In short, the four-year “experimental” period was a negotiated settlement to achieve a majority vote by Council members.
Initial eligibility
As noted, Amendment 4 to the Reef Fish Fishery Management Plan established eligibility criteria for permitting in the reef fish fishery. At the time Amendment 8 was being developed, approximately six per cent of the reef fish vessel permits were based on records of income qualifications of operators rather than owners. Furthermore, there were instances where captains operated the vessel under vessel lease arrangements with the owners whereby the captain was responsible for payments to the crew and payment to the owner was via some negotiated share arrangement. Under this scenario, captains would be considered self employed. In all instances, however, catch records were attached to the vessel.
In the proposed rule that establishing an ITQ system for the commercial red snapper fishery, initial eligibility was defined as follows: “An initial shareholder under this ITQ system would be either the owner or operator of a vessel with a valid permit on August 29, 1995 provided such owner or operator had the required landing of red snapper during the period 1990 through 1992. If the earned income of an operator was used to qualify for the permit valid August 29, 1995, such operator would be the initial shareholder rather than the owner. The term ‘owner’ includes a corporation or other legal entity. Additionally, a historical captain could be an initial ITQ shareholder.”
24 This moratorium was subsequently extended by Congress to October 1, 2002.
308 – CHAPTER 10 – UNITED STATES
USING MARKET MECHANISMS TO MANAGE FISHERIES: SMOOTHING THE PATH – ISBN-92-64-03657-1 © OECD 2006
Determination of initial allocations
Overall, the Council was constrained by the years that could be used in the qualifying period. Prior to 1990, no landings data at the individual vessel level was collected; thereby precluding any earlier qualifying period. Furthermore, the endorsement system after 1992, it was generally believed, seriously distorted catching activities and, hence, harvests after 1992 would likely not accurately reflect historical activities. Hence, the Council settled on a 1990-92 qualifying time frame. Specifically, initial allocations were based on landing records for each of the participants during the qualifying period; subject to the condition that each eligible individual would receive, at a minimum, 100 pounds.
Transfer of shares
As proposed in Amendment 8, during the first 18 months of the red snapper ITQ program, shares could be transferred only to persons who were initial shareholders.25 Thereafter, shares or any portion thereof could be transferred freely to any person who is a U.S. citizen or permanent resident alien.
Maximum ownership or use of ITQs
In final action taken on Amendment 8, the Council chose not to impose any maximum on the possession of ITQ shares or the fishing of ITQ coupons in any given year. This decision was made despite the fact that concern had been expressed during the public hearing process regarding the potential for monopolization of ITQ market.
There were essentially three reasons why the Council chose not to impose any “cap” on ITQ shares or use of annual coupons. First, the Council recognized that anti-trust laws could be invoked to control market power if deemed necessary and appropriate. Second, the Council recognized that any “cap” could be easily circumvented by a family or corporation where individuals (or several “connected’ corporations) each maintained levels under the “cap.” Finally, the Council recognized that imports of red snapper were large and competed directly with the domestic product. As such, the ability of any ITQ shareholder to manipulate price was of little concern.
The Second Attempt to develop an ITQ program
Because of the pending moratorium on ITQs, the Council, in 1995, voted to extend the red snapper endorsement system through 1997 (Amendment 13). During this period, fishing seasons (a spring and fall season) were also established through the Regulatory Amendment process and fishing was only permitted during the first 15 days of each month. With Amendment 15, implemented in 1998, a two-tier trip limit system in conjunction with a license-limitation program (2000 pounds per trip among Class 1 licensees and 200 pounds per trip for Class 2 licensees) was formalised and made permanent until such time that an improved management system could be implemented. Subsequently, in 2000, regulations were modified such that the spring season was opened for only the first ten days of each month (until 3.06 million pounds was harvested) while the fall season was opened for the first ten days of each month until the quota was reached.
With anticipation that the Congressionally imposed IFQ moratorium would expire in October 2002, some commercial red snapper fishermen requested that the Council
25 During the first six months of the proposed program, no transfers were allowed.
CHAPTER 10 – UNITED STATES – 309
USING MARKET MECHANISMS TO MANAGE FISHERIES: SMOOTHING THE PATH – ISBN-92-64-03657-1 © OECD 2006
reconsider an IFQ program for red snapper. This request was in response to the poor financial conditions in the fishery brought about, at least in part, due to low prices for the harvested product associated with a glut of product on the market when fishing was permitted. Safety concerns (and the general desire to chose when to fish other than being dictated by the seasonal closures), associated with having to fish under less than ideal conditions when fishing was permitted, also prompted the request. In short, it is fair to say that none of the problems initially identified as the rationale for creation of a comprehensive effort management system were resolved via actions taken by the Council in the interim 1995-2002 period.26
In response to the industry request, the Council resurrected the Ad Hoc Red Snapper Advisory Panel (AHRSP) and charged it with developing a “profile” for an ITQ program.27 This Panel, which consisted of 13 voting members (all with commercial red snapper interests and 4 non-voting members (representing economics, biology, enforcement, and environmental interests) was convened four times between March and August 2002. The 13-voting members were dominated by Class 1 license representatives (i.e., eligible to harvest 2 000 pounds per trip). The major issues discussed by the Panel included:
� initial allocation of IFQ shares,
� ownership caps, and
� transfers of shares and annual allocations.
During the four meetings, the AHRSP considered the primary issues and provided a suite of alternatives associated with each of the issues. It also selected a preferred alternative in each case. Upon completion by the AHRSP, the draft profile was brought to the Council for consideration. The Council, after deliberation, added alternatives when deemed appropriate and selected its own set of preferred alternatives in most cases.28 While many of the preferred alternatives selected by the Council coincided with those selected by the AHRSP, many of the preferred alternatives differed significantly.29
Under the 1996 amendments to the Magnuson-Stevens Act, the Gulf Council is authorized to prepare and submit a plan amendment to implement an ITQ program for the commercial red snapper fishery (after the expiration of the moratorium), but only after a number of conditions are met. One of these conditions is that there be an initial referendum to determine industry support of an ITQ program in the red snapper fishery.30Without a favorable vote on this initial referendum, the Council, by law, would not be allowed to prepare a plan amendment for the commercial red snapper ITQ. After
26 As one concrete example, the commercial quota set under TAC increased by about 50% between 1990 and 2000 (from about 3.1 million pounds to 4.65 million pounds). Yet, the commercial season in 2000 remained open for only 76 days in total (compared to the full 365 days in 1990).
27 As previously indicated, the 1996 amendments to the Magnuson-Stevens Act prohibited new ITQ programs until October 1, 2000 (subsequently extended to October 1, 2002). However, the amendments also provided the Council the option of developing a profile for any fishery under its jurisdiction being considered for ITQ management. This profile, in essence, would represent the first step toward implementation of an ITQ management system.
28 In a limited number of cases, the Council chose not to select any alternatives as the “preferred” alternative.
29 These differences are discussed in greater detail in a subsequent section.
30 This referendum, and a subsequent one to be discussed later, is specific to red snapper. ITQ programs being considered for other species, by the Gulf or any other Council, are not required to hold referendums.
310 – CHAPTER 10 – UNITED STATES
USING MARKET MECHANISMS TO MANAGE FISHERIES: SMOOTHING THE PATH – ISBN-92-64-03657-1 © OECD 2006
review of the draft red snapper profile, the Council asked NMFS to conduct this initial referendum to gauge industry support. Somewhat surprisingly, the Council chose not to formally adopt the draft agenda; hence, it was not distributed to eligible participants of the referendum.31
Section 407 (c) (2) established criteria regarding eligible participants of the initial referendum. While the criteria are outside the scope of this document, they are outlined in the Federal Register (December 30, 2003). With one notable exception (vessel captains who harvested red snapper under a red snapper endorsement in each red snapper commercial season occurring from January 1, 1993 and September 1, 1996), the referendum was limited to Class 1/endorsement license holders. While the Class 2 permittees were understandably disturbed by this restriction, inclusion of them in the referendum would have made little difference since the vote was weighted by poundage harvested over a specified period.
When concluded, the referendum was approved (in favor of the concept of an ITQ program for the commercial red snapper fishery) by a very large margin among votes cast (approximately 80% in favor). Upon notification of the results, the Council voted to send the draft profile out for eight public hearings throughout the Gulf of Mexico. These hearings were held in August and September 2004.
Upon completion of the public hearings, the AHRSP was reconvened to consider the public comments and make desired modifications to the draft profile, including many of the initially selected preferred alternatives. After doing so, the Council reviewed the profile once again and made modifications, including changing many of its initially selected preferred alternatives. Having done so, the Council also voted to proceed with preparation of a plan amendment and regulations to implement an ITQ program for the commercial red snapper fishery of the Gulf of Mexico (i.e., Amendment 26).
If the Council does not change its position prior to completion of the plan amendment, Section 407 (c) of the Magnuson-Stevens Act requires that a second referendum be conducted to vote on acceptance of the plan amendment (voting criteria associated with this second referendum is contained in the Federal Register: December 30, 2003).32 If the vote on this second referendum is not positive, the Council and NMFS are forbidden by law to implement an ITQ program for the commercial red snapper fishery.
The double-referendum approach for a commercial red snapper ITQ program is unique and specifically outlined in the 1996 amendments to the Magnuson-Stevens Act. Certainly, if the Council, which has a large number of recreational interests, wishes to “doom” an ITQ program, it need merely design the program such that it is unpalatable to the majority of voting members (by weighted vote based on harvest). If the Council is in favor of an ITQ management system, it must design it with industry wishes in mind, or risk a negative outcome to the second referendum.
A major question, however, is how much is industry willing to give up obtaining an ITQ program? As previously indicated, approximately 80% of the vote in the initial
31 In general, it is safe to say that most of the larger red snapper industry participants had been briefed on the major contents of the profile given (a) the large number of Class 1 license holders on the AHRSP and (b) discussion of the profile at various Council meetings.
32 Like the initial referendum, language in the Magnuson-Stevens Act requiring a second referendum pertains only to an ITQ program for the commercial red snapper fishery.
CHAPTER 10 – UNITED STATES – 311
USING MARKET MECHANISMS TO MANAGE FISHERIES: SMOOTHING THE PATH – ISBN-92-64-03657-1 © OECD 2006
referendum was in favor of an ITQ program. Another question is whether or not this margin in favor of the ITQ program will remain during the second referendum after the details of the program are developed in the plan amendment? Overall, one can surmise that there will have to be some “give and take” from both sides (Council and industry participants) for a favorable vote on the second referendum.
Major Design Features of the Second Attempt
Given that the proposed ITQ program for the commercial red snapper fishery is still in the developmental stage, one cannot discuss its major components with any degree of certainty (or even whether it will eventually be implemented).
Therefore, the following discussion covers some of its major features as specified by the Council after significant input by the AHRSP and input gleaned from the public hearings and now listed as Draft Options Paper for Amendment 26 to the Gulf of Mexico Reef Fish Fishery Management Plan, December, 2004. In instances where the preferred alternatives in the Draft Options Paper for Amendment 26 differ significantly from those that would have been implemented under the original ITQ program (Amendment 8), these differences are highlighted and briefly discussed.
Duration of the program
As currently envisioned by the Council, the ITQ program, if implemented, will be continued indefinitely. Five years after the inception of the program, however, the program is to be reviewed at which point it could be modified or terminated by Council action.
In the development of Amendment 8, the Council, as noted above, selected a four-year duration period (with a possibility of extension). The four-year period duration period was the result of concerns expressed by fishermen that there was no provision for terminating the system if it did not produce the expected benefits and because a four-year period would keep windfall profit and speculation to a minimum.
Overall, one can conclude that the major differences regarding the duration of the program, as expressed in the Draft Options Paper for Amendment 26 in comparison to Amendment 8, reflect increased certainty that an ITQ program will address many of the ongoing problems/concerns with the commercial red snapper fishery.
Approximately ten years have transpired since the original ITQ program was to be implemented and little has changed in the commercial fishery with respect to derby activities, safety concerns, etc. During this intervening period, both the commercial industry and the Council have gained an appreciation of the potential benefits of ITQs and feel more comfortable with implementation of an ITQ program for the red snapper fishery. As succinctly stated by one of the larger commercial red snapper fishermen at a public hearing in Houma, Louisiana (August 12, 2004), “I ask for IFQ. I want to make a good living, and I want my life back from the derby fishery.”
Initial eligibility
The AHRSP recommendation pertaining to initial eligibility was that “[a] person to whom a Class 1 or Class 2 license has been issued and/or persons that obtained or retained catch histories through legally binding agreements will be eligible for initial
312 – CHAPTER 10 – UNITED STATES
USING MARKET MECHANISMS TO MANAGE FISHERIES: SMOOTHING THE PATH – ISBN-92-64-03657-1 © OECD 2006
allocations...”33 Hence, approximately 135 Class 1 licensees and 490 Class 2 licensees would be eligible (as of mid-2002). Excluded from any consideration were the historical captains, which led to considerable debate when Amendment 8 was being developed, unless they had a license.34
One interesting facet associated with the AHRSP recommendation is the clause that “persons that obtained or retained catch histories through legally binding agreements will be eligible for initial allocations.” Though the frequency of this activity is not public at this point, the fact that the AHRSP included the phrase suggests that there have been sales of licenses without catch histories and/or buying of catch histories without the associated license.
Initial allocations
As currently proposed in the Draft Options Paper Amendment 26 the initial assignment of shares will be as follows: “Among all red snapper license holders (i.e., Class 1 and Class 2 licenses), base the initial allocation on 10 out of 10 consecutive years; the individual chooses either 1990 through 1999 or 1994 through 2003.”
The AHRSP selected this as its preferred alternative because it would allow Class 2 license holders to include the early years in the determination of their initial allocations (i.e., when they were able to fish relatively unrestricted before the imposition of trip limits). Class 1 licensees could also use the earlier period if they so desired.35
In general, the AHRSP preferred the 10-year period for use in determining initial apportionments since historical activities would weight heavily in determination of initial quota shares. This reflects, at least in part, the composition of the AHRSP. Specifically, the majority of members on the Panel were Class 1 fishermen with established historical records. Many of the Class 2 licensees, at public hearings, expressed a preference for a more “equitable” initial apportionment of shares.
As proposed in the original ITQ program (Amendment 8), as noted, initial apportionment was to be based on a relatively short time period, i.e., 1990 through 1992. This relatively short period reflects the lack of catch records at the vessel level prior to 1990. Minutes of Council meetings suggest that the Council would have used a longer time period in establishing initial allocations if landing records were available.
Transferability
The issue of transferability of shares (annual allotments) is addressed in two sections of the Draft Options Paper for Amendment 26. In the first section, the issue of whether restrictions should be place on the rights to transfer ITQ shares and annual allotments was addressed. The AHRSP recommended that “[a]ll or any portion of IFQ shares or coupons (i.e., annual allotments be fully transferable by sale, lease, gift, or inheritance; not withstanding possible limitations pertaining to whom transfers may occur.” The Council explicitly chose not to select a preferred alternative with respect to this issue.
33 The Council, when reviewing the profile developed by the AHRSP provided no preferred alternative to this section.
34 Members of the AHRSP indicated that there were no remaining historical captains in the industry.
35 The AHRSP made a strong recommendation that more recent years (i.e., 1994 and 1995) not be included in determining initial allocations because of concerns of changing fishing practices to build landing records.
CHAPTER 10 – UNITED STATES – 313
USING MARKET MECHANISMS TO MANAGE FISHERIES: SMOOTHING THE PATH – ISBN-92-64-03657-1 © OECD 2006
In the second section, the issue of to whom transferability would be allowed was addressed. To this issue, the recommendation as given in the Draft Options Paper for Amendment 26 states: “IFQ share certificates and/or coupons can be transferred only to persons in the commercial reef fish fishery (i.e., those individuals/vessels maintaining a valid reef fish vessel permit).” Behind the rationale for this alternative is a strong desire by the AHRSP that all commercial quota set under TAC remain in the commercial reef fish fishery.
To understand the rationale associated with selection of this alternative one must have an appreciation of the red snapper fishery of the Gulf of Mexico. In addition to the large commercial sector, there is also a large recreational component, allocated about one-half of the total TAC. A large portion of the recreational quota set under TAC is harvested by charter and head boats. In addition, environmental groups have been active in the management process. There is a concern by the AHRSP that, in the absence of some restrictions regarding to whom transfers could be made, recreational and/or environmental interests would purchase shares/coupons; thus reducing the amount of the commercial quota set under TAC available for “true” commercial purposes.36
Consolidation
There was concern among many of the AHRSP members that without some restrictions, consolidation in the commercial red snapper fishery would become excessive. Hence, in the draft profile, they adopted the following wording regarding ownership caps and restrictions: “No quota holder may hold more than eight per cent of the IFQ share certificates issued for red snapper.”37 The Council chose not to specify a preferred alternative in this section.
As currently stands, the alternative differs from that in Amendment 8 wherein the Council voted that there be no ownership restrictions. As the plan development for Amendment 26 proceeds, however, Council may select a no ownership restriction as its preferred alternative.
6. Transition Issues
The Initial Allocation of Shares
The allocation of shares is a contentious issue in most fisheries. From solely an economic perspective, the same allocation of shares should result regardless of how they are initially distributed if the resulting share markets are efficient. The underlying economic justification for this is the Coase Theorem (Coase, 1960), which states that “when property rights are well defined and transacting is costless, resources will be used where they are most valued, regardless of how property rights are initially allocated and which of the transactors assumes liability for his or her effects on the other” (Barzel, 1997, p. 77).
36 While not discussed in this paper, the AHRSP attempted to “add some bite” to this alternative by (a) requiring NMFS notification of all transfers of share and/or coupon and (b) inserting a “use it or lose it” provision in the options paper. The NMFS notification would be an enforcement mechanism for assuring that the quota set under TAC remain in the commercial reef fish sector.
37 A qualification was made for those persons who, during the initial allocation, receive an ITQ share in excess of eight percent. These persons, however, could not acquire any additional share certificates or coupons until such time that share fell to under eight percent.
314 – CHAPTER 10 – UNITED STATES
USING MARKET MECHANISMS TO MANAGE FISHERIES: SMOOTHING THE PATH – ISBN-92-64-03657-1 © OECD 2006
However, economic impacts and the ability to achieve alternative social objectives will be different under different allocation schemes. In actual practice, the problem is that externalities and positive transaction costs do exist in the marketplace, and these lead to inefficient allocation solutions. Fisheries is an example of how actual markets failures or externalities cause a misallocation of capital, labor, and the stock of fish in the harvest sector that ITQs are designed to correct. The transferability requirement of a competitive market is violated when clearly defined and enforceable property rights for the in situ resource do not exist.
In the case of a regulated open access fishery, the market does not generate a price that the fisher must pay to access the resource stock. This externality results in a failure of the market to allocate the fishery input in the production process efficiently; i.e., to maximize profits to society. Instead, the result is a race for fish that depletes the fish stock (Clark, 1973).
ITQs or IFQs are designed to act as if property rights exist for the in situ resource by granting an access privilege to fishermen for the stock of fish. The transferability of this access privilege allows a market price to develop that acts as a proxy for the resource stock price in the harvest sector. While ownership of the resource remains with the government in the U.S., the access privilege provided by the IFQ instrument allows fishers to make rational, or profit maximizing, decisions about when and where to harvest fish.
Other forms of market failure can also exist and can affect the equilibrium prices in the markets set up to transfer IFQ shares and certificates among fishery participants. A market failure can arise, for example, when imperfect information about prices exists in the marketplace. Price information communicated in imperfect markets can bias IFQ certificate and share prices resulting in an over or under harvest in a fishery, which has stock conservation implications for overfishing.
Anderson (2004) illustrates that economic institutions matter. That is, different rules of trade present different incentives for bidding, asking, and trading in new markets, and that these different incentives lead to different price discovery patterns, which yield materially different outcomes. In his laboratory, tradable fishing allowance system markets are highly volatile and do not achieve equilibrium when trade takes place through a double auction without prior experience from trading leases. However, when price discovery is allowed through the trading of leases in early periods, volatility is significantly reduced and equilibrium is achieved. This dependence of equilibration and outcomes on institutions implies that economists must consider institutions in designing new market-based management systems.
Social Goals and Objectives
There are cases where efficient allocation of resources is not the primary objective of fishery managers. Indeed, as mentioned earlier, the U.S. has many competing and even conflicting goals and objectives for fisheries management. As a result, economics solutions to management problems should be considered as second best allocations.38
Thus, the closer the market institutions created by managers can be made to the theoretical ideal competitive market, the more likely the equilibrium prices will result in
38 Again, National Standard 5 in the MSFCMA states that economic efficiency should be considered but not as the sole criteria when allocation of fish stocks is considered.
CHAPTER 10 – UNITED STATES – 315
USING MARKET MECHANISMS TO MANAGE FISHERIES: SMOOTHING THE PATH – ISBN-92-64-03657-1 © OECD 2006
efficient allocations of inputs used to harvest fish; e.g., capital, labour, and the fish stock. That is, once institutions are established that can achieve the primary management objective, the resulting allocations of resources are such that the second-best economic efficiency is achieved.
This is particularly true for the markets that allocate ITQ or IFQ market shares. National Standard 8 requires that consideration be given to preserving fishing dependent communities. In open access and regulated open access fisheries, overinvestment in fishing communities can result especially in remote areas that are adjacent to abundant fishing grounds. Once the IFQ market is established, individual crew members and communities can be adversely affected (McCay and Creed, 1994) if market institutions are not established to protect them.
In the U.S. halibut/sablefish fishery, concerns among fishery managers for western Alaska, rural community preservation lead to the creation of community development quotas (CDQs). By giving special consideration to fishing communities under the CDQ program and by restricting trade to geographical cells within the fishery, this program improved social and economic conditions by building the capacity of the community to engage in commercial fishing (National Research Council, 1999). Neither of these market restrictions would ensure that the resulting IFQ markets were efficient, but the institution created did ensure that the social objective of preserving fishing communities was achieved while at the same time increasing economic efficiency in the harvest sector.
In overfished fisheries, share consolidation is expected to occur with the adoption of ITQ or IFQ management programs as fisheries convert from open access (or regulated open access) fisheries to rationally managed fisheries using access privileges that approximates maximum economic yield (MEY). However, excessive share consolidation in ITQ and IFQ programs is to be avoided according to National Standard 4 in the MSFCMA. Fishers acting as price takers in the sale of their catch where many substitutes exist (highly elastic demand) is no guarantee that demand is not inelastic in ITQ markets for a particular fishery because no substitutes exist, and could lead to excessive share consolidation by participants.
In the wreckfish fishery ITQ program, share consolidation was discussed at length in terms of its ability to create market power, or the ability to set prices in the marketplace by controlling output in the fishery. It was concluded that anti-trust programs already existed that could address excessive share consolidation (SAFMC, 1990).
NMFS is also developing excessive share guidelines in response to General Accounting Office recommendations (Oleson, 2002) that establish limits to consolidation that fishery management councils can use in setting caps on individual ITQ or IFQ shares (Anderson, 2005). Cap levels can be set to ensure that social objectives, to preserve fishing communities or to ensure the existence of small, family-owned, fishing businesses as in the Alaskan halibut/sablefish fishery, are met that may not allow production levels at MEY, but increase economic efficiency in the fishery; i.e., a second-best economic solution.
Fairness and Equity
The establishment of social goals and objectives are generally related to concepts of fairness and equity contained in National Standard 4 of the MSFCMA. Although not clearly defined in the MSFCMA, these concepts of fairness and equity could also be tied
316 – CHAPTER 10 – UNITED STATES
USING MARKET MECHANISMS TO MANAGE FISHERIES: SMOOTHING THE PATH – ISBN-92-64-03657-1 © OECD 2006
to Pareto efficiency criteria, which allow a change in the status quo only if one person is made better off and no one is made worse off.
It could be argued that initial quota allocations would be fair and equitable to all fishermen if they received the same market share under IFQs that they had achieved in the race-for-fish, derby fishery. Those who wished to exit could sell or lease their shares to those who wished to remain in the fishery. Assuming the proper institutions were in place to ensure that the social objectives are obtained (allowing new entrants, preserving fishery dependent communities, etc.) and that transaction costs of trading shares are minimized, then a relatively efficient market price would be generated for each IFQ share.
This initial allocation assumes that the implicit property right for the in situ resource belongs to the fisherman in the regulated open access fishery before the IFQ program is adopted. An alternative perspective is that the ownership of the fishery resource belongs to the state, or the entire population of the country (Bromley, 2004). These owners deserve to be compensated for the reallocation of the fishery resource to the harvesting sector.
Alternative methods for extracting compensation from fishers have been considered including landing taxes or royalties, and auctions to enter the fishery for different periods of time. Each of these methods have their own strengths and weaknesses for setting price, tax, royalty levels, dealing with social objectives, or providing for efficient market institutions as have IFQs. Taxes, for example, need to be calculated by the management authority for each time period based on the resource rent which changes with abundance levels, operating costs, and revenues. According to Clark (1980) taxes and allocated transferable catch quotas are theoretically equivalent to one another in terms of economic efficiency, and both are capable in principle of optimizing exploitation of the common property fishery. If done accurately, the outcome of a tax for fish stock conservation would be equivalent to that obtained in an efficient market for IFQ shares or coupons.
As Coase so eloquently stated, the efficient outcome is the same regardless of what method is used or how the initial allocation is made. Whoever appropriates the implicit property right for the in situ resource determines who receives the benefits under each allocation scheme and who bears the costs. Under an auction system, the federal government receives the benefit derived from allocating the resource to the private sector. The fishers bear the cost by bidding in the auction system or by not being able to fish because their bid was not high enough. With an IFQ program, those who participate in the fishery receive the benefit of the program. Those who wish to exit the fishery are compensated by those who wish to remain.
Congress in its reauthorization of the MSFCMA placed restrictions on how fees and auctions could be conducted, effectively granting an implicit property right to fishers to retain the resource rents while specifically retaining government ownership of the in situ resource. That is, if the fishery management council decided to end the IFQ program through its amendment process, fishers would not have to be compensated for the lost value of their share and coupon holdings. However, resource rents would accrue to the initial holders of the IFQ shares rather than to the management authority.
Since economics does provide an answer based on efficiency criteria, the management authority needs to clearly identify who should benefit from the reallocation of fishery resources to the private sector.
CHAPTER 10 – UNITED STATES – 317
USING MARKET MECHANISMS TO MANAGE FISHERIES: SMOOTHING THE PATH – ISBN-92-64-03657-1 © OECD 2006
Windfall Profits
Once concern often cited by opponents to IFQ programs is the concern that windfall profits39 will accrue to those who initially receive the quota shares if they are allocated to existing participants based on some historical landings scheme. Proponents of IFQ programs counter by arguing that the existing tax system on capital gains and income already provide a mechanism to recapture the resource rent that rightly belongs to society or the nation. However, it is most likely that windfall profits do not occur simply because an ITQ program is initiated. Instead, it is the increase in fish stock abundance that occurs after the adoption of ITQ’s that results in a windfall to share holders in the fishery.
The MSFCMA of 1976 and its amendments have been interpreted to preclude the sale or lease of fishing privileges or rights to domestic fishermen presently exploiting common property fisheries in the coastal waters of the United States (U.S.) beyond the state territorial seas. Individual transferable quota (ITQ) programs that have been adopted in the U.S. have, as a result, allocated the fishing rights at no charge to the historical fishermen (Gauvin, Ward, and Burgess, 1993). As a result of subsequent trading in an ITQ market, the initially free ITQ market shares and poundage coupons became valuable. This increase in value resulted in concerns being raised by fishery managers that windfall profits were being generated in the fishery.
Amendment 3 to the Reef Fish Management Plan (SAFMC, 1990) states that the Council and NMFS reserve the right to recapture resource rents from the wreckfish fishery in the future and that the capital gains tax will capture a portion of these rents when ITQs are sold. Appendix A in draft Amendment 8 to the reef fish fishery (GMFMC, 1994) implies that the initial sale of ITQs in the marketplace allows the holder to receive a windfall in terms of captured resource rents.
In actual practice, however, this increase in ITQ value reflects a reallocation of resource rents from the quasi-fixed factor inputs of capital and labor to a relatively more fixed factor input; the ITQ instrument.40 As a result, the initial sale does not represent a windfall profit to the fisherman who was initially allocated the ITQ, at least in fully or overdeveloped common property fisheries.
Resource Rent and the Common Property Fishery
Resource rent is captured by the fixed factor input. In common property fisheries, the in situ resource is free to the fisherman except for a minor license or permit fee.41 The resource rent as a result accumulates in the value of the vessel and the labour used to harvest the resource.
In good years when stocks are abundant, for example, individuals wish to enter the fishery. The price of a vessel, whose supply is fixed in the short run, increases in the face of this increase in demand. The value of the vessel is constrained by the cost of a new vessel construction if entry into the fishery is not limited or controlled. That is, if the sale value of an existing vessel exceeds, the cost of constructing a new vessel, the individual
39 Windfall profits are by definition a one time increase in firm profitability created by a radical change in the marketplace. This could result from a significant, one time change in the abundance of a fish stock by the discovery of a new fishing grounds or by a decline in the price of a factor input due to technological change or an increase in supply that is beyond the control of the individual firm.
40 Henderson, J.M. and R.E. Quandt (1980). Microeconomic Theory. McGraw Hill.
41 The MSFCMA requires that these fees not exceed their administrative costs.
318 – CHAPTER 10 – UNITED STATES
USING MARKET MECHANISMS TO MANAGE FISHERIES: SMOOTHING THE PATH – ISBN-92-64-03657-1 © OECD 2006
wishing to enter the fishery will build the new vessel rather than purchasing an existing vessel. If multiple, independent fisheries exist, new entrants from the alternative fishery will expand the fleet, increase supply, and maintain or depress vessel price. Capital invested in the fishery will increase in any case and resource rents will be dissipated as predicted by the classic Gordon (1954) article.
When skilled labour is fixed in the short run, it will also capture a portion of the resource rents. Owners of vessels will provide a premium to skilled captains and crews to prevent them from investing in a new fishing craft and competing with their old employer. Skilled crews will demand and receive premiums in terms of their crew share arrangements. Again during years of abundant stocks, this premium will be tempered by entrants of new fishing entities who capture a portion of the stock as their skill levels improve.
In a common property fishery, resource rents already exist. They are dissipated amongst the excessive numbers of fishermen and fishing craft. That is, too many fishermen are harvesting too few fish. The rents are captured in the value of the craft and in the crew shares received by labor that fluctuate with the abundance of the fish stock.
Resource Rent and the ITQ Fishery
When ITQs are adopted to manage the fishery, they capture the resource rents. Since the total allowable catch (TAC) determines the maximum number of pounds of fish that can be harvested in the fishery, the ITQ based on TAC becomes the fixed factor input. After the initial allocation, fishermen must bid for ITQ to cover their harvest levels. The value of the ITQ in the competitive market represents the discounted present value of the net revenue the harvesting of the resource can generate where the returns to capital and crew are included in the total cost of operating in the fishery as well as the costs of foregone opportunities associated with harvesting other species of fish.
Some fishermen who participated in the common property fishery will realize that the lease or sale of their ITQ holdings will result in greater income than if they remained in the fishery. For example, if a fisherman received USD 10 000 a year for operating in a fishery prior to ITQ management and could lease his ITQ for USD 8 000 a year and enter another fishery where he could earn USD 4 000 a year, he would be USD 2 000 a year better off. As a result, craft and crews exit the ITQ managed fishery, and the resource rents that were captured by the excessive number of vessels and crews in the common property fishery have been reallocated or transferred to the value of the ITQ by the selling of shares in the competitive ITQ market.
Empirical evidence exists supporting these conclusions. Reef fish vessels sell with a USD 5 000 to USD 10 000 price premium in the southeast region of the U.S. if they hold a permit under the presently existing permit moratorium (Gauvin, Ward, and Burgess, 1993). Griffin and Oliver (1991) found that the adoption of turtle excluder devices would reduce resource rents captured by vessels and crews in the Gulf of Mexico shrimp fishery by USD 16.2 million.
More to the point, McCay and Creed (1994) found that crew shares declined and hours worked increased under the ITQ management regime in the Scotia-Fundy groundfish fishery. Since resource rents were being reallocated from the capitalized value of the vessel and from crew shares to the value of the ITQ market shares and poundage coupons, newly created windfall profits were not being generated by the initial free
CHAPTER 10 – UNITED STATES – 319
USING MARKET MECHANISMS TO MANAGE FISHERIES: SMOOTHING THE PATH – ISBN-92-64-03657-1 © OECD 2006
allocation of ITQs to program participants. That is, the value of one asset was being diminished as the value of a second, more-fixed asset was being increased.
Circumstances could exist where windfall profits can be generated for program participants by ITQ programs. If stocks have been depleted, the reductions in fishing effort associated with a successful ITQ program under restrictive TACs could lead to a resource recovery. Windfall profits could be generated for fishermen who hold ITQs if TAC levels are increased to reflect the increased abundance.
If ITQs are allocated as market shares, each ITQ holder will receive an increase in his poundage coupons as TAC increases. First, the increase in TAC causes the number of pounds available to be landed to increase causing ITQ prices to decline. Second, the increase in the level of harvest causes net revenue to increase, leading to an increase in ITQ demand causing ITQ prices to increase. If the end results of these two processes cause ITQ prices to remain the same or increase, then initial ITQ recipients can sell ITQ shares while they maintain their profit levels and reap a windfall from new entrants to the fishery as the stocks recover.
At least for fully or overdeveloped fisheries, the allocation of ITQs to fishery participants does not generate windfall profits when initial share holders sell out. Instead, the competitive market mechanism transfers dissipated rents that were captured in the capitalized value of vessels and in the crew share arrangements under the common property fishery to the value of the ITQ. That is, resource rents that were captured by quasi-fixed factors of production are now captured by the relatively more fixed factor of production; i.e. the ITQ.
While an auction for fishing privileges would capture the resource rents for the government or public, an allocation scheme actually allows losers under the new management regime to be compensated by the winners. With the allocation program, at least in an ideal world, the competitive market mechanism would compensate the loser (those who exit the fishery) efficiently and fairly. Given Congress’ preference stated in the MSFCMA, this would appear to be their desired approach.
7. Food for Thought
The domestic US experiences in transitioning to rational fisheries are, arguably, tales of struggles to protect a status quo of complex management that has many competing goals and objectives and is often unsafe, unprofitable, fails to conserve fisheries resources. Indeed, there are some common themes emerging:
� The catalyst for significant change seems to be crisis - Apparently as a result of a long history of open access, management has ingrained certain expectations into both fishers and managers about access to the fishery resource. Hence, micro-management of fisheries resources needs to become nonviable and expensive and stocks apparently need to become severely depressed before managers and fishermen can agree to consider alternative rational management.
� Potential gains are not incentive enough - The potential gains from rational fisheries management are substantial even if economics is treated as secondary to social objectives; e.g., safety at sea in the harvesting of fish is greatly improved if fishers can schedule their harvesting so as to avoid bad weather. Within the present management institution of regulated open access, economic efficiency could be substantially increased as required by the MSFCMA.
320 – CHAPTER 10 – UNITED STATES
USING MARKET MECHANISMS TO MANAGE FISHERIES: SMOOTHING THE PATH – ISBN-92-64-03657-1 © OECD 2006
� Change requires learning - Institutions are important for management. How management is done affects the outcome of the fisheries management program. Rational management is a proposed change in the management institution that has the potential to reduce the costs of operating in federally managed fisheries. It also has the potential to reduce secondary social costs if management goals and objectives are carefully stated. However, creating new management institutions changes the rules of behavior in a fishery and requires time to learn the new rules to ensure economic efficiency within the constraints of the management goals and objectives. In the case of rational management, leases should be the primary form of transferability until fishery participants understand the value of their new assets and can price permanent transfers according to social values generated in the marketplace for quota shares.
� Consolidation is comprehensible and manageable - Excessive consolidation of shares is a concern that needs to be addressed through the careful consideration of social goals and objectives. Unless the potential for market power exists in the harvesting sector of a fishery, rational management should result in an improvement in economic efficiency. However, the preservation of fishing dependent communities could be a social objective that a competitive market equilibrium would prevent from being achieved. With the existence of market power, consolidation of shares could result in losses in net benefits to society. Demand for fishery products needs to be considered to ensure that the consolidation that does occur is within the bounds of what is economically justifiable.
� Fairness and equity in allocation is achievable - Support of the commercial sector (and in some cases also recreational and non-consumptive user groups) is necessary for a successful rational management program. The fairness and equity of the initial allocation program is an important first step in the transition process. What is considered fair and equitable by the fishery participants probably reflects allocation programs that are not perceived to be arbitrary or artificial and are based on comprehensive data from fishery participants.
� Profits and privileges need to be understood - The existence of windfall profits in ITQ programs is questionable at best and needs further study before steps are taken to capture it for the use of the managing agency. Less questionable is the reallocation of income that comes with the initial allocation of access privileges to those who hold the privilege. If only to owners of the vessel, crews could lose skill premiums in their wages and processors could lose some of the resource rents they had been able to accumulate through their price negotiations with fishers.
� Fishermen hold the key to their future - Individual transferable quotas have been adopted in the U.S. for the wreckfish, halibut/sablefish, surf clam, and tuna purse seine fisheries and are being proposed for the red snapper fishery. A cooperative has been formed to manage Alaskan pollack. Despite the promise of this management paradigm, the future of fisheries remains in the hands of those who can expropriate the property right to the in situ resource. The ability of this implicit or explicit property right holder, whether that be a private individual or a government agency, to develop efficient markets that address the objectives of management will determine if fisheries improve or decline.
CHAPTER 10 – UNITED STATES – 321
USING MARKET MECHANISMS TO MANAGE FISHERIES: SMOOTHING THE PATH – ISBN-92-64-03657-1 © OECD 2006
Without the development of market mechanisms that allocate the resource efficiently even if only as a second best scenario, fisheries will continue to be plagued with problems and suffer the costs of foregoing the potential economic net benefits and associated economic impacts that rational management offers.
322 – CHAPTER 10 – UNITED STATES
USING MARKET MECHANISMS TO MANAGE FISHERIES: SMOOTHING THE PATH – ISBN-92-64-03657-1 © OECD 2006
Bibiliography
Andersen, Christopher M. (2004). "How Institutions Affect Outcomes in Laboratory Tradable Fishing Allowance Systems.” Agricultural and Resource Economics Review, 33(2):193-208.
Anderson, Lee G. (2005). “Guidance to Councils on the Factors to Consider When Determining an Excessive Share in IFQ Fisheries.” Draft report prepared for the National Marine Fisheries Service, Silver Spring, Maryland, January, 42 pp.
Barzel, Y. (1997). Economics of Property Rights. Cambridge University Press, Cambridge.
Berman, Matthew and Linda Leask (1994). “On the Eve of IFQs: Fishing for Alaska’s Halibut and Sablefish.” Alaska Review of Social and Economic Conditions, University of Alaska Anchorage, Institute of Social and Economic Research, Vol. XXIX, No. 2, November, 20 pp.
Bishop, Richard C. (1978). "Endangered Species and Uncertainty: The Economics of the Safe Minimum Standard." American Journal of Agricultural Economics, 60(1):10-18.
Bromley, Daniel W. (2004). "Purging the Frontier From Our Mind: Crafting A New Fisheries Policy." Paper presented at “Fishing Rights or Fishing Wrongs?” University of Washington, April 29-30, 29 pp.
Buchanan, James M. (1980). "Rent Seeking and Profit Seeking." Chapter 1 in Toward a Theory of the Rent Seeking Society, College Station, Texas A&M University.
Cabot, Courtenay Bromfield (1996). “Shrimp and Sea Turtles in the Gulf of Mexico: An Economic Analysis of the Effects of Turtle Excluder Devices on the Shrimp Fishery and the Benefits of Protecting Sea Turtles.” Senior Honors Thesis, Northwestern University, May, 50 pp.
Cato, James C., Fred J. Prochaska, and Peter C.H. Pritchard (1978). An Analysis of the Capture, Marketing and Utilization of Marine Turtles. Final Report, Purchase Order No. 01-7-042-11283, Environmental Assessment Division, National Marine Fisheries Service, St. Petersburg, Florida.
Clark, Colin W. (1973). "The Economics of Overexploitation." Science, 181:630-633.
Clark, Colin W. (1973). "Profit Maximization and the Extinction of Animal Species." J. Polit. Econ., 81:950-961.
Clark, Colin W. (1980). "Towards a Predictive Model for the Economic Regulation of Commercial Fisheries." Can. J. Fish. Aquat. Sci., 37:1111-1129.
Coase, R.H. (1960). "The Problem of Social Cost." The Journal of Law and Economics, 3:1-44.
CHAPTER 10 – UNITED STATES – 323
USING MARKET MECHANISMS TO MANAGE FISHERIES: SMOOTHING THE PATH – ISBN-92-64-03657-1 © OECD 2006
Day, Susan Virginia (1988). "Estimating the Non-Consumptive Use Value of Whale Watching: An Application of the Travel Cost and Contingent Valuation Techniques." Chapters 3, 4, 6, Appendix A, and the Bibliography of a Masters Thesis, Department of Natural Resource Economics, University of Rhode Island, Kingston, Rhode Island.
Gauvin, John R., John M. Ward, and Edward E. Burgess (1994). "Description and Evaluation of the Wreckfish (Polyprion Americanus) Fishery Under Individual Transferable Quotas." Marine Resource Economics, 9(2):99-118.
Gordon, H. Scott (1954). "The Economic Theory of a Common-Property Resource: The Fishery." Journal of Political Economy, 62:124-42.
Griffin, W.L. and Chris Oliver (1991). "Evaluation of the Economic Impacts of Turtle Excluder Devices (TEDs) on the Shrimp Production Sector in the Gulf of Mexico." Draft report, MARFIN Project NO. NA-87-WC-H-06139. Agricultural Economics Dept., Texas A&M University, College Station, TX 77843-2124.
GMFMC, 1994 Draft Amendment 8
Gulf of Mexico Fishery Management Council (1996). “Draft Amendment Number 9 to Fishery Management Plan for the Shrimp Fishery of the Gulf of Mexico, U.S. Waters With Supplemental Environmental Impact Statement, Regulatory Impact Review, Initial Regulatory Flexibility Analysis, and Social Impact Assessment.” Lincoln Center, Suite 331, 5401 West Kennedy Boulevard, Tampa, Florida, September, 145 pp.
Hartley, M. and M. Fina (2001). “Allocation of Individual Vessel Quota in the Alaskan Pacific Halibut and Sablefish Fisheries.” In Ross Shotton (ed.) (2001). “Case Studies on the Allocation of Transferable Quota Rights in Fisheries.” FAO Fisheries Technical Paper 411 - 412, Fishery Resources Officer, Marine Resources Service, Fishery Resources Division, FAO Fisheries Department, Rome, FAO, 373 pp.
Hoagland, Porter, Di Jin, Patricia Lee, Christopher Croft, Lyn Davidson, and Sarah Wallis (1996). “Market-Based Incentives to Reduce Fisheries Bycatch.” NOAA Contract No. 50-DGNF-5-00172, National Marine Fisheries Service, Silver Spring, MD, February, 120 pp.
International Pacific Halibut Commission (1987). “The Pacific Halibut: Biology, Fishery, and Management.” Seattle, Washington.
Kirkley, James, John Ward, John Walden, and Eric Thunberg (2002). “The Estimated Vessel Buyback Program Costs to Eliminate Overcapacity in Five Federally Managed Fisheries.” Final Contract report to the National Marine Fisheries Service, Silver Spring, Maryland. Virginia Institute of Marine Science, College of William and Mary, Gloucester, Virginia, June, 10 pp.
Knapp, Gunnar (1996). “Alaska Halibut Captains’ Attitudes Towards IFQs.” Marine Resource Economics, 11(1):43-55.
Loomis, John B. and Douglas M. Larson (1994). "Total Economic Values of Increasing Gray Whale Populations: Results from a Contingent Valuation Survey of Visitors and Households." Marine Resource Economics, 9(3):275-286.
McCay, Bonnie J., and Carolyn F. Creed (1994). "Individual Transferable Quotas in Clams and Fish: A Comparative Analysis." C.M. 1994/T:20, Theme Session on Improving the Link Between Fisheries Science and Management: Biological, Social,
324 – CHAPTER 10 – UNITED STATES
USING MARKET MECHANISMS TO MANAGE FISHERIES: SMOOTHING THE PATH – ISBN-92-64-03657-1 © OECD 2006
and Economic Considerations, International Council for the Exploration of the Sea, 82nd Statutory Meeting, St. John’s, Newfoundland, Canada, September, 9 pp.
McCay, Bonnie J. and Svein Jentoft (1998). "Market or Community Failure? Critical Perspectives on Common Property Research." Human Organization, 57(1): 21-29.
Macinko, Seth and Daniel W. Bromley (2001). "Through the Looking Glass: Marine Fisheries Policy for the Future." Final report to the Pew Charitable Trusts, September, 40 pp.
Matulich, Scott C., Ron C. Mittelhammer, and Carlos Reberte (1996). "Towards a More Complete Model of Individual Transferable Fishing Quotas: Implications of Incorporating the Processing Sector." Journal of Environmental Economics and Management, 31:112-128.
National Marine Fisheries Service (1994). "The IFQ Programme, Insights and Updates." Restricted Access Management Division, February.
National Marine Fisheries Service (2000). "Fisheries of the United States, 1991." Current Fishery Statistics No. 9900, U.S. Department of Commerce, National Oceanic and Atmospheric Administration, October, 126 pp.
National Research Council (1999). The Community Development Quota Program in Alaska. National Academy Press, Washington, D.C.
Northwest Pacific Fisheries Management Council (1992). “True North.” October.
Oleson, Keith W. (2002). “Individual Fishing Quotas; Better Information Could Improve Program Management.” GAO-03-159, Report to the Chairman and Ranking Minority Member, Subcommittee on Oceans, Atmosphere, and Fisheries, Committee on Commerce, Science, and Transportation, U.S. Senate, United States General Accounting Office, December, 49 pp.
Pautzke, C.G. and Chris W. Oliver (1997). “Development of the Individual Fishing Quota Programme for Sablefish and Halibut Longline Fisheries off Alaska.” North Pacific Fishery Management Council.
Richardson, Edward J. (1994). "Wreckfish Economic and Resource Information Collection with Analysis for Management." E.J. Richardson Associates, Economic and Market Research for the Fishing, Aquaculture, and Natural Resource Industries, P.O. Box 236, Sandown, New Hampshire, March, 84 pp.
Scott, Tara (2004). “An Economic Assessment of Reducing Incidental Capture of Sea Turtles in the Northwest Atlantic Pelagic Longline Fishery.”A Thesis Presented to the Faculty of the School of Marine Science, The College of William and Mary, Gloucester, Virginia, 83 pp.
Sedberry, G.R., G.F. Ulrich, and A.J. Applegate (1993). “Development and Status of the Fishery for Wreckfish (Polyprion americannus) in the southeastern United States.” Proceedings of the Gulf and Caribbean Fisheries Institute, 58:118-129.
South Atlantic Fishery Management Council (1990). "Wreckfish." Amendment Number 3, Regulatory Impact Review, Initial Regulatory Flexibility Analysis and Environmental Assessment for the Fishery Management Plan for the Snapper Grouper Fishery of the South Atlantic Region, 1 Southpark Circle, Suite 306, Charleston, South Carolina 29407-4699, August, 34 pp.
CHAPTER 10 – UNITED STATES – 325
USING MARKET MECHANISMS TO MANAGE FISHERIES: SMOOTHING THE PATH – ISBN-92-64-03657-1 © OECD 2006
South Atlantic Fishery Management Council (1991). "Final Amendment 5 (Wreckfish), Regulatory Impact Review, Initial Regulatory Flexibility Determination, and Environmental Assessment for the Fishery Management Plan for the Snapper-Grouper Fishery of the South Atlantic Region." 1 Southpark Circle, Suite 306, Charleston, South Carolina 29407-4699, September, 89 pp.
Sissenwine, Michael (1992). "Analysis of the Potential Economic Benefits from Rebuilding U.S. Fisheries." Draft Report, Office of the Senior Scientist for Fisheries, NMFS, USDOC, Silver Spring, Maryland, April.
Ward, John M. (1994). "The Bioeconomic Implications of A Bycatch Reduction Device as a Stock Conservation Management Measure." Marine Resource Economics, 9(3):227-240.
Ward, John M. and Walter R. Keithly, Jr. (1999). “Determining the Impacts of Adopting Property Rights as a Fisheries Management Tool in Regulated Open Access Fisheries.” FAO Fish Rights 99 Conference, 14-17 November, Fremantle, Australia.
Ward, John M. and Seth Macinko (1996). "Static and Dynamic Implications of a Gear Modification Designed to Reduce Bycatch in a Stylized Fishery.” The Southern Business and Economic Journal, 19(4):273-292.
Ward, John M. and Rebecca Metzner (editors) (2002). “Expert Consultation on Catalyzing the Transition Away from Overcapacity in Marine Capture Fisheries.” FAO Fisheries Report No. 691, FIPP/R691,ization, Food and Agriculture Organization of the United Nations, Rome, Italy, October 15-18, 94 pp.
Ward, John M. and James M. Nance (1994). "1994 Update to the Stock Assessment and Fishery Evaluation (SAFE) Report for the Gulf of Mexico Shrimp Fishery." National Marine Fisheries Service, Southeast Regional Office, 9721 Executive Drive, North, St. Petersburg, FL.
Ward, John M., Eric Thunberg, and Pamela Mace (2005). “A Guide to Fish Harvesting Capacity and Its Relationship to Excess Capacity and Overcapacity.“ In press, Marine Resource Economics.
Ward, John, Charles Adams, Wade Griffin, Richard Woodward, Mike Haby, James Kirkley, and Walter Keithly (2004). “Shrimp Business Options, Proposals to Develop a Sustainable Shrimp Fishery in the Gulf of Mexico and South Atlantic.” Draft Report Developed by the National Marine Fisheries Service for the Gulf of Mexico and South Atlantic Shrimp Harvesters, Office of Constituent Services, National Marine Fisheries Service, Silver Spring, Maryland, August 19.
Whitehead, John C. (1992). “Ex Ante Willingness to Pay with Supply and Demand Uncertainty: Implications for Valuing a Sea Turtle Protection Programme.” Applied Economics, 24:981-988.

������������� ������������������������������ ��������
���������!����
"�#��$$ �$�����%� ���&�� '�$# �����(��)*���$�&��$$
999.fm Page 1 Wednesday, March 8, 2006 8:48 AM
US
ING
MA
RK
ET
ME
CH
AN
ISM
S T
O M
AN
AG
E F
ISH
ER
IES
Sm
oo
thin
g th
e P
ath
«Using Market Mechanisms to Manage FisheriesSMOOTHING THE PATH
ING
www.oecd.org
ISBN 92-64-03657-1 53 2006 01 1 P
Using Market Mechanisms to Manage FisheriesSMOOTHING THE PATH
Why aren’t market mechanisms more widely used to manage fisheries in OECD countries? Despite the demonstrated benefits from instruments such as transferable access rights and individual transferable quotas, there remains some resistance to their further use in many OECD countries. Such resistance stems largely from a lack of information about the potential benefits and costs of introducing market mechanisms. There is also uncertainty about the available strategies for overcoming technical, institutional and political issues in the design and implementation of market mechanisms.
The purpose of this study is to help demystify the concept of market-like instruments and to help policy makers make better use of market-like instruments in fisheries management. The findings of the study are based on a survey of the use of market-like instruments in OECD fisheries in which the key characteristics of these instruments in different countries are identified. A key outcome of the survey is the recognition that a range of market-like instruments are, in fact, widely used in managing fisheries in OECD countries. This has generally improved the economic efficiency of the sector, and helped to ensure the sustainability of fish stocks.
One of the key benefits to policy makers from this study is the identification of practical steps that can be taken to address the range of challenging obstacles to the further use of market-like instruments. This will help policy makers in identifying strategies that may help smooth the path towards the wider use of market mechanisms in fisheries management in the OECD.
-:HSTCQE=UX[Z\Y:
The full text of this book is available on line via this link:
http://www.sourceoecd.org/agriculture/9264036571
Those with access to all OECD books on line should use this link:
http://www.sourceoecd.org/9264036571
SourceOECD is the OECD’s online library of books, periodicals and statistical databases. For more information about this award-winning service and free trials ask your librarian, or write to us at [email protected].