Embed Size (px)
Citation preview
Using Maimonides' Rule to Estimate the Effect of Class Size on Scholastic AchievementAuthor(s): Joshua D. Angrist and Victor LavySource: The Quarterly Journal of Economics, Vol. 114, No. 2 (May, 1999), pp. 533-575Published by: The MIT PressStable URL: http://www.jstor.org/stable/2587016Accessed: 12/11/2008 19:58
Your use of the JSTOR archive indicates your acceptance of JSTOR's Terms and Conditions of Use, available athttp://www.jstor.org/page/info/about/policies/terms.jsp. JSTOR's Terms and Conditions of Use provides, in part, that unlessyou have obtained prior permission, you may not download an entire issue of a journal or multiple copies of articles, and youmay use content in the JSTOR archive only for your personal, non-commercial use.
Please contact the publisher regarding any further use of this work. Publisher contact information may be obtained athttp://www.jstor.org/action/showPublisher?publisherCode=mitpress.
Each copy of any part of a JSTOR transmission must contain the same copyright notice that appears on the screen or printedpage of such transmission.
JSTOR is a not-for-profit organization founded in 1995 to build trusted digital archives for scholarship. We work with thescholarly community to preserve their work and the materials they rely upon, and to build a common research platform thatpromotes the discovery and use of these resources. For more information about JSTOR, please contact [email protected].
The MIT Press is collaborating with JSTOR to digitize, preserve and extend access to The Quarterly Journal ofEconomics.
http://www.jstor.org


534 QUARTERLY JOURNAL OF ECONOMICS
between class size and achievement is inconclusive. In widely cited meta-analyses of class-size research, Glass and Smith [19791 and Glass, Cahen, Smith, and Filby [19821 conclude that smaller classes raise children's test scores. Card and Krueger [1992a, 1992b] also found that lower pupil-teacher ratios in school are associated with higher adult earnings, while randomized trials in Tennessee and Ontario provide evidence for beneficial effects of randomly assigned reductions in class size [Finn and Achilles 1990; Wright, Shapson, Eason, and Fitzgerald 19771. But results from the Glass et al. meta-analyses have been questioned [Slavin 19891, and Hanushek's [1986, 19961 surveys of research on the effects of school inputs, including pupil-teacher ratios, report a range of findings. Recently, Card and Krueger's studies of the school quality/earnings link have also been challenged [Heckman, Layne-Farrar, and Todd 19951.
Although recent years have seen renewed interest in the class-size question, academic interest in this topic is not only a modern phenomenon; the choice of class size has been of concern to scholars and teachers for hundreds of years. One of the earliest references on this topic is the Babylonian Talmud, completed around the beginning of the sixth century, which discusses rules for the determination of class size and pupil-teacher ratios in bible study. The great twelfth century Rabbinic scholar, Maimonides, interprets the Talmud's discussion of class size as follows: "Twenty- five children may be put in charge of one teacher. If the number in the class exceeds twenty-five but is not more than forty, he should have an assistant to help with the instruction. If there are more than forty, two teachers must be appointed" [Hyamson 1937, p. 58b].1 Interestingly, while Maimonides' maximum of 40 students was partly derived by interpreting the Talmud, this rule leads to smaller classes than the Talmudic rule, which allows a maximum size of 49.2
1. This is from ChapterII of "Laws Concerning the Study of Torah" in Book I of Maimonides' Mishneh Torah. The same chapter discusses compulsory school attendance (at public expense from the age of six or seven for boys), the penalty for nonenforcement of compulsory attendance laws (excommunication of the entire town), hours of instruction (long), holidays (few), use of corporal punishment (limited), qualifications for teaching positions (strict), competition between schools for students (permitted, desirable), and busing school students between towns to schools of higher quality (permitted only if the towns are not separated by a river).
2. The Talmudic portion that Maimonides relied on is: "The number of pupils assigned to each teacher is twenty-five. If there are fifty, we appoint two teachers. If there are forty, we appoint an assistant, at the expense of the town" (quote from Chapter II, page 21:a of the Baba Bathra; English translation on page 214 of Epstein [1976]).
USING MAIMONIDES' RULE 535
The importance of Maimonides' rule for our purposes is that, since 1969, it has been used to determine the division of enroll- ment cohorts into classes in Israeli public schools. The maximum of 40 is well-known to school teachers and principals, and it is circulated annually in a set of standing orders from the Director General of the Education Ministry.3 As we show below, this rule generates a potentially exogenous source of variation in class size that can be used to estimate the effects of class size on the scholastic achievement of Israeli pupils. To see how this variation comes about, note that according to Maimonides' rule, class size increases one-for-one with enrollment until 40 pupils are enrolled, but when 41 students are enrolled, there will be a sharp drop in class size, to an average of 20.5 pupils. Similarly, when 80 pupils are enrolled, the average class size will again be 40, but when 81 pupils are enrolled the average class size drops to 27.
Maimonides' rule is not the only source of variation in Israeli class sizes, and average class size is generally smaller than what would be predicted by a strict application of this rule. But Israeli classes are large by United States standards, and the ceiling of 40 students per class is a real constraint faced by many school principals. The median class size in our data is 31 pupils, with 25 percent of classes having more than 35 pupils and 10 percent having more than 38 pupils. A regression of actual class size at midyear on predicted class-size using beginning-of-the-year enroll- ment data and Maimonides' rule explains about half the variation in class size in each grade (in a population of about 2000 classes per grade).4
In this paper we use the class-size function induced by Maimonides' rule to construct instrumental variables estimates of class-size effects. Although the class-size function and the instru- ments derived from it are themselves a function of the size of enrollment cohorts, these functions are nonlinear and nonmono- tonic. We can therefore control for a wide range of smooth enrollment effects when using the rule as an instrument. The
3. The original policy was laid out in a 1966 memo making the maximum of 40 effective as of the 1969 school year [Israel Ministry of Education 1966]. Mai- monides' discussion of class-size ceilings was noted in the press release announc- ing the legislation proposing a 30-pupil maximum [Israel Ministry of Education 1994]. The pre-1969 elementary school maximum was 50 or 55, depending on grade [Israel Ministry of Education 1959].
4. A bivariate regression of class size on the mathematical expression of Maimonides' rule has an R2 of .49 in the 1991 population of 2018 fifth grade classes. The corresponding R2 for 2049 fourth grade classes is .55, and the correspondingR2 for 2049 third grade classes is .53.
536 QUARTERLY JOURNAL OF ECONOMICS
resulting evidence for a causal impact of class size on test scores is strengthened by the fact that even when controlling for other enrollment effects, the up-and-down pattern in the class size/ enrollment size relationship induced by Maimonides' rule matches a similar pattern in test scores. Since it seems unlikely that enrollment effects other than those working through class size would generate such a pattern, Maimonides' rule provides an unusually credible source of exogenous variation for class-size research. This sort of identification argument has a long history in social science and can be viewed as an application of Campbell's [1969] regression-discontinuity design for evaluation research to the class size question.5
The paper is organized as follows. Following a description of Israeli test score data in Section I, Section II presents a simple graphical analysis. Section III describes the statistical model that is used for inference and briefly outlines the connection with Campbell [1969]. Section IV reports the main estimation results, and Section V interprets some of the findings. Section VI con- cludes. The results suggest that reductions in class size induce a significant and substantial increase in math and reading achieve- ment for fifth graders, and a modest increase in reading achieve- ment for fourth graders. On the other hand, there is little evidence of an association between class size and achievement of any kind for third graders, although this may be because the third grade testing program was compromised.
I. DATA AND DESCRIPTIVE STATISTICS
The test score data used in this study come from a short-lived national testing program in Israeli elementary schools. In June of 1991, near the end of the school year, all fourth and fifth graders were given achievement tests designed to measure mathematics and (Hebrew) reading skills. The tests are described, and the results summarized in a pamphlet from the National Center for Education Feedback [1991]. The scores used here consist of a composite constructed from some of the basic and all of the more advanced questions in the test, divided by the number of ques- tions in the composite score, so that the score is scaled from 1-100.
5. A recent application of regression-discontinuity ideas in economics is van der Klauww [1996]. Other related papers are Akerhielm [1995], which uses enrollment as an instrument for class size, and Hoxby [1996], which uses population to construct instruments for class size.
USING MAIMONIDES' RULE 537
This composite is commonly used in Israeli discussions of the test results.6 As part of the same program, similar tests were given to third graders in June 1992. The June 1992 tests are described in another pamphlet [National Center for Education Feedback 1993].7 The achievement tests generated considerable public controversy because of lower scores than anticipated, especially in 1991, and because of large regional difference in outcomes. After 1992, the national testing program was abandoned.
Our analysis began by linking average math and reading scores for each class with data on school characteristics and class size from other sources. The details of this link are described in the Data Appendix. Briefly, the linked data sets contain informa- tion on the population of schools covered by the Central Bureau of Statistics [1991, 19931 Censuses of Schools. These are annual reports on all educational institutions at the beginning of the school year (in September), based on reports from school authori- ties to the Israel Ministry of Education and supplemented by Central Bureau of Statistics data collection as needed. Informa- tion on beginning-of-the-year enrollment was taken directly from the computerized files underlying these reports, and the classes in the schools covered by the reports define our study population. The data on class size are from an administrative source, and were collected between March and June of the school year that began in the previous September.
The unit of observation in the linked data sets and for our statistical analysis is the class. Although micro data on students are available for third graders in 1992, for comparability with the 1991 data, we aggregated the 1992 micro data up to the class level. The linked class-level data sets include information on average test scores in each class, the spring class size, beginning- of-the-year enrollment in the school for each grade, a town
6. In 1990 the Israel Ministry of Education created a testing center headed by the chief scientist in the ministry to develop and run a cognitive testing program in primary schools. The resulting curriculum-based exams were pretested in the fall of 1990. The math tests included computational, geometry, and problem-solving questions. The reading tests included questions evaluating grammar skills and reading comprehension. The fourth grade tests included 45 math questions and 57 reading questions. The fifth grade tests included 48 math questions and 60 reading questions. Among these, fifteen questions are considered basic for the purposes of the score composite, and the remainder more advanced.
7. The 1992 exams included 40 math questions, of which 20 were considered basic. The math composite score includes ten of the basic questions plus twenty of the more advanced questions. The reading exams included 44 questions, of which 20 were considered basic. The reading composite includes ten of the basic reading questions plus all of the more advanced questions.
538 QUARTERLY JOURNAL OF ECONOMICS
identifier, and a school-level index of students' socioeconomic status that we call percent disadvantaged (PD).8 Also included are variables identifying the ethnic character (Jewish/Arab) and religious affiliation (religious/secular) of schools.
Except for higher education, schools in Israel are segregated along ethnic (Jewish/Arab) lines. Within the Jewish public school system, there are also separate administrative divisions and curricula for secular and religious schools. This study is limited to pupils in the Jewish public school system, including both secular and religious schools. These groups account for the vast majority of school children in Israel. We exclude students in Arab schools because they were not given reading tests in 1991 and because no PD index was computed or published for Arab schools until 1994. The PD index is a key control variable in our analysis because it is correlated with both enrollment size and test scores. Also ex- cluded are students in independent religious schools, which are associated with ultra-orthodox Jewish groups and have a curricu- lum that differs considerably from that in public schools.
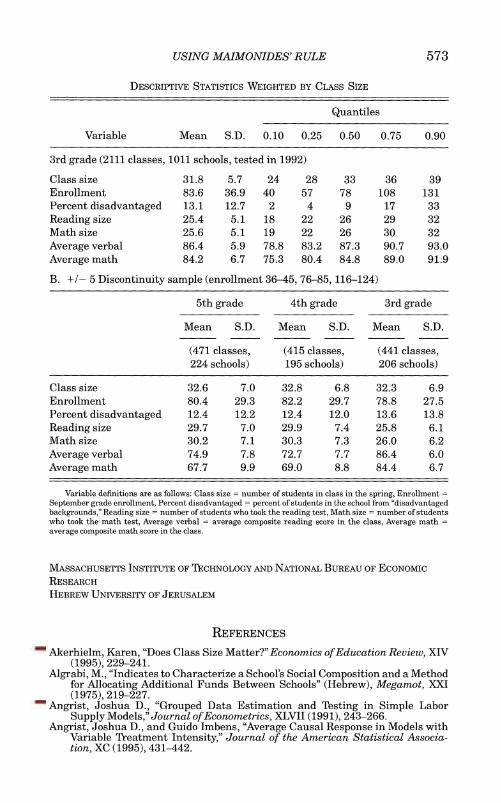
The average elementary school class in our data has about 30 pupils, and there are about 78 pupils per grade. This can be seen in Panel A of Table I, which reports descriptive statistics, includ- ing quantiles, for the population of over 2000 classes in Jewish public schools in each grade (about 62,000 pupils). Ten percent of classes have more than 37 pupils, and 10 percent have fewer than 22 pupils. The distribution of test scores, also shown in the table, refers to the distribution of average scores in each class. Per-pupil statistics, i.e., class statistics weighted by class size, are reported in Appendix 1. The average score distributions for fourth and fifth grade classes are similar, but mean scores are markedly higher, and the standard deviations of scores lower for third graders. We believe the difference across grades is generated by a systematic test preparation effort on the part of teachers and school officials in 1992, in light of the political fallout resulting from what were felt to be were disappointing test results in 1991.
8. The PD index is discussed byAlgrabi [1975], and is used by the Ministry of Education to allocate supplementary hours of instruction and other school resources. It is a function of pupils' fathers' education and continent of birth, and family size. The index is recorded as the fraction of students in the school who come from what is defined (using index characteristics) to be a disadvantaged back- ground.

USING MAIMONIDES' RULE 539
TABLE I UNWEIGHTED DESCRIPTIVE STATISTICS
Quantiles
Variable Mean S.D. 0.10 0.25 0.50 0.75 0.90
A. Full sample 5th grade (2019 classes, 1002 schools, tested in 1991)
Class size 29.9 6.5 21 26 31 35 38 Enrollment 77.7 38.8 31 50 72 100 128 Percent disadvantaged 14.1 13.5 2 4 10 20 35 Reading size 27.3 6.6 19 23 28 32 36 Math size 27.7 6.6 19 23 28 33 36 Average verbal 74.4 7.7 64.2 69.9 75.4 79.8 83.3 Average math 67.3 9.6 54.8 61.1 67.8 74.1 79.4
4th grade (2049 classes, 1013 schools, tested in 1991)
Class size 30.3 6.3 22 26 31 35 38 Enrollment 78.3 37.7 30 51 74 101 127 Percent disadvantaged 13.8 13.4 2 4 9 19 35 Reading size 27.7 6.5 19 24 28 32 36 Math size 28.1 6.5 19 24 29 33 36 Average verbal 72.5 8.0 62.1 67.7 73.3 78.2 82.0 Average math 68.9 8.8 57.5 63.6 69.3 75.0 79.4
3rd grade (2111 classes, 1011 schools, tested in 1992)
Class size 30.5 6.2 22 26 31 35 38 Enrollment 79.6 37.3 34 52 74 104 129 Percent disadvantaged 13.8 13.4 2 4 9 19 35 Reading size 24.5 5.4 17 21 25 29 31 Math size 24.7 5.4 18 21 25 29 31 Average verbal 86.3 6.1 78.4 83.0 87.2 90.7 93.1 Average math 84.1 6.8 75.0 80.2 84.7 89.0 91.9
B. +/- 5 Discontinuity sample (enrollment 36-45, 76-85, 116-124)
5th grade 4th grade 3rd grade
Mean S.D. Mean S.D. Mean S.D.
(471 classes, (415 classes, (441 classes, 224 schools) 195 schools 206 schools)
Class size 30.8 7.4 31.1 7.2 30.6 7.4 Enrollment 76.4 29.5 78.5 30.0 75.7 28.2 Percent disadvantaged 13.6 13.2 12.9 12.3 14.5 14.6 Reading size 28.1 7.3 28.3 7.7 24.6 6.2 Math size 28.5 7.4 28.7 7.7 24.8 6.3 Average verbal 74.5 8.2 72.5 7.8 86.2 6.3 Average math 67.0 10.2 68.7 9.1 84.2 7.0
Variable definitions are as follows: Class size = number of students in class in the spring, Enrollment = September grade enrollment, Percent disadvantaged = percent of students in the school from "disadvantaged backgrounds," Reading size = number of students who took the reading test, Math size = number of students who took the math test, Average verbal = average composite reading score in the class, Average math = average composite math score in the class.
USING MAIMONIDES' RULE 541
a. Fifth Grade
15 / | ___ ~~Maimonides Rule| 15 g Actual class size
10
5 -
0 20 40 60 80 100 120 140 160 180 200 220
Enrollment count
b. Fourth Grade
40 //~~~~~~~~~~~~~~~~~~~- /t- - - - - - - - - - - - -
3 --------------- ~ ~ ~ ~ ~ ~ ~ ~~ ~
c) 25
15 / |__Maimonides Rule| / | ~~~~~Actual class size|
10
5 l
0 20 40 60 80 100 120 140 160 180 200 220
Enrollment count
FIGURE I Class Size in 1991 by Initial Enrollment Count, Actual Average Size and as
Predicted by Maimonides' Rule
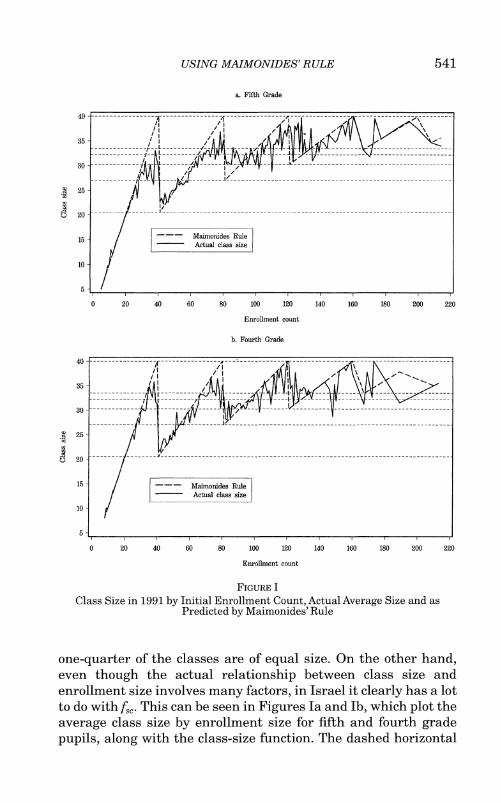
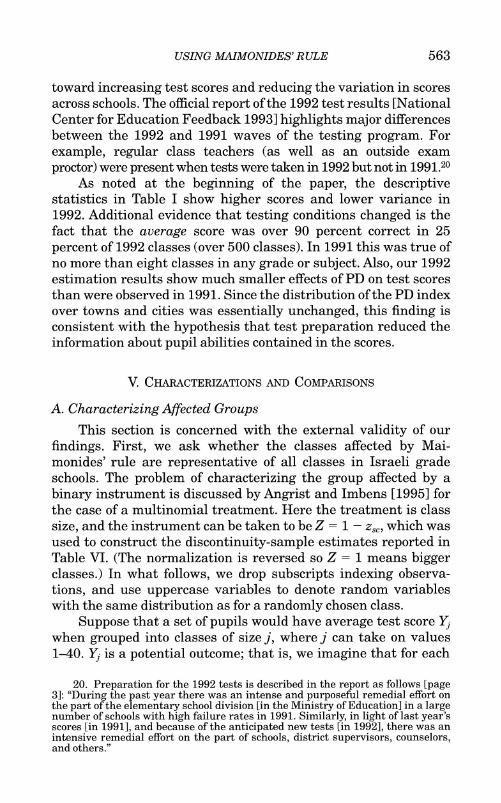
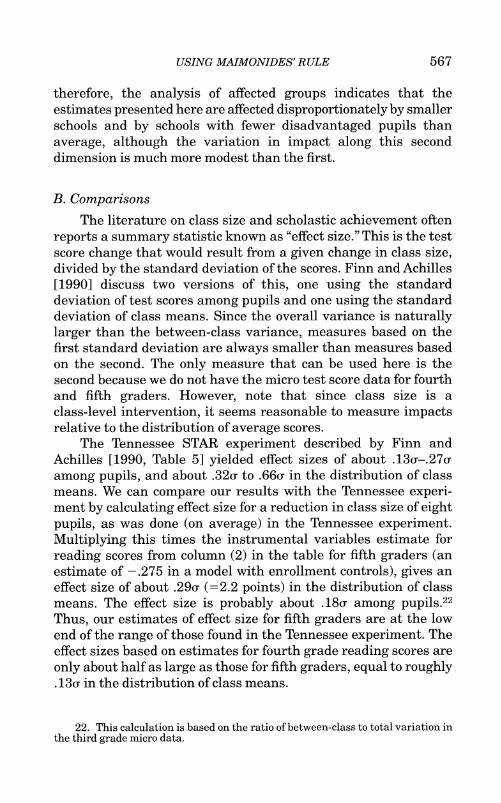
one-quarter of the classes are of equal size. On the other hand, even though the actual relationship between class size and enrollment size involves many factors, in Israel it clearly has a lot to do with fsc. This can be seen in Figures Ia and Ib, which plot the average class size by enrollment size for fifth and fourth grade pupils, along with the class-size function. The dashed horizontal

542 QUARTERLY JOURNAL OF ECONOMICS
lines in the figures mark the class sizes where the class-size function has corners. The figures show that at enrollment levels that are not integer multiples of 40, class size increases approxi- mately linearly with enrollment size. But average class size drops sharply at integer multiples of 40, i.e., at the corners of the class size function.
The figures show that average class size never reaches 40 when enrollment is less than 120, even though the class size function predicts a class size of 40 when enrollment is either 40, 80, 120, etc. This is because schools can sometimes afford to add extra classes before reaching the maximum class size. For ex- ample, schools may receive funds to support more classes if they have a high PD index [Lavy 1995]. These funds represent a deliberate attempt to offset the effects of socioeconomic back- ground, and can also be used to add hours of instruction and teachers to those schools where the PD index is high. On the other hand, manipulation of class size by parents is limited by the fact that Israeli pupils must attend a neighborhood school. Overflow classes caused by large enrollments and Maimonides' rule are conducted in school libraries and other temporary classrooms if need be.10 Of course, parents can circumvent Maimonides' rule by moving to another school district. Unlike in the United States, however, very few Israeli children attend private schools.
It is also noteworthy that average class sizes do not drop as much at the corners of the class size function as f& predicts. This is because the beginning-of-the-year enrollment data are not neces- sarily the same as enrollment at the time the class-size data were collected (for example, if enrollment has fallen, then an initially large cohort will not necessarily have been split) and because a few classes are reported to include more than 40 pupils.11 In spite of this reduction in predictive power for midyear class size, it seems more attractive to predict class size using beginning-of-the- year measures of enrollment since early measures are less likely than contemporaneous measures to have been affected by the behavior of parents or school officials.
10. Exceptions can be made in response to written requests, but pupils are generally required to attend school in their "local registration area," which typically includes only one religious and one secular school. Moreover, "Principals may not refuse to register a pupil in their school's registration area and may not register a pupil who does not live in the area" [Israel Ministry of Education 1980, Part B6a].
11. The empirical analysis is restricted to schools with at least 5 pupils reported enrolled in the relevant grade and to classes with less than 45 pupils.


544 QUARTERLY JOURNAL OF ECONOMICS
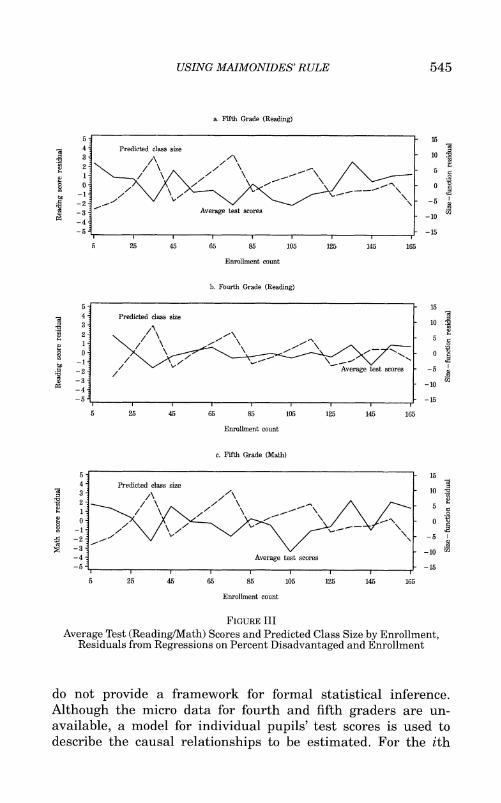
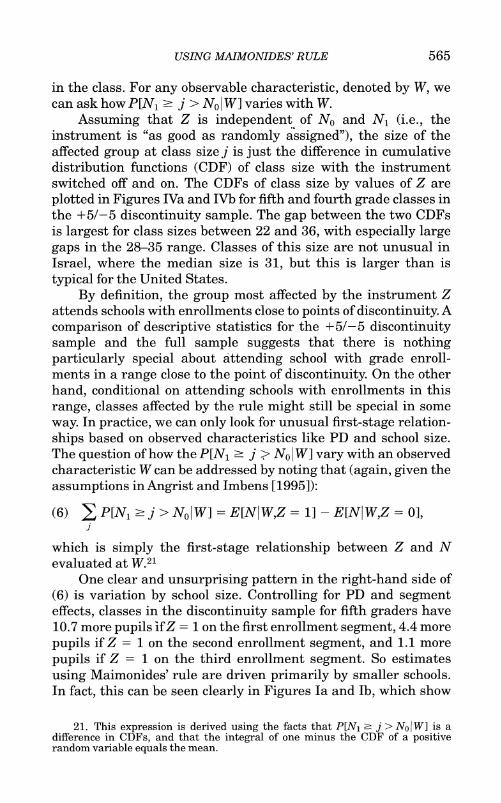
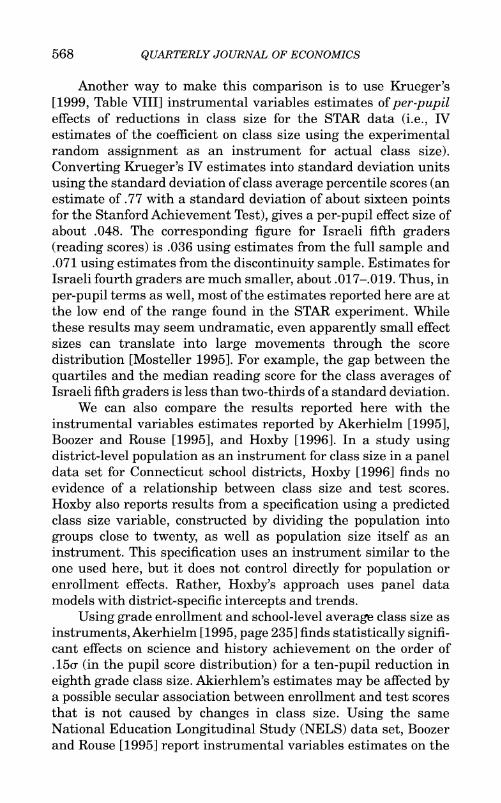
fifth graders, and Figure IIb plots the scores of fourth graders.12 The figures show that test scores are generally higher in schools with larger enrollments and, therefore, larger predicted class sizes. Most importantly, however, average scores by enrollment size can be seen to exhibit an up-and-down pattern that is, at least in part, the mirror image of the class-size function.
The overall positive correlation between scores and enroll- ment is partly attributable to that fact that larger schools in Israel are more likely to be located in relatively prosperous big cities, while smaller schools are more likely to be located in relatively poor "development towns" outside of major urban centers. In fact, enrollment size and the PD index measuring the proportion of students who come from a disadvantaged background are highly negatively correlated.
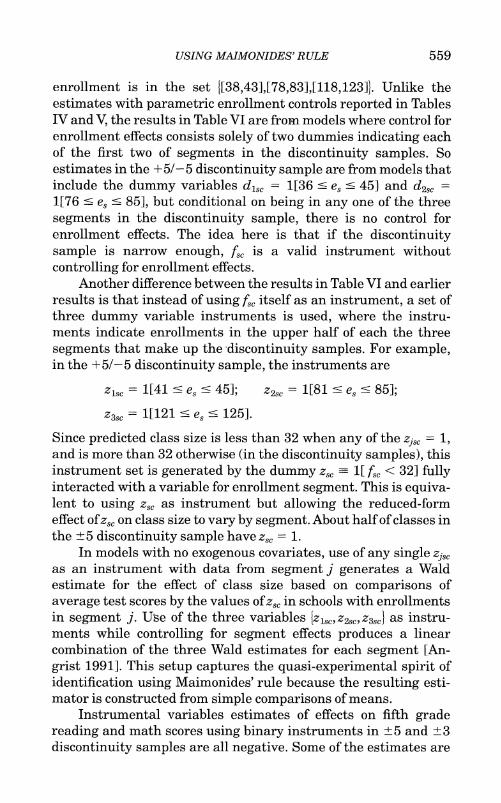
After controlling for this "trend association" between test scores and enrollment size and between test scores and PD, there is a negative association between fs, and scores. This can be seen in Figures IIIa and IIIb, which plot residuals from regressions of average reading scores and the average of fsc on average enroll- ment and PD index for each interval. Again, the x-axis is enrollment size. Although the approximate mirror-image relation- ship between detrended average scores and detrended&f~ is clearly not deterministic, this pattern is evident for the reading scores of pupils in both grades, and, as shown in Figure IIIc, for the math scores of fifth graders. In a regression of detrended average scores on detrended average &, the slopes are roughly -.22 for fifth graders' reading scores and -.11 for fourth graders' reading scores. Thus, the estimates for fifth graders imply that a reduction in predicted class size often students is associated with a 2.2 point increase in average reading scores, a little more than one-quarter of a standard deviation in the distribution of class averages.
III. MEASUREMENT FRAMEWORK
The figures suggest a clear link between the variation in class size induced by Maimonides' rule and pupil achievement, but they
12. Intervals of ten were used to construct the figures instead of the single-value intervals in Figures Ia and lb because the test score data have more idiosyncratic variation than the class-size data. The enrollment axes in the figures record interval midpoints. Averages were computed for schools with enrollments between 9 and 190. This accounts for over 98 percent of classes. The last interval (165 on the x-axis) includes enrollments from 160-190.
USING MAIMONIDES' RULE 545
a. Fifth Grade (Reading)
5 ~~~~~~~~~~~~~~~~~~~~~~- 15 4 Predicted clans size 10 -
-3I -1
5 25 45 65 85 105 125 145 1655
Enrollment count
h. Fourth Grade (Reading)
- 5
/ 0
_32 / Average test scores--5
--10
-5 , , , , , , , , . , - -15
5 25 45 65 85 105 125 145 165
Enrollment count
c. Fifth Grade (Math)
5- - 15 4 Predicted class size - lo
-4 -15
5 25 45 65 85 105 125 145 165
Enrsllnment count
FIGURE III Average Test (Reading/Math) Scores and Predicted Class Size by Enrollment,
Residuals from Regressions on Percent Disadvantaged and Enrollment
do not provide a framework for formal statistical inference. Although the micro data for fourth and fifth graders are un- available, a model for individual pupils' test scores is used to describe the causal relationships to be estimated. For the ith

546 QUARTERLY JOURNAL OF ECONOMICS
student in class c and school s, we can write
(2) = XsP + nscot + yc + qs + Eisc,
where yisc is pupil i's score, Xs is a vector of school characteristics, sometimes including functions of enrollment, and nsc is the size of class c in school s. The term jt is an i.i.d. random class component, and the term -s is an i.i.d. random school component. The remaining error component Eisc is specific to pupils. The first two error components are introduced to parameterize possible within- school and within-class correlation in scores. The class-size coeffi- cient cx is the parameter of primary interest.
Our interpretation of equation (2) is that it describes the average potential outcomes of students under alternative assign- ments of nsc, controlling for any effects ofX,. Although equation (2) is linear with constant coefficients, this is not necessary for estimates of Ox to have a valid causal interpretation. For example, if nsc were randomly assigned conditional on Xs, then ax would be a weighted average response along the length of the individual causal response functions connecting class size and pupil scores (see Angrist and Imbens [1995] and Section V, below). Since nsc is not randomly assigned, in practice it is likely to be correlated with potential outcomes (in this case, the error components in (2)). Thus, OLS estimates of (2) do not have a causal interpretation, although instrumental variables estimates still might. The causal interpretation of instrumental variables estimates turns on whether it is reasonable to assume that, after controlling for X5, the only reason for any association between instruments and test scores is the association between instruments and class size. We discuss this assumption further below.
Equation (2) is cast at the individual level because it is pupils who are affected by class size. In practice, however, the literature on class size often treats the class as the unit of analysis and not the pupil. Examples of class-level analyses of data from random- ized experiments are. Finn and Achilles [1990] and Wright et al. [1977]. Since class size is naturally fixed within classes, and student test scores are correlated within classes, little is lost in statistical precision from this aggregation. Moreover, as noted above, we have no option other than a class-level analysis for fourth and fifth graders because the micro-level data are unavail- able. To make the analyses from different years comparable, we also aggregated the 1992 data on third graders to the class level.
USING MAIMONIDES' RULE 547
Grouping equation (1), the class-level estimating equations have the form,
(3) Xc= X + nsco + qs + [Sc + ES
where overbars denote averages. The term [mc + -E.] is the class- level error term, while the random school component s captures correlation between class averages within schools.13
Efficient regression estimators with grouped data reweight the data to make the grouped residuals homoskedastic. In this case, however, simply weighting by class size does not make the residuals in (3) homoskedastic because of the random-effects error structure. Moreover, without assuming that the behavioral rela- tionship of interest is truly linear with constant coefficients, statistical theory provides little guidance as to the choice of weighting scheme [Deaton 1995; Pfefferman and Smith 1985]. We therefore report conventional ordinary least squares (OLS) and instrumental variables estimates of (3), along with standard errors corrected for intraschool correlation using the formulas in Moulton [1986]. Allowing for a heteroskedastic grouped error term has little impact on inferences, so that the grouped errors are treated as homoskedastic. Correction for the correlation of class averages within schools leads to 10-15 percent larger standard errors than the usual formulas.
A. Instrumental Variables and Regression-Discontinuity Designs
The approach taken here exploits the fact that the regressor of interest (class size) is partly determined by a known discontinu- ous function of an observed covariate (enrollment). In a seminal discussion of nonexperimental methods in evaluation research, Campbell [1969] considered a similar problem: how to identify the causal effect of a treatment that is assigned as a deterministic function of an observed covariate that is also related to the outcomes of interest.14 Campbell used the example of estimating the effect of National Merit scholarships on applicants' later
13. Finn and Achilles [1990] also used a model with random school effects in an analysis of class-level averages to analyze data from the Tennessee Project STAR (Student/Teacher Achievement Ratio) experiment.
14. Goldberger [1972] discusses this in the context of compensatory education programs. See also Thistlewaithe and Campbell [1960] and Campbell and Stanley [1963].

548 QUARTERLY JOURNAL OF ECONOMICS
academic achievement when the scholarships are awarded on the basis of past achievement. He argued that if the assignment mechanism used to award scholarships is discontinuous, e.g., there is a threshold value of past achievement that determines whether an award is made, then one can control for any smooth function of past achievement and still estimate the effect of the award at the point of discontinuity. This is done by matching discontinuities or nonlinearities in the relationship between outcomes and past achievement to discontinuities or nonlineari- ties in the relationship between awards and past achievement.
The graphs discussed in the previous section can be seen as applying Campbell's [1969] suggestion to the class-size question (see, especially, Campbell's Figures 12-14). The up-and-down pattern in the conditional expectation of test scores given enroll- ment is interpreted as reflecting the causal effect of changes in class size that are induced by changes in enrollment. This interpretation is plausible because the class-size function is known to share this pattern, while it seems likely that any other mechanism linking enrollment and test scores will be much smoother.
Campbell [1969] argued that when the rule relating covari- ates to treatment is not deterministic, something he called a "fuzzy regression-discontinuity," the regression-discontinuity method breaks down. Although later discussions of regression- discontinuity methods reversed this negative position (e.g., Cook and Campbell [1979]; Trochim [1984]), the connection between the use of fuzzy regression discontinuity and instrumental variables methods was not made explicit until van der Klauuw's [1996] study of the effects of financial aid awards. The class-size problem also provides an example of how a fuzzy regression discontinuity can be analyzed in an instrumental variables framework. In this case, instrumental variables estimates of equation (3) use discon- tinuities or nonlinearities in the relationship between enrollment and class size (captured by !') to identify the causal effect of class size, at the same time that any other relationship between enrollment and test scores is controlled by including smooth functions of enrollment in the vector of covariates. In practice, this includes linear, polynomial, and piecewise linear functions of e,.15
15. van der Klaauw [1996] exploits a fuzzy regression discontinuity by substituting a nonparametric estimate of the conditional expectation of treatment for the endogenous regressor (financial aid). A similar approach is discussed by Spiegelman [1976] and Trochim [1984]. This "plug-in" method is not literally the

USING MAIMONIDES' RULE 549
The identifying assumptions that lay behind this approach can be expressed formally by introducing some notation for the "first-stage" relationship of interest:
(4) nsc - X'Sqo + fscri + ,scS
where Ta0 and ,T1 are parameters and, as before, Xs is a vector of school-level covariates that includes functions of enrollment, es, and measures of pupil socioeconomic status. The error term (sc is defined as the residual from the population regression of nsc on Xs and the instrument, fsc. This residual captures other factors that are correlated with enrollment. These factors are probably also related to pupil achievement, which is why OLS estimates of (3) do not have a causal interpretation. Since /sc is a deterministic function of es, and es is almost certainly related to pupil test scores for reasons other than effects of changing class size, the key identifying assumption that underlies estimation using /sc as an instrument is that any other effects of es on test scores are adequately controlled by the terms in X'P in (3), and "partialled out" of the instrument by the term X'rro in equation (4).
To assess the plausibility of this assumption, it helps to consider why es is related to test scores in the first place. One reason, already noted, is that in Israel socioeconomic status is inversely related to local population density. Also, better schools might face increased demand if parents selectively choose dis- tricts on the basis of school quality. On the other hand, more- educated parents might try to avoid large-enrollment schools they perceive to be overcrowded. Any of these effects seem likely to be smooth, however; whereas the variation in test scores with enrollment has a rough up-and-down pattern that mirrors Mai- monides' rule. Nevertheless, it remains an untestable identifying assumption that nonclass-size effects on test scores do not depend on enrollment except through the smooth functions included in Xs. For this reason, we experiment with a wide range of alternative specifications for the relationship of interest.
A final identifying assumption is that parents do not selec- tively exploit Maimonides' rule so as to place their children in schools with small classes. Selective manipulation could occur if more-educated parents successfully place children in schools with grade enrollments of 41-45, knowing that this will lead to smaller
same as instrumental variables unless a linear regression is used to construct the first-stage fitted values.
550 QUARTERLY JOURNAL OF ECONOMICS
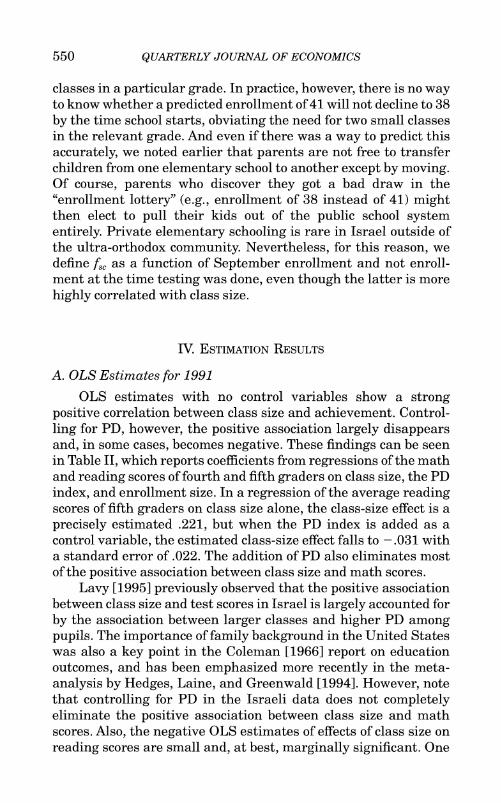
classes in a particular grade. In practice, however, there is no way to know whether a predicted enrollment of 41 will not decline to 38 by the time school starts, obviating the need for two small classes in the relevant grade. And even if there was a way to predict this accurately, we noted earlier that parents are not free to transfer children from one elementary school to another except by moving. Of course, parents who discover they got a bad draw in the "enrollment lottery" (e.g., enrollment of 38 instead of 41) might then elect to pull their kids out of the public school system entirely. Private elementary schooling is rare in Israel outside of the ultra-orthodox community. Nevertheless, for this reason, we define & as a function of September enrollment and not enroll- ment at the time testing was done, even though the latter is more highly correlated with class size.
IV. ESTIMATION RESULTS
A. OLS Estimates for 1991
OLS estimates with no control variables show a strong positive correlation between class size and achievement. Control- ling for PD, however, the positive association largely disappears and, in some cases, becomes negative. These findings can be seen in Table II, which reports coefficients from regressions of the math and reading scores of fourth and fifth graders on class size, the PD index, and enrollment size. In a regression of the average reading scores of fifth graders on class size alone, the class-size effect is a precisely estimated .221, but when the PD index is added as a control variable, the estimated class-size effect falls to -.031 with a standard error of .022. The addition of PD also eliminates most of the positive association between class size and math scores.
Lavy [1995] previously observed that the positive association between class size and test scores in Israel is largely accounted for by the association between larger classes and higher PD among pupils. The importance of family background in the United States was also a key point in the Coleman [1966] report on education outcomes, and has been emphasized more recently in the meta- analysis by Hedges, Laine, and Greenwald [1994]. However, note that controlling for PD in the Israeli data does not completely eliminate the positive association between class size and math scores. Also, the negative OLS estimates of effects of class size on reading scores are small and, at best, marginally significant. One

552 QUARTERLY JOURNAL OF ECONOMICS
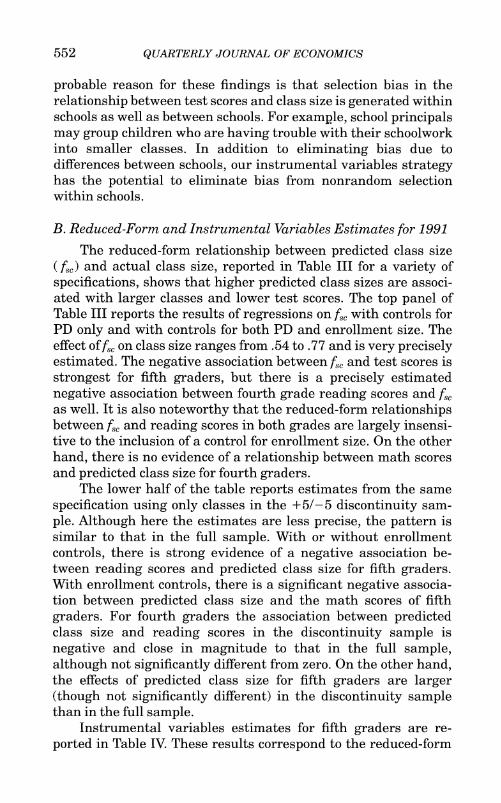
probable reason for these findings is that selection bias in the relationship between test scores and class size is generated within schools as well as between schools. For example, school principals may group children who are having trouble with their schoolwork into smaller classes. In addition to eliminating bias due to differences between schools, our instrumental variables strategy has the potential to eliminate bias from nonrandom selection within schools.
B. Reduced-Form and Instrumental Variables Estimates for 1991
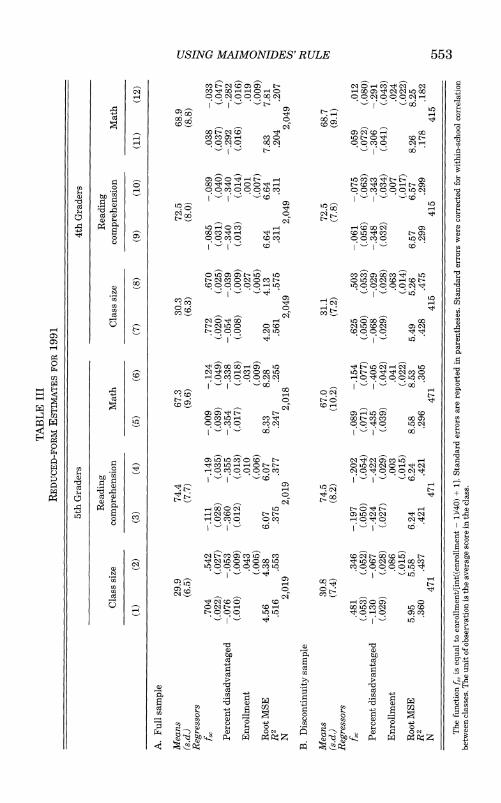
The reduced-form relationship between predicted class size (fs,) and actual class size, reported in Table III for a variety of specifications, shows that higher predicted class sizes are associ- ated with larger classes and lower test scores. The top panel of Table III reports the results of regressions on fs, with controls for PD only and with controls for both PD and enrollment size. The effect offs, on class size ranges from .54 to .77 and is very precisely estimated. The negative association between fs, and test scores is strongest for fifth graders, but there is a precisely estimated negative association between fourth grade reading scores and fs, as well. It is also noteworthy that the reduced-form relationships between fs, and reading scores in both grades are largely insensi- tive to the inclusion of a control for enrollment size. On the other hand, there is no evidence of a relationship between math scores and predicted class size for fourth graders.
The lower half of the table reports estimates from the same specification using only classes in the +5/-5 discontinuity sam- ple. Although here the estimates are less precise, the pattern is similar to that in the full sample. With or without enrollment controls, there is strong evidence of a negative association be- tween reading scores and predicted class size for fifth graders. With enrollment controls, there is a significant negative associa- tion between predicted class size and the math scores of fifth graders. For fourth graders the association between predicted class size and reading scores in the discontinuity sample is negative and close in magnitude to that in the full sample, although not significantly different from zero. On the other hand, the effects of predicted class size for fifth graders are larger (though not significantly different) in the discontinuity sample than in the full sample.
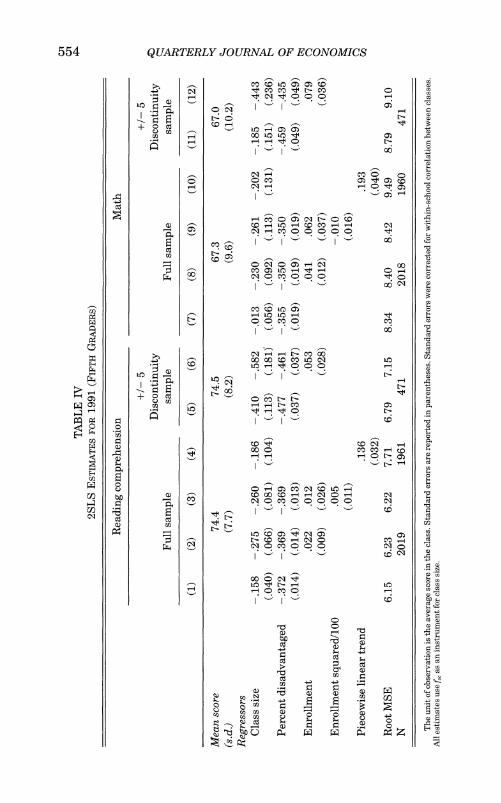
Instrumental variables estimates for fifth graders are re- ported in Table IV. These results correspond to the reduced-form

USING MAIMONIDES' RULE 557
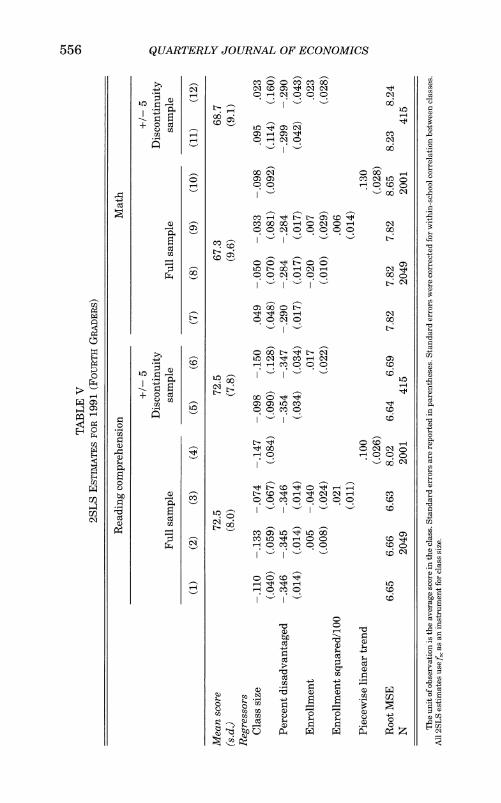
the piecewise linear specification generates larger estimates for fifth graders and smaller estimates for fourth graders.
Other columns in Table IV report estimates using classes in the +5/-5 discontinuity sample. These specifications correspond to the reduced-form specifications reported in Table III. Here too, the purpose of the analysis is to emphasize the variability in class size generated by jumps in class size at the points of discontinuity. Most of these estimates, while less precise, are substantially larger than those for the full sample. In three out of four cases they are significantly different from zero in spite of the reduced sample size.
The instrumental variables estimates for fourth graders, reported in Table V, also show a robust and in some cases statistically significant negative association between class size and reading achievement, although the effects for fourth graders are smaller than the effects for fifth graders. The estimate (standard error) in a model without enrollment controls is -.11 (.04), and with a linear enrollment control, the estimate is -.13 (.06). The estimate from a model including quadratic enrollment controls is not significantly different from zero, although it is still negative. Dropping PD and adding a piecewise linear enrollment control leads to an estimate of about -.15 (.08). Estimates for the reading scores of fourth graders in the +5/-5 discontinuity sample are similar to those for the full sample but not signifi- cantly different from zero. Estimates of effects on fourth graders' math scores are much weaker than the corresponding estimates for reading scores; none of the estimates is significantly different from zero; and the fourth grade math estimates in the discontinu- ity sample are positive.17
C. Additional Results for 1991
Results for a number of additional specifications are reported in Tables VI and VII. The estimates in Table VI use only classes close to the point of discontinuity. 18 As before, the + 5/-5 disconti- nuity sample is limited to classes in schools where grade enroll- ment is in the set I[36,45],[76,85],[116,125]1; similarly, a +3/-3 discontinuity sample includes classes in schools where grade
17. Using enrollment at the time tests were taken to construct the Mai- monides' rule instrument (instead of September enrollment), estimates of effects on fourth grade math scores are significantly different from zero, although still only about two-thirds as large as the corresponding fourth-grade verbal estimates.
18. Variations on the full-sample models are reported in our working paper [Angrist and Lavy 1997].

558 QUARTERLY JOURNAL OF ECONOMICS
CO ~ OcO m
0
10- Cl~~~~~~~~~~-4CO 6 6 l
-0- cLO l M1 C
cf~~~~~~Nc ~0 0 'T COO 00 LO
0 O COCI~~~~~~-~N O0 N -~L CO Q0
0 ~~~~~~~~~~~~~~~~~~~
cf2~~~~~~~~~~~~~~~~~~~~~~~~~~~~~~~~~~~~~~~~c 00 CD 0 co 0
m CO cq m~~~~~~~~~~~CC m l -- c
CO- 7I co 0 0
CO t-COCO
P-1 00 cq r--~ CO CD O Clq l C
r-C O CDQ0t- L cq t-
10 ~~~~~~~~~~~~~~~~~~~~
CO~~~~~ I~~ 0c 0 0 1:1 N c
CO~~~~~~~~~~O'W
o .'-, . . . .~~~~~~~~~~~~~~~~~c OR ~ 14 +~~~~I ~- - ~~7
0~~~~~~~~~~~~~~~~~~~~~~~~~~~ ~ ci uq ciq O Z
560 QUARTERLY JOURNAL OF ECONOMICS
significantly different from zero, and most are larger than esti- mates in the full sample, although also with much larger standard errors. For example, the estimate (standard error) from a model with no covariates other than segment dummies in the + 3/-3 discontinuity sample is -.45 (.24). Estimates for the reading scores of fourth graders are also negative and marginally signifi- cant in the + 3/-3 discontinuity sample when the model ex- cludes PD.
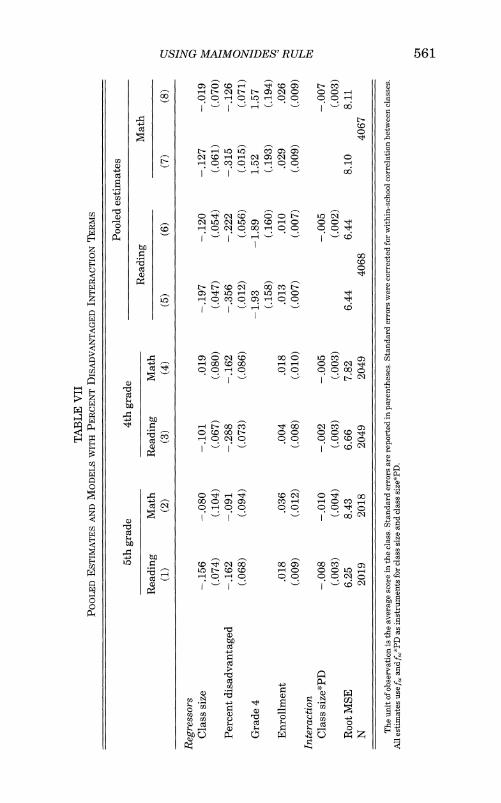
The second set of additional estimates, reported in Table VII, consists of results from models where the effect of class size on test scores is interacted with PD. This specification is used to see whether the benefits of smaller classes vary with pupil back- ground. The instruments in this case are f&, and PD*f8,. To increase precision, estimates of models pooling fourth and fifth graders were also computed. These models include a dummy for fourth graders. The estimates by grade generate negative interac- tion terms, although the interaction terms are significant for fifth graders only. Pooled estimates without interaction terms, re- ported in columns (5) and (7), lie between the previously reported grade-specific estimates and are significant for both test scores. Pooled estimates with interaction terms, reported in columns (6) and (8) of the table, generate negative main effects and significant negative interaction terms for both test scores, although the main effect for math scores is not significantly different from zero. Overall, the estimates strongly suggest that the benefits of small classes are larger in schools where there is a high proportion of pupils who come from a disadvantaged background. Similar findings regarding pupil background/class size interactions were reported by Summers and Wolfe [1977] in a study of Philadelphia sixth graders.
D. Results for 1992 (Third Graders)
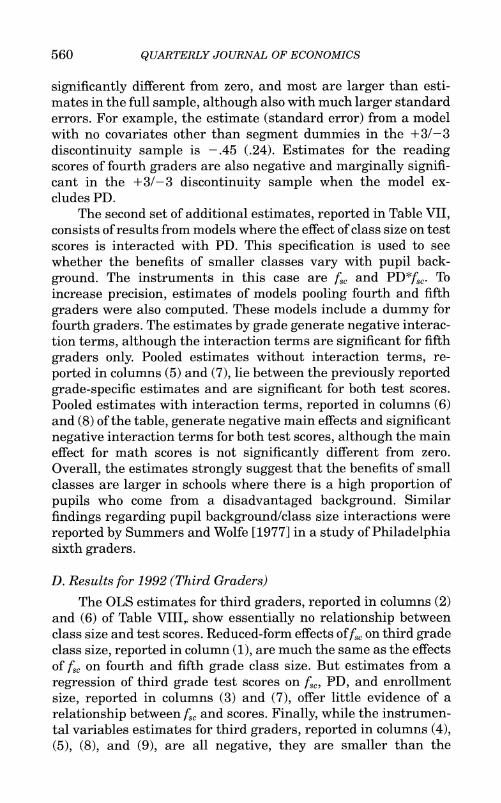
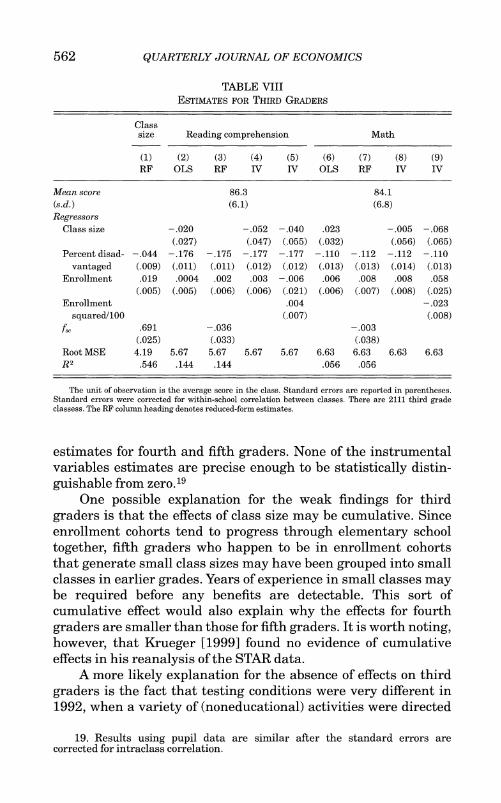
The OLS estimates for third graders, reported in columns (2) and (6) of Table VIII, show essentially no relationship between class size and test scores. Reduced-form effects of&fs on third grade class size, reported in column (1), are much the same as the effects of f&, on fourth and fifth grade class size. But estimates from a regression of third grade test scores on f&, PD, and enrollment size, reported in columns (3) and (7), offer little evidence of a relationship between f& and scores. Finally, while the instrumen- tal variables estimates for third graders, reported in columns (4), (5), (8), and (9), are all negative, they are smaller than the
562 QUARTERLY JOURNAL OF ECONOMICS
TABLE VIII ESTIMATES FOR THIRD GRADERS
Class size Reading comprehension Math
(1) (2) (3) (4) (5) (6) (7) (8) (9) RF OLS RF IV IV OLS RF IV IV
Mean score 86.3 84.1 (s.d.) (6.1) (6.8) Regressors
Class size - .020 - .052 - .040 .023 - .005 - .068 (.027) (.047) (.055) (.032) (.056) (.065)
Percent disad- -.044 -.176 -.175 -.177 -.177 -.110 -.112 -.112 -.110 vantaged (.009) (.011) (.011) (.012) (.012) (.013) (.013) (.014) (.013)
Enrollment .019 .0004 .002 .003 - .006 .006 .008 .008 .058 (.005) (.005) (.006) (.006) (.021) (.006) (.007) (.008) (.025)
Enrollment .004 - .023 squared/100 (.007) (.008)
fsc .691 -.036 -.003
(.025) (.033) (.038) Root MSE 4.19 5.67 5.67 5.67 5.67 6.63 6.63 6.63 6.63 R2 .546 .144 .144 .056 .056
The unit of observation is the average score in the class. Standard errors are reported in parentheses. Standard errors were corrected for within-school correlation between classes. There are 2111 third grade classess. The RF column heading denotes reduced-form estimates.
estimates for fourth and fifth graders. None of the instrumental variables estimates are precise enough to be statistically distin- guishable from zero.19
One possible explanation for the weak findings for third graders is that the effects of class size may be cumulative. Since enrollment cohorts tend to progress through elementary school together, fifth graders who happen to be in enrollment cohorts that generate small class sizes may have been grouped into small classes in earlier grades. Years of experience in small classes may be required before any benefits are detectable. This sort of cumulative effect would also explain why the effects for fourth graders are smaller than those for fifth graders. It is worth noting, however, that Krueger [1999] found no evidence of cumulative effects in his reanalysis of the STAR data.
A more likely explanation for the absence of effects on third graders is the fact that testing conditions were very different in 1992, when a variety of (noneducational) activities were directed
19. Results using pupil data are similar after the standard errors are corrected for intraclass correlation.
USING MAIMONIDES' RULE 563
toward increasing test scores and reducing the variation in scores across schools. The official report of the 1992 test results [National Center for Education Feedback 1993] highlights major differences between the 1992 and 1991 waves of the testing program. For example, regular class teachers (as well as an outside exam proctor) were present when tests were taken in 1992 but not in 1991.20
As noted at the beginning of the paper, the descriptive statistics in Table I show higher scores and lower variance in 1992. Additional evidence that testing conditions changed is the fact that the average score was over 90 percent correct in 25 percent of 1992 classes (over 500 classes). In 1991 this was true of no more than eight classes in any grade or subject. Also, our 1992 estimation results show much smaller effects of PD on test scores than were observed in 1991. Since the distribution of the PD index over towns and cities was essentially unchanged, this finding is consistent with the hypothesis that test preparation reduced the information about pupil abilities contained in the scores.
V. CHARACTERIZATIONS AND COMPARISONS
A. Characterizing Affected Groups
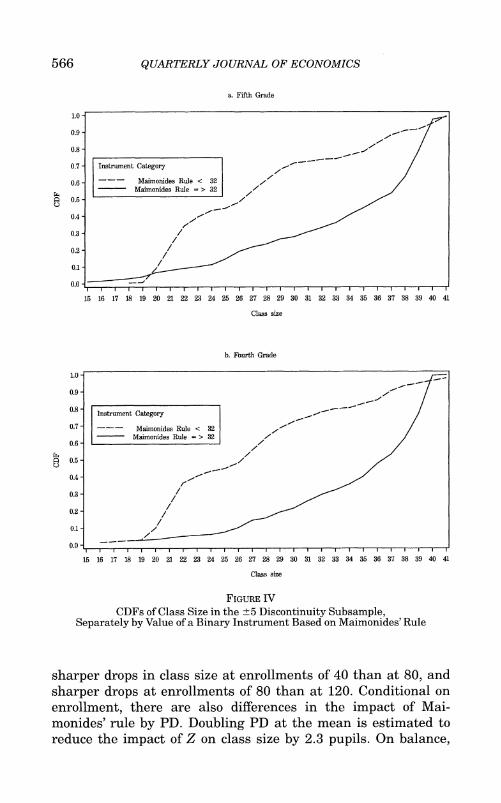
This section is concerned with the external validity of our findings. First, we ask whether the classes affected by Mai- monides' rule are representative of all classes in Israeli grade schools. The problem of characterizing the group affected by a binary instrument is discussed by Angrist and Imbens [1995] for the case of a multinomial treatment. Here the treatment is class size, and the instrument can be taken to be Z = 1 - zScy which was used to construct the discontinuity-sample estimates reported in Table VI. (The normalization is reversed so Z = 1 means bigger classes.) In what follows, we drop subscripts indexing observa- tions, and use uppercase variables to denote random variables with the same distribution as for a randomly chosen class.
Suppose that a set of pupils would have average test score Yj when grouped into classes of size j, where j can take on values 1-40. Yj is a potential outcome; that is, we imagine that for each
20. Preparation for the 1992 tests is described in the report as follows [page 3]: "During the past year there was an intense and purposeful remedial effort on the part of the elementary school division [in the Ministry of Education] in a large number of schools with high failure rates in 1991. Similarly, in light of last year's scores [in 1991], and because of the anticipated new tests [in 1992], there was an intensive remedial effort on the part of schools, district supervisors, counselors, and others."

USING MAIMONIDES' RULE 567
therefore, the analysis of affected groups indicates that the estimates presented here are affected disproportionately by smaller schools and by schools with fewer disadvantaged pupils than average, although the variation in impact along this second dimension is much more modest than the first.
B. Comparisons
The literature on class size and scholastic achievement often reports a summary statistic known as "effect size." This is the test score change that would result from a given change in class size, divided by the standard deviation of the scores. Finn and Achilles [1990] discuss two versions of this, one using the standard deviation of test scores among pupils and one using the standard deviation of class means. Since the overall variance is naturally larger than the between-class variance, measures based on the first standard deviation are always smaller than measures based on the second. The only measure that can be used here is the second because we do not have the micro test score data for fourth and fifth graders. However, note that since class size is a class-level intervention, it seems reasonable to measure impacts relative to the distribution of average scores.
The Tennessee STAR experiment described by Finn and Achilles [1990, Table 5] yielded effect sizes of about .13u-.27u among pupils, and about .32c to .66u in the distribution of class means. We can compare our results with the Tennessee experi- ment by calculating effect size for a reduction in class size of eight pupils, as was done (on average) in the Tennessee experiment. Multiplying this times the instrumental variables estimate for reading scores from column (2) in the table for fifth graders (an estimate of -.275 in a model with enrollment controls), gives an effect size of about .29u (=2.2 points) in the distribution of class means. The effect size is probably about .18c among pupils.22 Thus, our estimates of effect size for fifth graders are at the low end of the range of those found in the Tennessee experiment. The effect sizes based on estimates for fourth grade reading scores are only about half as large as those for fifth graders, equal to roughly .13u in the distribution of class means.
22. This calculation is based on the ratio of between-class to total variation in the third grade micro data.
568 QUARTERLY JOURNAL OF ECONOMICS
Another way to make this comparison is to use Krueger's [1999, Table VIII] instrumental variables estimates of per-pupil effects of reductions in class size for the STAR data (i.e., IV estimates of the coefficient on class size using the experimental random assignment as an instrument for actual class size). Converting Krueger's IV estimates into standard deviation units using the standard deviation of class average percentile scores (an estimate of .77 with a standard deviation of about sixteen points for the Stanford Achievement Test), gives a per-pupil effect size of about .048. The corresponding figure for Israeli fifth graders (reading scores) is .036 using estimates from the full sample and .071 using estimates from the discontinuity sample. Estimates for Israeli fourth graders are much smaller, about .017-.019. Thus, in per-pupil terms as well, most of the estimates reported here are at the low end of the range found in the STAR experiment. While these results may seem undramatic, even apparently small effect sizes can translate into large movements through the score distribution [Mosteller 1995]. For example, the gap between the quartiles and the median reading score for the class averages of Israeli fifth graders is less than two-thirds of a standard deviation.
We can also compare the results reported here with the instrumental variables estimates reported by Akerhielm [1995], Boozer and Rouse [1995], and Hoxby [1996]. In a study using district-level population as an instrument for class size in a panel data set for Connecticut school districts, Hoxby [1996] finds no evidence of a relationship between class size and test scores. Hoxby also reports results from a specification using a predicted class size variable, constructed by dividing the population into groups close to twenty, as well as population size itself as an instrument. This specification uses an instrument similar to the one used here, but it does not control directly for population or enrollment effects. Rather, Hoxby's approach uses panel data models with district-specific intercepts and trends.
Using grade enrollment and school-level average class size as instruments, Akerhielm [1995, page 235] finds statistically signifi- cant effects on science and history achievement on the order of .15u (in the pupil score distribution) for a ten-pupil reduction in eighth grade class size. Akierhlem's estimates may be affected by a possible secular association between enrollment and test scores that is not caused by changes in class size. Using the same National Education Longitudinal Study (NELS) data set, Boozer and Rouse [1995] report instrumental variables estimates on the
USING MAIMONIDES' RULE 569
order of .29u in equations that control for base-year test scores. The Boozer and Rouse instruments are indicators of state maxi- mum sizes for special education classes. Both the Akerhielm and Boozer and Rouse findings are similar to those reported here for fourth and fifth graders.
VI. CONCLUSIONS
This paper presents a variety of OLS and instrumental variables estimates of the effect of class size on the reading and math scores of elementary school children in Israel. The raw positive correlation between achievement and class size is clearly an artifact of the association between smaller classes and the proportion of pupils from disadvantaged backgrounds. Instrumen- tal variables estimates constructed by using functions of Mai- monides' rule as instruments for class size while controlling for enrollment and pupil background consistently show a negative association between larger classes and student achievement. These effects are largest for the math and reading scores of fifth graders, with smaller effects for the reading scores of fourth graders. Results for the math scores of fourth graders are not significant, though pooled estimates for fourth and fifth graders are significant and precise on both tests.
Even though the effects reported here are mostly smaller than those reported in the Tennessee STAR experiment, they may nevertheless represent important gains relative to the distribu- tion of Israeli test scores. The Israeli Parliament recently began debating a bill that would lower the maximum legal class size to 30. Using the cohort size distributions in our data, we estimate that the new law would reduce average elementary-school class sizes from 31 to about 25 and reduce the upper quartile from 35 to 27. These reductions will clearly be expensive to implement, requiring something like 600 additional classes per grade. But the findings reported here imply that the resulting change in Mai- monides' rule could have an impact equivalent to moving two deciles in the 1991 distribution of class averages.
It is also worth considering whether results for Israel are likely to be relevant for the United States or other developed countries. In addition to cultural and political differences, Israel has a lower standard of living and spends less on education per pupil than the United States and some OECD countries [Klinov 1992; OECD 1993]. And, as noted above, Israel also has larger class sizes than the United States, United Kingdom, and Canada.

570 QUARTERLY JOURNAL OF ECONOMICS
So the results presented here may be showing evidence of a marginal return for reductions in class size over a range of sizes that are not characteristic of most American schools. On the other hand, while classes as large as those in Israel are not typical in the United States, in 1991 the average eighth grade class size in California was 29 pupils, not dramatically lower than the corre- sponding Israeli average of 32.23
Finally, our study serves to highlight an important methodo- logical point. Hanushek's [1995] widely cited survey of research on school inputs in developing countries shows the same pattern of weak effects reported in his surveys of results for the United States. Like Hanushek, an education survey in The Economist [1997] magazine recently interpreted the lack of an association between education inputs and test scores as evidence that school resources have no causal effect on learning. The findings pre- sented here suggest that such conclusions are premature. Obser- vational studies are often confounded by a failure to isolate a credible source of exogenous variation in school inputs. The regression-discontinuity research design overcomes problems of confounding by exploiting exogenous variation that originates in administrative rules. As in randomized trials like the STAR experiment, when this sort of exogenous variation is used to study class size, smaller classes appear beneficial.
DATA APPENDIX
A. 1991 Data (Fifth and Fourth Graders) A computerized data file from the Central Bureau of Statis-
tics [1991] survey of schools includes 1027 Jewish public (secular and religious) schools with fifth grade pupils, in 2073 (nonspecial education) classes.24 These data, containing information collected in September, were given to us by the Central Bureau of Statis- tics. Data on class size collected between March and June, provided by the Ministry of Education, contained records for 2052 of these classes, with information on class size for 2029 of them.
Data on average test scores came in two forms. Ministry of Education programmers provided one file with information on average test scores and numbers of test takers for 1733 of the
23. These figures are from United States Department of Education [1996, p. 107]. Utah, with an average size of 30, had the largest classes in the United States.
24. The relevant Central Bureau of Statistics [1991, p. 67] report indicates that there were 1081 Jewish public elementary schools in 1990-1991, although not all of these have regular (nonspecial education) classes and not all have enrollment in all grades.
USING MAIMONIDES'RULE 571
classes (about 85 percent). We also obtained a file that contained average test scores and numbers of test takers for each grade in each school for 1978 of the classes. Among the 296 classes missing class-level average scores, school-level averages were available for all but 5. Since there was never more than one class missing a class-level score, and we know the number of test takers in each school and in each class with nonmissing scores, we were able to impute the missing class-level average for all but the five classes missing both class-level and school-level averages. Finally, the PD index and town ID were added to the linked and imputed class/school data set from a separate Ministry of Education file on schools. The PD index was available for every school in the database.
The construction of the fourth graders' data set follows that of the fifth graders. A computerized file from the Central Bureau of Statistics [1993] survey of schools includes 1039 Jewish public schools with fourth grade pupils, in 2106 (nonspecial education) classes. Data on class size, provided by the Ministry of Education, contained records for 2082 of these classes, with information on class size for 2059 classes.
We were provided with class-level average scores in 1769 of the 2059 fourth grade classes and school-level averages in 2025 of the 2059 classes. Among the 290 classes missing class-level average scores, school-level averages were available for all but 4. Since there was never more than one class missing a class-level score, and we know the number of test takers in each school and in each class with nonmissing scores, we were able to impute the missing class-level average for all but four of the classes missing both class-level and school-level averages. The PD index and town ID were then added as with the fifth graders.
We checked the imputation of class-level averages from school averages by comparing the school and class averages in schools with one class and by comparing the imputed and nonimputed data. School and class-level averages matched almost perfectly in schools with one class. We were unable to detect any systematic differences between schools that were missing some class-level data and the schools that were not. The empirical findings are not sensitive to the exclusion of the imputed class-level averages.
B. 1992 Data (Third Graders)
Construction of the third graders data set differs from the construction of the fourth and fifth graders data sets because we

572 QUARTERLY JOURNAL OF ECONOMICS
were provided with micro data on the test scores of third grade pupils. As with the fourth and fifth graders, we began with the Central Bureau of Statistics [1993] survey of schools. This in- cludes 1042 Jewish public schools with third grade pupils in 2193 (nonspecial education) classes. Data on class size, provided by the Ministry of Education, contained records with information on class size for 2162 of these classes.
We used micro data on the test scores of third graders to compute average math and reading scores for each class. Score data were available for 2144 of the 2162 classes with class size information in the CBS survey of schools. Finally, we added information on the PD index and town identities from a Ministry of Education file containing information on schools. There was no information on the PD index for 34 of the 2144 classes with data on size and test scores, so that the third grade sample size is 2111. This is probably because new schools would not have had a PD index assigned at the time data in our school-level file were entered into the record-keeping system.
APPENDIX 1: DESCRIPTIVE STATISTICS WEIGHTED BY CLASS SIZE
Quantiles
Variable Mean S.D. 0.10 0.25 0.50 0.75 0.90
A. Full sample 5th grade (2019 classes, 1002 schools, tested in 1991)
Class size 31.4 6.0 23 27 32 36 39 Enrollment 83.0 38.8 37 55 78 107 134 Percent disadvantaged 13.1 12.6 2 4 9 17 32 Reading size 28.6 6.2 20 25 29 33 36 Math size 29.0 6.3 21 25 29 34 37 Average verbal 74.7 7.4 64.7 70.5 75.6 79.9 83.3 Average math 67.7 9.4 55.6 61.9 68.1 74.4 79.6
4th grade (2049 classes, 1013 schools, tested in 1991)
Class size 31.6 5.8 23 28 32 36 39 Enrollment 82.9 37.5 36 56 78 106 131 Percent disadvantaged 13.1 12.6 2 4 9 17 32 Reading size 28.8 6.2 20 25 29 33 36 Math size 29.2 6.2 21 25 30 34 37 Average verbal 72.7 7.7 62.4 67.9 73.6 78.2 81.9 Average math 69.2 8.5 58.4 64.0 70.0 75.1 79.4
USING MAIMONIDES' RULE 573
DESCRIPTIVE STATISTICS WEIGHTED BY CLASS SIZE
Quantiles
Variable Mean S.D. 0.10 0.25 0.50 0.75 0.90
3rd grade (2111 classes, 1011 schools, tested in 1992)
Class size 31.8 5.7 24 28 33 36 39 Enrollment 83.6 36.9 40 57 78 108 131 Percent disadvantaged 13.1 12.7 2 4 9 17 33 Reading size 25.4 5.1 18 22 26 29 32 Math size 25.6 5.1 19 22 26 30 32 Average verbal 86.4 5.9 78.8 83.2 87.3 90.7 93.0 Average math 84.2 6.7 75.3 80.4 84.8 89.0 91.9
B. +/- 5 Discontinuity sample (enrollment 36-45, 76-85, 116-124)
5th grade 4th grade 3rd grade
Mean S.D. Mean S.D. Mean S.D.
(471 classes, (415 classes, (441 classes, 224 schools) 195 schools) 206 schools)
Class size 32.6 7.0 32.8 6.8 32.3 6.9 Enrollment 80.4 29.3 82.2 29.7 78.8 27.5 Percent disadvantaged 12.4 12.2 12.4 12.0 13.6 13.8 Reading size 29.7 7.0 29.9 7.4 25.8 6.1 Math size 30.2 7.1 30.3 7.3 26.0 6.2 Average verbal 74.9 7.8 72.7 7.7 86.4 6.0 Average math 67.7 9.9 69.0 8.8 84.4 6.7
Variable definitions are as follows: Class size = number of students in class in the spring, Enrollment = September grade enrollment, Percent disadvantaged = percent of students in the school from "disadvantaged backgrounds," Reading size = number of students who took the reading test, Math size = number of students who took the math test, Average verbal = average composite reading score in the class, Average math average composite math score in the class.
MASSACHUSETTS INSTITUTE OF TECHNOLOGY AND NATIONAL BUREAU OF ECONOMIC
RESEARCH
HEBREW UNIVERSITY OF JERUSALEM
REFERENCES
Akerhielm, Karen, "Does Class Size Matter?" Economics of Education Review, XIV (1995), 229-241.
Algrabi, M., "Indicates to Characterize a School's Social Composition and a Method for Allocating Additional Funds Between Schools" (Hebrew), Megamot, XXI (1975), 219-227.
Angrist, Joshua D., "Grouped Data Estimation and Testing in Simple Labor Supply Models," Journal of Econometrics, XLVII (1991), 243-266.
Angrist, Joshua D., and Guido Imbens, "Average Causal Response in Models with Variable Treatment Intensity," Journal of the American Statistical Associa- tion, XC (1995), 431-442.

574 QUARTERLY JOURNAL OF ECONOMICS
Angrist, Joshua D., and Victor Lavy, "Using Maimonides' Rule to Estimate the Effect of Class Size on Scholastic Achievement," NBER Working Paper No. 5888, January 1997.
Boozer, Michael, and Cecilia Rouse, "Intraschool Variation in Class Size: Patterns and Implications," NBER Working Paper No. 5144, June 1995.
Campbell, Donald T., "Reforms as Experiments," American Psychologist, XXIV (1969),409-429.
Campbell, Donald T., and J. C. Stanley, Experimental and Quasi-Experimental Designs for Research (Chicago: Rand-McNally, 1963).
Card, David, and Alan Krueger, "Does School Quality Matter? Returns to Education and the Characteristics of Public Schools in the United States," Journal of Political Economy, C (1992a), 1-40.
Card, David, and Alan Krueger, "School Quality and Black-White Relative Earnings: A Direct Assessment," Quarterly Journal of Economics, CVII (February 1992b), 151-200.
Central Bureau of Statistics, Educational Institutions: Kindergartens, Schools, Post-Secondary and Higher Education 1990/91, Series of Education and Culture Statistics, No. 198, reprinted from the Supplement to the Monthly Bulletin of Statistics, No. 9, 1991.
Central Bureau of Statistics, Educational Institutions: Kindergartens, Schools, Post-Secondary and Higher Education 1991/92, in the Supplement to the Monthly Bulletin of Statistics, No. 11, November 1993 (Hebrew only).
Coleman, J. S., et al., Equality of Educational Opportunity (Washington, DC: U. S. GPO, 1966).
Cook, Thomas D., and D. T. Campbell, Quasi-Experimentation: Design and Analysis Issues for Field Settings (Boston: Houghton-Mifflin Company, 1979).
Deaton, Angus, "Data and Econometric Tools for Development Analysis," Chapter 33 in The Handbook of Development Economics, Volume III, J. Behrman and T. N. Srinivasan, eds. (Amsterdam: Elsevier Science B.V., 1995).
The Economist, "Education and the Wealth of Nations," March 29, 1997, 15-16. Epstein, I., Hebrew-English Translation of the Babylonian Talmud, Baba Bathra,
Volume I (London: Soncino Press, 1976). Finn, Jeremy D., and Charles M. Achilles, "Answers and Questions about Class
Size: A Statewide Experiment," American Educational Research Journal, XXVII (Fall 1990),557-577.
Glass, Gene V., and M. L. Smith, "Meta-Analysis of Research on Class Size and Achievement," Educational Evaluation and Policy Analysis, 1 (1979), 2-16.
Glass, Gene V., L. S., Cahen, M. L. Smith, and N. N. Filby, School Class Size: Research and Policy (Beverly Hills, CA: Sage, 1982).
Goldberger, Arthur S., "Selection Bias in Evaluating Treatment Effects: Some Formal Illustrations," University of Wisconsin, Institute for Research on Poverty, Discussion Paper 123-72, April 1972.
Hahn, Jinyong, P. Todd, and W. van der Klaauw, "Estimation of Treatment Effects with a Quasi-Experimental Regression-Discontinuity Design," University of Pennsylvania Department of Economics, mimeo, July 1997.
Hanushek, Eric, "The Economics of Schooling: Production and Efficiency in Public Schools,"Journal of Economic Literature, XXIV (September 1986), 1141-1177.
"Interpreting Recent Research on Schooling in Developing Countries," The World Bank Research Observer, X (August 1995), 227-246.
__, "School Resources and Student Performance," in Does Money Matter? The Effect of School Resources on Student Achievement and Adult Success, Gary Burtless, ed. (Washington, DC: Brookings Institution, 1996).
Heckman, James J., A. Layne-Farrar, and P. Todd, "Does Measured School Quality Really Matter? An Examination of the Earnings-Quality Relationship," NBER Working Paper No. 5274, September 1995.
Hedges, Larry V., R. D. Laine, and R. Greenwald, "Does Money Matter? A Meta-Analysis of Studies of the Effects of Differential School Inputs on Student Outcomes," Educational Researcher, XXIII (1994), 5-14.
Hoxby, Caroline, "The Effects of Class Size and Composition on Student Achieve- ment: New Evidence from Natural Population Variation," Harvard Depart- ment of Economics, manuscript, July 1996.
Hyamson, Moses, Annotated English translation of Maimonides' Mishneh Torah, Book I (The Book of Knowledge) (New York: Jewish Theological Seminary, 1937).
USING MAIMONIDES' RULE 575
Israel Ministry of Education, Standards for Compulsory Public Education, Jerusalem: 1959 (Hebrew). ,Memo from the Director General dated June 17, 1966 (Hebrew). , Director General's Special Circular, No. 4, 1980 (Hebrew). , The Deputy Minister's Office, press release dated July 24, 1994 (Hebrew).
Klinov, Ruth, "Priorities in Public Resource Allocation for Education," The Center for Social Policy Studies in Israel, Jerusalem: October, 1992.
Krueger, Alan B., "Experimental Estimates of Education Production Functions," Quarterly Journal of Economics, CXIV (May 1999), 497-532.
Lavy, Victor, "Endogenous School Resources and Cognitive Achievement in Pri- mary Schools in Israel," Hebrew University, Falk Institute Discussion Paper No. 95.03, 1995.
Loeb, Susanna, and John Bound, "The Effect of Measured School Inputs on Academic Achievement: Evidence from the 1920s, 1930s, and 1940s Birth Cohorts," NBER Working Paper No. 5331, November 1995.
Moshel-Ravid, Learning, Teaching, Education, and Class Size: A Review of the Literature (Hebrew Pamphlet) (Jerusalem: The Henrietta Sczold Institute, the National Institute for Research in the Behavioral Sciences, 1995).
Mosteller, Frederick, "The Tennessee Study of Class Size in the Early School Grades," The Future of Children: Critical Issues for Children and Youths, V (Summer/Fall 1995),113-127.
Moulton, Brent R., "Random Group Effects and the Precision of Regression Estimates," Journal of Econometrics, XXXII (1986), 385-397.
Mueller, D., C. I. Chase, and J. D. Walden, "Effects of Reduced Class Size in Primary Classes," Educational Leadership, XLV (1988), 48-50.
National Center for Education Feedback, The Results of Reading and Mathematics Achievement Tests Given to Fourth and Fifth Graders in June 1991 (Hebrew pamphlet) (Jerusalem: Ministry of Education, October 1991). , Selected Analyses of the Results of the June 1992 Third Grade Achievement Tests (Hebrew Pamphlet) (Jerusalem: Ministry of Education, March 1993).
OECD, Centre for Educational Research and Innovation, Education at a Glance: OECD Indicators (Paris: Organization for Economic Cooperation and Develop- ment, 1993).
OFSTED, Class Size and the Quality of Education: A Report from the Office of Her Majesty's Chief Inspector of Schools (London: Office for Standards in Educa- tion, November 1995).
Pfefferman, Daniel, and T. M. F. Smith, "Regression Models for Grouped Popula- tions in Cross-Section Surveys," International Statistical Review, LIII (1985), 37-59.
Robinson, G. E., "Synthesis of Research on the Effects of Class Size," Educational Leadership, XLVII (1990), 80-90.
Slavin, E., "Class Size and Student Achievement: Small Effects of Small Classes," Educational Psychology, XXIV (1989), 99-110.
Spiegelman, C. H., "Two Techniques for Establishing Treatment Effect in the Presence of Hidden Variables: Adaptive Regression and a Solution of Riersol's Problem," Ph.D. thesis, Northwestern University, 1976.
Summers, Anita A., and B. Wolfe, "Do Schools Make a Difference?" American Economic Review, LXVII (September 1977), 639-652.
Thistlewaithe, D. L., and D. T. Campbell, "Regression-Discontinuity Analysis: An Alternative to the Ex Post Facto Experiment," Journal of Educational Psychology, LI (1960), 309-317.
Trochim, William K., Research Design for Program Evaluation: The Regression- Discontinuity Approach (Beverly Hills, CA: Sage, 1984).
U. S. Department of Education, National Center for Education Statistics, Educa- tion in States and Nations, 2nd ed., NCES-96-160, by Richard Phelps, Thomas M. Smith, and Nabeel Alsalam (Washington, DC: U. S. GPO, 1996).
van der Klaauw, Wilbert, "A Regression-Discontinuity Evaluation of the Effect of Financial Aid Offers on College Enrollment," manuscript, New York Univer- sity Economics Department, December 1996.
Wright, Elizabeth N., S. M. Shapson, G. Eason, and J. Fitzgerald, Effects of Class Size in the Junior Grades (Toronto: Ontario Ministry of Education, 1977).