Embed Size (px)
Citation preview
Session 1559
Using LabVIEW in Instrumentation and Control Course
Chong ChenDepartment of Engineering Technology and Industrial Studies
Middle Tennessee State UniversityMurfreesboro, TN 37132
Abstract
Computer data acquisition and processing have been widely used in researches and industrialcontrols, because of high sampling speed and being able to interface with other instruments. Tokeep students abreast with the new technology, software and hardware for data acquisition andprocessing are used in our instrumentation and control course.
The software and hardware used are LabVIEW and PCI-1200 board from National Instruments.LabVIEW is a graphical programming language that has been widely adopted throughoutindustry, academia, and government labs as the standard for data acquisition and instrumentcontrol software. PCI-1200 board is a low-cost, multifunction I/O Data acquisition card thatcommunicates with a PC through a parallel port. In our laboratory, they are used for measuringtemperatures, stress and other variables. With LabVIEW, PCI-1200 board, and signal conditionalcircuits, students may collect, display, and process the values of those quickly changingvariables. They may also see the variations of these variables in detail, which usually isimpossible without a digital storage oscilloscope.
Introduction
Data collection is a very common practice in scientific and industrial measurements andcontrols. Today, many computer data acquisition application packages are available. They offermany benefits over hand-held meters and other traditional measuring instruments. These benefitsinclude measurement automation, data storage and display, and fast sample speed. It is also anadvantage to have the measurement results stored in computer memory, so that subsequentanalysis of the data can be performed. With data acquisition software and signalconverting/conditioning circuits, a computer may measure different physical quantities.Compared to traditional measuring equipment, this may reduce the overall equipment cost.
One of the popular computer data acquisition application packages is Laboratory VirtualInstrument Engineering Workbench (LabVIEW) developed by National Instruments. LabVlEWis a graphical software system for developing high performance scientific and engineeringapplications. LabVIEW can acquire data and control devices via a data acquisition board, such asthe PCI-1200 data acquisition board. LabVIEW, much like the Visual Basic and C++
programming packages, includes programming capability and a user friendly interface. LabVIEWhas been used by many industries and scientific researchers. One application was developingmethods to cool and trap atoms with laser light completed by Dr. William Phillips[1], who is aphysicist and fellow with National Institute of Standards and Technology. This research won Dr.
Page 3.616.1
Phillips the 1997 Nobel Prize in physics. In his research, Dr. Phillips used LabVlEW to controlatom-cooling experiment.
_
LabVIEW[2]
LabVIEW is based on the graphical programming language G. A person can use LabVIEW withlittle programming experience. LabVlEW uses terminology, icons, and ideas familiar totechnicians, scientists, and engineers. It relies on graphical symbols rather than textual languageto describe functions.
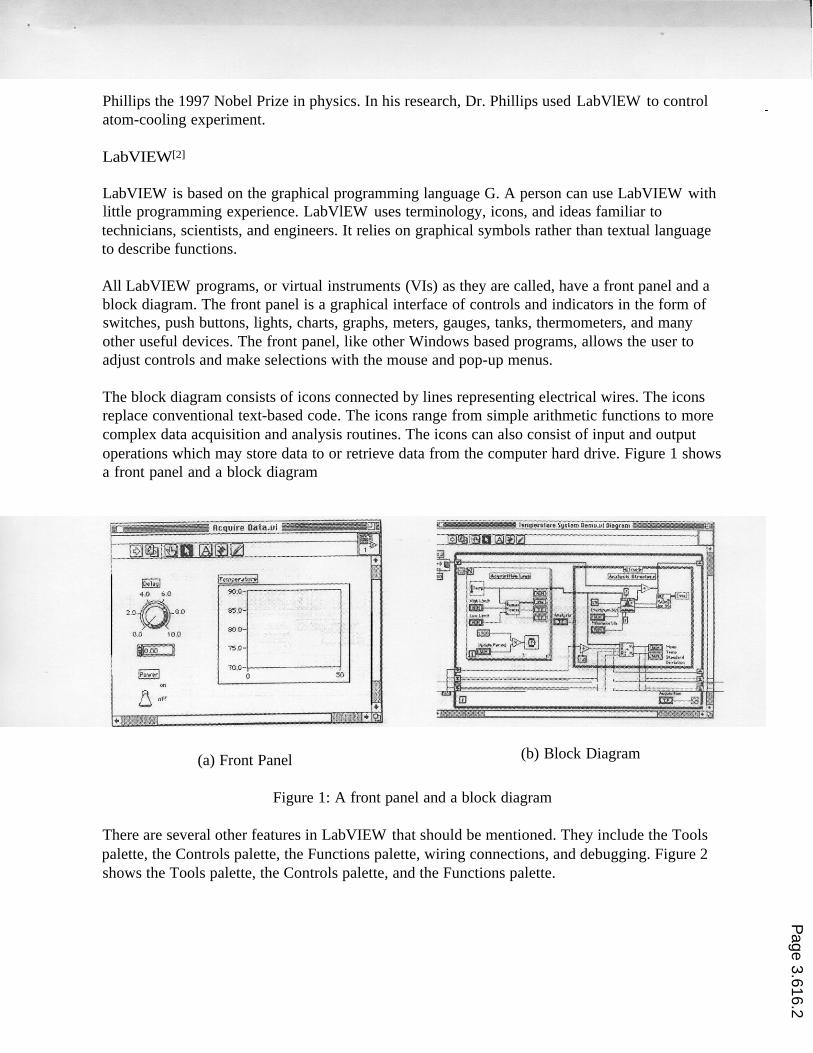
All LabVIEW programs, or virtual instruments (VIs) as they are called, have a front panel and ablock diagram. The front panel is a graphical interface of controls and indicators in the form ofswitches, push buttons, lights, charts, graphs, meters, gauges, tanks, thermometers, and manyother useful devices. The front panel, like other Windows based programs, allows the user toadjust controls and make selections with the mouse and pop-up menus.
The block diagram consists of icons connected by lines representing electrical wires. The iconsreplace conventional text-based code. The icons range from simple arithmetic functions to morecomplex data acquisition and analysis routines. The icons can also consist of input and outputoperations which may store data to or retrieve data from the computer hard drive. Figure 1 showsa front panel and a block diagram
(a) Front Panel (b) Block Diagram
Figure 1: A front panel and a block diagram
There are several other features in LabVIEW that should be mentioned. They include the Toolspalette, the Controls palette, the Functions palette, wiring connections, and debugging. Figure 2shows the Tools palette, the Controls palette, and the Functions palette.
Page 3.616.2
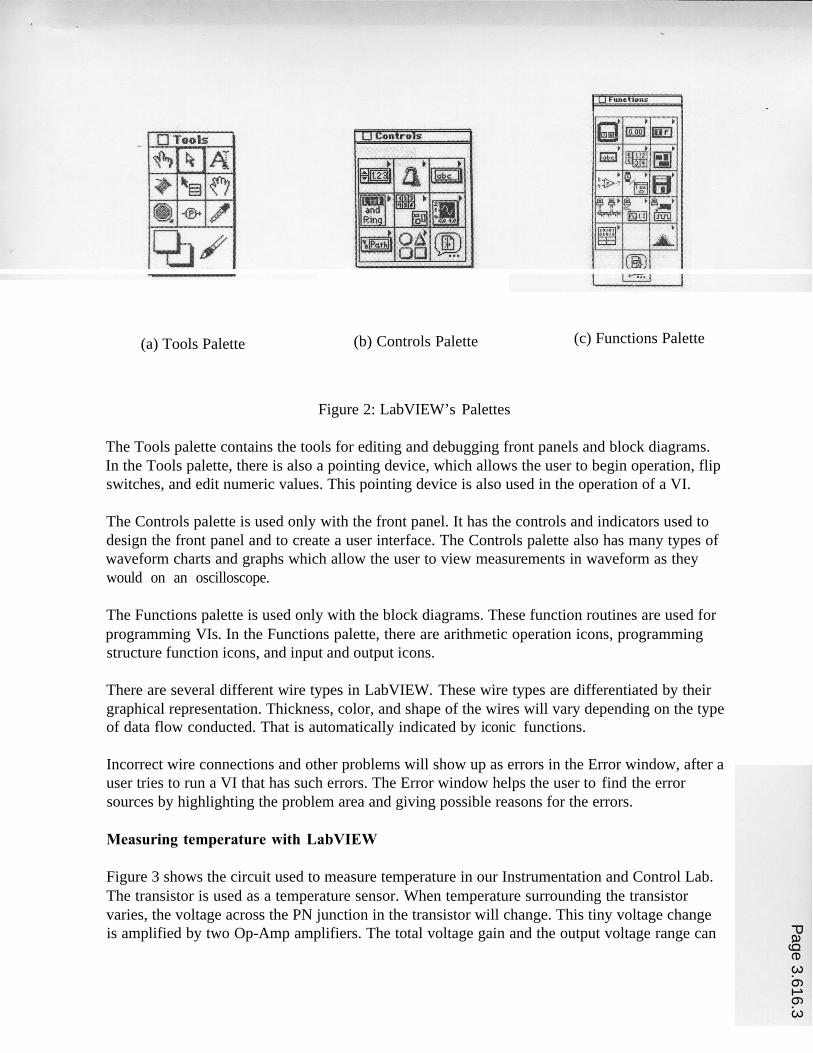
(a) Tools Palette (b) Controls Palette (c) Functions Palette
Figure 2: LabVIEW’s Palettes
The Tools palette contains the tools for editing and debugging front panels and block diagrams.In the Tools palette, there is also a pointing device, which allows the user to begin operation, flipswitches, and edit numeric values. This pointing device is also used in the operation of a VI.
The Controls palette is used only with the front panel. It has the controls and indicators used todesign the front panel and to create a user interface. The Controls palette also has many types ofwaveform charts and graphs which allow the user to view measurements in waveform as theywould on an oscilloscope.
The Functions palette is used only with the block diagrams. These function routines are used forprogramming VIs. In the Functions palette, there are arithmetic operation icons, programmingstructure function icons, and input and output icons.
There are several different wire types in LabVIEW. These wire types are differentiated by theirgraphical representation. Thickness, color, and shape of the wires will vary depending on the typeof data flow conducted. That is automatically indicated by iconic functions.
Incorrect wire connections and other problems will show up as errors in the Error window, after auser tries to run a VI that has such errors. The Error window helps the user to find the errorsources by highlighting the problem area and giving possible reasons for the errors.
Measuring temperature with LabVIEW
Figure 3 shows the circuit used to measure temperature in our Instrumentation and Control Lab.The transistor is used as a temperature sensor. When temperature surrounding the transistorvaries, the voltage across the PN junction in the transistor will change. This tiny voltage changeis amplified by two Op-Amp amplifiers. The total voltage gain and the output voltage range can
Page 3.616.3
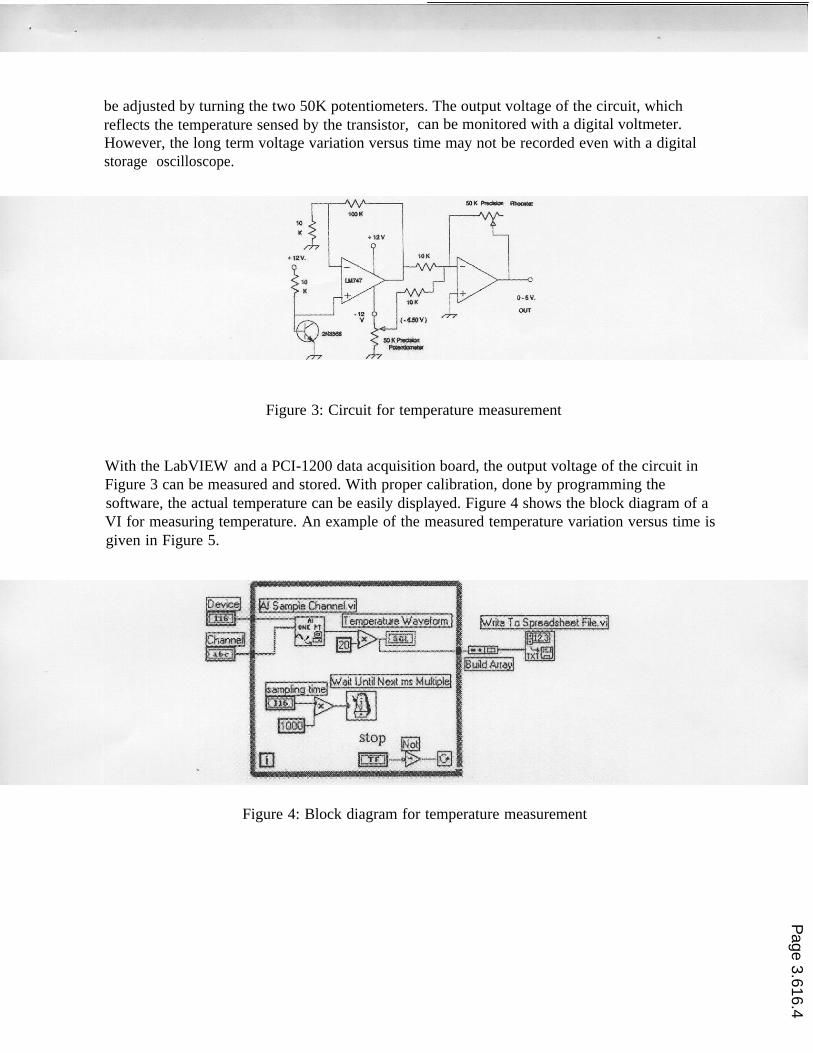
be adjusted by turning the two 50K potentiometers. The output voltage of the circuit, whichreflects the temperature sensed by the transistor, can be monitored with a digital voltmeter.However, the long term voltage variation versus time may not be recorded even with a digitalstorage oscilloscope.
Figure 3: Circuit for temperature measurement
With the LabVIEW and a PCI-1200 data acquisition board, the output voltage of the circuit inFigure 3 can be measured and stored. With proper calibration, done by programming thesoftware, the actual temperature can be easily displayed. Figure 4 shows the block diagram of aVI for measuring temperature. An example of the measured temperature variation versus time isgiven in Figure 5.
Figure 4: Block diagram for temperature measurement
Page 3.616.4
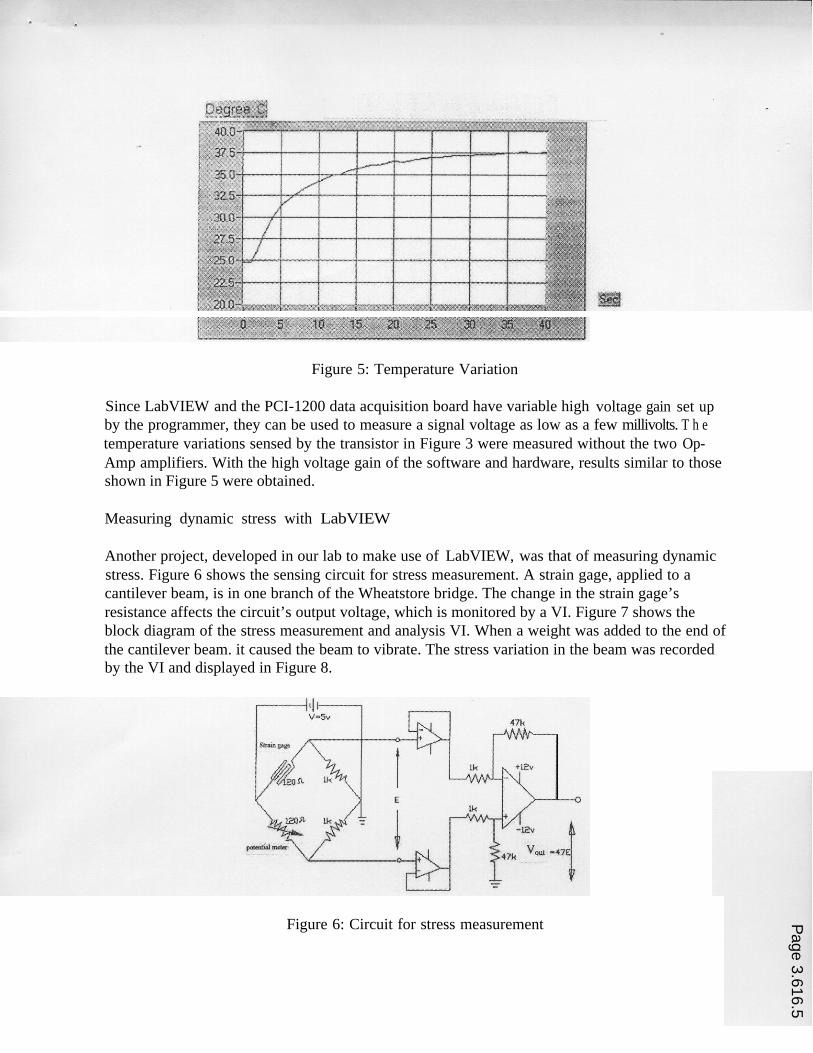
Figure 5: Temperature Variation
voltage gain set upuSince LabVIEW and the PCI-1200 data acquisition board have variable highby the programmer, they can be used to measure a signal voltage as low as a few millivolts. T h etemperature variations sensed by the transistor in Figure 3 were measured without the two Op-Amp amplifiers. With the high voltage gain of the software and hardware, results similar to thoseshown in Figure 5 were obtained.
Measuring dynamic stress with LabVIEW
Another project, developed in our lab to make use of LabVIEW, was that of measuring dynamicstress. Figure 6 shows the sensing circuit for stress measurement. A strain gage, applied to acantilever beam, is in one branch of the Wheatstore bridge. The change in the strain gage’sresistance affects the circuit’s output voltage, which is monitored by a VI. Figure 7 shows theblock diagram of the stress measurement and analysis VI. When a weight was added to the end ofthe cantilever beam. it caused the beam to vibrate. The stress variation in the beam was recordedby the VI and displayed in Figure 8.
Figure 6: Circuit for stress measurement Page 3.616.5
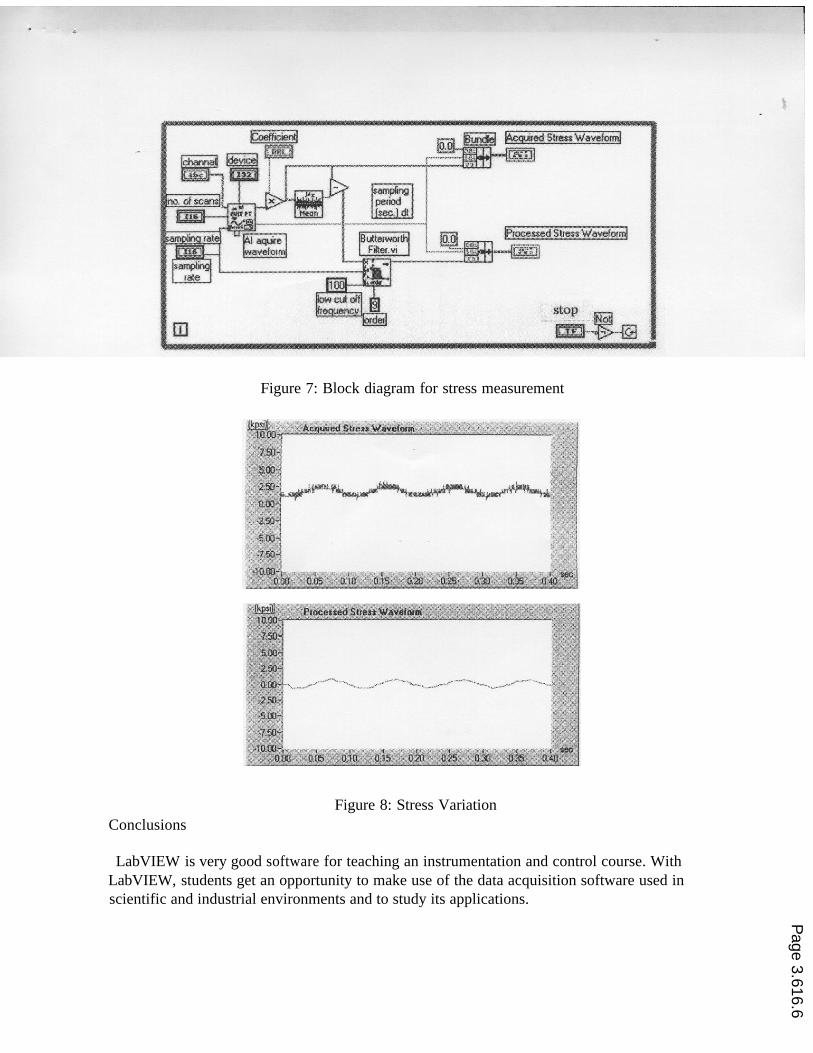
Figure 7: Block diagram for stress measurement
ConclusionsFigure 8: Stress Variation
LabVIEW is very good software for teaching an instrumentation and control course. WithLabVIEW, students get an opportunity to make use of the data acquisition software used inscientific and industrial environments and to study its applications.
Page 3.616.6
1. Business Wire, November 7, 1997.2. National Instruments: “LabVIEW User Manual”, 1996.
Biography
Dr. Chong Chen is an associate professor in the Department of Engineering Technology and Industrial Studies,Middle Tennessee State University. He received B.S. degree from Hebei Institute of Technology in China, M.S.degree from Tianjin University in China, and Ph.D. degree from University of Kentucky, all in ElectricalEngineering. Dr. Chen teaches electric circuits, electronics, controls, and industrial electricity. His research areasinclude controls, power electronics, electric machines, and electromagnetic fields. Dr. Chen is a ProfessionalEngineer registered in the State of Tennessee.
Page 3.616.7