Embed Size (px)
Citation preview
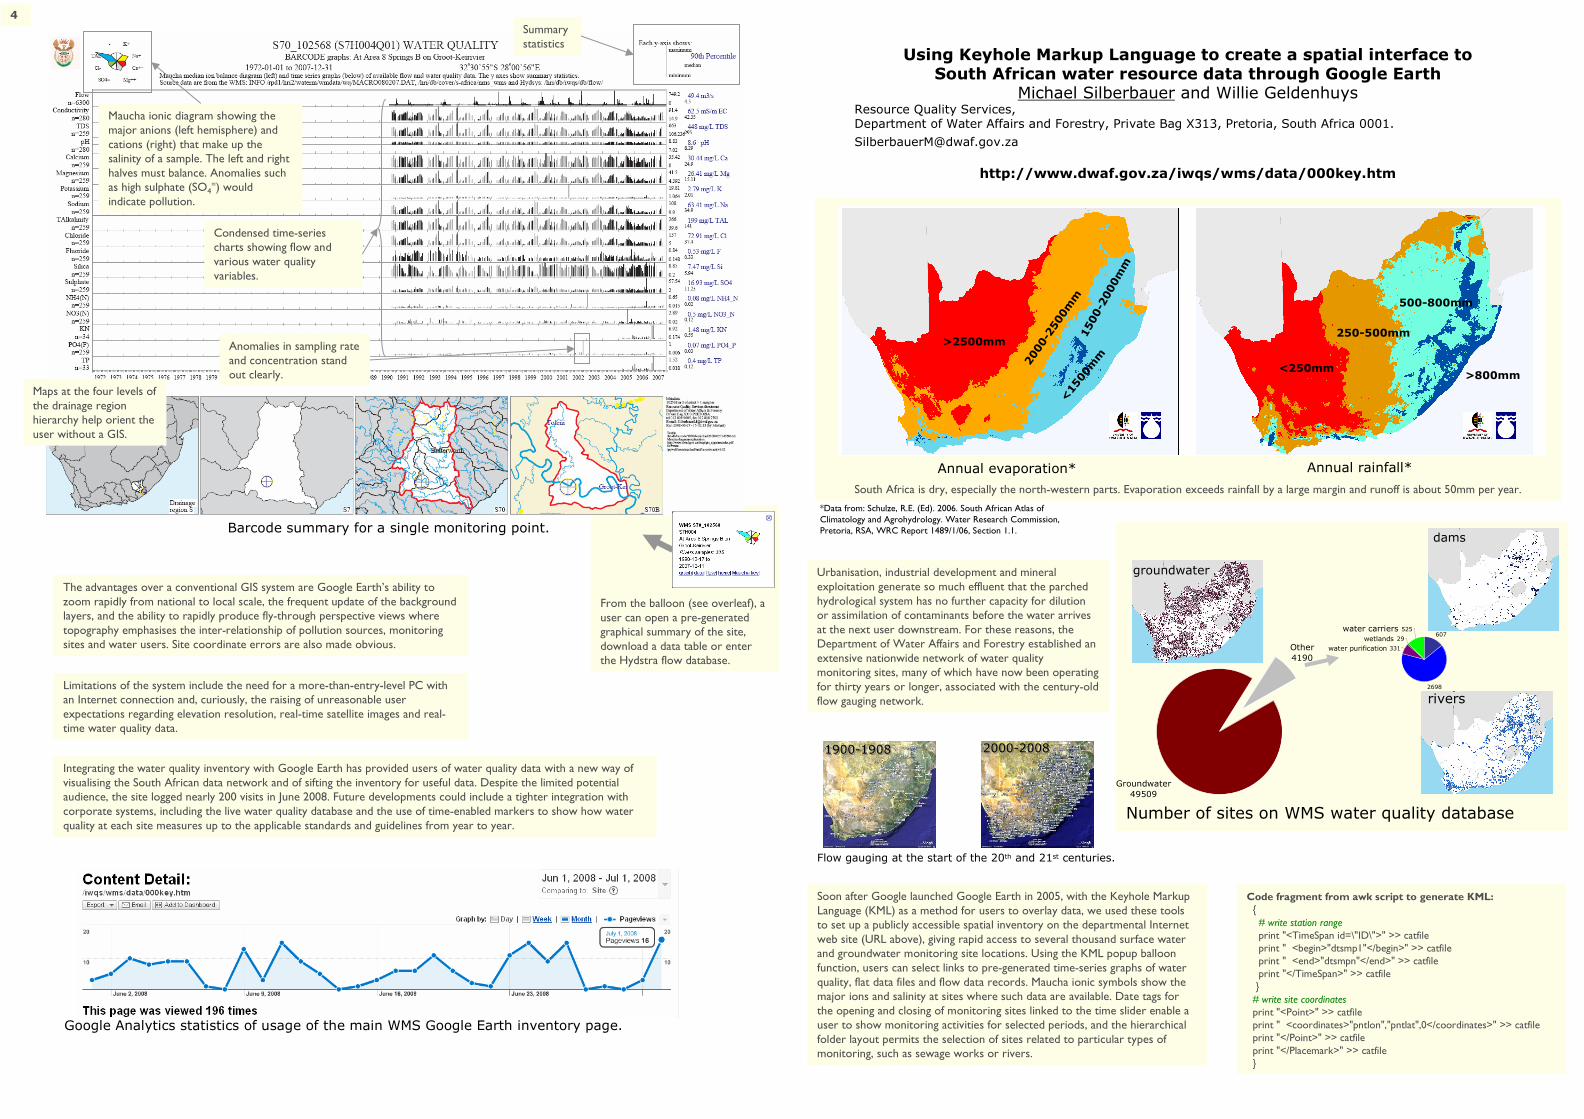
From the balloon (see overleaf), a user can open a pre-generated graphical summary of the site, download a data table or enter the Hydstra flow database.
Using Keyhole Markup Language to create a spatial interface to South African water resource data through Google Earth
Michael Silberbauer and Willie Geldenhuys Resource Quality Services, Department of Water Affairs and Forestry, Private Bag X313, Pretoria, South Africa 0001.
http://www.dwaf.gov.za/iwqs/wms/data/000key.htm
Code fragment from awk script to generate KML:{# write station rangeprint "<TimeSpan id=\"ID\">" >> catfileprint " <begin>"dtsmp1"</begin>" >> catfileprint " <end>"dtsmpn"</end>" >> catfileprint "</TimeSpan>" >> catfile}# write site coordinatesprint "<Point>" >> catfileprint " <coordinates>"pntlon","pntlat",0</coordinates>" >> catfileprint "</Point>" >> catfileprint "</Placemark>" >> catfile}
Annual evaporation* Annual rainfall*
Groundwater
49509
Other
4190
607
2698
331
29
525
Number of sites on WMS water quality database
water purification
water carriers
wetlands
Barcode summary for a single monitoring point.
Maucha ionic diagram showing the major anions (left hemisphere) and cations (right) that make up the salinity of a sample. The left and right halves must balance. Anomalies such as high sulphate (SO4
=) would indicate pollution.
Condensed time-series charts showing flow and various water quality variables.
Anomalies in sampling rate and concentration stand out clearly.
Summary statistics
Maps at the four levels of the drainage region hierarchy help orient the user without a GIS.
Google Analytics statistics of usage of the main WMS Google Earth inventory page.
Urbanisation, industrial development and mineral exploitation generate so much effluent that the parched hydrological system has no further capacity for dilution or assimilation of contaminants before the water arrives at the next user downstream. For these reasons, the Department of Water Affairs and Forestry established an extensive nationwide network of water quality monitoring sites, many of which have now been operating for thirty years or longer, associated with the century-old flow gauging network.
Soon after Google launched Google Earth in 2005, with the Keyhole Markup Language (KML) as a method for users to overlay data, we used these tools to set up a publicly accessible spatial inventory on the departmental Internet web site (URL above), giving rapid access to several thousand surface water and groundwater monitoring site locations. Using the KML popup balloon function, users can select links to pre-generated time-series graphs of water quality, flat data files and flow data records. Maucha ionic symbols show the major ions and salinity at sites where such data are available. Date tags for the opening and closing of monitoring sites linked to the time slider enable a user to show monitoring activities for selected periods, and the hierarchical folder layout permits the selection of sites related to particular types of monitoring, such as sewage works or rivers.
4
Integrating the water quality inventory with Google Earth has provided users of water quality data with a new way of visualising the South African data network and of sifting the inventory for useful data. Despite the limited potential audience, the site logged nearly 200 visits in June 2008. Future developments could include a tighter integration with corporate systems, including the live water quality database and the use of time-enabled markers to show how water quality at each site measures up to the applicable standards and guidelines from year to year.
The advantages over a conventional GIS system are Google Earth’s ability to zoom rapidly from national to local scale, the frequent update of the background layers, and the ability to rapidly produce fly-through perspective views where topography emphasises the inter-relationship of pollution sources, monitoring sites and water users. Site coordinate errors are also made obvious.
Limitations of the system include the need for a more-than-entry-level PC with an Internet connection and, curiously, the raising of unreasonable user expectations regarding elevation resolution, real-time satellite images and real-time water quality data.
rivers
dams
groundwater
Flow gauging at the start of the 20th and 21st centuries.
1900-19081900-1908 2000-20082000-2008
South Africa is dry, especially the north-western parts. Evaporation exceeds rainfall by a large margin and runoff is about 50mm per year.
<250mm
250-500mm
500-800mm
>800mm
>2500mm
2000-2500mm
1500-2000mm
<1500mm
*Data from: Schulze, R.E. (Ed). 2006. South African Atlas of Climatology and Agrohydrology. Water Research Commission, Pretoria, RSA, WRC Report 1489/1/06, Section 1.1.
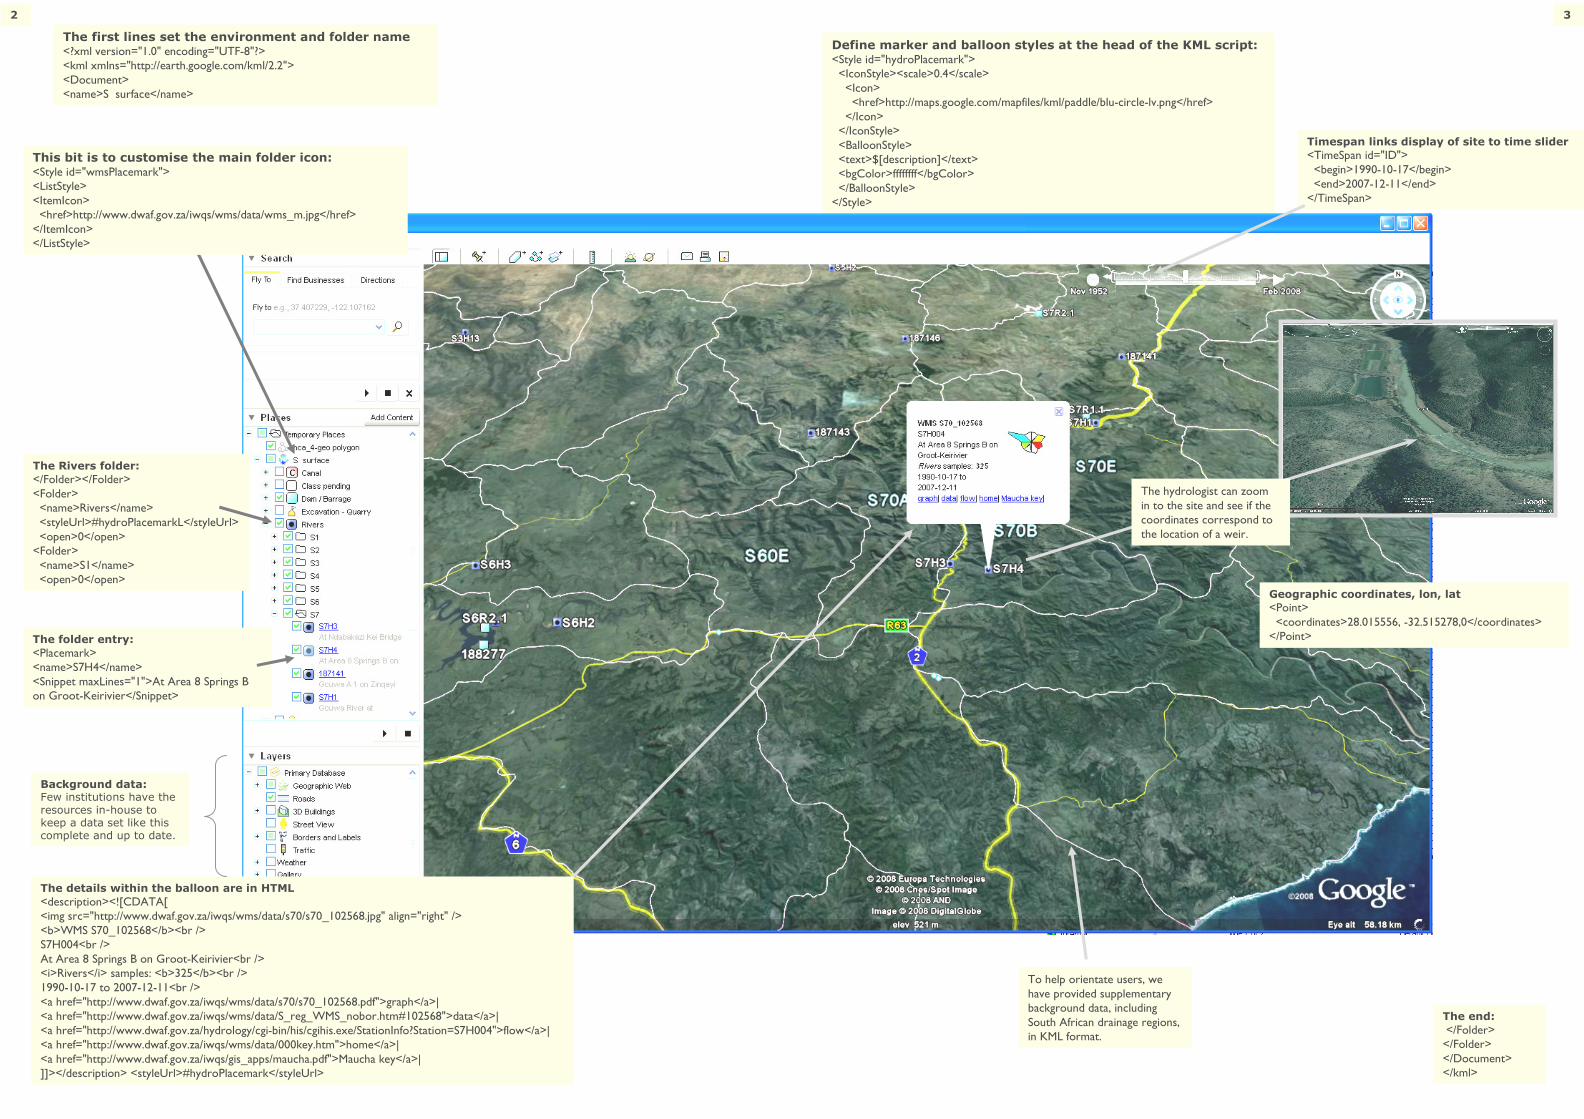
Define marker and balloon styles at the head of the KML script:<Style id="hydroPlacemark"><IconStyle><scale>0.4</scale><Icon><href>http://maps.google.com/mapfiles/kml/paddle/blu-circle-lv.png</href></Icon></IconStyle><BalloonStyle><text>$[description]</text><bgColor>ffffffff</bgColor></BalloonStyle></Style>
The folder entry:
<Placemark><name>S7H4</name><Snippet maxLines="1">At Area 8 Springs B on Groot-Keirivier</Snippet>
The hydrologist can zoom in to the site and see if the coordinates correspond to the location of a weir.
Timespan links display of site to time slider
<TimeSpan id="ID"><begin>1990-10-17</begin><end>2007-12-11</end></TimeSpan>
Geographic coordinates, lon, lat
<Point><coordinates>28.015556, -32.515278,0</coordinates></Point>
The Rivers folder:
</Folder></Folder><Folder><name>Rivers</name><styleUrl>#hydroPlacemarkL</styleUrl><open>0</open><Folder><name>S1</name><open>0</open>
The end:
</Folder></Folder></Document></kml>
2 3
To help orientate users, we have provided supplementary background data, including South African drainage regions, in KML format.
The details within the balloon are in HTML
<description><![CDATA[<img src="http://www.dwaf.gov.za/iwqs/wms/data/s70/s70_102568.jpg" align="right" /><b>WMS S70_102568</b><br />S7H004<br />At Area 8 Springs B on Groot-Keirivier<br /><i>Rivers</i> samples: <b>325</b><br />1990-10-17 to 2007-12-11<br /><a href="http://www.dwaf.gov.za/iwqs/wms/data/s70/s70_102568.pdf">graph</a>|<a href="http://www.dwaf.gov.za/iwqs/wms/data/S_reg_WMS_nobor.htm#102568">data</a>|<a href="http://www.dwaf.gov.za/hydrology/cgi-bin/his/cgihis.exe/StationInfo?Station=S7H004">flow</a>|<a href="http://www.dwaf.gov.za/iwqs/wms/data/000key.htm">home</a>|<a href="http://www.dwaf.gov.za/iwqs/gis_apps/maucha.pdf">Maucha key</a>|]]></description> <styleUrl>#hydroPlacemark</styleUrl>
Background data:Few institutions have the resources in-house to keep a data set like this complete and up to date.
This bit is to customise the main folder icon:<Style id="wmsPlacemark"><ListStyle><ItemIcon><href>http://www.dwaf.gov.za/iwqs/wms/data/wms_m.jpg</href></ItemIcon></ListStyle>
The first lines set the environment and folder name<?xml version="1.0" encoding="UTF-8"?><kml xmlns="http://earth.google.com/kml/2.2"><Document><name>S surface</name>