Embed Size (px)
Citation preview

12.0 0.0 12.0 8.9
7.18 7.18
9.20 9.20
8.60 8.60
6.40
5.00 5.00
6.40
6.80 6.80
6.20 6.20
Using Iterative Simulation to Incorporate Load-
Dependent Lead Times in Master Planning
Heuristics
1 University of Hagen, Germany Department of Mathematics and Computer Science
Chair of Enterprise-wide Software Systems
2 Infineon Technologies AG Munich, Germany
Thomas Ponsignon1,2
Lars Mönch1
WSC/MASM 2012, Berlin, Germany
12.0 0.0 12.0 8.9
7.18 7.18
9.20 9.20
8.60 8.60
6.40
6.20
6.40
6.80 6.80
6.20
5.00 5.00
Page 2
Agenda
17.12.2012
Problem Description
Related Literature
Iterative Simulation Approach
Simulation Model
Results of Computational Experiments
Conclusion & Next Steps
12.0 0.0 12.0 8.9
7.18 7.18
9.20 9.20
8.60 8.60
6.40
6.20
6.40
6.80 6.80
6.20
5.00 5.00
Page 3 17.12.2012
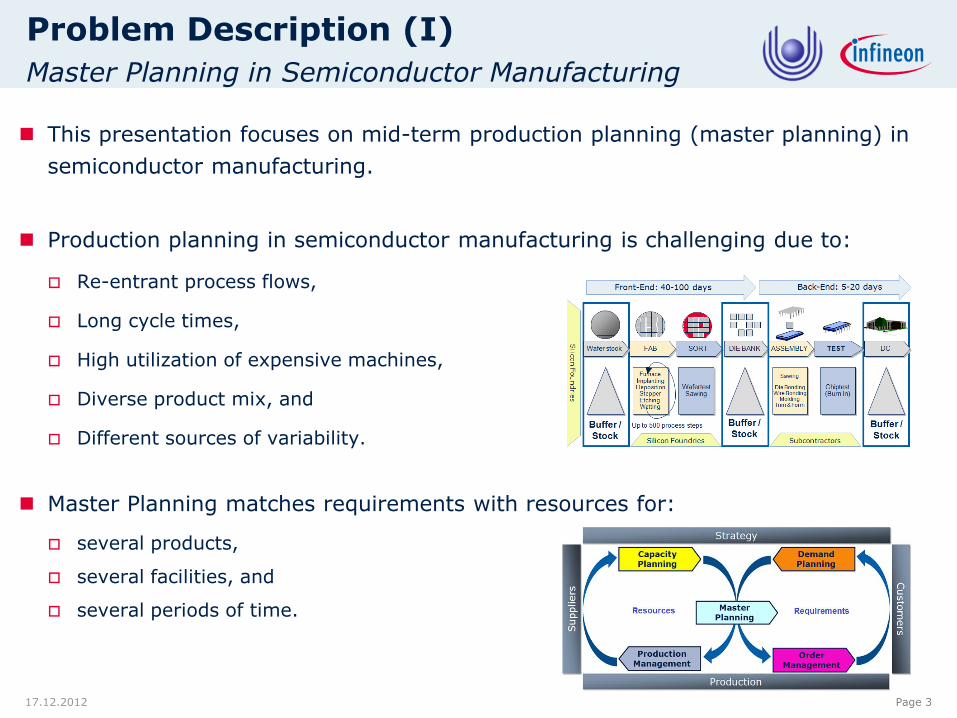
This presentation focuses on mid-term production planning (master planning) in
semiconductor manufacturing.
Master Planning matches requirements with resources for:
several products,
several facilities, and
several periods of time.
Production planning in semiconductor manufacturing is challenging due to:
Re-entrant process flows,
Long cycle times,
High utilization of expensive machines,
Diverse product mix, and
Different sources of variability.
Problem Description (I)
Master Planning in Semiconductor Manufacturing

12.0 0.0 12.0 8.9
7.18 7.18
9.20 9.20
8.60 8.60
6.40
6.20
6.40
6.80 6.80
6.20
5.00 5.00
Page 4 17.12.2012
A one-layer semiconductor manufacturing network of wafer fabs is considered.
The decision problem strives to:
Find an inexpensive assignment (incl. outsourcing) of wafer production quantities,
Minimize unmet firm orders,
Satisfy supply reservations if capacity is sufficient,
Keep the inventory level low accordingly, and
Limit production partitioning.
Problem Description (II)
Considered Decision Problem

12.0 0.0 12.0 8.9
7.18 7.18
9.20 9.20
8.60 8.60
6.40
6.20
6.40
6.80 6.80
6.20
5.00 5.00
Page 5 17.12.2012
Problem Description (III)
Planning Approaches & Motivation
A mixed-integer programming (MIP) formulation has been suggested.
The considered problem is proved to be NP-hard.
Efficient heuristic approaches were proposed:
Product-based decomposition scheme, genetic algorithm, rule-based assignment scheme.
A fixed product lead time is assumed as an exogenous, prescribed parameter.
Circularity in production planning:
The planning approach determines a release schedule based on a given lead time.
The cycle time of the lots depends on the release schedule.
Use an iterative optimization-simulation scheme and assess its convergence:
Planning Approach
Simulation Model
Production quantities, lot release schedule
Cycle time estimates
Lead times

12.0 0.0 12.0 8.9
7.18 7.18
9.20 9.20
8.60 8.60
6.40
6.20
6.40
6.80 6.80
6.20
5.00 5.00
Page 6
Agenda
17.12.2012
Problem Description
Related Literature
Iterative Simulation Approach
Simulation Model
Results of Computational Experiments
Conclusion & Next Steps

12.0 0.0 12.0 8.9
7.18 7.18
9.20 9.20
8.60 8.60
6.40
6.20
6.40
6.80 6.80
6.20
5.00 5.00
Page 7 17.12.2012
Two iterative linear programming-simulation schemes:
Hung, Y.-F., R. C. Leachman (1996) “A Production Planning Methodology for Semiconductor Manufacturing Based on Iterative
Simulation and Linear Programming Calculations”, IEEE Transactions on Semiconductor Manufacturing, 9(2): 257-269.
Kim, B., S. Kim (2001) “Extended Model for a Hybrid Production Planning Approach”, International Journal of Production
Economics, 73(2):65-173.
Discussion on the convergence of both schemes when used for prod. planning in wafer fabs:
Irdem, D. F., N. B. Kacar, R. Uzsoy (2010) “An Exploratory Analysis of Two Iterative Linear Programming–Simulation
Approaches for Production Planning”, IEEE Transactions on Semiconductor Manufacturing, 23(3): 442-455.
Iterative simulation scheme in a supply chain context:
Almeder, C., M. Preusser, R. F. Hartl (2009) “Simulation and Optimization of Supply Chains: Alternative or Complementary
Approaches?”, OR Spectrum, 31(1): 95-119.
Clearing functions as an alternative approach:
Missbauer, H., R. Uzsoy (2011) “Optimization Models of Production Planning Problems”, In Planning Production and
Inventories in the Extended Enterprise: A State of the Art Handbook, Vol. 1, K. G. Kempf, P. Keskinocak, R. Uzsoy (eds),
Springer, 437-507.
Comparison of clearing function and iterative linear programming-simulation approaches for
production planning in a scaled-down wafer fab:
Kacar, N. B., D. F. Irdem, and R. Uzsoy, R. 2012. “An Experimental Comparison of Production Planning Using Clearing
Functions and Iterative Linear Programming-Simulation Algorithms.” IEEE Transactions on Semiconductor Manufacturing,
25(1):104-107.
Related Literature
12.0 0.0 12.0 8.9
7.18 7.18
9.20 9.20
8.60 8.60
6.40
6.20
6.40
6.80 6.80
6.20
5.00 5.00
Page 8
Agenda
17.12.2012
Problem Description
Related Literature
Iterative Simulation Approach
Simulation Model
Results of Computational Experiments
Conclusion & Next Steps

12.0 0.0 12.0 8.9
7.18 7.18
9.20 9.20
8.60 8.60
6.40
6.20
6.40
6.80 6.80
6.20
5.00 5.00
Page 9 17.12.2012
Simulation-based architecture:
A blackboard-like data layer keeps track on completed lots and collects cycle time statistics.
A smoothing parameter is used to determine how much cycle time information from
the simulation is taken into account.
No convergence criterion is used, but a maximum number of iterations.
Iterative Simulation Approach
- Initialize the index of iterations . - Initialize lead times using preliminary simulation runs. - Repeat until last iteration is reached: - Solve production planning problem using . - Derive lot release schedule . - Perform three independent simulation runs based on . - Estimate cycle times . - Update lead times as follows: - Round up lead times to next integer. - Increment index of iterations . - End repeat.
Set of lead times and cycle times at the -th iteration:
Iterative simulation scheme:
.
,
.

12.0 0.0 12.0 8.9
7.18 7.18
9.20 9.20
8.60 8.60
6.40
6.20
6.40
6.80 6.80
6.20
5.00 5.00
Page 10
Agenda
17.12.2012
Problem Description
Related Literature
Iterative Simulation Approach
Simulation Model
Results of Computational Experiments
Conclusion & Next Steps

12.0 0.0 12.0 8.9
7.18 7.18
9.20 9.20
8.60 8.60
6.40
6.20
6.40
6.80 6.80
6.20
5.00 5.00
Page 11 17.12.2012
Base system:
32 products can be manufactured in each of four parallel wafer fabs.
One single bottleneck is considered per wafer fab (photolithography).
The capacity is equally distributed across the wafer fabs.
The single source of variability is the unplanned downtime at the bottleneck (MTTR, MTTF).
Base process:
Each of the 25=32 process flows is a unique combination of 2*5 sub-flows from a simplified
variant of MIMAC-I data set.
Each product has the same raw process time in each wafer fab.
Model reduction to decrease the computational effort:
Operations related to non-bottleneck machines are replaced by stochastic delays (gamma
distribution) based on average waiting and processing times obtained from a detailed
model (cf. Hung and Leachman, 1999).
Implementation:
Simulator: AutoSched AP; Blackboard and other modules: C++.
30 iterations of a single simulation run require 25 min (2.5 GHz dual processor, 2.0 GB).
Simulation Model

12.0 0.0 12.0 8.9
7.18 7.18
9.20 9.20
8.60 8.60
6.40
6.20
6.40
6.80 6.80
6.20
5.00 5.00
Page 12
Agenda
17.12.2012
Problem Description
Related Literature
Iterative Simulation Approach
Simulation Model
Results of Computational Experiments
Conclusion & Next Steps

12.0 0.0 12.0 8.9
7.18 7.18
9.20 9.20
8.60 8.60
6.40
6.20
6.40
6.80 6.80
6.20
5.00 5.00
Page 13
Initial lead time settings:
Overestimated lead time: +1 planning period,
Underestimated lead time: -1 planning period.
Demand level settings:
Low: avg. capacity utilization =54%,
High: avg. capacity utilization = 92%.
In total, 1620 simulation runs are carried out.
17.12.2012
Results of Computational Experiments (I)
Design of Experiments
12.0 0.0 12.0 8.9
7.18 7.18
9.20 9.20
8.60 8.60
6.40
6.20
6.40
6.80 6.80
6.20
5.00 5.00
Page 14 17.12.2012
Results of Computational Experiments (II)
Convergence of the Iterative Scheme
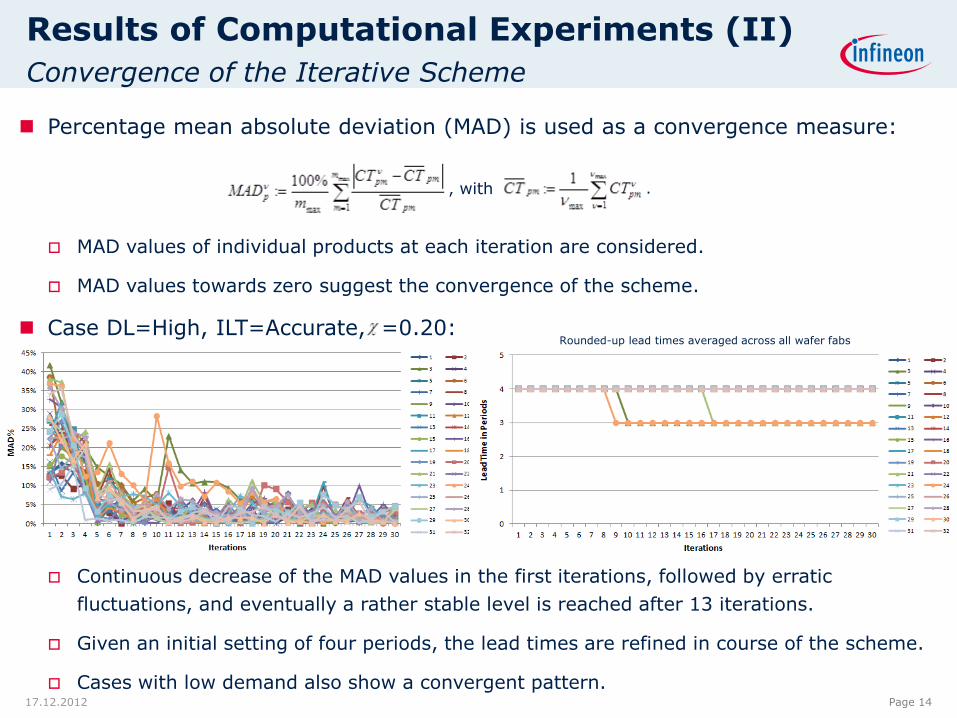
Percentage mean absolute deviation (MAD) is used as a convergence measure:
MAD values of individual products at each iteration are considered.
MAD values towards zero suggest the convergence of the scheme.
Case DL=High, ILT=Accurate, =0.20:
Continuous decrease of the MAD values in the first iterations, followed by erratic
fluctuations, and eventually a rather stable level is reached after 13 iterations.
Given an initial setting of four periods, the lead times are refined in course of the scheme.
Cases with low demand also show a convergent pattern.
Rounded-up lead times averaged across all wafer fabs
. , with

12.0 0.0 12.0 8.9
7.18 7.18
9.20 9.20
8.60 8.60
6.40
6.20
6.40
6.80 6.80
6.20
5.00 5.00
Page 15 17.12.2012
Results of Computational Experiments (III)
Convergence of the Iterative Scheme
Case DL=High, ILT=Underestimated, =0.20:
Despite an initial bias, the iterative scheme seems to converge (similar with overest. LT).
Case DL=High, ILT=Accurate, =0.50:
Steep decrease in first iterations, and lead time changes occur earlier. =0.50 expedites the
convergence of the scheme ( =1.00 shows high fluctuations and no convergent pattern).
12.0 0.0 12.0 8.9
7.18 7.18
9.20 9.20
8.60 8.60
6.40
6.20
6.40
6.80 6.80
6.20
5.00 5.00
Page 16 17.12.2012
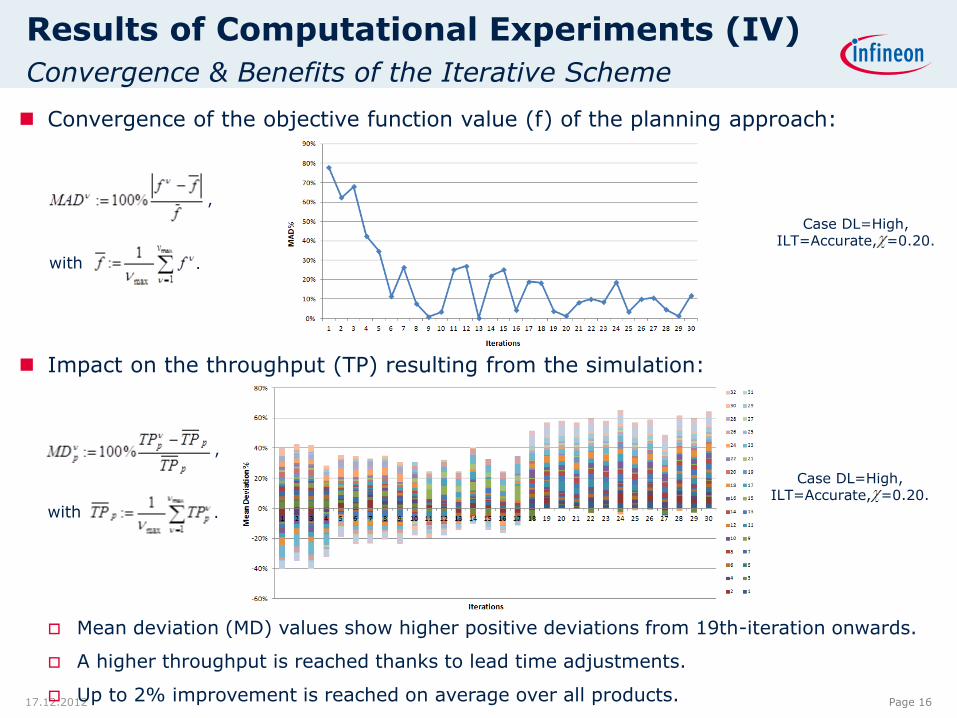
Results of Computational Experiments (IV)
Convergence & Benefits of the Iterative Scheme
Convergence of the objective function value (f) of the planning approach:
Impact on the throughput (TP) resulting from the simulation:
Mean deviation (MD) values show higher positive deviations from 19th-iteration onwards.
A higher throughput is reached thanks to lead time adjustments.
Up to 2% improvement is reached on average over all products.
Case DL=High, ILT=Accurate, =0.20.
Case DL=High, ILT=Accurate, =0.20.
,
with .
,
with .

12.0 0.0 12.0 8.9
7.18 7.18
9.20 9.20
8.60 8.60
6.40
6.20
6.40
6.80 6.80
6.20
5.00 5.00
Page 17
Agenda
17.12.2012
Problem Description
Related Literature
Iterative Simulation Approach
Simulation Model
Results of Computational Experiments
Conclusion & Next Steps
12.0 0.0 12.0 8.9
7.18 7.18
9.20 9.20
8.60 8.60
6.40
6.20
6.40
6.80 6.80
6.20
5.00 5.00
Page 18 17.12.2012
Conclusion & Next Steps
An iterative simulation scheme has been proposed to deal with load-dependent
lead times in master planning heuristics.
A reduced simulation model has been used that mimics a one-layer semiconductor
manufacturing network of wafer fabs.
Some computational experiments showed that the scheme converges after a small
number of iterations.
Less variable, more profitable production plans are obtained than with the fixed
lead time approach.
Next Steps:
Apply the iterative scheme using more sophisticated master planning heuristics
(e.g., genetic algorithm).
Investigate the usage of a compact simulation model (cf. Ehm et al., 2011) to
replace the reduced simulation model.


![[RVLCN]-Masm Radasm Cap I](https://img.pdfslide.us/doc/110x75/577cc3851a28aba711963fa6/rvlcn-masm-radasm-cap-i.jpg)