Embed Size (px)
Citation preview
USING INQUIRY-BASED LAB ACTIVITIES TO INCREASE STUDENT INTEREST
AND ACTIVE PARTICIPATION IN LEARNING SCIENCE
by
Jean Philip Christian Mathot
A professional paper submitted in partial fulfillment of the requirements for the degree
of
Master of Science
in
Science Education
MONTANA STATE UNIVERSITY Bozeman, Montana
June, 2009
i
STATEMENT OF PERMISSION TO USE
In presenting this professional paper in partial fulfillment of the requirements for
a master’s degree at Montana State University, I agree that the MSSE Program shall
make it available to borrowers under rules of the program.
Jean Philip Christian Mathot June, 2009
ii
TABLE OF CONTENTS
I. INTRODUCTION……………………………………… 1
II. FOCUS QUESTION..………….………………………. 2
III. SUPPORT TEAM..…………………………………….. 3
IV. LITERATURE REVIEW….…………………………… 3
V. TREATMENT…..………….…………………………... 8
VI. METHODS………………………......................………. 14
VII. DATA ANALYSIS…………..…….…………………… 20
VIII. CONCLUSION………………………………….……… 39
IX. WORKS CITED..………………………………………. 45 APPENDICES………………………………………….. 47
APPENDIX A Likert Attitude Surveys……….……………… 49
APPENDIX B: Permission to Interview Letter.…….………… 55
APPENDIX C: Interview Questions……………..…...……… 57
APPENDIX D: California State Science Standards….….…… 59
APPENDIX E: SK8 Motion Lab …………………..………… 61 Hot Wheels Motion Lab …………..………… 63
APPENDIX F: Sublime Lab………………………………….. 67 Amorphous Blob Lab………………………… 69 Build A Boat…………………………………. 71
APPENDIX G: Exothermic Endothermic Lab...……….……… 75 Making Silver out of Falling Snow…………... 78 I Hope It Floats Lab….……………………..... 82
APPENDIX H: Notebook Grading Rubric………..…….…….. 85
iii
TABLE OF CONTENTS – CONTINUED
APPENDIX I:
Cookbook vs. Inquiry-based Lab Assessment... 87 APPENDIX J:
Pre Treatment Data Table …..………….…….. 90 Post Treatment Data Table……………………. 91
iv
LIST OF TABLES
1. Pretreatment and Treatment Labs …………………...……………………... 9
2. Methods for Data Collection……………………………………………….. 16
3. Timeline for Data Collection……………………………………………….. 16
4. Student Attitude Survey Results – Pre-Treatment…………………………. 90
5. Student Attitude Survey Results – Post-Treatment………..………………. 91
v
LIST OF FIGURES
1. Figure 1: (Likert Attitude Survey Results – Attitudes Towards Science)…... 21
2. Figure 2: (Pre and Post Likert Attitude Survey Results – Attitudes Towards
Learning)…………………………………………………………….………. 23
3. Figure 3: (Lab Preference – Pre- and Post-Treatment )…………………….... 24
4. Figure 4: (Student Interviews – Involvement and Interest in Lab Activities)... 25
5. Figure 5: (Post Treatment Survey – Student preference for Cookbook vs. Inquiry–
Based Labs)…………………………………………………………………… 25
6. Figure 6: (Student Interview – Post-Lab Questions vs. Science Journal)……. 30
7. Figure 7: (Student Notebook Scores)………………………………………… 32
8. Figure 8: (IOLA Pre-Test and Post-Test Averages)…………………………. 33
9. Figure 9: (IOLA Test Scores Comparing Inquiry vs. Non-Inquiry-Based
Classes)……………………………………………………………………….. 34
10. Figure 10: (Inquiry-based vs. Cookbook Lab Assessment Results)……….…. 35
11. Figure 11: (Student Post Treatment Survey – Student Preferences) ………… 38
vi
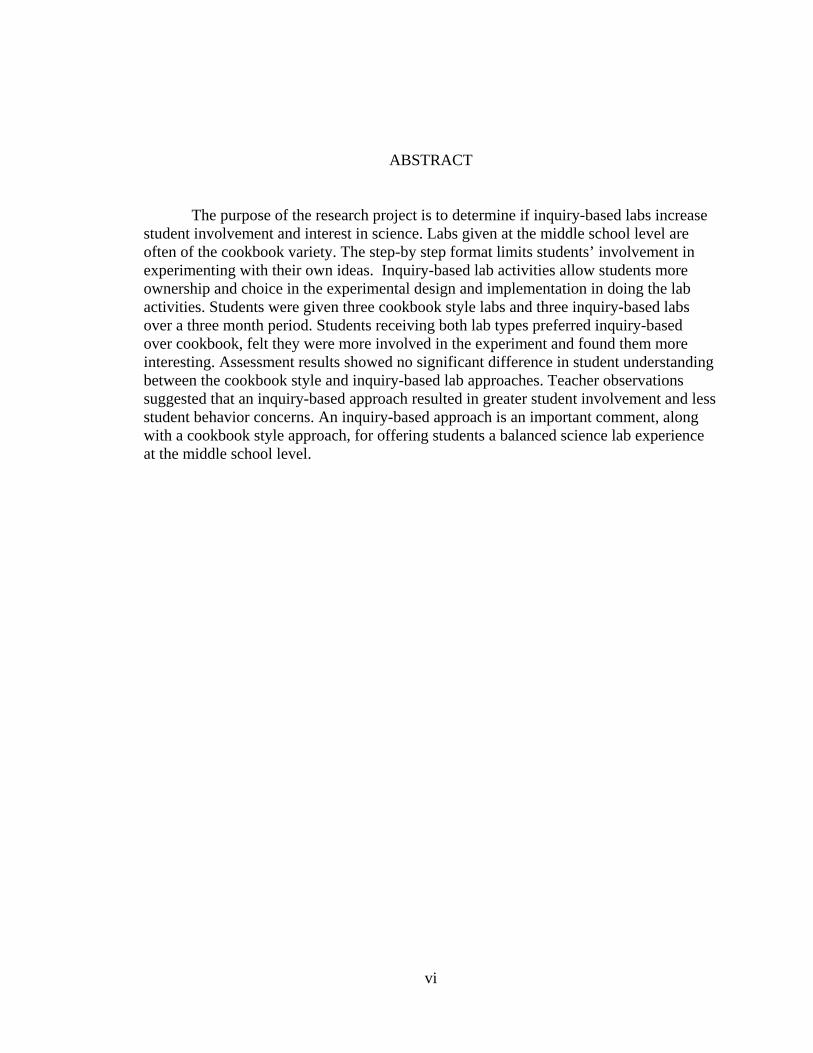
ABSTRACT
The purpose of the research project is to determine if inquiry-based labs increase student involvement and interest in science. Labs given at the middle school level are often of the cookbook variety. The step-by step format limits students’ involvement in experimenting with their own ideas. Inquiry-based lab activities allow students more ownership and choice in the experimental design and implementation in doing the lab activities. Students were given three cookbook style labs and three inquiry-based labs over a three month period. Students receiving both lab types preferred inquiry-based over cookbook, felt they were more involved in the experiment and found them more interesting. Assessment results showed no significant difference in student understanding between the cookbook style and inquiry-based lab approaches. Teacher observations suggested that an inquiry-based approach resulted in greater student involvement and less student behavior concerns. An inquiry-based approach is an important comment, along with a cookbook style approach, for offering students a balanced science lab experience at the middle school level.
1
INTRODUCTION
From the first day that children start their educational journey teachers have been there to
help them answer the questions they do not know how to answer. Early on, educators give
children some crayons, paper, glittery glue, scissors and the freedom to create whatever they
want on those pieces of paper. As students move through the educational system, the crayons are
replaced by pens and pencils, scissors and glue by textbooks. The teacher no longer says “create
whatever you want,” but tells the students to follow the directions and fill in the blanks.
Somewhere along the way students learn that there is one best answer: the one that the teacher
marks correct. The freedom to explore and imagine is not as prized as correct answers. School
stops being a place of wonder and interest and instead becomes a place that requires following
the directions to find the right answers. Students are increasingly directed towards shedding
their drive to explore in exchange for papers that give them the directions on how to exactly do
the work. Thinking “outside the box” has been squeezed from the classroom by the pressure
placed on students to have the correct answers. It is important that students see that asking,
“what if” and seeing “what happens” can be just as important as finding the right answers.
One of the more important goals of education is developing the love of learning in
students. It is important to instill that they are life-long learners. This can happen if learning
encourages students to explore, challenging them to answer their own questions that arise as they
learn. Cookbook style labs do not seem to encourage a love for learning or challenge students to
explore new ideas. The path the student takes has already been laid. All that is needed is for
directions to be followed and post-lab questions to be answered. Inquiry-based lab activities
move away from the pre-laid path and into the “what if” or “let me try this” mindset. That is the
2
place where students need to be able to visit so they can really enjoy learning about and using
science. These are the type of experiences that allow students to become life-long learners.
Many middle school lab activities are often of the cookbook variety. This step-by-step
approach requires little thought nor encourages students to think of “what if” as they conduct and
complete the assigned activity. It seems that students are more concerned with getting the right
answer than exploring the possibilities for discovery. The thinking mind is turned off and the
imagination to explore dimmed so that labs can walk the student to the correct results with
neither risk, nor reward. The motivation and ability to explore is lost in the directions. The
excitement and allure of thinking and testing the “what ifs” are quelled. Inquiry-based lab
activities are the torch that reignites students’ interest in doing and exploring the world around
them.
FOCUS QUESTION
What is the impact inquiry-based lab activities have when they are used to teach physical
science to eighth grade middle school students? The sub questions for this project are:
1. Do inquiry-based lab activities encourage student involvement and interest in doing
science lab activities?
2. What is the impact of cookbook style lab activities compared to inquiry-based?
3. What is the nature of understanding and learning of inquiry-based labs?
4. What is the impact on the teacher when an inquiry-based lab approach is used?
3
SUPPORT TEAM
I have selected three individuals to be my support team for my AR project. Two of the
individuals are teachers that work with me at Sierra Vista Middle School in Irvine, CA. The
third member of my support team is my father.
Kathy Marvin is an amazing science teacher at our school who also teaches physical
science to 8th grade students. She is part of my support team because she has an amazing gift in
developing curriculum, creating lessons that get students engaged in hands-on science, and
teaching experience in inquiry based science.
Christina Ralston teaches language arts at our school. She is part of my support team to
assist me with proof reading, including the grammar and format for my paper. She is very
meticulous and will help to keep my paper professional and free from errors.
Last in my support team will be my dad Christian. He has a Ph.D in Physical Chemistry.
He has published many papers in leading scientific journals and can advise me on what should
and should not be part of my project paper.
Additional support and advice will come from Dr. Walt Woolbaugh and my project
reader Dr. Jeff Adams.
LITERATURE REVIEW
This section starts with a description of what inquiry is and what it looks like in the
classroom. A review of the literature illustrates the benefits an inquiry-based approach brings to
students learning science. These benefits to student understanding, learning, and motivation are
discussed and referenced from past studies. A description of the more traditional cookbook lab
approach is given along with the concerns that come along with this type of lab activity. Two
4
published studies help to support the belief that students benefit from inquiry-based instruction.
There are many positives that come from this approach, but some concerns mentioned in other
studies are listed at the end of this section.
An understanding of inquiry-based science is necessary to understand how this approach
teaches science in a more involved and meaningful way. Llewellyn (2002) defines inquiry as,
“…the science, art, and spirit of imagination. It can be defined as the
scientific process of active exploration by which we use critical, logical,
and creative thinking skills to raise and engage in questions of personal
interests” (p. 16).
Inquiry-based science is “hands-on, minds-on science exploration” (Humprhey, 1995).
Students engaged in inquiry-based exhibit many of the following characteristics (Humprhey,
1995):
• Children view themselves as scientists in the process of learning.
• Children accept an "invitation to learn" and readily engage in the exploration
process.
• Children plan and carry out investigations.
• Children communicate using a variety of methods.
• Children propose explanations and solutions and build a store of concepts.
• Children raise questions
• Children use observation.
• Children critique their own science practices.
Inquiry-based instruction begins with the formation of a question or introduction of a
problem that needs to be solved. Students then develop a way to investigate or explore possible
5
solutions that help answer the question or resolve the problem. Data are then collected and
analyzed to help draw conclusions. This process is repeated until a connection can be formed
between current understanding, new discoveries, and prior knowledge.
Problem-based learning (PBL) is an inquiry-based strategy that presents students with a
problem that needs to be answered with experimentation and implementation. In this type of
inquiry-based approach, students take responsibility for accessing information, developing
hypothesis, collecting and using data to produce conclusions based on evidence and reasoning
(Sungur & Tekkaya, 2006). According to Karabulut (2002), this type of learning creates an
environment in which students actively participate in the learning process, initiate their own
learning, learn time management skills, identify impediments to solving problems, and access
resources. PBL improves critical thinking, communication, mutual respect, teamwork,
interpersonal skills, and students’ interest in science (Sungur & Tekkaya, 2006).
Students learn science by hearing, doing, and exploring concepts. Gerber, Cavallo, and
Marek (2001) break down the three key components that allow students to learn science at
school: exploration, term introduction, and concept application. In exploration, students
participate in labs that allow them to test ideas, conduct experiments, and collect data. Term
introduction expands student understanding of key concepts and ideas allowing them to better
understand and utilize collected data. Concept application requires the student to use data to
draw conclusions or to answer questions in other learning situations. An inquiry-based approach
allows all three components to occur, which allows students to better learn and enjoy science.
Ancillary materials provided with science textbooks include a majority of labs that have
step-by-step instructions (Peters, 2005). These lab activities are termed cookbook labs because
students are given step-by step instructions (the recipe) to carry out the experiment to obtain the
6
predetermined outcome (Volkmann & Abell, 2003). Lord and Orkwiszewski (2006) noted that
the “cookbook” method is common in schools, but very little information is learned by students
who plug in the results from the lab into the prepared lab questions.
Inquiry based labs have a far different outcome in student learning. Lord and
Orkwiszewski (2006) claim, ”Inquiry learning instills higher understanding than simply
following step-by-step instructions on a series of lab book pages” (p. 342). It seems that students
are able to discuss what procedures to utilize, the controls and variables involved in the
experiment and the formulation of valid conclusions (Marbach-Ad & Sokolove, 2000). Students
need to be active participants in the learning process. By giving students step-by-step
instructions, they are passively learning the material. If students are not given the opportunity to
experience inquiry learning, they will mentally tune out, passively awaiting the end of class with
little critical thinking taking place (Lord & Orkwiszewski, 2006).
Benefits of an inquiry-based approach have been observed in other studies. In 2003,
Tretter conducted a study of 255 high school physical science students and found that the group
exposed to inquiry-based labs were more engaged in the course throughout its duration, less
likely to give up in the class (11% of inquiry students vs. 29% for non-inquiry), and their
attitudes towards the study of physical science improved. A 2005 study by Sungur & Tekkaya
involved 61 high school biology students exposed to a PBL or a traditional instructional
approach. Those students that were taught using a PBL reported science as being more
interesting, important, and useful compared to students instructed in the traditional teaching
approach.
For more than a half century, there has been discussion on whether instructional based
(cookbook) labs are better for increasing student learning and understanding compared to open
7
inquiry-based (minimally guided) labs. Educators during the 1950s and 1960s suggested that
students would learn best in an unguided or minimalist type environment (Mayer, 2004). This
viewpoint has been put into practice by many educators, even though it may not always be the
best method for student learning. Kirschner, Sweller, and Clark (2006) suggest that current
knowledge of human cognitive architecture shows that minimally guided instruction is likely to
be ineffective. They advocate for educators to stop using discovery type labs and implement
activities that guide students through the experimental and learning process. Inquiry should not
be geared towards throwing students into a lab activity, expecting them to know what they
should explore or learn from the activity themselves. For an inquiry-based approach to be
beneficial to student learning, educators must decide what the learning objectives are for the
activity and how to best guide the students towards these learning outcomes.
Both cookbook and inquiry-based labs have their place in the science classroom. The
concern is not which is the best method for doing lab activities; but which method engages
students when conducting science activities, encourages students to try out ideas, and address
their own questions that arise when immersed in learning science. Llewellyn (2002) describes
inquiry learning as, “…empowering students with the skills and knowledge to become
independent, lifelong learners that are accustomed to finding answers to their own problems
through the process of discovery” (p. 10). Students that learn by this approach perceive science
as more interesting, important, and useful. These beliefs are held by students that are taught
using inquiry compared to a cookbook instructional approach (Tretter & Jones, 2003; Sungur &
Tekkaya, 2006).
Research has shown the value and worth of inquiry-based instruction. Students are
invited to become the scientist and see how science is really done. They are allowed to be active
8
in their learning, instead of bystanders as with cookbook style labs. An inquiry-based approach
allows students to develop a richer, deeper understanding of the concepts and materials they are
learning (Smolleck & Yoder, 2006). Learning science requires interacting with the concepts and
material on a personal level. A majority of this hands-on interaction is through cookbook style
labs. Studies have shown that this type of lab approach alone may not be the most suitable for
helping students to learn science or pique student interest in learning the material (Lord and
Orkwiszewski, 2006). An inquiry-based approach may be a better instructional strategy to
enhance student learning and interest in science (Tretter & Jones, (2003).
TREATMENT
Eighth grade physical science students at Sierra Vista Middle School have historically
been given hands-on, activity based instruction while learning chemistry and matter. There is an
average of one lab activity per week during this unit of study. Students are generally placed in
groups of four or five and share the same lab equipment and lab space while working on the lab
activities. The majority of these lab activities are of the cookbook variety because specific
directions help ensure the safe usage of chemicals. These labs usually require one to two days to
complete. One of the drawbacks of the cookbook lab approach is the small number of students
actively engaged in doing the lab or experimentation in each lab group. One or two students are
involved in getting the chemicals, adding them together, and utilizing the equipment while the
other two or three students sit and wait. This does not allow the majority of the students to be
engaged in doing the experimental part of the lab.
Inquiry-based labs, those labs that allow students more latitude in the experimental
design and data collection methods, have not historically been used in the study of chemistry
because of the need for a safe lab experience. The inquiry-based labs in this study were designed
9
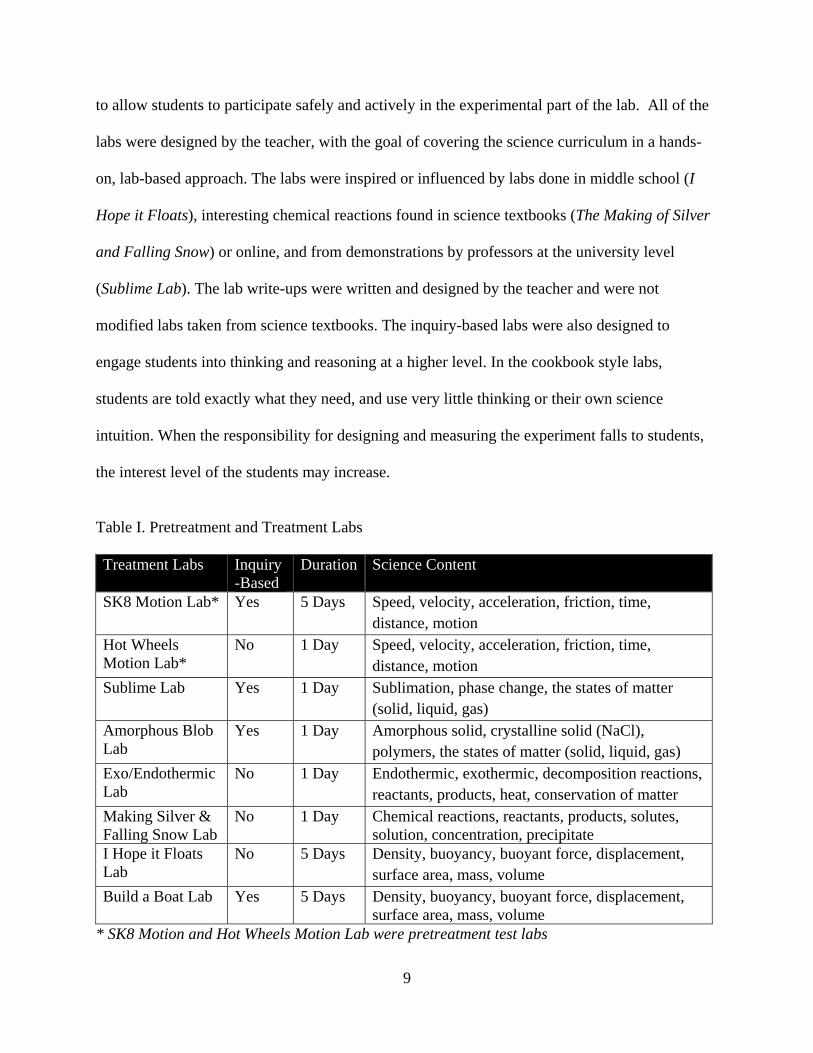
to allow students to participate safely and actively in the experimental part of the lab. All of the
labs were designed by the teacher, with the goal of covering the science curriculum in a hands-
on, lab-based approach. The labs were inspired or influenced by labs done in middle school (I
Hope it Floats), interesting chemical reactions found in science textbooks (The Making of Silver
and Falling Snow) or online, and from demonstrations by professors at the university level
(Sublime Lab). The lab write-ups were written and designed by the teacher and were not
modified labs taken from science textbooks. The inquiry-based labs were also designed to
engage students into thinking and reasoning at a higher level. In the cookbook style labs,
students are told exactly what they need, and use very little thinking or their own science
intuition. When the responsibility for designing and measuring the experiment falls to students,
the interest level of the students may increase.
Table I. Pretreatment and Treatment Labs
Treatment Labs Inquiry-Based
Duration Science Content
SK8 Motion Lab* Yes 5 Days Speed, velocity, acceleration, friction, time, distance, motion
Hot Wheels Motion Lab*
No 1 Day Speed, velocity, acceleration, friction, time, distance, motion
Sublime Lab Yes 1 Day Sublimation, phase change, the states of matter (solid, liquid, gas)
Amorphous Blob Lab
Yes 1 Day Amorphous solid, crystalline solid (NaCl), polymers, the states of matter (solid, liquid, gas)
Exo/Endothermic Lab
No 1 Day Endothermic, exothermic, decomposition reactions, reactants, products, heat, conservation of matter
Making Silver & Falling Snow Lab
No 1 Day Chemical reactions, reactants, products, solutes, solution, concentration, precipitate
I Hope it Floats Lab
No 5 Days Density, buoyancy, buoyant force, displacement, surface area, mass, volume
Build a Boat Lab Yes 5 Days Density, buoyancy, buoyant force, displacement, surface area, mass, volume
* SK8 Motion and Hot Wheels Motion Lab were pretreatment test labs
10
Prior to the administration of the six treatment labs (Table I), of which three were
inquiry-based and three were of the cookbook variety, there were two pretreatment test labs
given to students in the study. The SK8 Motion Lab and Hot Wheels Motion Lab (Appendix E)
were given to see how students would respond to an inquiry-based lab and an equivalent
cookbook style lab. The SK8 Motion Lab allowed students to experience the format of an
inquiry-based lab, compared to the traditional labs that they had experienced in past science
classes. The SK8 Motion Lab was used to gauge how the treatment labs should be presented and
the amount of challenges that would be appropriate for future inquiry-based labs. The Hot
Wheels Motion Lab represented the cookbook approach and covered similar physics content to
that covered in the SK8 Motion Lab.
A total of six physical science lab activities were used in this research project. These lab
activities were conducted by students over a four month period commencing in January 2009 and
ending in April 2009. Each of the first four lab treatments took one class period (50 minutes) to
administer and complete. The last two lab treatments each required one week (five 50 minutes
classes). There were three cookbook style labs and three inquiry-based labs. The six labs, plus
two pretreatment test labs, were given to the two other eighth grade physical science teachers at
the school for peer review to help establish validity and reliability. The six labs were determined
to be comparable in the scope of material covered, state standards addressed (Appendix D), the
time needed for completion, and the difficulty level required to conduct and complete the labs.
They differed mainly in their format, cookbook versus inquiry-based. The labs explored concepts
in chemistry, specifically the three states of matter; the unique properties of matter in the
different phases; chemical reactions with a look at reactants and products; and finally the
11
relationship between surface area, buoyancy, density of matter and how that affects objects that
are placed in water.
The Sublime Lab (Appendix F) was the first of three inquiry-based lab treatments given
to the students. The Sublime Lab has students explore dry ice and phase change, specifically
sublimation. Each lab group, each containing three to four students, was given a quantity of dry
ice and lab equipment for conducting experiments and recording observations. Students were
asked to design a research question and conduct three experiments incorporating the dry ice and
its ability to sublime. They recorded their experimental design, observations, and any data
collected into their notebook. Using the notes, sketches, and recorded observations, students
were asked to address their research question, explain what was happening with the dry ice, and
why. They were also encouraged to list any questions or observations they did not understand in
their science notebooks. The final step was for them to write down what they learned or
discovered in exploration of dry ice. The Sublime Lab was an example of an open-inquiry based
lab activity because it required students to develop their own research question and the
experimental design to answer the question. The lab took one class period (50 minutes) to
administer and complete.
The Amorphous Blob Lab (Appendix F) was the second inquiry-based lab treatment
given to students; they explored the characteristics of solids and liquids by using an amorphous
solid. The lab activity challenged students to determine if a mixture of water and cornstarch is a
solid or a liquid. Students were asked to experiment and play with the mixture and record any
observations and characteristics of the matter they created. Students sketched pictures of the
activity, recorded characteristics, and listed observations in their notebook as they worked with
the material. They were to determine if the matter they created was a solid or a liquid and to give
12
a minimum of three reasons for their belief. The last part of the lab activity asked them to justify
why a glass bottle full of salt is a solid and not a liquid, even though the salt pours much like a
liquid pours. The Amorphous Blob Lab was an example of a PBL because it asked students to
prove the state of matter they created. The lab took one class period (50 minutes) to administer
and complete.
The two cookbook style labs were administered approximately two weeks after the two
inquiry-based labs above were completed. The Exothermic/Endothermic Lab (Appendix G) was
the first cookbook style lab given to the students. This lab had students conducting one
exothermic and one endothermic chemical reaction by mixing two different salts (KCl and
CaCl2) in water and recording the temperature change over a period of one minute. The lab
supplied the students with the step-by-step procedures, a data tablet, and post-lab questions that
were answered after the completion of the lab activity. The lab took one class period (50
minutes) to administer and complete.
The Making of Silver and Falling Snow (Appendix G) was the second cookbook style lab
given to the students approximately one week after the first cookbook style lab. The focus of this
lab was on diluted versus concentrated solutions and the formation of products in a chemical
reaction. Students created a diluted and a concentrated AgNO3 solution and added a piece of
cooper wire to each solution. Over a period of ten to fifteen minutes they observed the single
replacement reaction and formation of silver on the copper wire. Post-lab questions were
answered after the reactions had proceeded for at least ten minutes. The second part of this lab
focused on the formation of a saturated solution and the parts of a solution, the solute and the
solvent. After the lab, students answered questions based on the newly formed solution and its
13
solubility and concentration. The lab took one class period (50 minutes) to administer and
complete.
Two final treatment labs, for a total of six labs, were given a month after the other four
labs were administered. The timing reflected the curriculum sequence, not a specific design of
this research project. There are three main differences with these two treatment labs compared
with the first four. First, the cookbook style lab was administered prior to the inquiry-based lab,
which is opposite the ordering of the other four lab treatments. Second, the last two lab
treatments are very similar to the topics they had the students explore - buoyancy, surface area,
displacement, and density - since they both had students create a boat. The final difference is that
the group size for these final two lab activities was two to three students per group instead of the
three to five students for the first four labs.
The I Hope it Floats Lab (Appendix G) was the cookbook style lab given over a four day
period during the last part of March 2009. The lab activity required students to strictly follow
the seven steps of the scientific method as they built a boat out of aluminum foil. Students had an
opportunity to design, build, test, and record data on how much cargo (trash) each boat design
could float before sinking. The lab required one week (five 50 minute classes) to administer and
complete.
The following week students were given the inquiry-based lab treatment with the Build a
Boat (Appendix F) lab activity. This lab required students to build a boat out of any material they
selected as long as the boat did not have a mass greater than 40 grams and was no larger than 50
cm x 36 cm. Students did not need to follow all seven steps of the scientific method, but were
required to keep a daily science journal of what they did, learned, collected, and uncovered each
day about their boat and the process of creating a boat. They were given five days to create, test,
14
redesign and produce a boat that could hold the maximum amount of weight, while staying
within the lab activity stated requirements. The Build a Boat Lab was an example of an inquiry-
based lab activity with both open-inquiry and PBL components. The lab required one week (five
50 min classes) to administer and complete.
These six lab treatments allowed students the opportunity to learn science using a hands-
on approach but with significantly different methods for having students learn the material.
During the study a number of methods were used to determine which treatment was best able to
generate interest and involvement by students learning science.
METHODS
Students were introduced in early Fall 2008 to lab activities that had an inquiry-based
approach. These inquiry-based labs set the foundation for the new approach in which many of
the students had not been exposed to prior to eighth grade science. Most students had completed
lab activities that were of the cookbook lab approach until this point.
Participants
This study was conducted during the 2008-2009 school year involving eighth grade
middle school students attending Sierra Vista Middle School in Irvine, California. The school
has a population of approximately 1,000 seventh and eighth grade students, of which 140 eighth
graders were included in this study. There were five sections of eighth grade physical science,
with each period having 32 to 35 students per class. The student population is majority
Caucasian followed closely by students of Asian descent. There are a few Persian, Latino, and
Afro-American students. Approximately two percent of the student population participates in
the reduced or free lunch program.
15
The participants in the study range in age from 12-14 years old and are almost equally
divided between male and female. Each of the 140 students in the study completed the six lab
treatments that began in the January 2009 and finished in April 2009. Most of the students have
had science lab experience in the classroom prior to eighth grade physical science. Most are
currently taking algebra, with five percent taking geometry at Northwood High School in Irvine.
Generally, the students are highly motivated to do well in school and come from middle to upper
socioeconomic status. Most of them complete their work on time and the majority of students
have done well on previous lab assignments. Parent support and emphasis on education are
strong at the school and throughout the district.
Instruments
Several methods were used to measure student attitudes and interest levels towards
inquiry-based lab activities and to see if these lab activities increased student involvement and
interest in doing the labs. An overview of the methods used to collect data for the research
project is described in Table II and a timeline for implementation for each is outlined in Table
III. To help ensure validity, all lab treatments, student interview questions and attitude surveys
were peer reviewed by the five science teachers at the school.
16
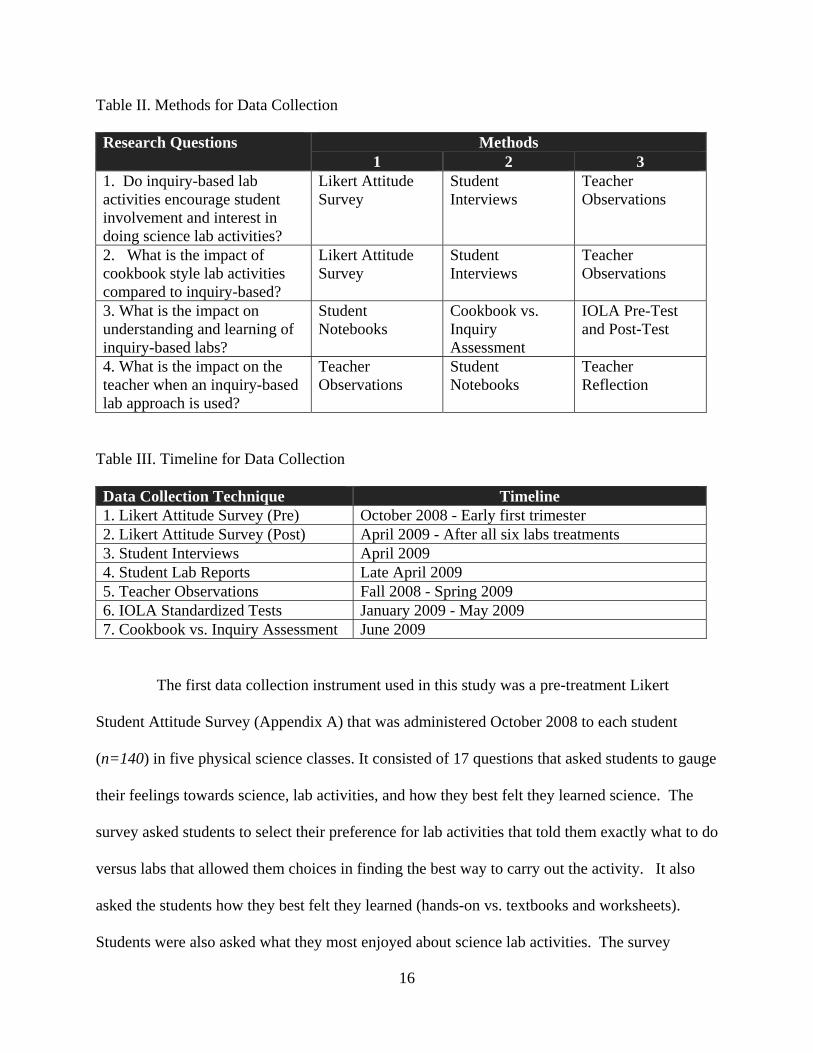
Table II. Methods for Data Collection Research Questions Methods
1 2 3 1. Do inquiry-based lab activities encourage student involvement and interest in doing science lab activities?
Likert Attitude Survey
Student Interviews
Teacher Observations
2. What is the impact of cookbook style lab activities compared to inquiry-based?
Likert Attitude Survey
Student Interviews
Teacher Observations
3. What is the impact on understanding and learning of inquiry-based labs?
Student Notebooks
Cookbook vs. Inquiry Assessment
IOLA Pre-Test and Post-Test
4. What is the impact on the teacher when an inquiry-based lab approach is used?
Teacher Observations
Student Notebooks
Teacher Reflection
Table III. Timeline for Data Collection
Data Collection Technique Timeline 1. Likert Attitude Survey (Pre) October 2008 - Early first trimester 2. Likert Attitude Survey (Post) April 2009 - After all six labs treatments 3. Student Interviews April 2009 4. Student Lab Reports Late April 2009 5. Teacher Observations Fall 2008 - Spring 2009 6. IOLA Standardized Tests January 2009 - May 2009 7. Cookbook vs. Inquiry Assessment June 2009
The first data collection instrument used in this study was a pre-treatment Likert
Student Attitude Survey (Appendix A) that was administered October 2008 to each student
(n=140) in five physical science classes. It consisted of 17 questions that asked students to gauge
their feelings towards science, lab activities, and how they best felt they learned science. The
survey asked students to select their preference for lab activities that told them exactly what to do
versus labs that allowed them choices in finding the best way to carry out the activity. It also
asked the students how they best felt they learned (hands-on vs. textbooks and worksheets).
Students were also asked what they most enjoyed about science lab activities. The survey
17
concluded with three open response questions. The questions asked about the usefulness of lab
activities in understanding science. The survey concluded with the opportunity for students to
suggest what they felt could be done to make lab activities more interesting.
Students were given a post-treatment Likert Attitude Survey (Appendix A) in April 2009,
six months later, after receiving all six treatment labs. This post-treatment attitude survey
consisted of 25 questions: the first half of the survey asked students to gauge their feelings
towards science, lab activities, and how they best felt they learned science. The second half of
this survey focused specifically on the lab treatments in this study. Students were asked to
compare the labs and their interest and involvement in the lab activities.
Twenty percent of the students, six students from five separate classes, for a total of 30
students, were interviewed for further insight into how the labs affected their interest and
participation in learning science. Students were selected using a stratified random sampling in
which ten randomly selected students from the low group (79% and below grade average), ten
from the midrange group (80% to 89% grade average) and ten from the high group (90% and
above grade average). Two students, both from the same grade level grouping, were interviewed
at a time. The students were asked which lab activities during the year were their favorites,
which allowed them to be most involved in the experimental process, and which were the most
interesting. The interview questions (Appendix C) also focused on how they performed the labs.
They were asked if they preferred labs that gave specific step-by-step directions compared to
ones that allowed more student direction and decision-making in completing the experiment.
Students were then asked to if they preferred having to answer post-lab questions (commonly
found in cookbook style labs), compared to keeping an active science journal, that includes
inquiry-based lab activities, observations, data, experimental design, and reflections of what they
18
learned or wanted to test while during the lab activity. Students were also asked to compare the
lab experience this year with science labs performed the prior year. The responses from these
interviews were used to acquire evidence to whether or not the labs are increasing student
involvement, participation and interest in learning science and how students felt they learned
best.
Student involvement and participation were observed informally by the teacher during
the lab activities. At the end of each class period, two to five observations were written down
into a notebook kept by the teacher. These notes described the general activity and interest level
of the students, number of students engaged in the lab, number of students passively sitting while
other group members worked, and how often students had to be encouraged to engage in the lab.
There was no formal rubric used for evaluation. The nature of the labs required continual teacher
assistance in: delivery of chemicals and supplies, setup of lab equipment, helping individual
students, and assessing student work. There was little time available for recording formal
observations. The observations that were made were used to reflect upon the study questions
that focused on student involvement and interest in doing the labs. These teacher observations
helped illustrate student behavior during these lab treatments from the teacher’s perspective and
as a record of the perceived interest and involvement of the students in conducting the labs. The
notes were used to develop questions for student interviews and to reflect upon inquiry-based lab
activities as an important and enjoyable teaching tool.
Student science notebooks were used to study the impact on understanding and learning
by students while conducting the inquiry-based lab activities. Each of the cookbook style lab
entries were compared to the inquiry-based lab activities. The notebooks were checked for
completeness, quality, effort, evidence of connections to the science content, and the depth of
19
information recorded. Each treatment lab outlined the notebook requirements for the lab activity.
The rubric used to grade and evaluate the notebooks focused on student effort and ability to take
something away from the lab activity (Appendix H). There were a total of 30 notebooks, six
from each class. Selection was made the same way student interview selection was conducted.
District mandated standardized tests were used to assess student learning and
understanding of the standards covered by the treatment labs. The tests were created by science
teachers in the district and are used at all the middle schools to assess student learning of the
California State Science Standards. Each student completed the IOLA (Irvine On-Line
Assessment) district standardized pre- and post-test. The first test covered the chemistry unit and
the second covered the density and buoyancy unit. The exact same test was used as the pre-and
post-test. The results of the test were used to show that students increased their understanding of
the key concepts after being exposed to the lab treatments. The results do not differentiate
between which treatment was responsible for the increase between the pre-test and post-test
scores. The post-test scores were compared to that of another teacher at the school that used a
non-inquiry-based approach to teaching. A significant difference between the two groups was
that this group did not receive the pre-test as did the inquiry-based group. The teaching styles of
the two teachers are different in approach, but the content covered was similar. The non-inquiry-
based group received a large portion of their instruction from worksheets, lecture notes, and the
textbook. This group had limited exposure to lab activities compared to the inquiry group.
A cookbook vs. inquiry assessment was the final instrument used to measure student
understanding. The assessments were administered in class during the first week of June 2009,
more than seven weeks after the treatment labs were administered. Students were not given
advance notice of the test or allowed to study the material prior to taking the assessments. Each
20
of the two tests contained 10 questions (Appendix I), questions that were specific to each lab and
the subject matter covered. Results for the two tests were used to see if there were any significant
differences in student understand of the science material.
DATA ANALYSIS
The analysis of the data collected focused on addressing the impact inquiry-based lab
activities had on student interest and involvement in doing science. The pre-treatment and post-
treatment surveys, along with student interviews, addressed how student attitudes and
involvement in science were affected by the introduction of inquiry-based labs. These
instruments also helped to see if cookbook style labs bore students and if they excluded some
from doing the experiment and being actively involved. Review of student lab notebooks
allowed for comparison between the two approaches, charting the depth at which students were
engaged in the material. Teacher observations helped support results from the fore mentioned
instruments and addressed the impact on the teacher with this type of teaching approach.
Attitudes Towards Science
Students were asked how science compared to their other classes, how interesting they
found science, and how interesting they found science lab activities. A comparison of both the
pre- and post-survey responses is shown in Figure 1.
21
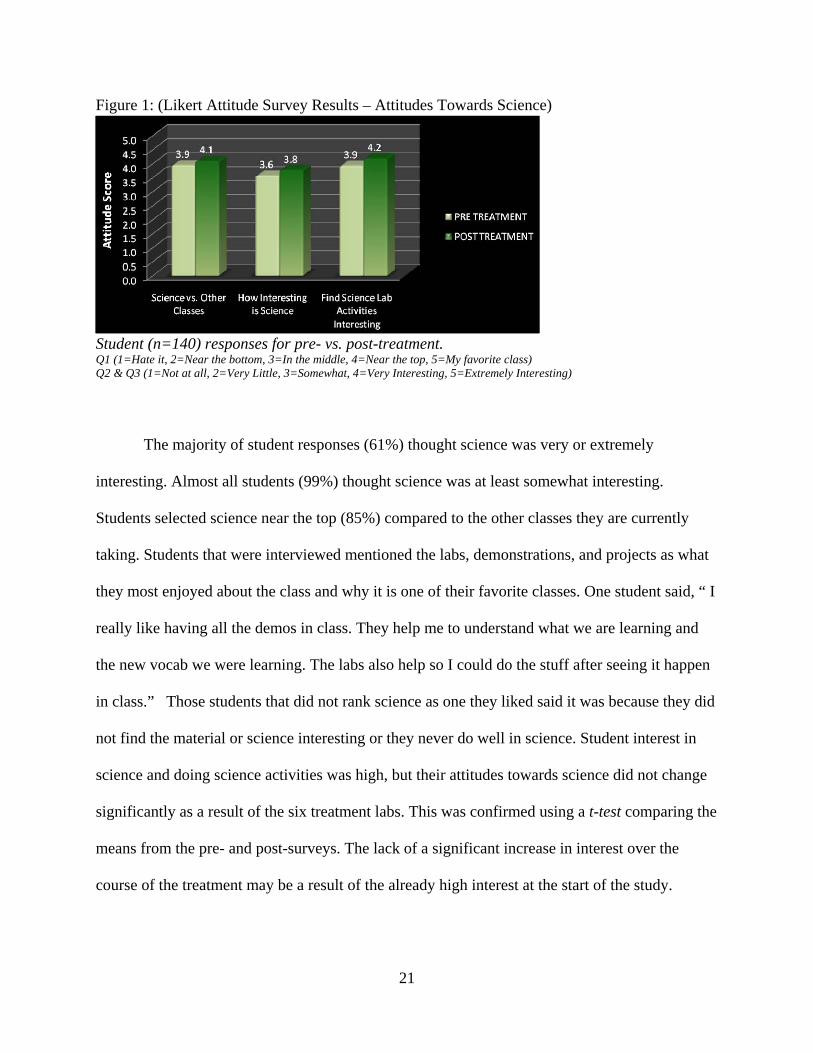
Figure 1: (Likert Attitude Survey Results – Attitudes Towards Science)
Student (n=140) responses for pre- vs. post-treatment. Q1 (1=Hate it, 2=Near the bottom, 3=In the middle, 4=Near the top, 5=My favorite class) Q2 & Q3 (1=Not at all, 2=Very Little, 3=Somewhat, 4=Very Interesting, 5=Extremely Interesting)
The majority of student responses (61%) thought science was very or extremely
interesting. Almost all students (99%) thought science was at least somewhat interesting.
Students selected science near the top (85%) compared to the other classes they are currently
taking. Students that were interviewed mentioned the labs, demonstrations, and projects as what
they most enjoyed about the class and why it is one of their favorite classes. One student said, “ I
really like having all the demos in class. They help me to understand what we are learning and
the new vocab we were learning. The labs also help so I could do the stuff after seeing it happen
in class.” Those students that did not rank science as one they liked said it was because they did
not find the material or science interesting or they never do well in science. Student interest in
science and doing science activities was high, but their attitudes towards science did not change
significantly as a result of the six treatment labs. This was confirmed using a t-test comparing the
means from the pre- and post-surveys. The lack of a significant increase in interest over the
course of the treatment may be a result of the already high interest at the start of the study.
22
The one area where there was a difference after the treatment was that students found the
actual science lab activities more interesting. A t-test was used to compare means and confirm
that there was a significant difference (p=.02). The majority of these students found lab activities
very or extremely interesting (86%) post-treatment. The pre-treatment number was lower (74%).
A few students (14%) thought the labs were only somewhat interesting after completion of the
treatment labs, but was lower than the number prior to doing the labs (21%). The significant
impact on students from doing the lab activities is that almost all students (94%) found 8th grade
science labs more interesting than the labs they conducted in 7th grade. A student that was
interviewed said this about the chemistry labs, “We got to mix chemicals together and see
something being made. We actually got to make something and see something happen. That was
really cool.” The reason for this seems to be two fold. First, students that were interviewed
explained that they enjoyed learning about physics and chemistry more than biology and health.
Second, there were more lab activities and higher involvement compared to last year. One
student explained, “We only had a few labs last year and they were not that fun. There are a lot
more labs this year and they are a lot more interesting.”
Attitudes Towards Learning
The Likert attitude surveys looked at how students felt they best learned science and the
type of lab approach they preferred. A comparison of both pre and post survey responses is
shown in Figure 2.
23
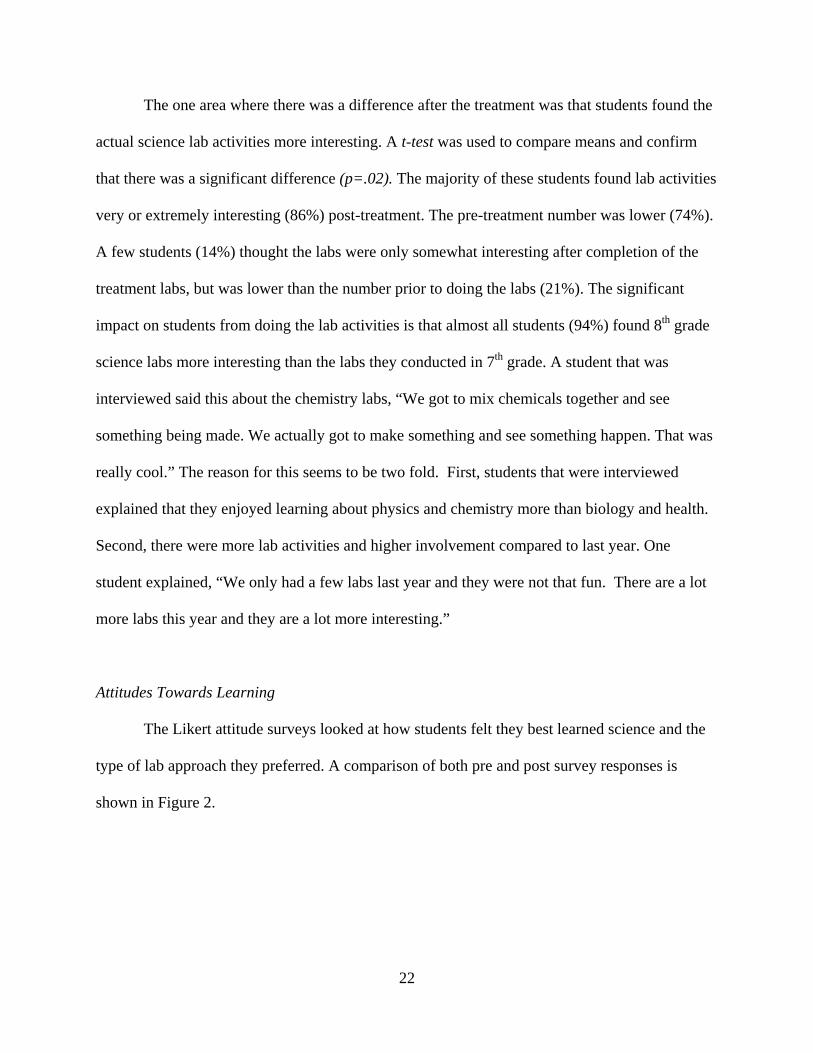
Student attitudes towards how they felt they learned best did not change significantly nor
did their preference for cookbook style labs or inquiry-based labs as a result of the treatment.
The results suggest that students felt they learn best when doing hands-on and lab based science
activities, compared to reading the textbook or completing worksheets. Interviews with students
(n=30) revealed that many students thought the teacher demonstrations were as important as
doing the hands-on activities in learning and understanding science. This is possibly because
teacher demos are accompanied by an explanation of what is happening and why. When
students are doing labs on their own, not everything is known by the student. This causes some
students to worry about not understanding why or what they should be focused on learning. One
student explained, “With demos you get to see the cool experiments and then are told how or
why they work. When you have to do labs, sometimes you do not know why for sure stuff
happens or how to make it work all the time.”
Figure 2: (Pre and Post Likert Attitude Survey Results – Attitudes Towards Learning) Student (n=140) responses for pre vs. post-treatment Likert attitude survey. (1=Disagree, 2=Not Really, 3=Sometimes, 4=Agree, 5=Strongly Agree)
24
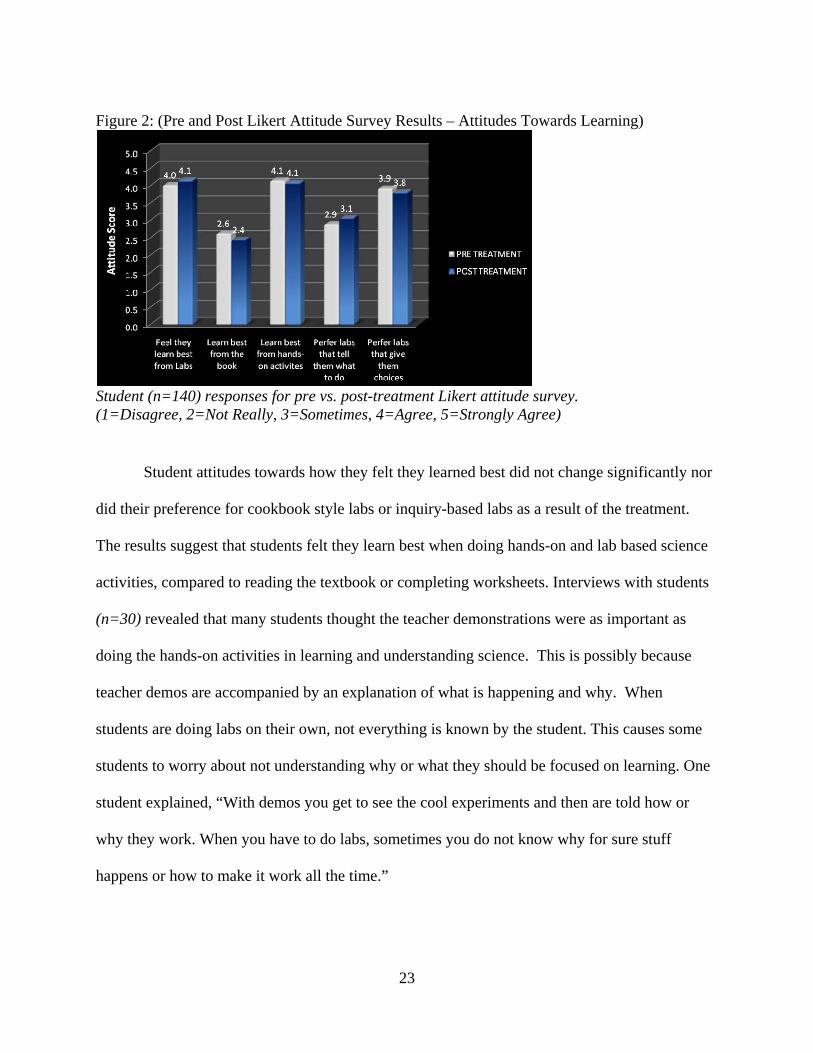
Exposure to inquiry-based labs did not result in an increase in the number of students
who preferred labs activities that gave them choices in how to conduct the lab (Figure 3). Prior to
the treatment labs, 110 students (79%) preferred labs that allowed them choices compared to 30
students (21%) that preferred labs that told then exactly what to do. After doing the treatment
labs, student preference dropped slightly for labs that gave them choices (75%) and rose for labs
that told them exactly what to do (25%). A t-test analysis showed the difference (p=.6) was not
significant. Of the 140 students, 40 students switched their preference. Of those that switched to
labs that allowed them to choose, 16 of the 17 students (94%) in this group had a B average or
above in the class. Of those that switched to labs that told them what to do, 11 of the 22 students
(50%) in this group had a C average or lower. A possible reason for students with lower grades
changing preference might be that they benefit from and need the structure and the guidance
found in cookbook labs. The inquiry-based labs required them to take more responsibility for the
learning, which many in this group are not accustomed to doing.
Figure 3: (Lab Preference – Pre- and Post-Treatment )
(n=140)
25
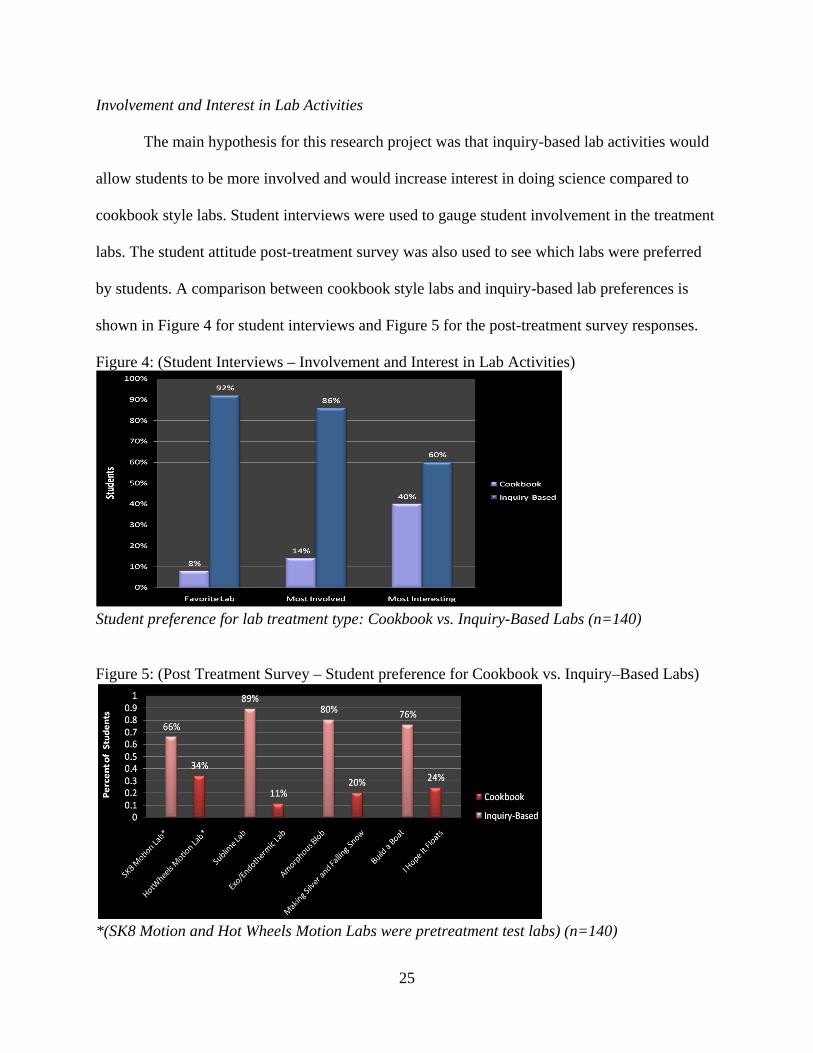
Involvement and Interest in Lab Activities
The main hypothesis for this research project was that inquiry-based lab activities would
allow students to be more involved and would increase interest in doing science compared to
cookbook style labs. Student interviews were used to gauge student involvement in the treatment
labs. The student attitude post-treatment survey was also used to see which labs were preferred
by students. A comparison between cookbook style labs and inquiry-based lab preferences is
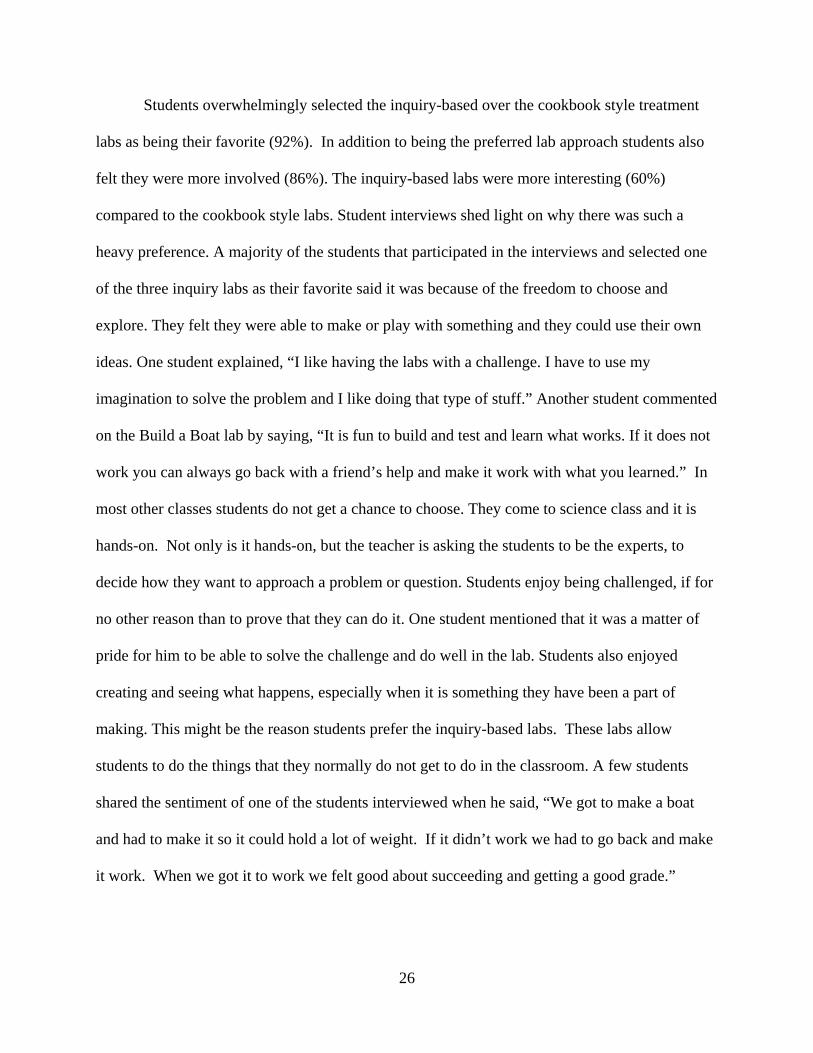
shown in Figure 4 for student interviews and Figure 5 for the post-treatment survey responses.
Figure 4: (Student Interviews – Involvement and Interest in Lab Activities)
Student preference for lab treatment type: Cookbook vs. Inquiry-Based Labs (n=140)
Figure 5: (Post Treatment Survey – Student preference for Cookbook vs. Inquiry–Based Labs)
*(SK8 Motion and Hot Wheels Motion Labs were pretreatment test labs) (n=140)
26
Students overwhelmingly selected the inquiry-based over the cookbook style treatment
labs as being their favorite (92%). In addition to being the preferred lab approach students also
felt they were more involved (86%). The inquiry-based labs were more interesting (60%)
compared to the cookbook style labs. Student interviews shed light on why there was such a
heavy preference. A majority of the students that participated in the interviews and selected one
of the three inquiry labs as their favorite said it was because of the freedom to choose and
explore. They felt they were able to make or play with something and they could use their own
ideas. One student explained, “I like having the labs with a challenge. I have to use my
imagination to solve the problem and I like doing that type of stuff.” Another student commented
on the Build a Boat lab by saying, “It is fun to build and test and learn what works. If it does not
work you can always go back with a friend’s help and make it work with what you learned.” In
most other classes students do not get a chance to choose. They come to science class and it is
hands-on. Not only is it hands-on, but the teacher is asking the students to be the experts, to
decide how they want to approach a problem or question. Students enjoy being challenged, if for
no other reason than to prove that they can do it. One student mentioned that it was a matter of
pride for him to be able to solve the challenge and do well in the lab. Students also enjoyed
creating and seeing what happens, especially when it is something they have been a part of
making. This might be the reason students prefer the inquiry-based labs. These labs allow
students to do the things that they normally do not get to do in the classroom. A few students
shared the sentiment of one of the students interviewed when he said, “We got to make a boat
and had to make it so it could hold a lot of weight. If it didn’t work we had to go back and make
it work. When we got it to work we felt good about succeeding and getting a good grade.”
27
Student involvement and interest seems to increase when inquiry-based labs are used.
There are a few possible reasons. First, inquiry-based lab activities averaged two to four students
per group. The cookbook style labs averaged three to five students in this study. The smaller
group size means that each student needs to be more involved and cannot just allow the others to
do the majority of the work. Second, each student must address the challenge and they can only
do that by understanding and doing the lab activity. The lab invites them to try to develop and
carry out experiments that they think will address the challenge of the lab. Finally, materials they
get to experiment with or create are interesting. In the inquiry-based labs they are given dry ice,
cornstarch, and water to explore or even a skateboard to ride. With the Build a Boat a Lab they
are able to build a boat that floats and is dependent on how well they perform in meeting the
challenge. Interest is sparked because it is challenging; when they meet success it makes them
feel like they really accomplished something.
The interviews revealed that almost half of the thirty students interviewed selected Build
a Boat as their favorite because it had the highest level of involvement. Most students who
selected this lab said, “It was the lab I felt most involved in doing the experiment and it was fun
making a boat and trying to make it do better each time you worked on it”. The post-survey
supported the belief that inquiry labs would be preferred over cookbook labs. Each of the three
inquiry labs were preferred over the three cookbook style labs. This was also true for the SK8
Motion lab compared to the Hot Wheels Motion lab. These two labs were pretreatment test labs
used to introduce students to an inquiry-based lab approach. Preference for the inquiry-based
labs might lay in the hands-on approach and the opportunity for freedom in the experiment. A
majority of the students said that they preferred having the freedom to choose and the ability to
use their imagination. One student said, “I enjoyed Build a Boat because if you fail you could go
28
back and redesign and try again.” Setting kids up to find success is possibly motivating them to
enjoy learning science.
Interest Level of Cookbook Labs
A hypothesis in this study was that cookbook labs bored students. This was based mainly
on teacher observation and the engagement level of students. Student interviews dispelled this
notion. Of all the students interviewed (n=30) none of the students felt these labs were boring
(100%). Students believed that all labs, treatment and non-treatment, had been interesting and
enjoyable. However, the design of these cookbook labs is atypical. First, they are not taken from
the book. All the labs have been created with student interest in mind. Second, they all have the
goal of being interesting and producing something unique or cool. The Making of Silver and
Falling Snow was perceived as being one of the most interesting of the cookbook style labs.
Students really enjoyed making silver and having crystals form on the copper wire. One student
explained, “It was a cool lab because you made something that was unexpected and that was
cool.” Another student mentioned a cookbook style lab that was not included in the set of
treatment labs as being her favorite and most interesting. She said, “I like the I Got Worms and
So Do You lab and the Slime All Over labs because you got to make something you could keep
and take home.” It is this “cool” factor and the creating of something different that allowed the
cookbook labs in this project to be interesting for the students.
It was also predicted that cookbook labs exclude some students from being involved in
the lab activity. Student interviews once again dispelled this teacher belief. Observations by the
teacher tended to show that one to two students did the majority of lab work when cookbook
style labs were conducted. This was especially true when doing the chemistry labs that required
29
getting and mixing chemicals. A majority (75%) of the students explained that they took turns
doing the labs or getting the chemicals. They felt that they were in fact engaged in the lab
activities and did not have to be the one getting and mixing the chemicals to still be involved.
The other quarter felt they were the one usually getting and doing the experiments, but felt that
other group members helped as well. The above view points were not related to student
academic performance level, but consistent between the entire range of academic performance. A
reason for this discrepancy between teacher and student might have it roots in teacher perception
and bias towards those students who do not appear to be working. It might also be that students
might have a different idea of what is considered working compared to the teacher.
Post-Lab Questions vs. Journals
Prior to the student interviews, little attention was given to the difference in student
responses to questions in cookbook versus inquiry-based lab activities. The most significant
finding in this project came from the interview question that asked students if they preferred
doing post-lab questions or keeping a science journal for writing reflections on the experimental
process and collected data.
The two approaches were used in the treatment labs depending if a cookbook style or
inquiry-based approach was used. Cookbook style labs tend to culminate with five to ten post-lab
questions that are answered once the experiment is completed. The post-lab questions focus
students’ attention to the results of the experiment and help students make connections to key
concepts explored in the experiment. The inquiry-based labs in this project tend to require
students to write in their science notebooks. Students write in these notebooks describing the
experimental design, observations, data collected, possible ideas or solutions, and a reflective
30
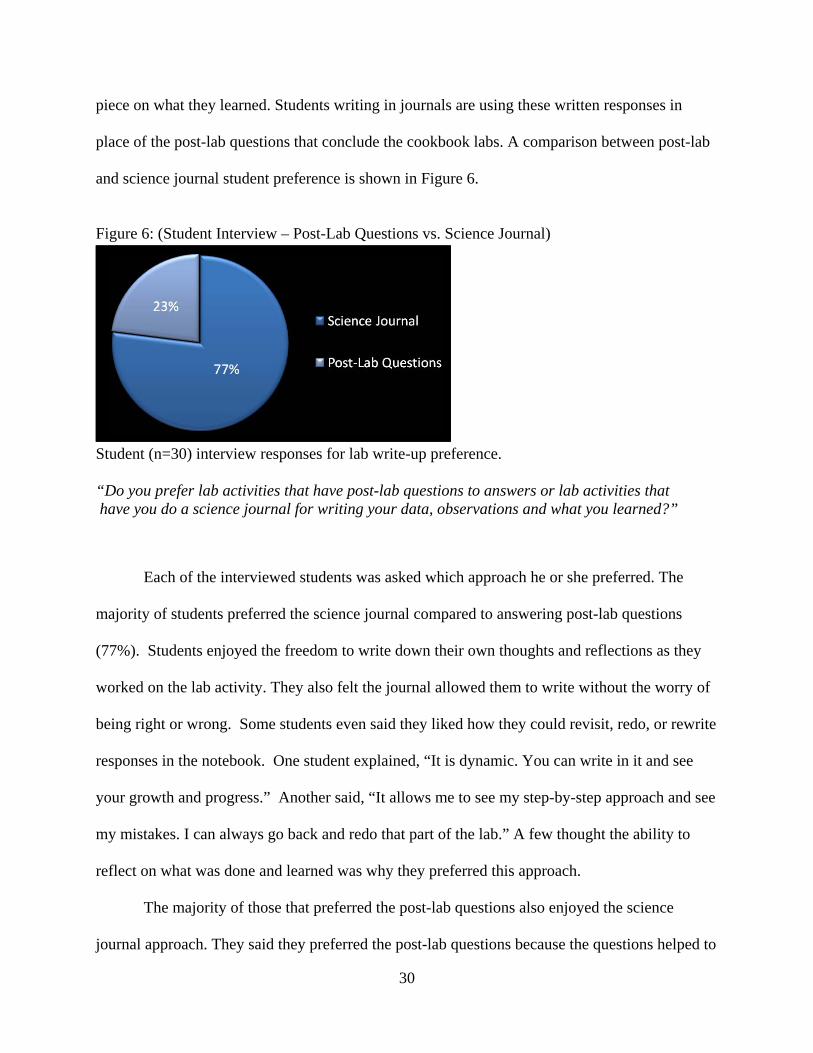
piece on what they learned. Students writing in journals are using these written responses in
place of the post-lab questions that conclude the cookbook labs. A comparison between post-lab
and science journal student preference is shown in Figure 6.
Figure 6: (Student Interview – Post-Lab Questions vs. Science Journal)
Student (n=30) interview responses for lab write-up preference.
“Do you prefer lab activities that have post-lab questions to answers or lab activities that have you do a science journal for writing your data, observations and what you learned?”
Each of the interviewed students was asked which approach he or she preferred. The
majority of students preferred the science journal compared to answering post-lab questions
(77%). Students enjoyed the freedom to write down their own thoughts and reflections as they
worked on the lab activity. They also felt the journal allowed them to write without the worry of
being right or wrong. Some students even said they liked how they could revisit, redo, or rewrite
responses in the notebook. One student explained, “It is dynamic. You can write in it and see
your growth and progress.” Another said, “It allows me to see my step-by-step approach and see
my mistakes. I can always go back and redo that part of the lab.” A few thought the ability to
reflect on what was done and learned was why they preferred this approach.
The majority of those that preferred the post-lab questions also enjoyed the science
journal approach. They said they preferred the post-lab questions because the questions helped to
31
prepare for the test and focus their studies on the most important ideas in the lab activity. Two
students, both from the lower grade average group, preferred the post-lab questions because they
were easier to answer than the science journal.
The interviews suggested that students liked the personalization available in the science
notebook. There seems to be a sense of ownership and independence since they can choose what
to include for each lab. It goes along with the justification that a journal gives them more
freedom to decide what to write. This allows for the science they are doing in class to become a
more personal, meaningful experience. One student explained, “I prefer the science journal
because I get to decide what is important to write down and not just have to answer the post-lab
questions. I like the freedom to write down what I am learning as I do the lab.” The one caution
here is that students may like the notebooks because there is no real minimum for what they must
include. They could use this as a way to do less work compared to the set amount of work that
post-lab questions create. Another problem is that students were not given a science notebook
grading rubric prior to the lab treatments. This oversight caused many students not to realize the
expectations envisioned for each lab activity.
A look at student notebooks helped determine the extent and depth of student
understanding and involvement in the science aspect of the inquiry labs. A total of 30 notebooks
were collected and scored using a grading rubric (Appendix H). It should be noted that a total of
36 notebooks were collected in all. Six of the notebooks were not used because the students
wrote so little or nothing at all; therefore, they could not be graded. These six students would
have been in the lowest group. There was a significant difference (p=.02) between the highest
grade group (A students) and the middle group (B students) and a significant difference (p=.02)
between the highest group versus the lowest group (C and below students). There was not a
32
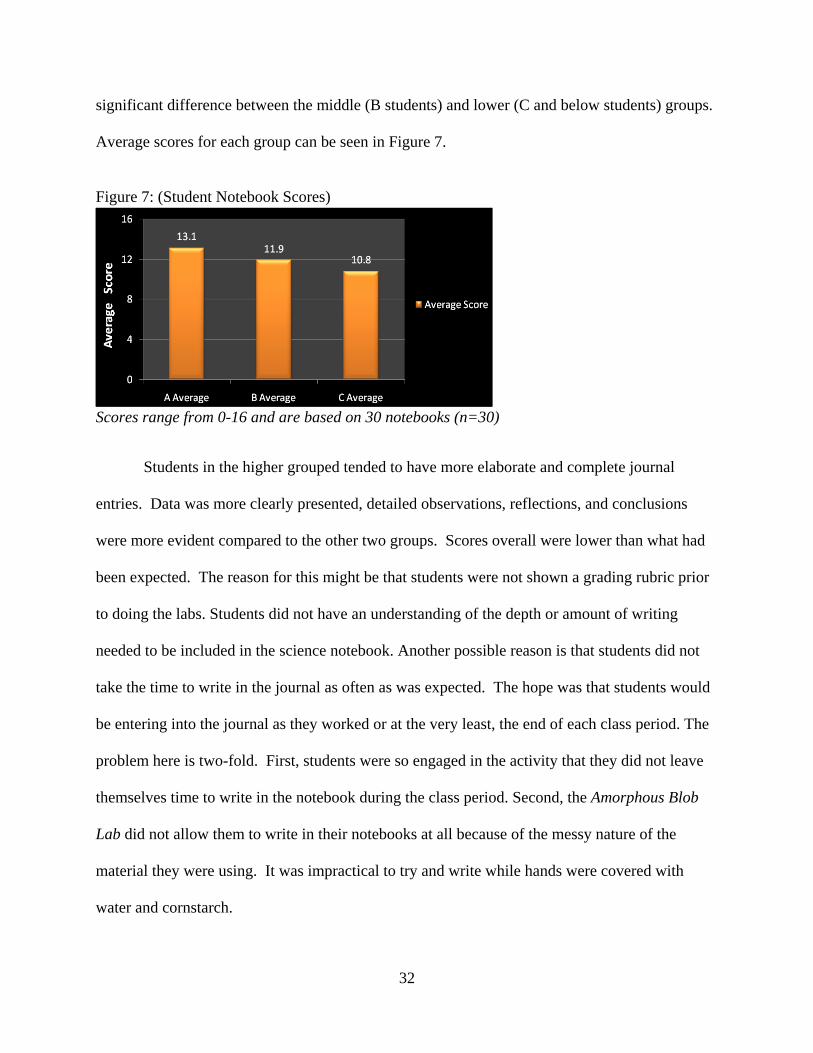
significant difference between the middle (B students) and lower (C and below students) groups.
Average scores for each group can be seen in Figure 7.
Figure 7: (Student Notebook Scores)
Scores range from 0-16 and are based on 30 notebooks (n=30)
Students in the higher grouped tended to have more elaborate and complete journal
entries. Data was more clearly presented, detailed observations, reflections, and conclusions
were more evident compared to the other two groups. Scores overall were lower than what had
been expected. The reason for this might be that students were not shown a grading rubric prior
to doing the labs. Students did not have an understanding of the depth or amount of writing
needed to be included in the science notebook. Another possible reason is that students did not
take the time to write in the journal as often as was expected. The hope was that students would
be entering into the journal as they worked or at the very least, the end of each class period. The
problem here is two-fold. First, students were so engaged in the activity that they did not leave
themselves time to write in the notebook during the class period. Second, the Amorphous Blob
Lab did not allow them to write in their notebooks at all because of the messy nature of the
material they were using. It was impractical to try and write while hands were covered with
water and cornstarch.
33
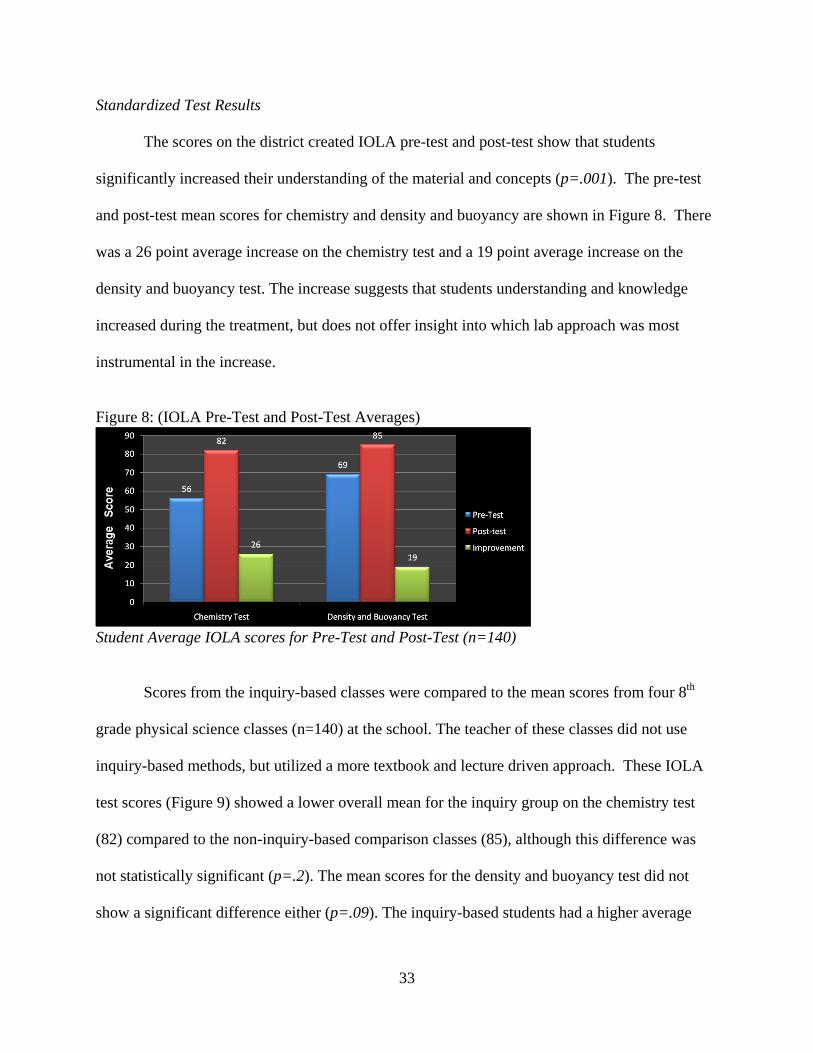
Standardized Test Results
The scores on the district created IOLA pre-test and post-test show that students
significantly increased their understanding of the material and concepts (p=.001). The pre-test
and post-test mean scores for chemistry and density and buoyancy are shown in Figure 8. There
was a 26 point average increase on the chemistry test and a 19 point average increase on the
density and buoyancy test. The increase suggests that students understanding and knowledge
increased during the treatment, but does not offer insight into which lab approach was most
instrumental in the increase.
Figure 8: (IOLA Pre-Test and Post-Test Averages)
Student Average IOLA scores for Pre-Test and Post-Test (n=140)
Scores from the inquiry-based classes were compared to the mean scores from four 8th
grade physical science classes (n=140) at the school. The teacher of these classes did not use
inquiry-based methods, but utilized a more textbook and lecture driven approach. These IOLA
test scores (Figure 9) showed a lower overall mean for the inquiry group on the chemistry test
(82) compared to the non-inquiry-based comparison classes (85), although this difference was
not statistically significant (p=.2). The mean scores for the density and buoyancy test did not
show a significant difference either (p=.09). The inquiry-based students had a higher average
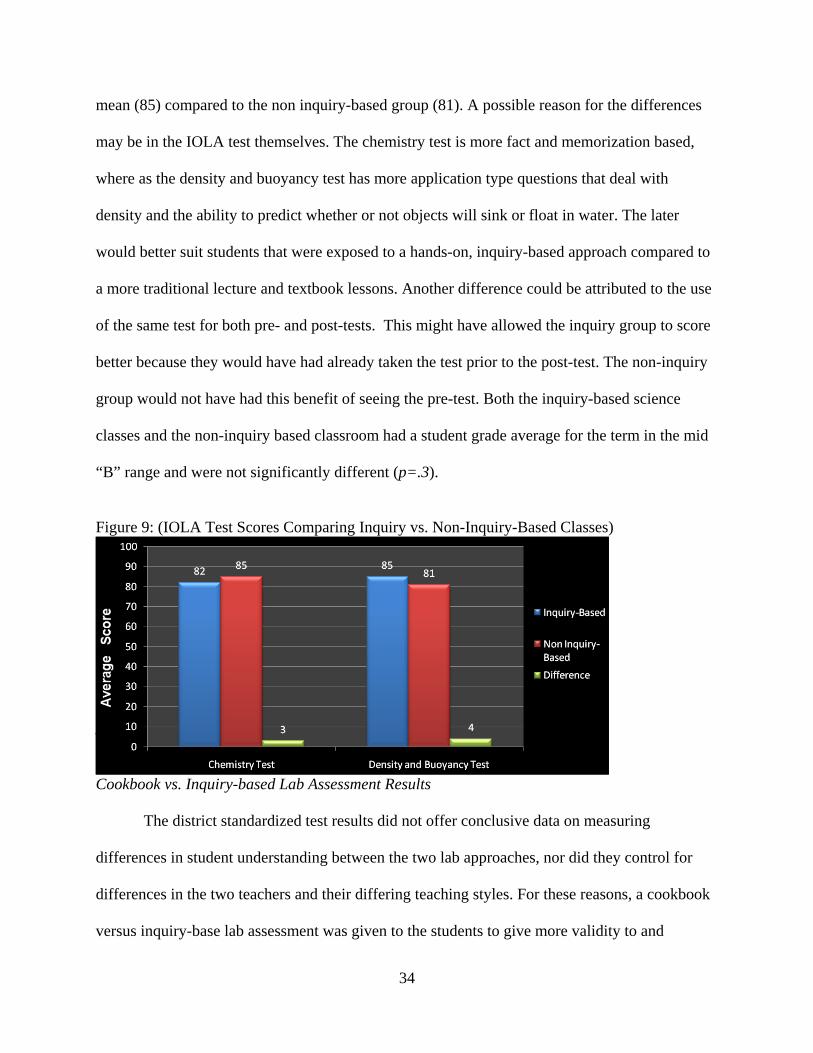
34
mean (85) compared to the non inquiry-based group (81). A possible reason for the differences
may be in the IOLA test themselves. The chemistry test is more fact and memorization based,
where as the density and buoyancy test has more application type questions that deal with
density and the ability to predict whether or not objects will sink or float in water. The later
would better suit students that were exposed to a hands-on, inquiry-based approach compared to
a more traditional lecture and textbook lessons. Another difference could be attributed to the use
of the same test for both pre- and post-tests. This might have allowed the inquiry group to score
better because they would have had already taken the test prior to the post-test. The non-inquiry
group would not have had this benefit of seeing the pre-test. Both the inquiry-based science
classes and the non-inquiry based classroom had a student grade average for the term in the mid
“B” range and were not significantly different (p=.3).
Figure 9: (IOLA Test Scores Comparing Inquiry vs. Non-Inquiry-Based Classes)
Average class scores for IOLA Test (n=140)
Cookbook vs. Inquiry-based Lab Assessment Results
The district standardized test results did not offer conclusive data on measuring
differences in student understanding between the two lab approaches, nor did they control for
differences in the two teachers and their differing teaching styles. For these reasons, a cookbook
versus inquiry-base lab assessment was given to the students to give more validity to and
35
confidence to any differences seen in student understanding. These two assessments were
administered 14 weeks after the completion of the chemistry treatment labs and seven weeks
after the density and buoyancy lab treatments.
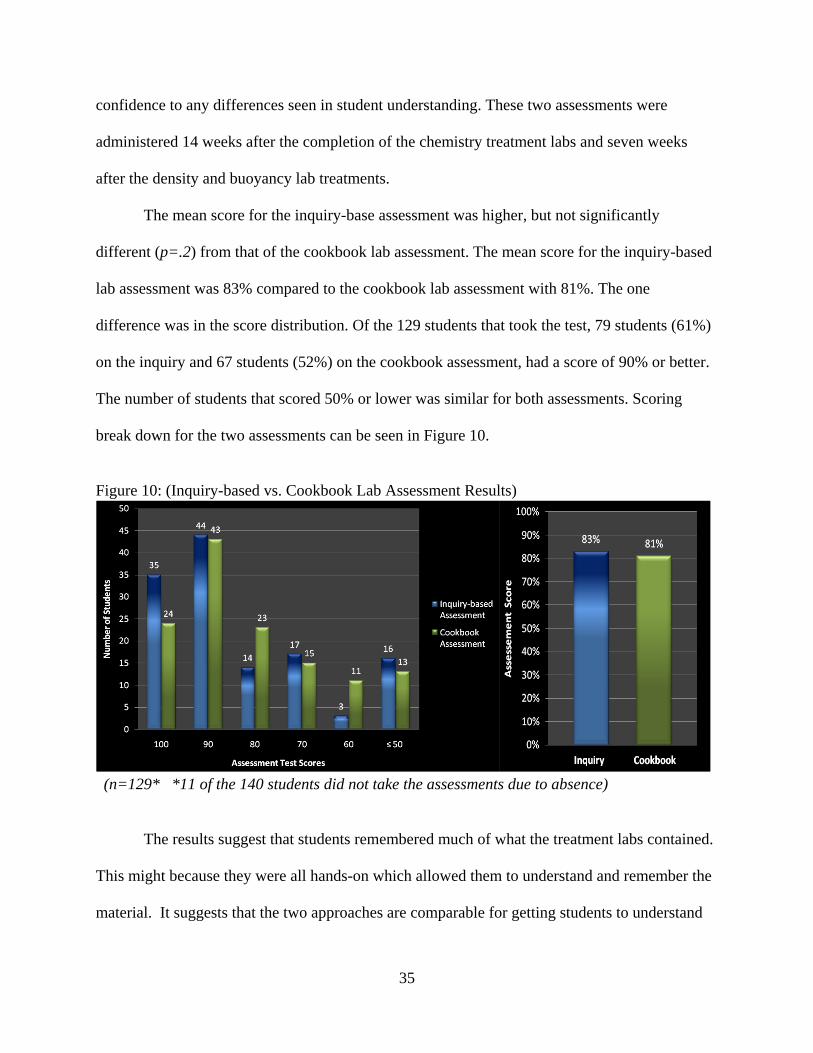
The mean score for the inquiry-base assessment was higher, but not significantly
different (p=.2) from that of the cookbook lab assessment. The mean score for the inquiry-based
lab assessment was 83% compared to the cookbook lab assessment with 81%. The one
difference was in the score distribution. Of the 129 students that took the test, 79 students (61%)
on the inquiry and 67 students (52%) on the cookbook assessment, had a score of 90% or better.
The number of students that scored 50% or lower was similar for both assessments. Scoring
break down for the two assessments can be seen in Figure 10.
Figure 10: (Inquiry-based vs. Cookbook Lab Assessment Results)
(n=129* *11 of the 140 students did not take the assessments due to absence)
The results suggest that students remembered much of what the treatment labs contained.
This might because they were all hands-on which allowed them to understand and remember the
material. It suggests that the two approaches are comparable for getting students to understand
36
and retain the information they learned. This supports studies done by Tretter (2003) and
Cacciatore & Sevian (2009) that showed inquiry-based labs did not result in a significant
difference in student performance on standardized tests.
The way students performed on these two tests was similar to how many of them
historically have scored on science tests. There were a small number of students that scored well
on both tests (80% or above), but have historically scored low (below 70%) on other assessments
during the year. There were 15 students total that showed a significant score improvement over
their historic averages. Of these 15 students, eight had a higher score on the inquiry-based
assessment compared to the cookbook assessment.
Impact on Teacher
When looking at implementation of new teaching approaches, it is important not to look
at just the benefit for the students, but also the benefit for the classroom teacher. Inquiry-based
lab activities can have a positive effect on students and teachers as well. The first thing observed
during the first inquiry-based lab, which was the Sublime lab, was the number of students
actually engaged in doing the experimentation. Cookbook style lab activities usually result in
two to three students doing the majority of mixing, experimenting, and measuring, while the
other students sit there minimally engaged. This is more noticeable in those classes where
students tend to have behavior issues or struggle academically. When students are not engaged,
more time is spent on classroom management. The cookbook style labs in this study are
interesting, but do not allow for all students to be engaged at the same time. The limited
resources and space to safely conduct the lab play a part in the larger group size and make it
necessary to have cookbook labs instead of a more inquiry-based approach.
37
The three inquiry labs were remarkably different than the three cookbook labs in terms of
student engagement. The Build a Boat lab kept the majority of students engaged over the entire
week the activity took place. The nice thing about that is that the teacher can move around the
room and interact with groups without having to spend time with classroom management issues.
Inquiry-based science has a noticeable decrease in the need for disciplining students that are
bored. Observations noted in the teacher journal showed that over the one week the Build a Boat
lab activity was conducted only two students from all five class periods needed to be redirected
back to focusing on the activity. This compares to an average of three to four students per class
period needing to be refocused on the activity when cookbook labs were used. The Sublime Lab
and the Amorphous Blob Lab were similar in terms of student engagement according to the data
collected in the teacher journal. Students were engaged in the experiment for the entire length of
the class. The one drawback is that students are sometimes so engaged that they do not write
anything into their science journals.
Student observations and interaction with students during the inquiry-based labs showed
diversity of thought and resourcefulness that was not observed during the cookbook style labs.
Students showed a wide diversity in how they addressed the challenges or conducted
experiments. Some students even requested additional lab equipment for the Sublime Lab that
was not initially supplied by the teacher. Students were looking for interesting and novel ways to
use and test the sublimation properties of dry ice. With the Build a Boat Lab, students had a
variety approaches and ideas which they designed and tested. This is something that would not
be possible in the I Hope it Floats Lab due to the limitations and more guided direction it
afforded the students.
38
My perception was that an inquiry-based approach was a more positive experience for the
teacher compared to the cookbook labs. Observations recorded in the teacher journal showed that
during the inquiry-based labs I enjoyed the interaction with the students more, felt they were
more engaged, and that the majority of students were actively doing the experiments. Since there
was not a rubric or formal data piece to quantify or qualify these observations it should be
mentioned that this is a limitation of the study. Conclusions made from these observations are
thus limited in their validity.
Change Over Time
It is important for me to have my students like science and enjoy learning about the world
around them. If students are not enjoying learning about science, they will have little want to
further their understanding later. Two questions on the survey focused on student enjoyment
while learning science. Students were also asked if they enjoyed science more now than at the
beginning of the year. The other asked them to compare science last year as a 7th grader with
science this year as an 8th grader.
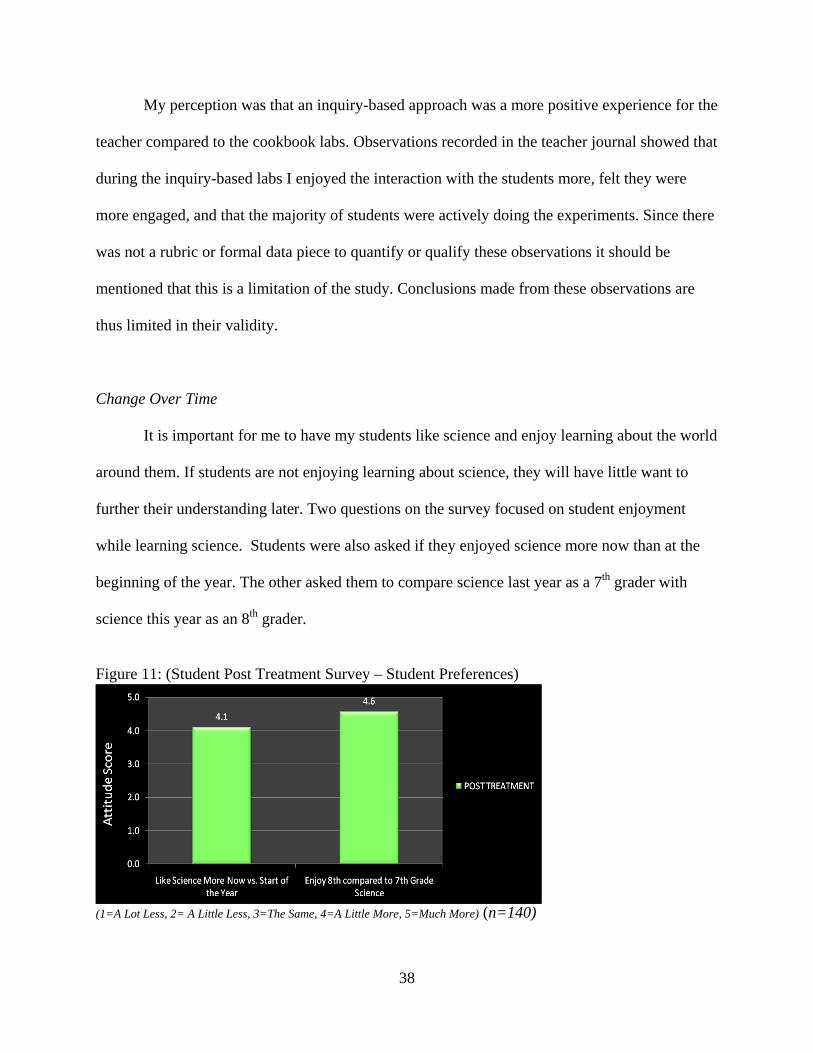
Figure 11: (Student Post Treatment Survey – Student Preferences)
(1=A Lot Less, 2= A Little Less, 3=The Same, 4=A Little More, 5=Much More) (n=140)
39
The most significant piece of data might be how student attitudes and enjoyment of
science have changed over the course of the year. According to the post-treatment survey,
students’ like of science, especially compared to 7th grade science, has increased significantly
(Figure 11). Whether it is the subject matter, the hands-on approach, inquiry-based labs, or some
other factor, it is not clear. The important thing to take from this is that something is being done
correctly to get students involved and liking science before they move on to high school.
The results show that an inquiry-based approach can increase student interest and
involvement in doing science. Students seem to prefer inquiry over a cookbook approach, but
respond favorably to both. From a teaching standpoint inquiry is the preferred method of lab
instruction. The time requirement for planning and administering inquiry-based instruction is
greater, but the decreased need for classroom management and the number and quality of student
engagement justify the extra resources required. It appears that both approaches help students to
understand the material and allow them to achieve higher scores on standardized tests, although
it is not clear which has the greatest impact.
CONCLUSION
The purpose of this project was to describe the impact inquiry-based lab activities have
on middle school science students compared to cookbook style labs. The project shed light on
how an inquiry-based lab approach can be used to increase student involvement and interest in
doing science. The project also looked at student understanding of concepts and material when
inquiry-based labs are used. Teacher impact and implication was also explored in the study.
40
What Was Learned
Student preference for the inquiry-based labs compared to cookbook styles labs
significantly differed. The inquiry-based labs were not only preferred over the cookbook labs
(78% vs. 22%), but they were also more interesting and students felt that they were more
involved in doing the lab. Students enjoyed the freedom to explore and the privilege to have a
say in the experimental process. Letting students have a stake in their learning is one of the
things that inquiry-based lab activities foster.
The interviewed students all found cookbook and inquiry-based labs to be interesting.
They said that the cookbook labs were interesting and enjoyable. It seems some type of hands-on
lab approach, whether inquiry-based or cookbook gets students involved and interested. This
suggests that a balanced approach between the lab types can achieve the goal of getting students
interested and involved in doing and learning science.
Student preference for science journals compared to answering post-lab questions was an
interesting finding in the project. A large majority of students (77%) preferred to keep a journal
with observations, data, and reflections, compared to answering the required post-lab questions.
Many students say the freedom associated with this type of approach was what they liked most.
The quality of these journals did vary greatly. There seems to be a correlation between those
students who had higher grades, and put more effort into their journals, compared to those who
generally had lower grades in science, who put forth less effort. The one interesting thing is that
each student made some effort entering observations, data, or reflections from each of the lab
activities.
Student understanding of the concepts and materials was comparable to that offered by a
non-inquiry-based approach. The student average for the chemistry standardized test was in the
41
B average range (82%), almost the same as the non-inquiry-based group (85%). The inquiry-
based group had a higher average mean score on the density and buoyancy standardized test
(85%) compared to the non-inquiry-based group (81%). On the two lab assessments, which were
given many months after the treatment labs had concluded, students scored similarly on the
inquiry-based lab assessment (83%) and the cookbook lab assessment (81%) suggesting that they
understood and retained the information they learnt from these lab experiences.
It seems that inquiry-based labs do get students more involved and interest in doing
science. A hands-on, demonstration supported approach to teaching science is what students at
this level feel they best learn from and enjoy. They also seem to want the freedom to decide, but
they also feel that they need some direction and guidance.
The inquiry-based approach has allowed me to enjoy teaching the material a little more
compared to a strict cookbook lab approach. Some of the cookbook labs were frustrating because
there would always be students who were not engaged in the activity and/or became behavior
concerns. With inquiry-based labs this frustration has decreased and allowed me to focus on
those students that need guidance or help with the lab. The activities have also sparked my
interest because of the unique ways students will execute the lab or address the challenges.
There has been some pretty impressive work done by the students in this study. You just do not
get this type of variety with the cookbook style labs.
Value and Implications
The project revealed that students at this level enjoy an inquiry-based approach. If
students are engaged and interested in doing science at this level, maybe it will carry over to high
school and beyond. The inquiry-based lab approach shows students that science can be
42
interesting and fun. The gathering of data, making mistakes, and testing out ideas are all part of
the learning process. Students are allowed to take risks without the fear of answering the
questions wrong or not getting the right answer. Self confidence and motivation to meet
challenges are of tremendous value to the students. These lab activities allow them to do both.
After seeing how involved and interested students are with the inquiry-based labs, I am
more inclined to start transitioning cookbook labs to be more inquiry-based. Not all labs can be
made to be completely inquiry-based. Concerns for safety and the need for students to have
enough prior knowledge and understanding of concepts make the use of some cookbook style
labs an important component of a balance science lab experience. Research done by Kirschner,
Sweller, and Clark (2006) suggest that students need some guidance, which cookbook style labs
provide, and do not benefit from a minimalist lab approach. The goal would be to bring different
degrees or levels to each of the lab activities done in the class. This could mean having students
develop their own data tables, procedures, or adding an element of choice in how they showcase
their data and findings.
I have only given my students a small taste of inquiry. Over the next few years that taste
will increase as I learn more about how to develop quality inquiry activities and work with others
at my school in developing worthwhile and meaningful lessons. After I have had more
experience using and transferring material to inquiry-based activities, I would like to collaborate
with other curricular areas to have them develop activities that have an inquiry touch. If students
are exposed to this type of method in all of their classes it will help them to perform inquiry
activities at a higher level.
One implication near term is to revisiting and improving the treatment labs I used in this
project. The SK8 Motion Lab has already been redone for use next year. I learned a lot from
43
watching students do the labs and from what they have written in their science notebooks. I look
forward to taking the rest of the labs and adjusting them to help students enjoy and meaningfully
experience inquiry.
Questions that the Project Raises
The inquiry-based model seems to be a valuable teaching tool, but there are some
questions and concerns of its use in the classroom. A list of concerns and questions follow:
• Do students really understand what they are doing and the material they are learning?
• What will be the long term benefit, if any, of being exposed to inquiry-based science as
students attend high school and beyond?
• Will this approach allow them to better understand and do science at the next level?
• Does the increased interest in this science class encourage more students towards a path
of study or a profession in a science related field?
• How do you develop cookbook style labs into a more inquiry-based approach?
• How do you get other teachers to see the worth of this approach and start implementing
inquiry-based activities?
• How do you get students doing inquiry earlier so that they can develop the science skills
that inquiry requires?
• How do you encourage those students that do not write much in the science journals to
write more?
• How do you correct students when they make incorrect assumptions or conclusions based
on what happens in the lab activities?
44
The goal of the project was to increase student interest and involvement in doing science.
In four years it would be interesting to see how this group of students did at the next level and
what they plan to study at the university. Educators hear from students from time to time, but
most never know if what they did in their classroom had any long-lasting, positive effect on their
students.
I would also like to investigate authentic assessments that would be representative of an
inquiry-based approach. It would be interesting to see if students that are exposed to the inquiry-
based approach do well on tests that are inquiry-based.
I would also like to be able to address and answer the questions above. The one thing I
have learned going forward is that an inquiry-based approach takes time and effort to implement
in the classroom. Not just time creating the materials, but getting students to benefit and learn
from the activities they are involved in when doing inquiry. It takes extra time to transfer
existing curriculum and lessons into an inquiry-based concept teaching approach.
Much has been learned in terms of how to look at what and how students are being taught
and making that experience as involved and interesting as possible. A project like this requires
educators to take a look at what we have done and decide if it is what is best for kids. Teachers
should always be analyzing what we do and understanding why it benefits kids. There needs to
be some point in each student’s educational journey that allows and encourages them to explore
and answer questions that pop into their heads as they move along. This is what is best for kids,
but not always easy to produce in the classroom. It is the job of science teachers to encourage
students to start asking the questions, solving the problems, and doing the science that gets them
involved in learning and discovery. Inquiry is a tool that allows students to start this journey.
45
Works Cited California State Board of Education. (2003). Science content standards for California public schools. Kindergarten through grade twelve. Retrieved May 10, 2009, from California Department of Education Web site: http://www.cde.ca.gov/be/st/ss/documents/sciencestnd.pdf Cacciatore, K. & Sevian, H. (2009). Incrementally approaching an inquiry lab curriculum: can changing a single laboratory experiment improve student performance in general chemistry? Journal of Chemical Education, 86(4), 498-505. Gerber, BL, Cavallo, A, & Marek, EA. (2001). Relationships among informal learning environments, teaching procedures and scientific reasoning ability. International journal of science education, 23(5), 535-. Humphrey, G. (1995). Inquiry based science: what does it look like?, Connect, 8 (58), 13-. Kirschner, PA, Sweller, J, & Clark, RE. (2006). Why minimal guidance during instruction does not work: An analysis of the failure of constructivist, discovery, problem-based, experiential, and inquiry-based teaching. Educational Psychologist, 41(2), 75-. Karabulut, U. S. (2002). Curricular elements of problem-based learning that cause developments of self-directed learning behaviors among students and its implications on elementary education. Unpublished doctoral dissertation, The University of Tennessee, Knoxville. Llewellyn, D. (2002). Inquire within: Implementing inquiry-based science standards. Thousand Oaks, CA: Corwin Press. Lord, T, & Orkwiszewski, T. (2006). Moving from didactic to inquiry-based instruction in a science laboratory. The American Biology Teacher, 68(6), 342-. Marbach-Ad, G. & Sokolove, P.G. (2000). Can undergraduate biology students learn to ask higher level questions? Journal of Research in Science Teaching, 37, 854-870. Mayer, R. (2004). Should there be a three-strikes rule against pure discovery learning? The case for guided methods of instruction. American Psychologist, 59, 14–19. Peters, E. (2005). Reforming cookbook labs. Science Scope, 19, 16-21. Smolleck, L, & Yoder, E. (2006). Further development and validation of the teaching science as inquiry (TSI) instrument. School Science and Mathematics, 108(7), 291-297. Sungur, S, & Tekkaya, C. (2006). Effects of problem-based learning and traditional instruction on self-regulated learning. The Journal of educational research, 99(5), 307-.
46
Tretter, TR, & Jones, M. (2003). Relationships between inquiry-based teaching and physical science standardized test scores. School science and mathematics, 103(7), 345-. Volkmann, M, & Abell, S. (2003). Rethinking laboratories, The Science Teacher, 38-41.

47
APPENDICES
48
APPENDIX A
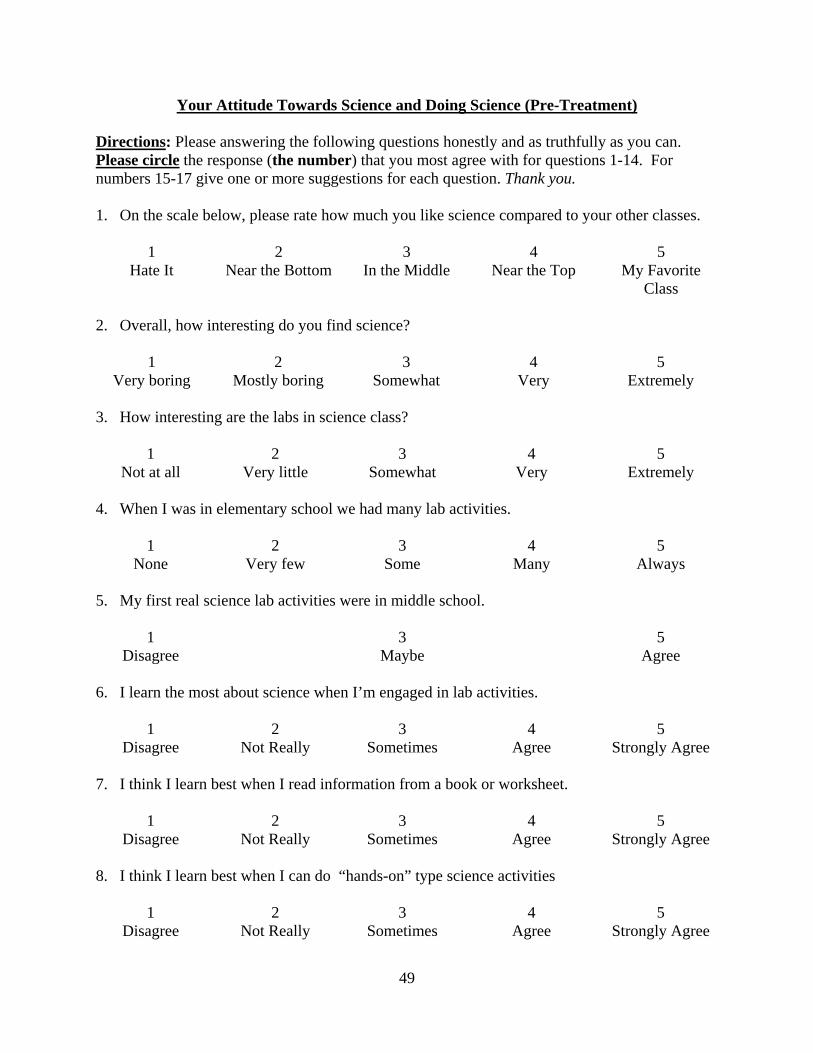
49
Your Attitude Towards Science and Doing Science (Pre-Treatment)
Directions: Please answering the following questions honestly and as truthfully as you can. Please circle the response (the number) that you most agree with for questions 1-14. For numbers 15-17 give one or more suggestions for each question. Thank you. 1. On the scale below, please rate how much you like science compared to your other classes.
1 2 3 4 5
Hate It Near the Bottom In the Middle Near the Top My Favorite Class
2. Overall, how interesting do you find science?
1 2 3 4 5
Very boring Mostly boring Somewhat Very Extremely 3. How interesting are the labs in science class?
1 2 3 4 5
Not at all Very little Somewhat Very Extremely
4. When I was in elementary school we had many lab activities. 1
2
3
4
5
None Very few Some Many Always 5. My first real science lab activities were in middle school.
1
3
5
Disagree Maybe Agree 6. I learn the most about science when I’m engaged in lab activities.
1
2
3
4
5
Disagree Not Really Sometimes Agree Strongly Agree 7. I think I learn best when I read information from a book or worksheet.
1
2
3
4
5
Disagree Not Really Sometimes Agree Strongly Agree
8. I think I learn best when I can do “hands-on” type science activities 1
2
3
4
5
Disagree Not Really Sometimes Agree Strongly Agree
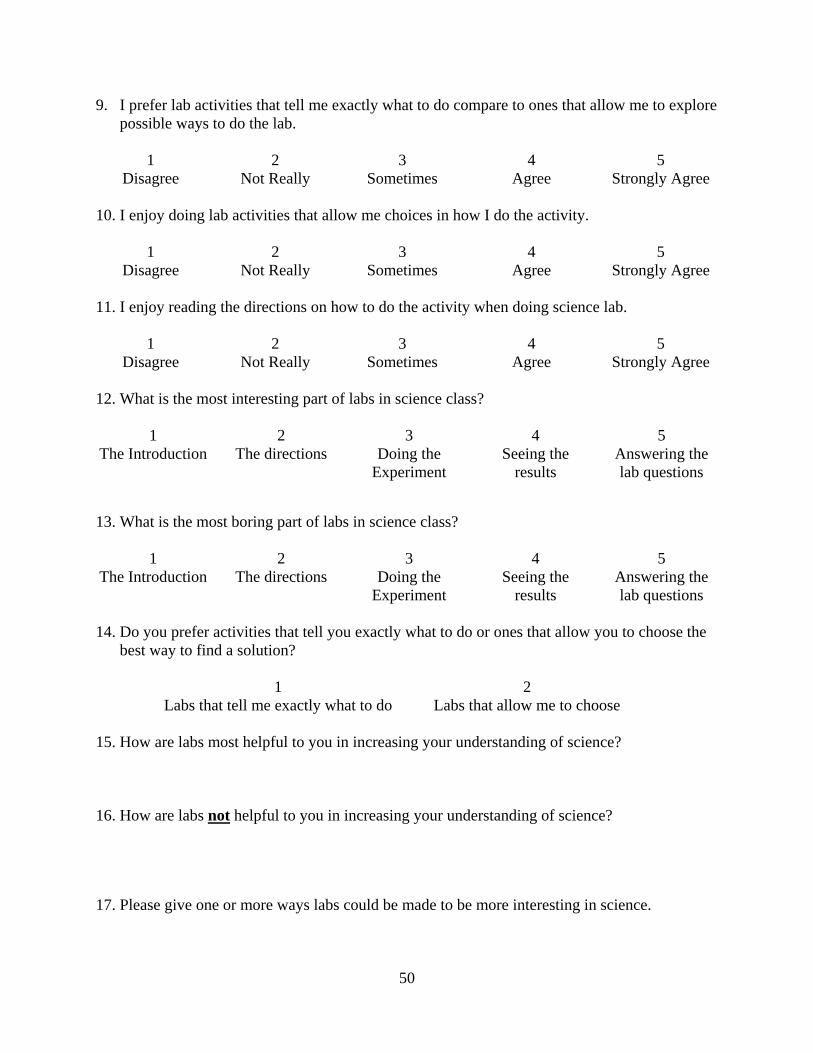
50
9. I prefer lab activities that tell me exactly what to do compare to ones that allow me to explore possible ways to do the lab.
1
2
3
4
5
Disagree Not Really Sometimes Agree Strongly Agree 10. I enjoy doing lab activities that allow me choices in how I do the activity.
1
2
3
4
5
Disagree Not Really Sometimes Agree Strongly Agree 11. I enjoy reading the directions on how to do the activity when doing science lab.
1
2
3
4
5
Disagree Not Really Sometimes Agree Strongly Agree 12. What is the most interesting part of labs in science class?
1 2 3 4 5
The Introduction The directions Doing the Experiment
Seeing the results
Answering the lab questions
13. What is the most boring part of labs in science class?
1 2 3 4 5
The Introduction The directions Doing the Experiment
Seeing the results
Answering the lab questions
14. Do you prefer activities that tell you exactly what to do or ones that allow you to choose the
best way to find a solution?
1 Labs that tell me exactly what to do
2 Labs that allow me to choose
15. How are labs most helpful to you in increasing your understanding of science? 16. How are labs not helpful to you in increasing your understanding of science?
17. Please give one or more ways labs could be made to be more interesting in science.
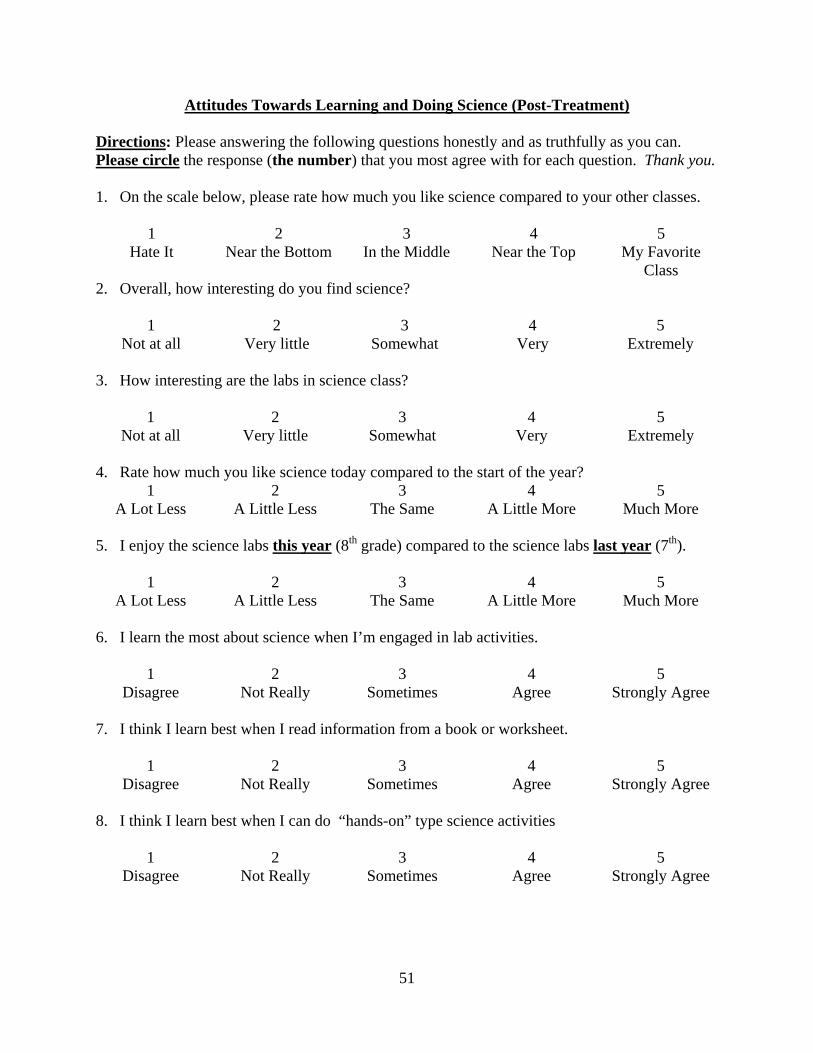
51
Attitudes Towards Learning and Doing Science (Post-Treatment)
Directions: Please answering the following questions honestly and as truthfully as you can. Please circle the response (the number) that you most agree with for each question. Thank you. 1. On the scale below, please rate how much you like science compared to your other classes.
1 2 3 4 5
Hate It Near the Bottom In the Middle Near the Top My Favorite Class
2. Overall, how interesting do you find science?
1 2 3 4 5 Not at all Very little Somewhat Very Extremely
3. How interesting are the labs in science class?
1 2 3 4 5
Not at all Very little Somewhat Very Extremely
4. Rate how much you like science today compared to the start of the year? 1 2 3 4 5
A Lot Less A Little Less The Same A Little More Much More 5. I enjoy the science labs this year (8th grade) compared to the science labs last year (7th).
1
2
3
4
5
A Lot Less A Little Less The Same A Little More Much More 6. I learn the most about science when I’m engaged in lab activities.
1
2
3
4
5
Disagree Not Really Sometimes Agree Strongly Agree 7. I think I learn best when I read information from a book or worksheet.
1
2
3
4
5
Disagree Not Really Sometimes Agree Strongly Agree
8. I think I learn best when I can do “hands-on” type science activities 1
2
3
4
5
Disagree Not Really Sometimes Agree Strongly Agree
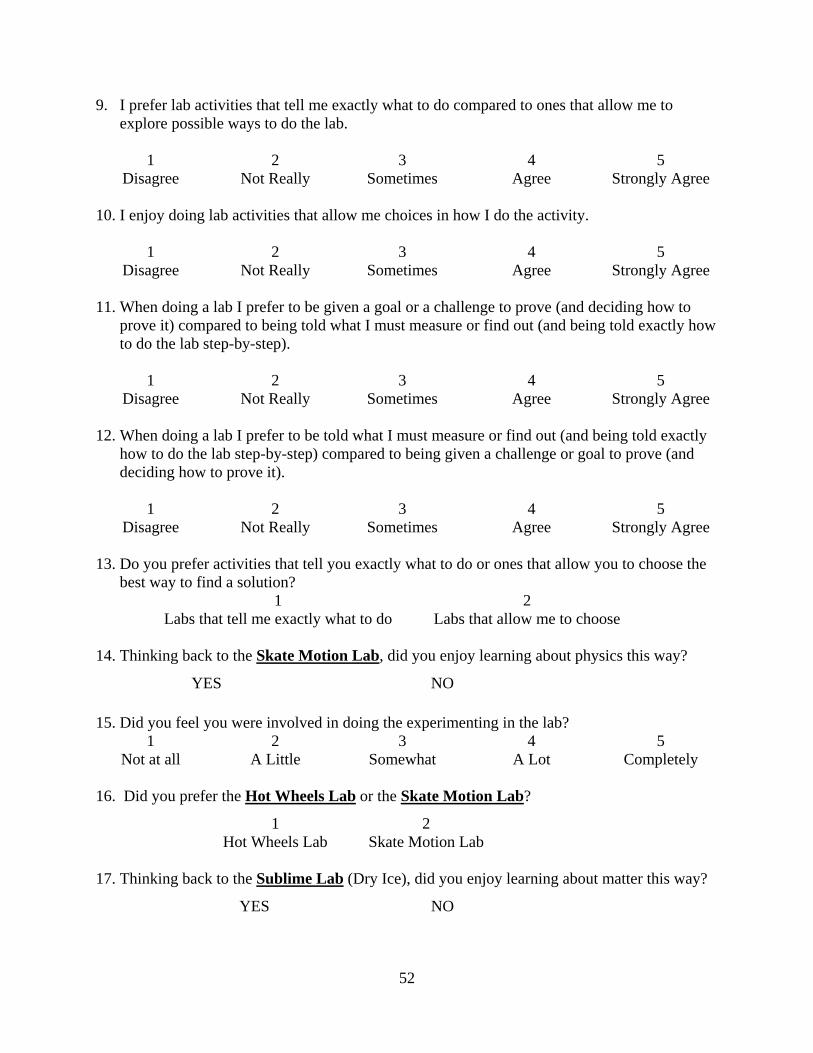
52
9. I prefer lab activities that tell me exactly what to do compared to ones that allow me to explore possible ways to do the lab.
1
2
3
4
5
Disagree Not Really Sometimes Agree Strongly Agree 10. I enjoy doing lab activities that allow me choices in how I do the activity.
1
2
3
4
5
Disagree Not Really Sometimes Agree Strongly Agree
11. When doing a lab I prefer to be given a goal or a challenge to prove (and deciding how to prove it) compared to being told what I must measure or find out (and being told exactly how to do the lab step-by-step).
1
2
3
4
5
Disagree Not Really Sometimes Agree Strongly Agree
12. When doing a lab I prefer to be told what I must measure or find out (and being told exactly how to do the lab step-by-step) compared to being given a challenge or goal to prove (and deciding how to prove it).
1
2
3
4
5
Disagree Not Really Sometimes Agree Strongly Agree 13. Do you prefer activities that tell you exactly what to do or ones that allow you to choose the
best way to find a solution? 1
Labs that tell me exactly what to do 2
Labs that allow me to choose 14. Thinking back to the Skate Motion Lab, did you enjoy learning about physics this way?
YES NO
15. Did you feel you were involved in doing the experimenting in the lab? 1 2 3 4 5
Not at all A Little Somewhat A Lot Completely
16. Did you prefer the Hot Wheels Lab or the Skate Motion Lab?
1 2 Hot Wheels Lab Skate Motion Lab
17. Thinking back to the Sublime Lab (Dry Ice), did you enjoy learning about matter this way?
YES NO
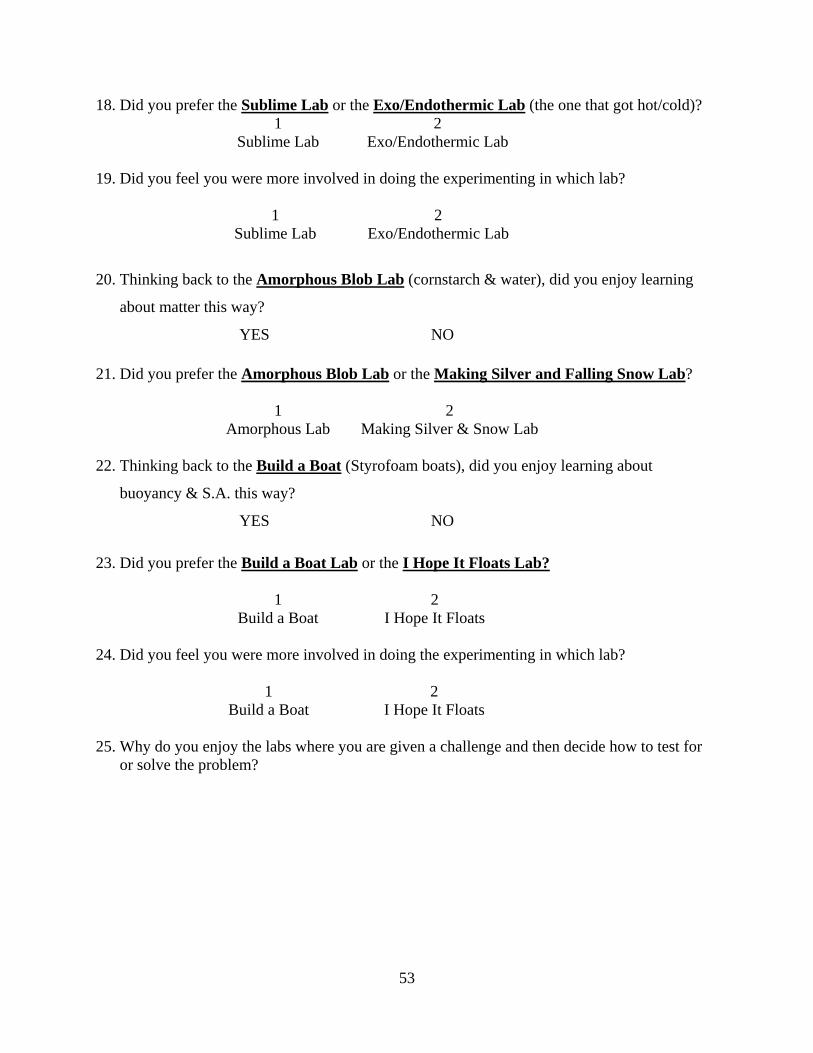
53
18. Did you prefer the Sublime Lab or the Exo/Endothermic Lab (the one that got hot/cold)? 1 2 Sublime Lab Exo/Endothermic Lab
19. Did you feel you were more involved in doing the experimenting in which lab?
1 2 Sublime Lab Exo/Endothermic Lab
20. Thinking back to the Amorphous Blob Lab (cornstarch & water), did you enjoy learning
about matter this way?
YES NO
21. Did you prefer the Amorphous Blob Lab or the Making Silver and Falling Snow Lab?
1 2
Amorphous Lab Making Silver & Snow Lab 22. Thinking back to the Build a Boat (Styrofoam boats), did you enjoy learning about
buoyancy & S.A. this way?
YES NO
23. Did you prefer the Build a Boat Lab or the I Hope It Floats Lab?
1 2 Build a Boat I Hope It Floats
24. Did you feel you were more involved in doing the experimenting in which lab?
1
2
Build a Boat I Hope It Floats 25. Why do you enjoy the labs where you are given a challenge and then decide how to test for
or solve the problem?
54
APPENDIX B
55
Dear Parents and Students,
I am currently working on my final thesis project for my masters in science education at
Montana State. One of the requirements for the degree is to develop a project that allows me to
explore ways to improve my teaching practices. Over the last year I have incorporated a new lab
activity approach that allows students a more inquiry-based experience. It seems to me that this
new approach, which allows students more choices in the experimental processes of the labs, has
resulted in more interaction and interest in learning science in my class. To confirm that this is
true I need to conduct student interviews in addition to the observations I have already made.
With your permission, I would like to ask your son or daughter questions on how they
enjoyed and what they learned from the new lab approach. This will be done during class, taking
no more than five to ten minutes. The student responses will be used to confirm whether or not
students are benefiting from the labs. Names and other student personal information will not be
included in my project or paper.
Thank you in advance for your support. A copy of my final project will be available from
my website for download later this summer. Please visit http://www.sierravistams.org/mathot/ to
download the document.
Sincerely,
Mr. Jean Philip Mathot
Science Teacher - Sierra Vista Middle School
_____ I give permission for my child to be interviewed for Mr. Mathot’s research project.
______I do not give permission for my child to be interviewed for Mr. Mathot’s research project.
Parent Signature:____________________________________________ Date: ____________

56
APPENDIX C
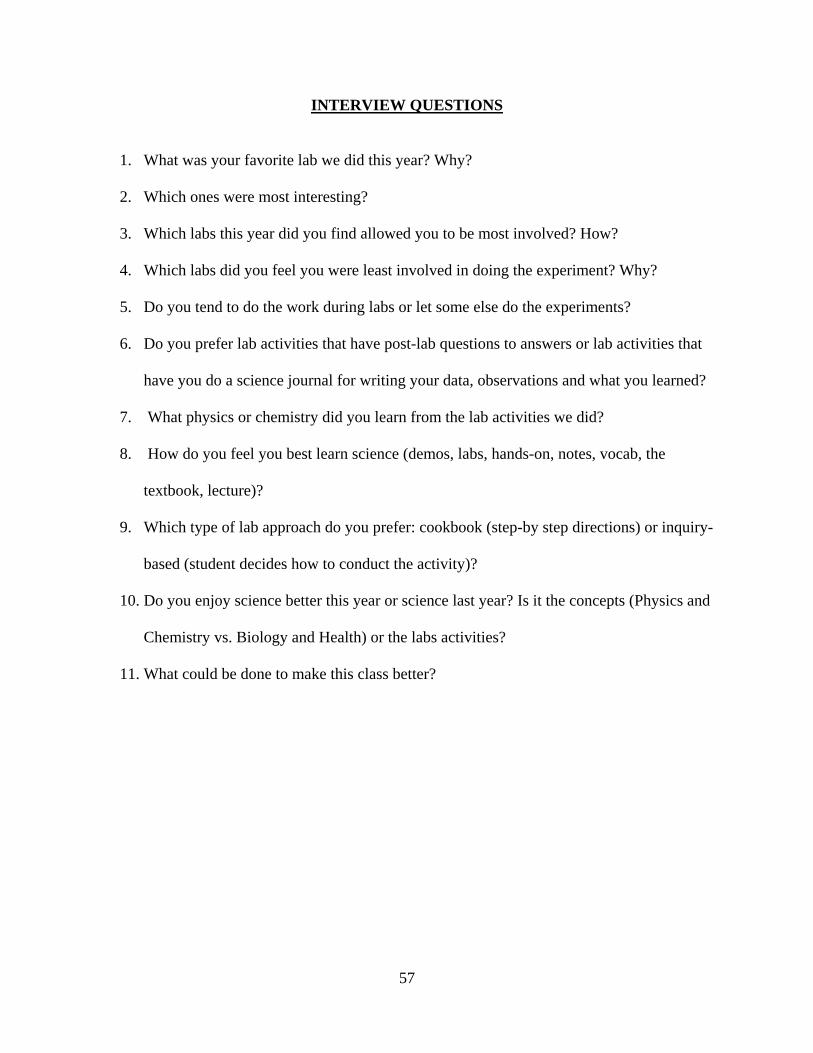
57
INTERVIEW QUESTIONS
1. What was your favorite lab we did this year? Why?
2. Which ones were most interesting?
3. Which labs this year did you find allowed you to be most involved? How?
4. Which labs did you feel you were least involved in doing the experiment? Why?
5. Do you tend to do the work during labs or let some else do the experiments?
6. Do you prefer lab activities that have post-lab questions to answers or lab activities that
have you do a science journal for writing your data, observations and what you learned?
7. What physics or chemistry did you learn from the lab activities we did?
8. How do you feel you best learn science (demos, labs, hands-on, notes, vocab, the
textbook, lecture)?
9. Which type of lab approach do you prefer: cookbook (step-by step directions) or inquiry-
based (student decides how to conduct the activity)?
10. Do you enjoy science better this year or science last year? Is it the concepts (Physics and
Chemistry vs. Biology and Health) or the labs activities?
11. What could be done to make this class better?
58
APPENDIX D
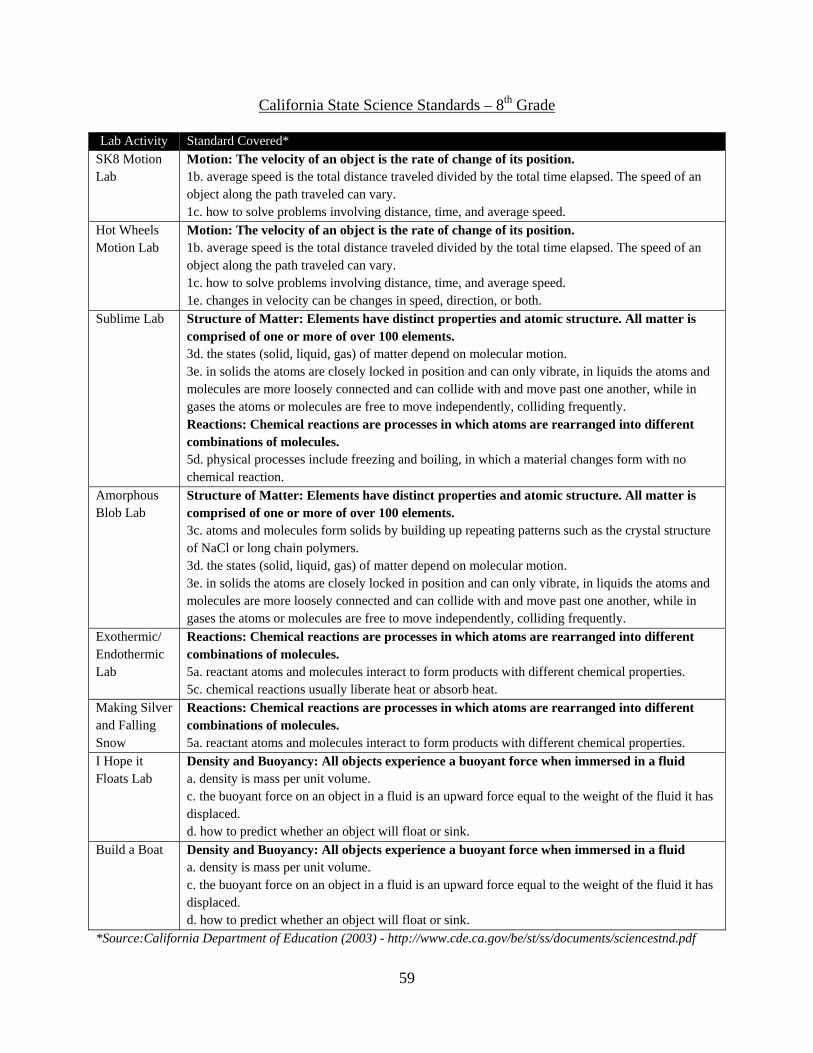
59
California State Science Standards – 8th Grade
Lab Activity Standard Covered* SK8 Motion Lab
Motion: The velocity of an object is the rate of change of its position. 1b. average speed is the total distance traveled divided by the total time elapsed. The speed of an object along the path traveled can vary. 1c. how to solve problems involving distance, time, and average speed.
Hot Wheels Motion Lab
Motion: The velocity of an object is the rate of change of its position. 1b. average speed is the total distance traveled divided by the total time elapsed. The speed of an object along the path traveled can vary. 1c. how to solve problems involving distance, time, and average speed. 1e. changes in velocity can be changes in speed, direction, or both.
Sublime Lab Structure of Matter: Elements have distinct properties and atomic structure. All matter is comprised of one or more of over 100 elements. 3d. the states (solid, liquid, gas) of matter depend on molecular motion. 3e. in solids the atoms are closely locked in position and can only vibrate, in liquids the atoms and molecules are more loosely connected and can collide with and move past one another, while in gases the atoms or molecules are free to move independently, colliding frequently. Reactions: Chemical reactions are processes in which atoms are rearranged into different combinations of molecules. 5d. physical processes include freezing and boiling, in which a material changes form with no chemical reaction.
Amorphous Blob Lab
Structure of Matter: Elements have distinct properties and atomic structure. All matter is comprised of one or more of over 100 elements. 3c. atoms and molecules form solids by building up repeating patterns such as the crystal structure of NaCl or long chain polymers. 3d. the states (solid, liquid, gas) of matter depend on molecular motion. 3e. in solids the atoms are closely locked in position and can only vibrate, in liquids the atoms and molecules are more loosely connected and can collide with and move past one another, while in gases the atoms or molecules are free to move independently, colliding frequently.
Exothermic/ Endothermic Lab
Reactions: Chemical reactions are processes in which atoms are rearranged into different combinations of molecules. 5a. reactant atoms and molecules interact to form products with different chemical properties. 5c. chemical reactions usually liberate heat or absorb heat.
Making Silver and Falling Snow
Reactions: Chemical reactions are processes in which atoms are rearranged into different combinations of molecules. 5a. reactant atoms and molecules interact to form products with different chemical properties.
I Hope it Floats Lab
Density and Buoyancy: All objects experience a buoyant force when immersed in a fluid a. density is mass per unit volume. c. the buoyant force on an object in a fluid is an upward force equal to the weight of the fluid it has displaced. d. how to predict whether an object will float or sink.
Build a Boat Density and Buoyancy: All objects experience a buoyant force when immersed in a fluid a. density is mass per unit volume. c. the buoyant force on an object in a fluid is an upward force equal to the weight of the fluid it has displaced. d. how to predict whether an object will float or sink.
*Source:California Department of Education (2003) - http://www.cde.ca.gov/be/st/ss/documents/sciencestnd.pdf
60
APPENDIX E
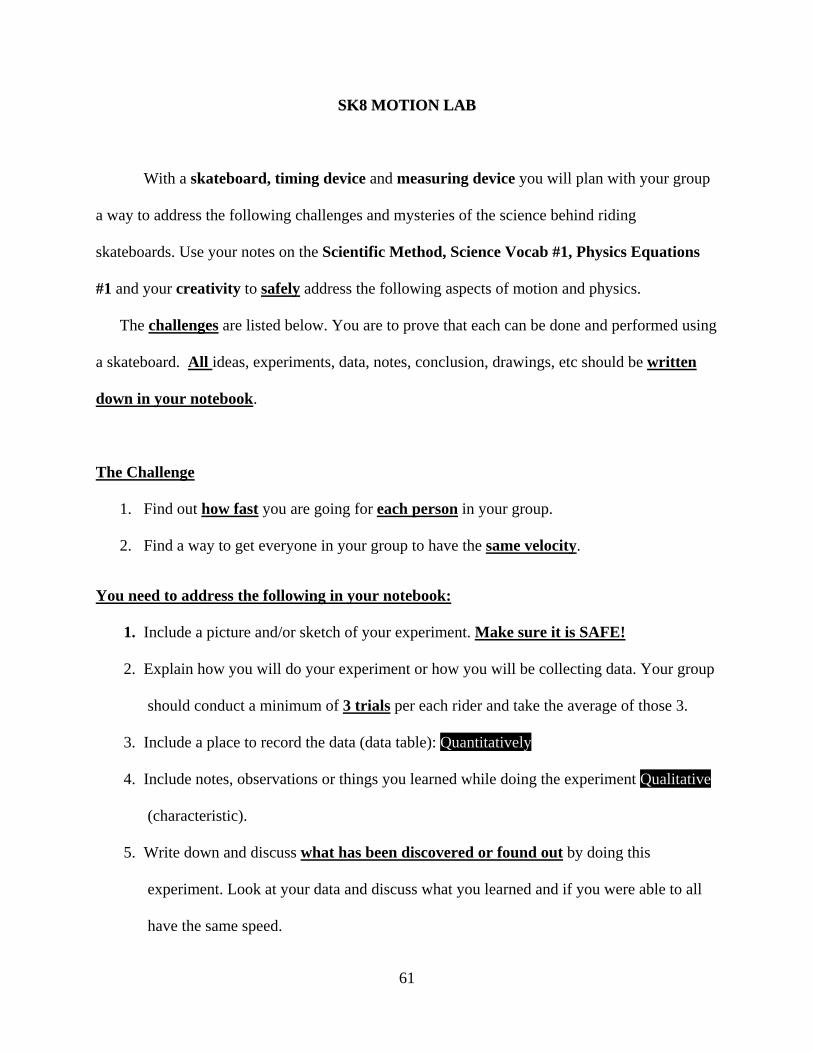
61
SSKK88 MMOOTTIIOONN LLAABB
With a skateboard, timing device and measuring device you will plan with your group
a way to address the following challenges and mysteries of the science behind riding
skateboards. Use your notes on the Scientific Method, Science Vocab #1, Physics Equations
#1 and your creativity to safely address the following aspects of motion and physics.
The challenges are listed below. You are to prove that each can be done and performed using
a skateboard. All ideas, experiments, data, notes, conclusion, drawings, etc should be written
down in your notebook.
The Challenge
1. Find out how fast you are going for each person in your group.
2. Find a way to get everyone in your group to have the same velocity.
You need to address the following in your notebook:
1. Include a picture and/or sketch of your experiment. Make sure it is SAFE!
2. Explain how you will do your experiment or how you will be collecting data. Your group
should conduct a minimum of 3 trials per each rider and take the average of those 3.
3. Include a place to record the data (data table): Quantitatively
4. Include notes, observations or things you learned while doing the experiment Qualitative
(characteristic).
5. Write down and discuss what has been discovered or found out by doing this
experiment. Look at your data and discuss what you learned and if you were able to all
have the same speed.
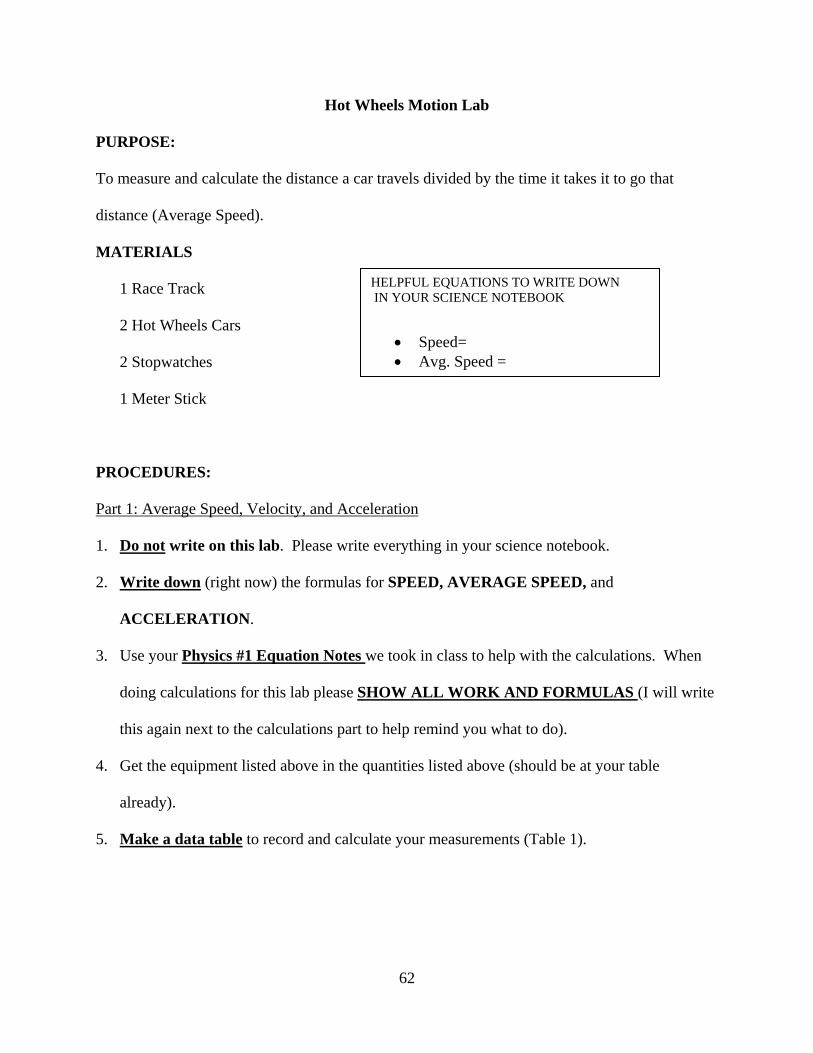
62
Hot Wheels Motion Lab
PURPOSE:
To measure and calculate the distance a car travels divided by the time it takes it to go that
distance (Average Speed).
MATERIALS
1 Race Track
2 Hot Wheels Cars
2 Stopwatches
1 Meter Stick
PROCEDURES:
Part 1: Average Speed, Velocity, and Acceleration
1. Do not write on this lab. Please write everything in your science notebook.
2. Write down (right now) the formulas for SPEED, AVERAGE SPEED, and
ACCELERATION.
3. Use your Physics #1 Equation Notes we took in class to help with the calculations. When
doing calculations for this lab please SHOW ALL WORK AND FORMULAS (I will write
this again next to the calculations part to help remind you what to do).
4. Get the equipment listed above in the quantities listed above (should be at your table
already).
5. Make a data table to record and calculate your measurements (Table 1).
HELPFUL EQUATIONS TO WRITE DOWN IN YOUR SCIENCE NOTEBOOK
• Speed= • Avg. Speed =
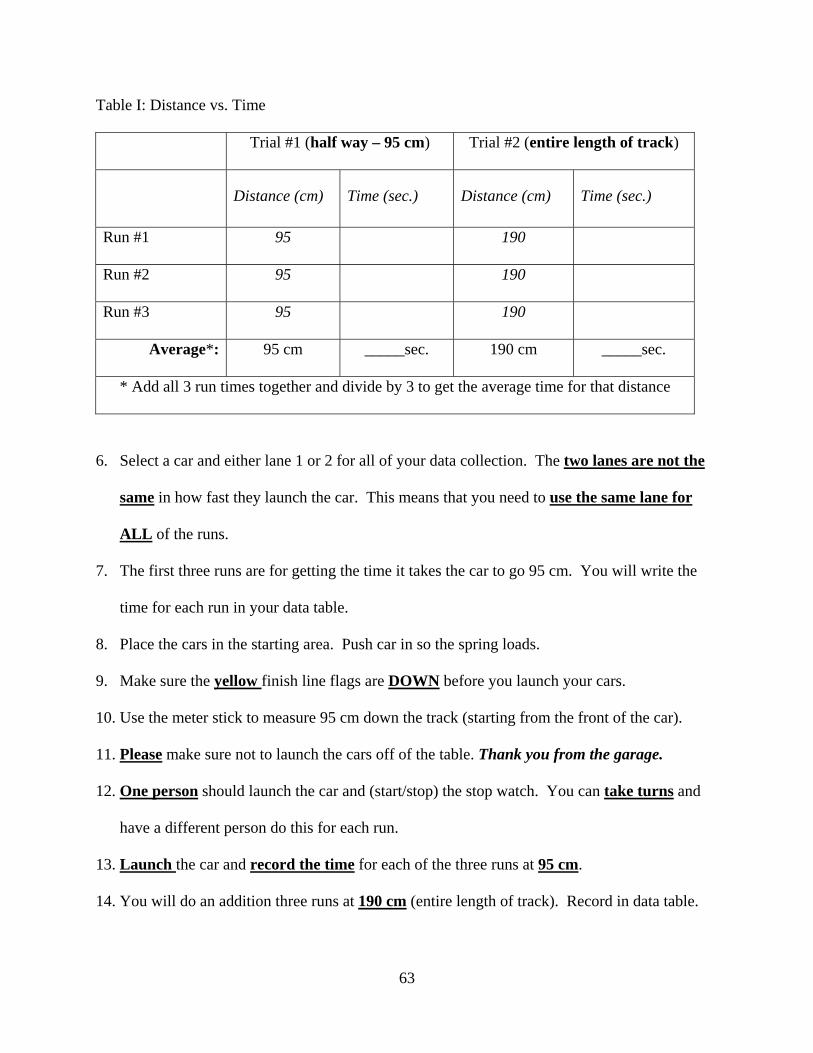
63
Table I: Distance vs. Time
Trial #1 (half way – 95 cm) Trial #2 (entire length of track)
Distance (cm) Time (sec.) Distance (cm) Time (sec.)
Run #1 95 190
Run #2 95 190
Run #3 95 190
Average*: 95 cm _____sec. 190 cm _____sec.
* Add all 3 run times together and divide by 3 to get the average time for that distance
6. Select a car and either lane 1 or 2 for all of your data collection. The two lanes are not the
same in how fast they launch the car. This means that you need to use the same lane for
ALL of the runs.
7. The first three runs are for getting the time it takes the car to go 95 cm. You will write the
time for each run in your data table.
8. Place the cars in the starting area. Push car in so the spring loads.
9. Make sure the yellow finish line flags are DOWN before you launch your cars.
10. Use the meter stick to measure 95 cm down the track (starting from the front of the car).
11. Please make sure not to launch the cars off of the table. Thank you from the garage.
12. One person should launch the car and (start/stop) the stop watch. You can take turns and
have a different person do this for each run.
13. Launch the car and record the time for each of the three runs at 95 cm.
14. You will do an addition three runs at 190 cm (entire length of track). Record in data table.
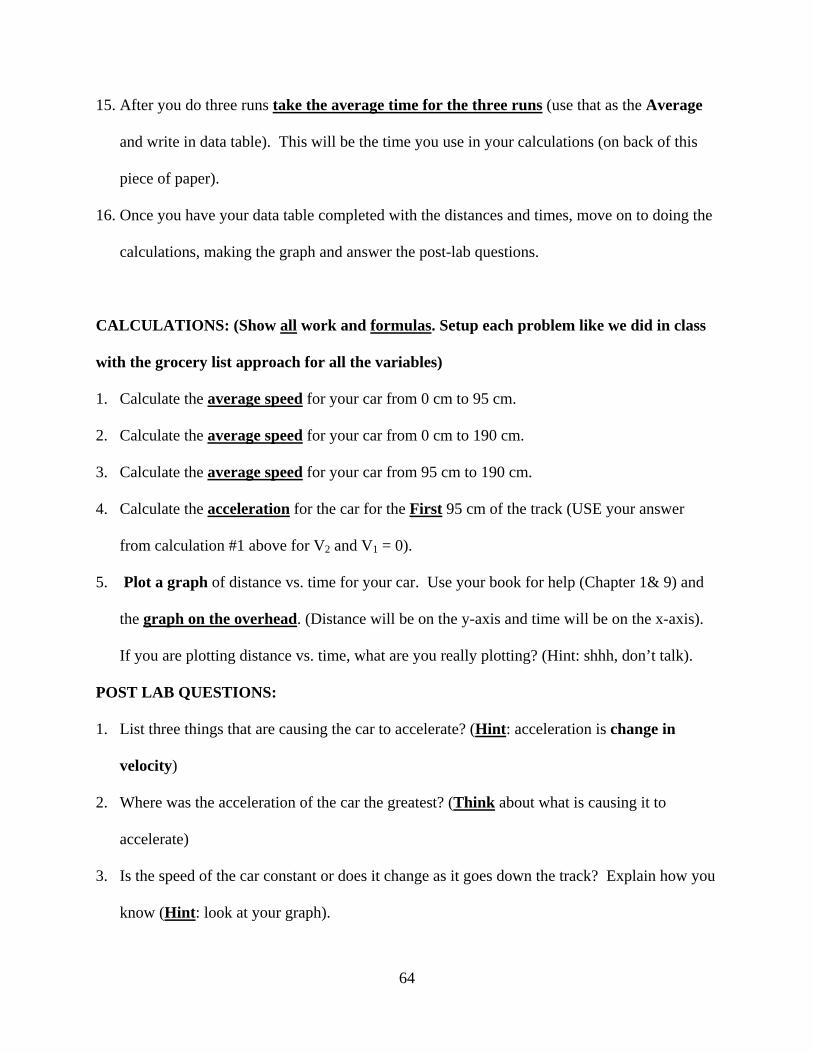
64
15. After you do three runs take the average time for the three runs (use that as the Average
and write in data table). This will be the time you use in your calculations (on back of this
piece of paper).
16. Once you have your data table completed with the distances and times, move on to doing the
calculations, making the graph and answer the post-lab questions.
CALCULATIONS: (Show all work and formulas. Setup each problem like we did in class
with the grocery list approach for all the variables)
1. Calculate the average speed for your car from 0 cm to 95 cm.
2. Calculate the average speed for your car from 0 cm to 190 cm.
3. Calculate the average speed for your car from 95 cm to 190 cm.
4. Calculate the acceleration for the car for the First 95 cm of the track (USE your answer
from calculation #1 above for V2 and V1 = 0).
5. Plot a graph of distance vs. time for your car. Use your book for help (Chapter 1& 9) and
the graph on the overhead. (Distance will be on the y-axis and time will be on the x-axis).
If you are plotting distance vs. time, what are you really plotting? (Hint: shhh, don’t talk).
POST LAB QUESTIONS:
1. List three things that are causing the car to accelerate? (Hint: acceleration is change in
velocity)
2. Where was the acceleration of the car the greatest? (Think about what is causing it to
accelerate)
3. Is the speed of the car constant or does it change as it goes down the track? Explain how you
know (Hint: look at your graph).
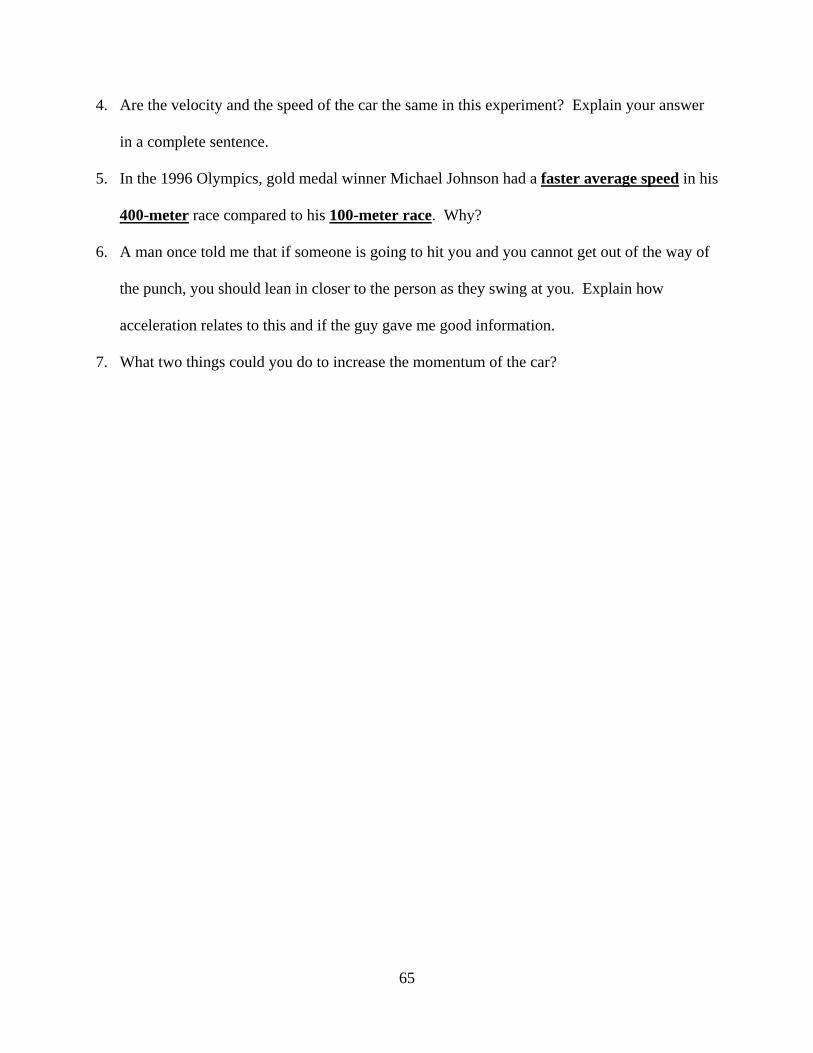
65
4. Are the velocity and the speed of the car the same in this experiment? Explain your answer
in a complete sentence.
5. In the 1996 Olympics, gold medal winner Michael Johnson had a faster average speed in his
400-meter race compared to his 100-meter race. Why?
6. A man once told me that if someone is going to hit you and you cannot get out of the way of
the punch, you should lean in closer to the person as they swing at you. Explain how
acceleration relates to this and if the guy gave me good information.
7. What two things could you do to increase the momentum of the car?

66
APPENDIX F
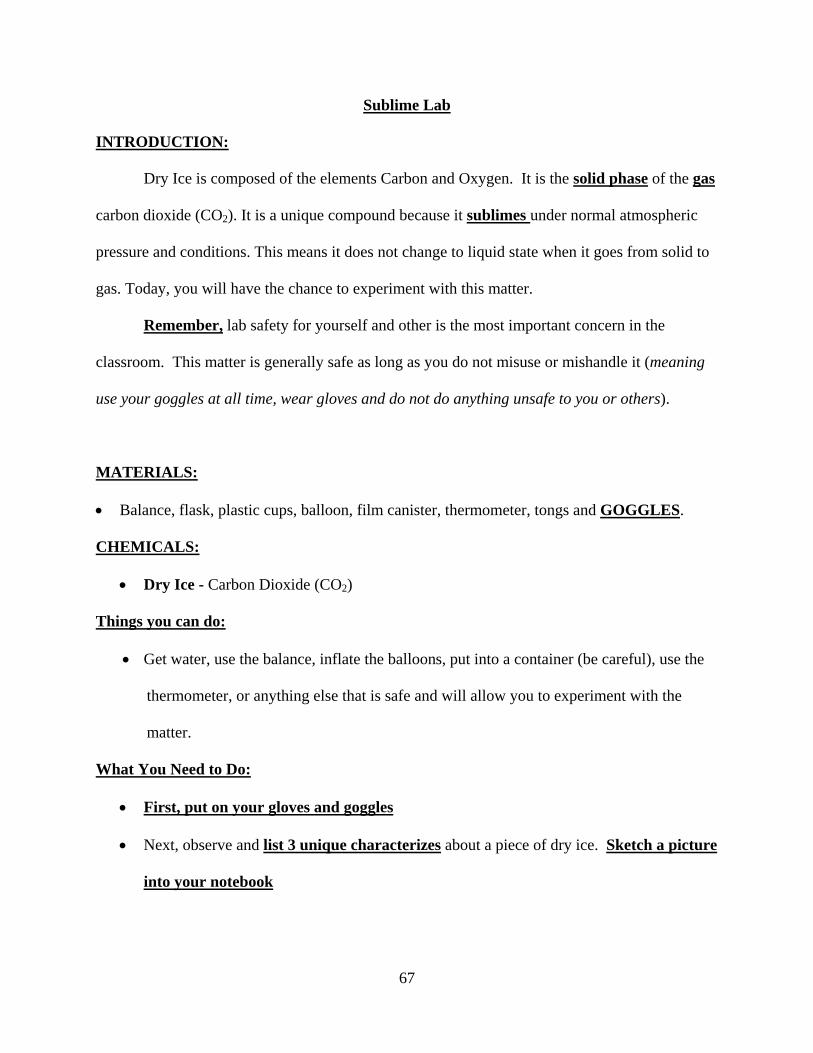
67
Sublime Lab
INTRODUCTION:
Dry Ice is composed of the elements Carbon and Oxygen. It is the solid phase of the gas
carbon dioxide (CO2). It is a unique compound because it sublimes under normal atmospheric
pressure and conditions. This means it does not change to liquid state when it goes from solid to
gas. Today, you will have the chance to experiment with this matter.
Remember, lab safety for yourself and other is the most important concern in the
classroom. This matter is generally safe as long as you do not misuse or mishandle it (meaning
use your goggles at all time, wear gloves and do not do anything unsafe to you or others).
MATERIALS:
• Balance, flask, plastic cups, balloon, film canister, thermometer, tongs and GOGGLES.
CHEMICALS:
• Dry Ice - Carbon Dioxide (CO2)
Things you can do:
• Get water, use the balance, inflate the balloons, put into a container (be careful), use the
thermometer, or anything else that is safe and will allow you to experiment with the
matter.
What You Need to Do:
• First, put on your gloves and goggles
• Next, observe and list 3 unique characterizes about a piece of dry ice. Sketch a picture
into your notebook
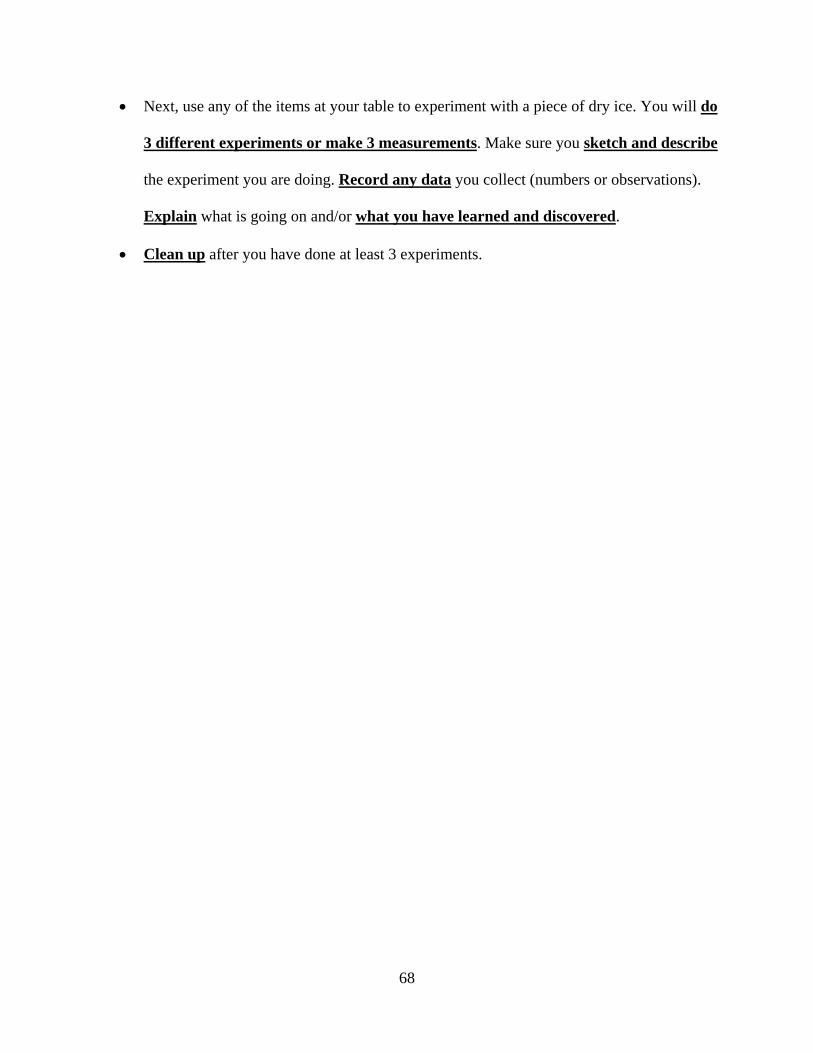
68
• Next, use any of the items at your table to experiment with a piece of dry ice. You will do
3 different experiments or make 3 measurements. Make sure you sketch and describe
the experiment you are doing. Record any data you collect (numbers or observations).
Explain what is going on and/or what you have learned and discovered.
• Clean up after you have done at least 3 experiments.
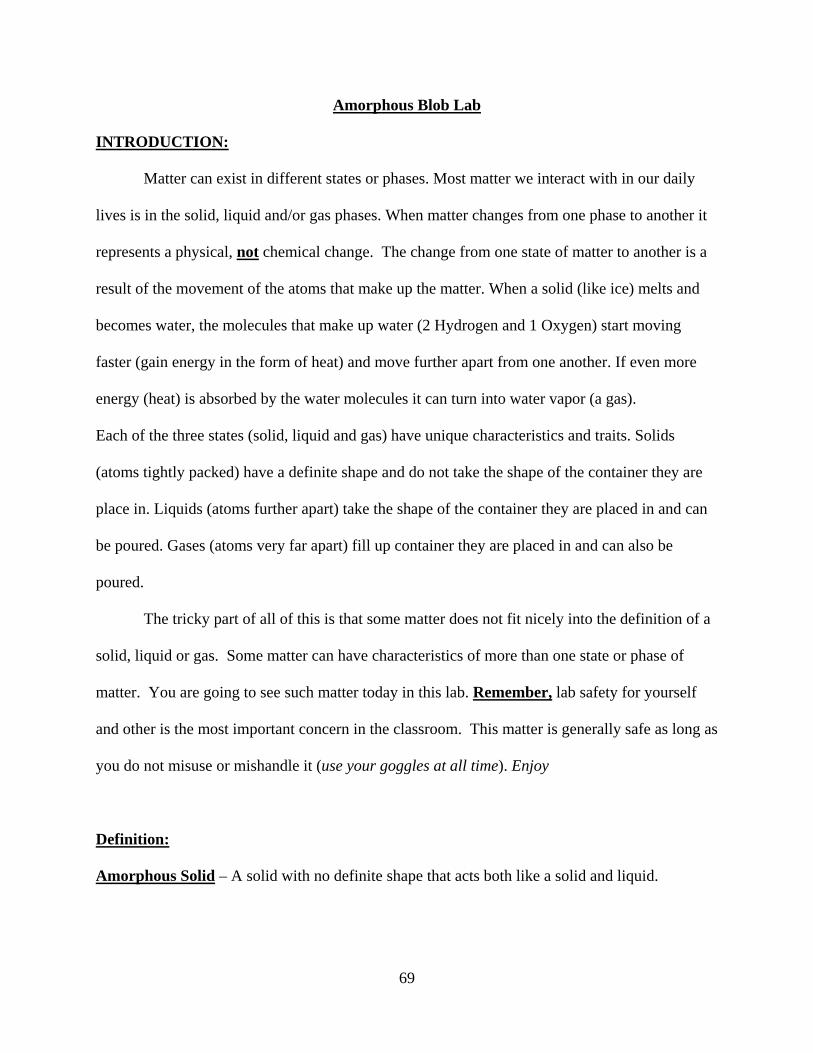
69
Amorphous Blob Lab
INTRODUCTION:
Matter can exist in different states or phases. Most matter we interact with in our daily
lives is in the solid, liquid and/or gas phases. When matter changes from one phase to another it
represents a physical, not chemical change. The change from one state of matter to another is a
result of the movement of the atoms that make up the matter. When a solid (like ice) melts and
becomes water, the molecules that make up water (2 Hydrogen and 1 Oxygen) start moving
faster (gain energy in the form of heat) and move further apart from one another. If even more
energy (heat) is absorbed by the water molecules it can turn into water vapor (a gas).
Each of the three states (solid, liquid and gas) have unique characteristics and traits. Solids
(atoms tightly packed) have a definite shape and do not take the shape of the container they are
place in. Liquids (atoms further apart) take the shape of the container they are placed in and can
be poured. Gases (atoms very far apart) fill up container they are placed in and can also be
poured.
The tricky part of all of this is that some matter does not fit nicely into the definition of a
solid, liquid or gas. Some matter can have characteristics of more than one state or phase of
matter. You are going to see such matter today in this lab. Remember, lab safety for yourself
and other is the most important concern in the classroom. This matter is generally safe as long as
you do not misuse or mishandle it (use your goggles at all time). Enjoy
Definition:
Amorphous Solid – A solid with no definite shape that acts both like a solid and liquid.
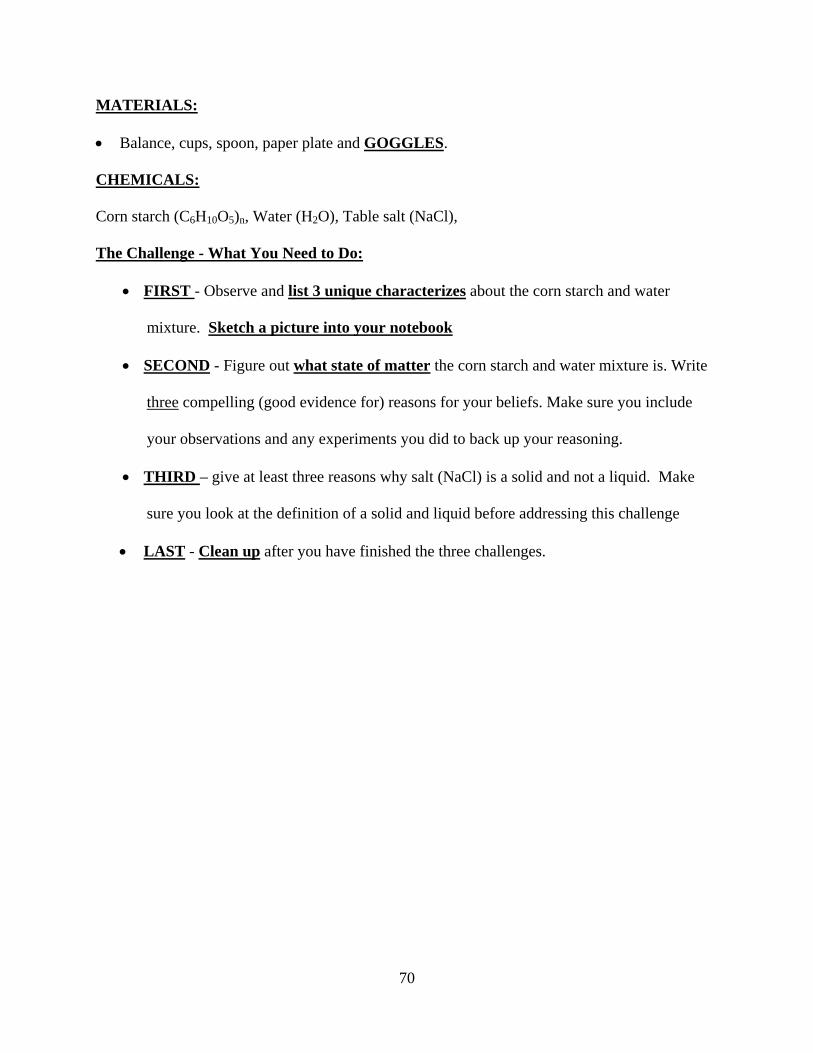
70
MATERIALS:
• Balance, cups, spoon, paper plate and GOGGLES.
CHEMICALS:
Corn starch (C6H10O5)n, Water (H2O), Table salt (NaCl),
The Challenge - What You Need to Do:
• FIRST - Observe and list 3 unique characterizes about the corn starch and water
mixture. Sketch a picture into your notebook
• SECOND - Figure out what state of matter the corn starch and water mixture is. Write
three compelling (good evidence for) reasons for your beliefs. Make sure you include
your observations and any experiments you did to back up your reasoning.
• THIRD – give at least three reasons why salt (NaCl) is a solid and not a liquid. Make
sure you look at the definition of a solid and liquid before addressing this challenge
• LAST - Clean up after you have finished the three challenges.
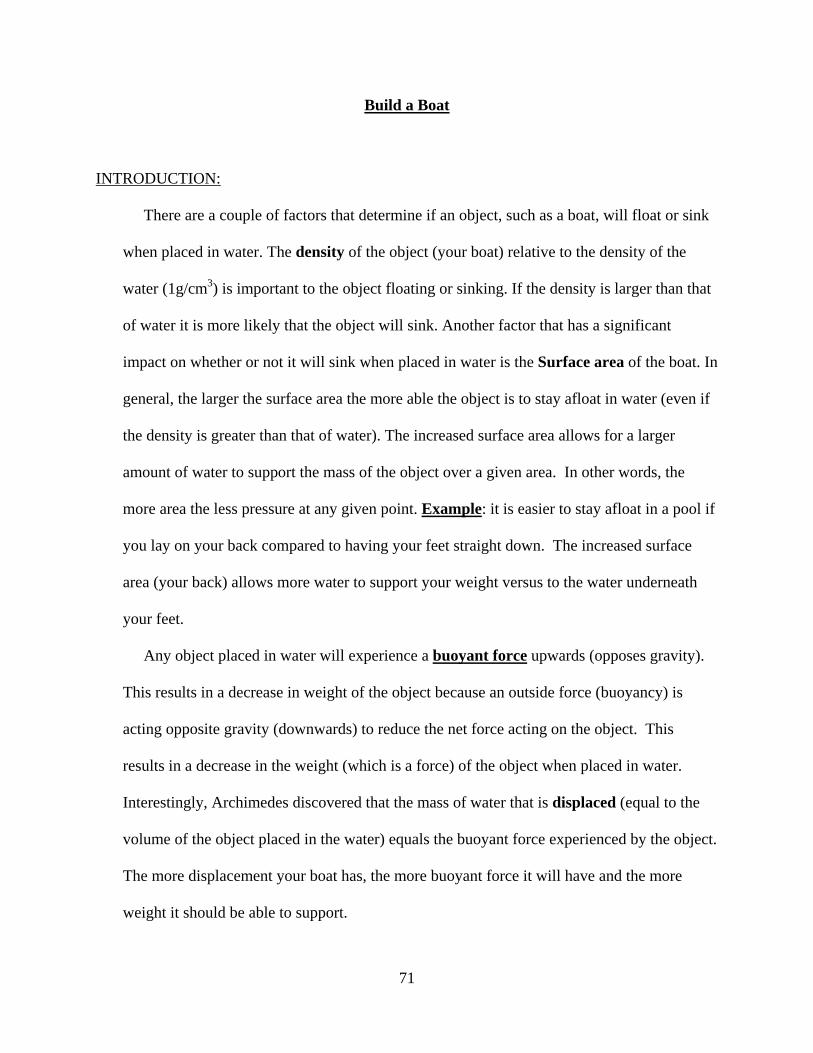
71
Build a Boat
INTRODUCTION:
There are a couple of factors that determine if an object, such as a boat, will float or sink
when placed in water. The density of the object (your boat) relative to the density of the
water (1g/cm3) is important to the object floating or sinking. If the density is larger than that
of water it is more likely that the object will sink. Another factor that has a significant
impact on whether or not it will sink when placed in water is the Surface area of the boat. In
general, the larger the surface area the more able the object is to stay afloat in water (even if
the density is greater than that of water). The increased surface area allows for a larger
amount of water to support the mass of the object over a given area. In other words, the
more area the less pressure at any given point. Example: it is easier to stay afloat in a pool if
you lay on your back compared to having your feet straight down. The increased surface
area (your back) allows more water to support your weight versus to the water underneath
your feet.
Any object placed in water will experience a buoyant force upwards (opposes gravity).
This results in a decrease in weight of the object because an outside force (buoyancy) is
acting opposite gravity (downwards) to reduce the net force acting on the object. This
results in a decrease in the weight (which is a force) of the object when placed in water.
Interestingly, Archimedes discovered that the mass of water that is displaced (equal to the
volume of the object placed in the water) equals the buoyant force experienced by the object.
The more displacement your boat has, the more buoyant force it will have and the more
weight it should be able to support.
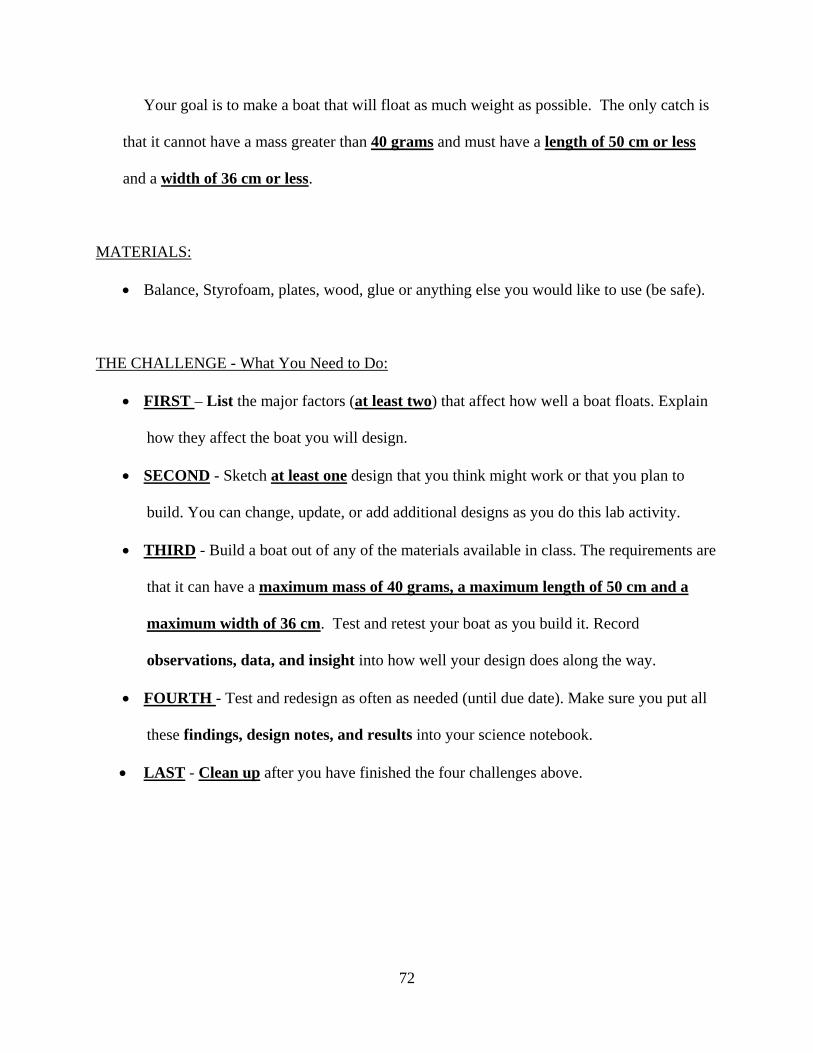
72
Your goal is to make a boat that will float as much weight as possible. The only catch is
that it cannot have a mass greater than 40 grams and must have a length of 50 cm or less
and a width of 36 cm or less.
MATERIALS:
• Balance, Styrofoam, plates, wood, glue or anything else you would like to use (be safe).
THE CHALLENGE - What You Need to Do:
• FIRST – List the major factors (at least two) that affect how well a boat floats. Explain
how they affect the boat you will design.
• SECOND - Sketch at least one design that you think might work or that you plan to
build. You can change, update, or add additional designs as you do this lab activity.
• THIRD - Build a boat out of any of the materials available in class. The requirements are
that it can have a maximum mass of 40 grams, a maximum length of 50 cm and a
maximum width of 36 cm. Test and retest your boat as you build it. Record
observations, data, and insight into how well your design does along the way.
• FOURTH - Test and redesign as often as needed (until due date). Make sure you put all
these findings, design notes, and results into your science notebook.
• LAST - Clean up after you have finished the four challenges above.

73
APPENDIX G
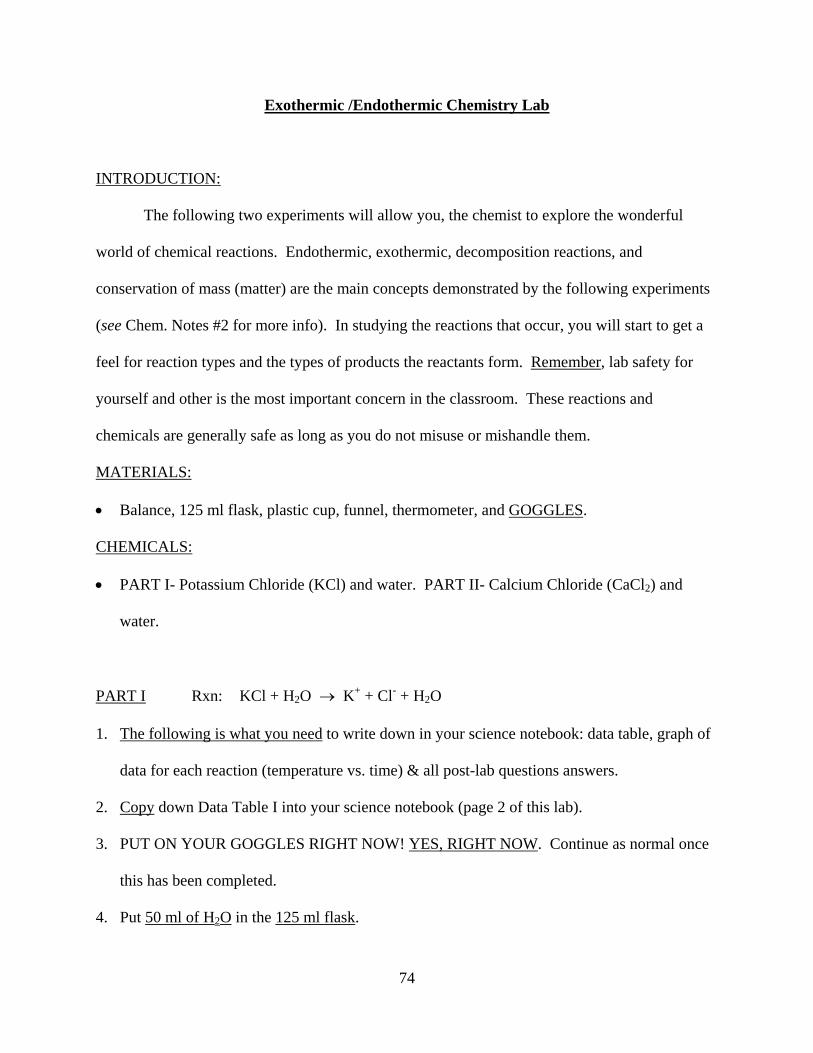
74
Exothermic /Endothermic Chemistry Lab
INTRODUCTION:
The following two experiments will allow you, the chemist to explore the wonderful
world of chemical reactions. Endothermic, exothermic, decomposition reactions, and
conservation of mass (matter) are the main concepts demonstrated by the following experiments
(see Chem. Notes #2 for more info). In studying the reactions that occur, you will start to get a
feel for reaction types and the types of products the reactants form. Remember, lab safety for
yourself and other is the most important concern in the classroom. These reactions and
chemicals are generally safe as long as you do not misuse or mishandle them.
MATERIALS:
• Balance, 125 ml flask, plastic cup, funnel, thermometer, and GOGGLES.
CHEMICALS:
• PART I- Potassium Chloride (KCl) and water. PART II- Calcium Chloride (CaCl2) and
water.
PART I Rxn: KCl + H2O → K+ + Cl- + H2O
1. The following is what you need to write down in your science notebook: data table, graph of
data for each reaction (temperature vs. time) & all post-lab questions answers.
2. Copy down Data Table I into your science notebook (page 2 of this lab).
3. PUT ON YOUR GOGGLES RIGHT NOW! YES, RIGHT NOW. Continue as normal once
this has been completed.
4. Put 50 ml of H2O in the 125 ml flask.
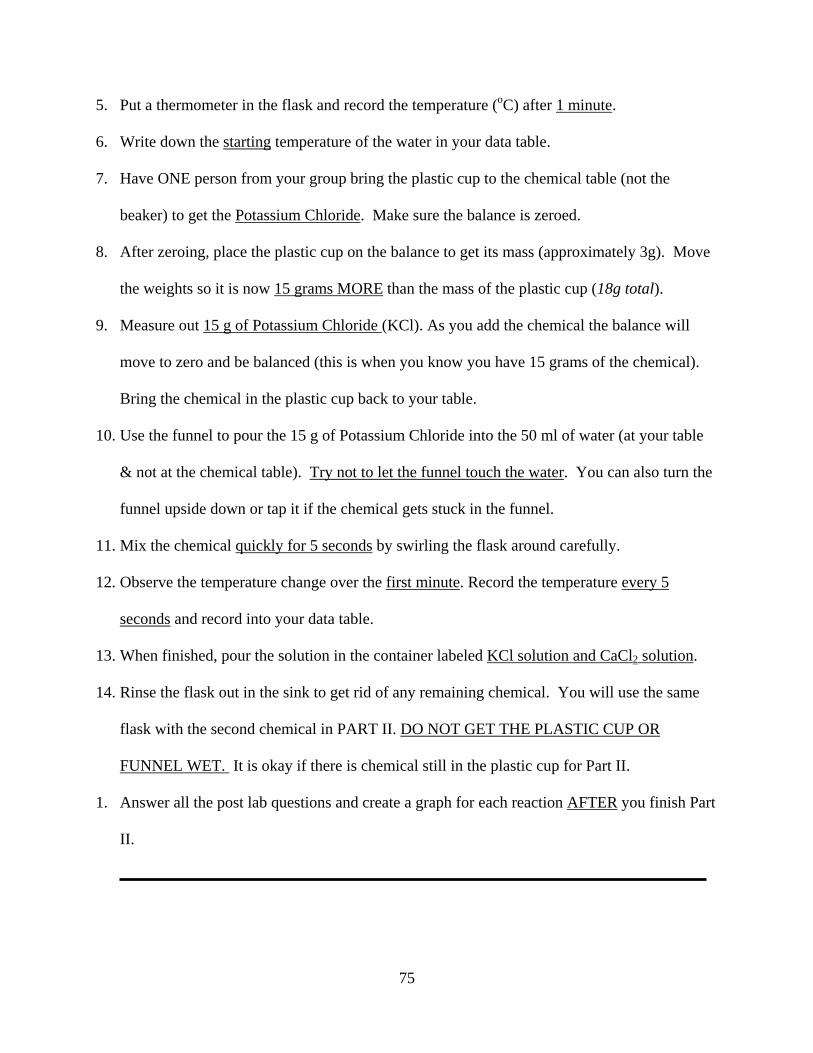
75
5. Put a thermometer in the flask and record the temperature (oC) after 1 minute.
6. Write down the starting temperature of the water in your data table.
7. Have ONE person from your group bring the plastic cup to the chemical table (not the
beaker) to get the Potassium Chloride. Make sure the balance is zeroed.
8. After zeroing, place the plastic cup on the balance to get its mass (approximately 3g). Move
the weights so it is now 15 grams MORE than the mass of the plastic cup (18g total).
9. Measure out 15 g of Potassium Chloride (KCl). As you add the chemical the balance will
move to zero and be balanced (this is when you know you have 15 grams of the chemical).
Bring the chemical in the plastic cup back to your table.
10. Use the funnel to pour the 15 g of Potassium Chloride into the 50 ml of water (at your table
& not at the chemical table). Try not to let the funnel touch the water. You can also turn the
funnel upside down or tap it if the chemical gets stuck in the funnel.
11. Mix the chemical quickly for 5 seconds by swirling the flask around carefully.
12. Observe the temperature change over the first minute. Record the temperature every 5
seconds and record into your data table.
13. When finished, pour the solution in the container labeled KCl solution and CaCl2 solution.
14. Rinse the flask out in the sink to get rid of any remaining chemical. You will use the same
flask with the second chemical in PART II. DO NOT GET THE PLASTIC CUP OR
FUNNEL WET. It is okay if there is chemical still in the plastic cup for Part II.
1. Answer all the post lab questions and create a graph for each reaction AFTER you finish Part
II.
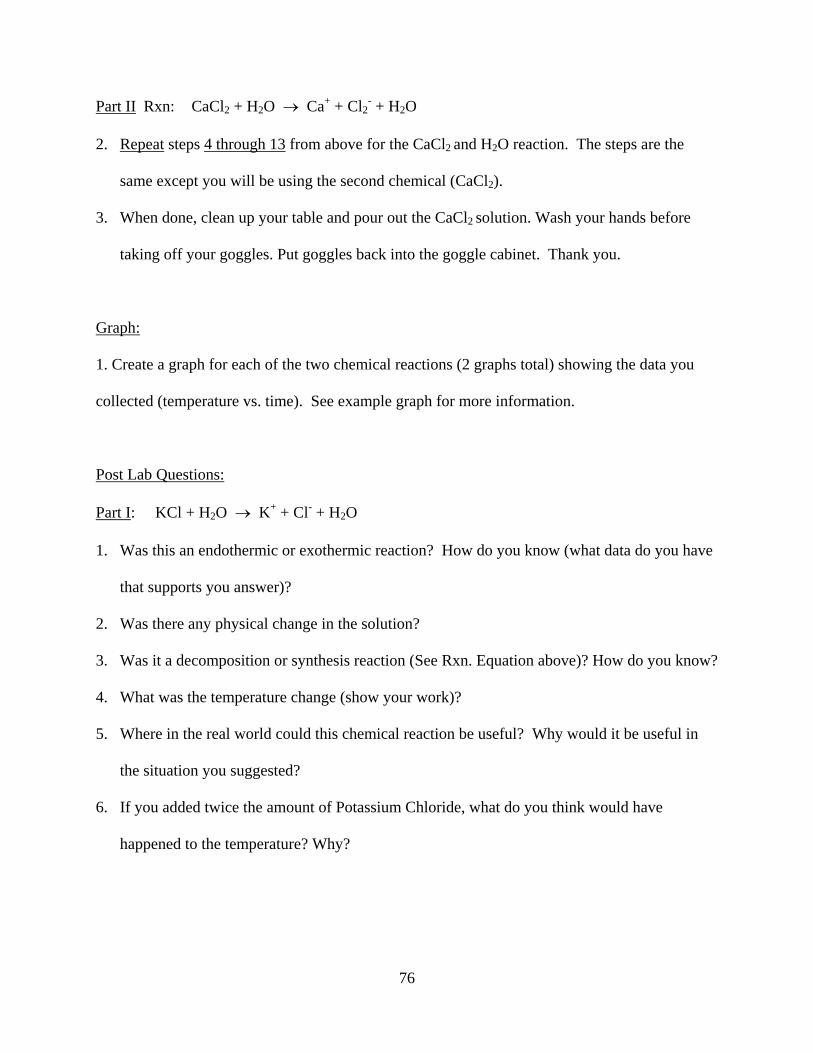
76
Part II Rxn: CaCl2 + H2O → Ca+ + Cl2- + H2O
2. Repeat steps 4 through 13 from above for the CaCl2 and H2O reaction. The steps are the
same except you will be using the second chemical (CaCl2).
3. When done, clean up your table and pour out the CaCl2 solution. Wash your hands before
taking off your goggles. Put goggles back into the goggle cabinet. Thank you.
Graph:
1. Create a graph for each of the two chemical reactions (2 graphs total) showing the data you
collected (temperature vs. time). See example graph for more information.
Post Lab Questions:
Part I: KCl + H2O → K+ + Cl- + H2O
1. Was this an endothermic or exothermic reaction? How do you know (what data do you have
that supports you answer)?
2. Was there any physical change in the solution?
3. Was it a decomposition or synthesis reaction (See Rxn. Equation above)? How do you know?
4. What was the temperature change (show your work)?
5. Where in the real world could this chemical reaction be useful? Why would it be useful in
the situation you suggested?
6. If you added twice the amount of Potassium Chloride, what do you think would have
happened to the temperature? Why?
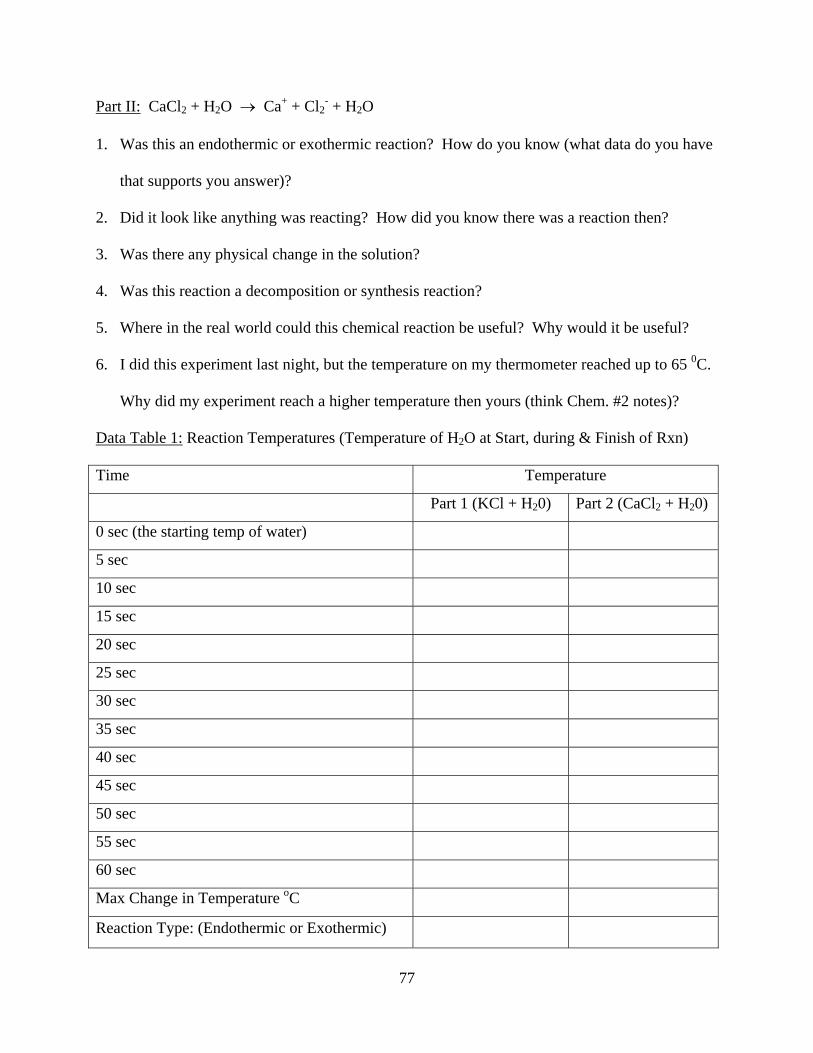
77
Part II: CaCl2 + H2O → Ca+ + Cl2- + H2O
1. Was this an endothermic or exothermic reaction? How do you know (what data do you have
that supports you answer)?
2. Did it look like anything was reacting? How did you know there was a reaction then?
3. Was there any physical change in the solution?
4. Was this reaction a decomposition or synthesis reaction?
5. Where in the real world could this chemical reaction be useful? Why would it be useful?
6. I did this experiment last night, but the temperature on my thermometer reached up to 65 0C.
Why did my experiment reach a higher temperature then yours (think Chem. #2 notes)?
Data Table 1: Reaction Temperatures (Temperature of H2O at Start, during & Finish of Rxn)
Time Temperature
Part 1 (KCl + H20) Part 2 (CaCl2 + H20)
0 sec (the starting temp of water)
5 sec
10 sec
15 sec
20 sec
25 sec
30 sec
35 sec
40 sec
45 sec
50 sec
55 sec
60 sec
Max Change in Temperature oC
Reaction Type: (Endothermic or Exothermic)
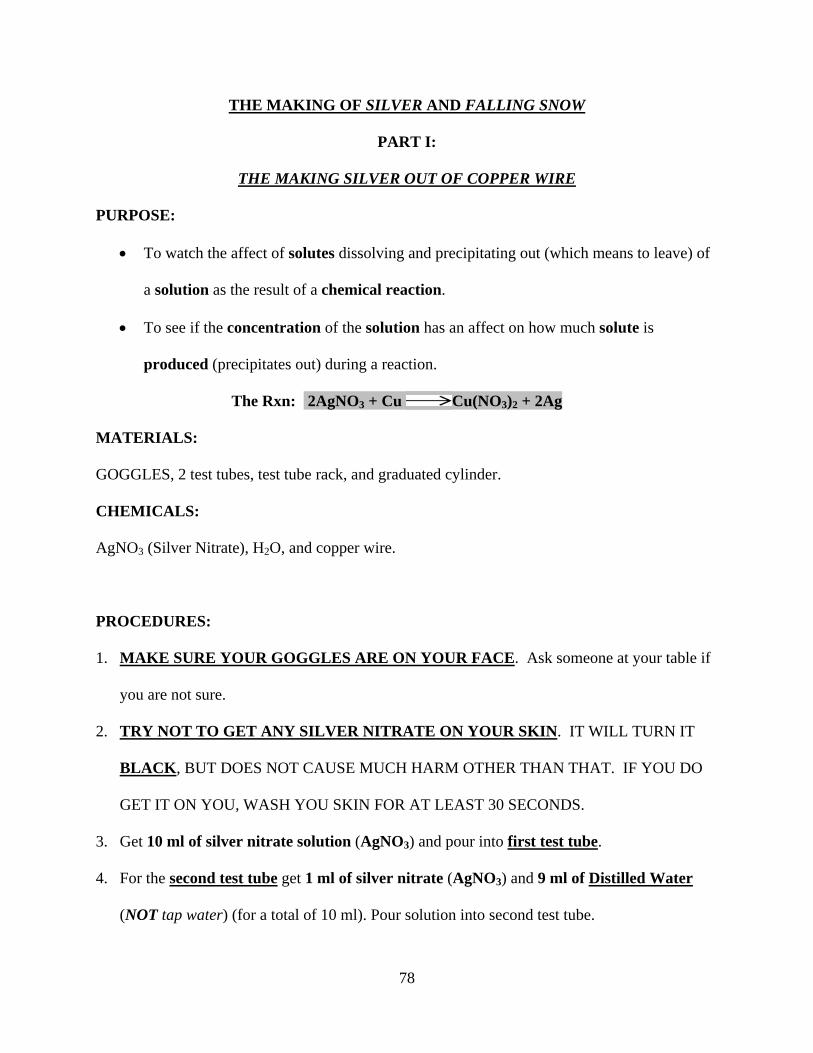
78
THE MAKING OF SILVER AND FALLING SNOW
PART I:
THE MAKING SILVER OUT OF COPPER WIRE
PURPOSE:
• To watch the affect of solutes dissolving and precipitating out (which means to leave) of
a solution as the result of a chemical reaction.
• To see if the concentration of the solution has an affect on how much solute is
produced (precipitates out) during a reaction.
The Rxn: 2AgNO3 + Cu Cu(NO3)2 + 2Ag
MATERIALS:
GOGGLES, 2 test tubes, test tube rack, and graduated cylinder.
CHEMICALS:
AgNO3 (Silver Nitrate), H2O, and copper wire.
PROCEDURES:
1. MAKE SURE YOUR GOGGLES ARE ON YOUR FACE. Ask someone at your table if
you are not sure.
2. TRY NOT TO GET ANY SILVER NITRATE ON YOUR SKIN. IT WILL TURN IT
BLACK, BUT DOES NOT CAUSE MUCH HARM OTHER THAN THAT. IF YOU DO
GET IT ON YOU, WASH YOU SKIN FOR AT LEAST 30 SECONDS.
3. Get 10 ml of silver nitrate solution (AgNO3) and pour into first test tube.
4. For the second test tube get 1 ml of silver nitrate (AgNO3) and 9 ml of Distilled Water
(NOT tap water) (for a total of 10 ml). Pour solution into second test tube.
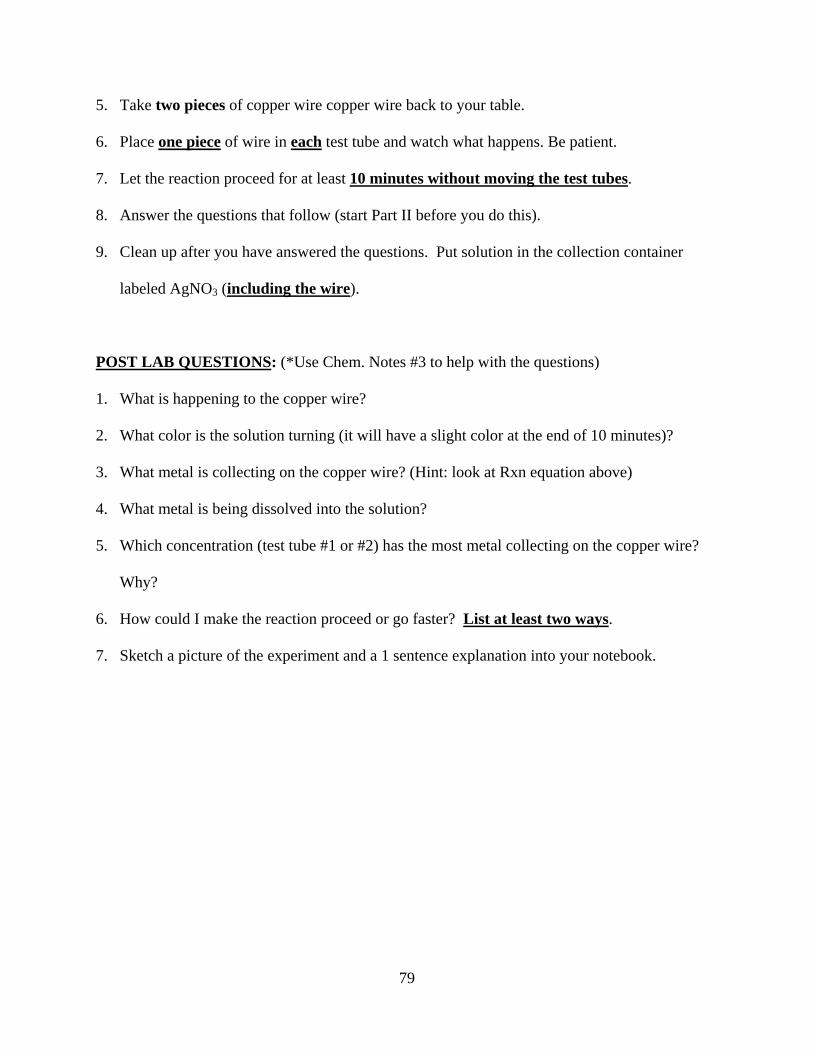
79
5. Take two pieces of copper wire copper wire back to your table.
6. Place one piece of wire in each test tube and watch what happens. Be patient.
7. Let the reaction proceed for at least 10 minutes without moving the test tubes.
8. Answer the questions that follow (start Part II before you do this).
9. Clean up after you have answered the questions. Put solution in the collection container
labeled AgNO3 (including the wire).
POST LAB QUESTIONS: (*Use Chem. Notes #3 to help with the questions)
1. What is happening to the copper wire?
2. What color is the solution turning (it will have a slight color at the end of 10 minutes)?
3. What metal is collecting on the copper wire? (Hint: look at Rxn equation above)
4. What metal is being dissolved into the solution?
5. Which concentration (test tube #1 or #2) has the most metal collecting on the copper wire?
Why?
6. How could I make the reaction proceed or go faster? List at least two ways.
7. Sketch a picture of the experiment and a 1 sentence explanation into your notebook.
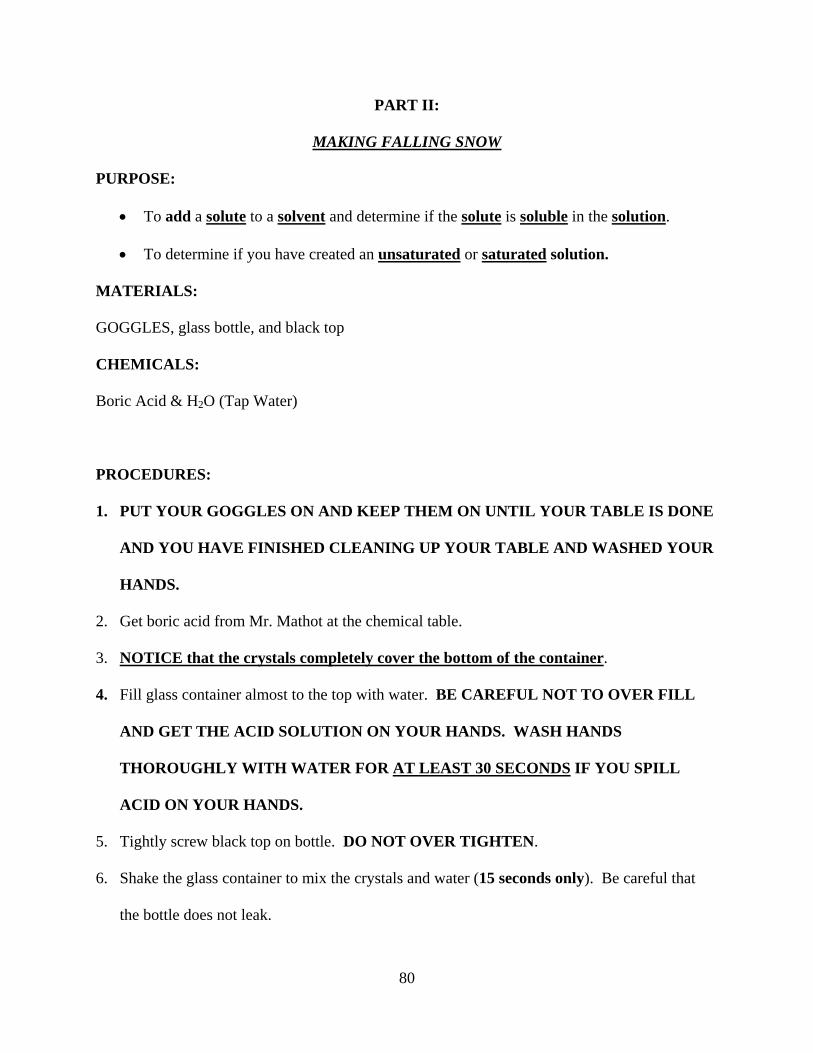
80
PART II:
MAKING FALLING SNOW
PURPOSE:
• To add a solute to a solvent and determine if the solute is soluble in the solution.
• To determine if you have created an unsaturated or saturated solution.
MATERIALS:
GOGGLES, glass bottle, and black top
CHEMICALS:
Boric Acid & H2O (Tap Water)
PROCEDURES:
1. PUT YOUR GOGGLES ON AND KEEP THEM ON UNTIL YOUR TABLE IS DONE
AND YOU HAVE FINISHED CLEANING UP YOUR TABLE AND WASHED YOUR
HANDS.
2. Get boric acid from Mr. Mathot at the chemical table.
3. NOTICE that the crystals completely cover the bottom of the container.
4. Fill glass container almost to the top with water. BE CAREFUL NOT TO OVER FILL
AND GET THE ACID SOLUTION ON YOUR HANDS. WASH HANDS
THOROUGHLY WITH WATER FOR AT LEAST 30 SECONDS IF YOU SPILL
ACID ON YOUR HANDS.
5. Tightly screw black top on bottle. DO NOT OVER TIGHTEN.
6. Shake the glass container to mix the crystals and water (15 seconds only). Be careful that
the bottle does not leak.
81
7. Allow jar to stand still for one minute, and then observe solution while turning it upside
down and right side up.
8. Answer the questions that follow.
* Note – No chemical reaction occurred in the mixing of boric acid with water.
9. Cleanup after you answer the questions. Pour boric acid solution into labeled collection
container, NOT down the sink. DO NOT DRINK (especially male students).
POST LAB QUESTIONS: (*Use Chem. Notes # 3 & Vocab. to help with the questions)
1. What was the solvent? What was the solute?
2. Did the boric acid mix with the water? Explain.
3. If you added more boric acid, what would you see happen? Why?
4. Turn the bottle upside down. What does it remind you of?
5. What could you have done to make the boric acid dissolve better (list at least 2 ways)?
6. Since not all the boric acid was able to dissolve, we would say the solution is
_____________ and that is why some solute was left on the bottom.
7. How would you make this solution unsaturated (list at least 2 ways)?
8. Sketch a picture of the experiment and a 1 sentence explanation into your notebook.
82
I HOPE IT FLOATS LAB
A Real World Application of the Scientific Method
You have been selected to design and build a metal boat that will float. The boat will be used
as a trash barge that will take the trash in your area (where there is no more room to bury it) to
another part of the United State so it can be disposed of properly. If you can create a boat that
will take away all the trash your city creates (200 grams), all will be well. If your barge design
cannot handle the trash you create each day, your city will be buried in a pile of trash and the
people of your city will cease to exist (not good). Please use the outline for the SCIENTIFIC
METHOD below to build a trash barge that will save your city. NOTE: You must complete up
to step 6 before you can get foil and start making your boats. Please read everything on this
page before starting. Remember, this lab has to do with buoyancy, density, mass, volume and
surface area. Thank you.
1. PURPOSE (why are you designing and building this trash barge?):
2. INTRODUCTION (Draw/discuss a few possible designs AND define the following):
a. Density:(include formula)
b. Mass:(include units)
c. Volume:(include units)
d. Surface area:
e. Buoyancy:
3. HYPOTHESIS (design you think will work best. (flat, deep hull, narrow, round, etc)):
4. MATERIALS (aluminum foil 10 X 14 inches (5g), metal weights, ruler, & water tank,):
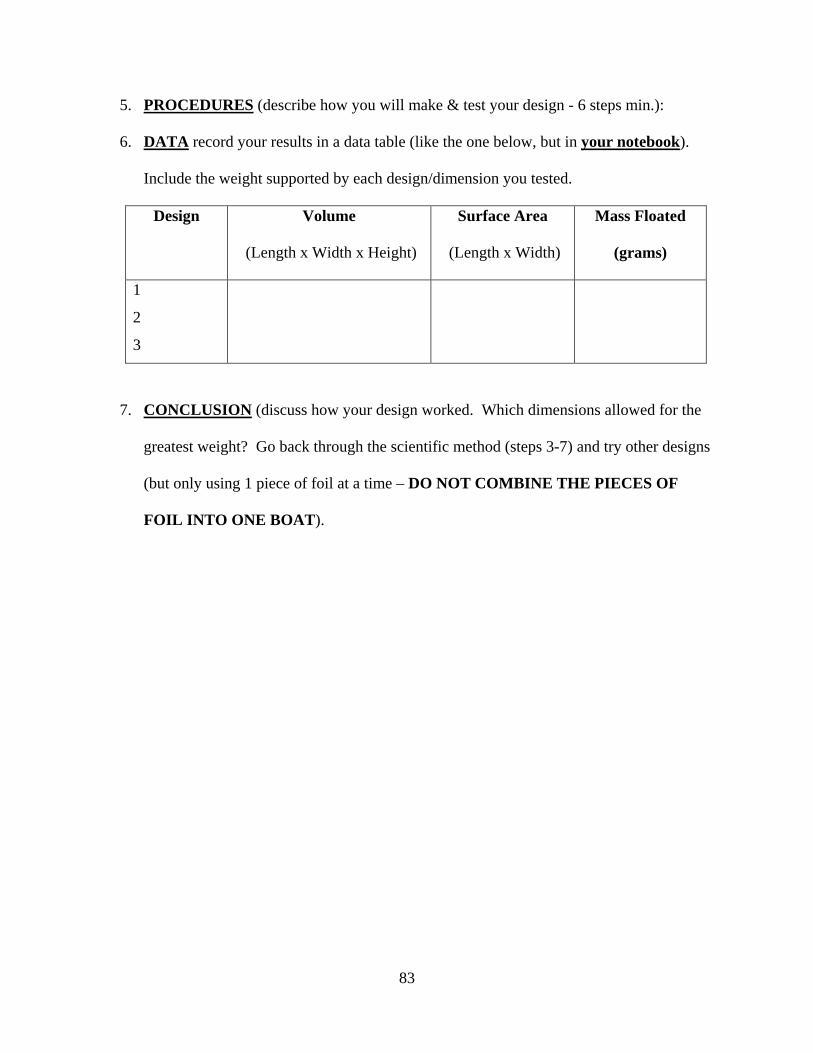
83
5. PROCEDURES (describe how you will make & test your design - 6 steps min.):
6. DATA record your results in a data table (like the one below, but in your notebook).
Include the weight supported by each design/dimension you tested.
Design Volume
(Length x Width x Height)
Surface Area
(Length x Width)
Mass Floated
(grams)
1
2
3
7. CONCLUSION (discuss how your design worked. Which dimensions allowed for the
greatest weight? Go back through the scientific method (steps 3-7) and try other designs
(but only using 1 piece of foil at a time – DO NOT COMBINE THE PIECES OF
FOIL INTO ONE BOAT).
84
APPENDIX H
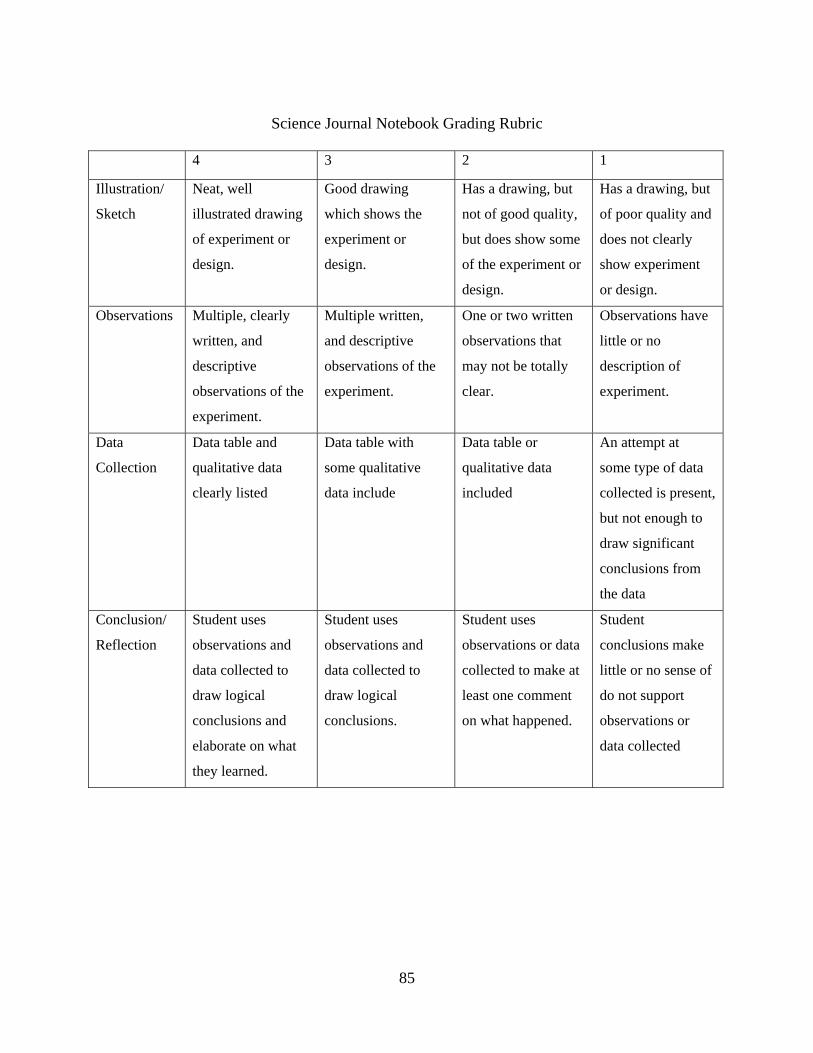
85
Science Journal Notebook Grading Rubric
4 3 2 1
Illustration/
Sketch
Neat, well
illustrated drawing
of experiment or
design.
Good drawing
which shows the
experiment or
design.
Has a drawing, but
not of good quality,
but does show some
of the experiment or
design.
Has a drawing, but
of poor quality and
does not clearly
show experiment
or design.
Observations Multiple, clearly
written, and
descriptive
observations of the
experiment.
Multiple written,
and descriptive
observations of the
experiment.
One or two written
observations that
may not be totally
clear.
Observations have
little or no
description of
experiment.
Data
Collection
Data table and
qualitative data
clearly listed
Data table with
some qualitative
data include
Data table or
qualitative data
included
An attempt at
some type of data
collected is present,
but not enough to
draw significant
conclusions from
the data
Conclusion/
Reflection
Student uses
observations and
data collected to
draw logical
conclusions and
elaborate on what
they learned.
Student uses
observations and
data collected to
draw logical
conclusions.
Student uses
observations or data
collected to make at
least one comment
on what happened.
Student
conclusions make
little or no sense of
do not support
observations or
data collected

86
APPENDIX I
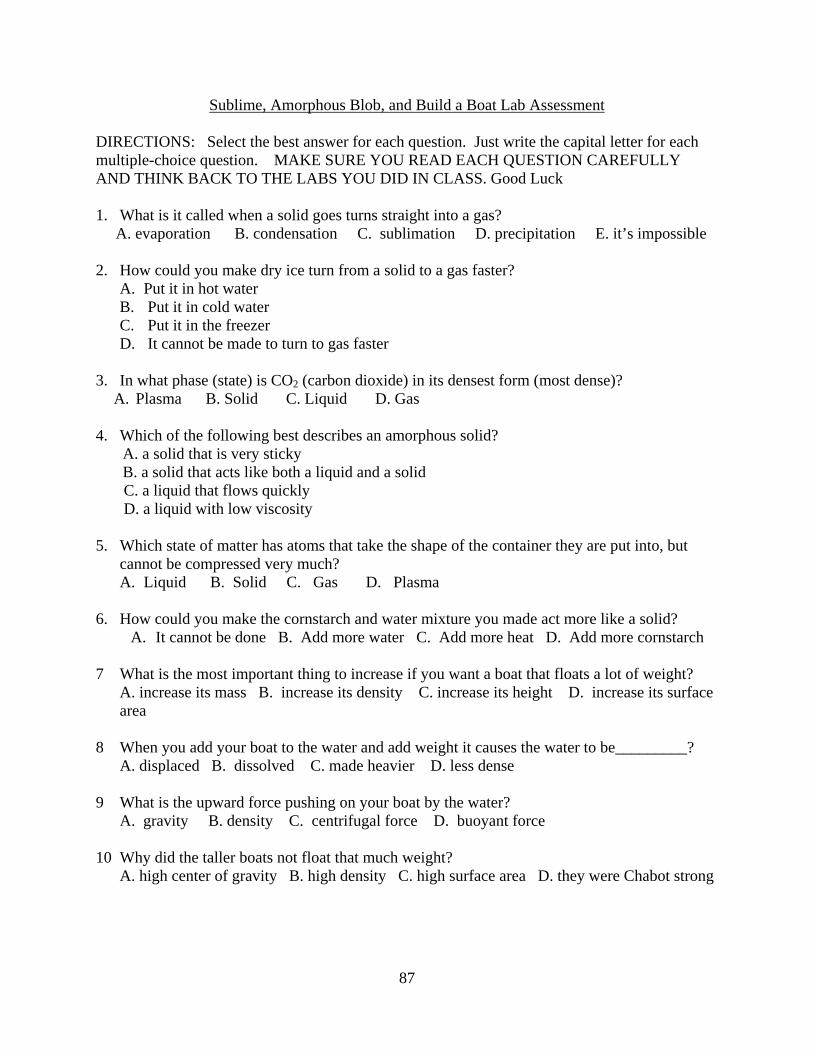
87
Sublime, Amorphous Blob, and Build a Boat Lab Assessment
DIRECTIONS: Select the best answer for each question. Just write the capital letter for each multiple-choice question. MAKE SURE YOU READ EACH QUESTION CAREFULLY AND THINK BACK TO THE LABS YOU DID IN CLASS. Good Luck 1. What is it called when a solid goes turns straight into a gas? A. evaporation B. condensation C. sublimation D. precipitation E. it’s impossible 2. How could you make dry ice turn from a solid to a gas faster?
A. Put it in hot water B. Put it in cold water C. Put it in the freezer D. It cannot be made to turn to gas faster
3. In what phase (state) is CO2 (carbon dioxide) in its densest form (most dense)?
A. Plasma B. Solid C. Liquid D. Gas 4. Which of the following best describes an amorphous solid?
A. a solid that is very sticky B. a solid that acts like both a liquid and a solid
C. a liquid that flows quickly D. a liquid with low viscosity 5. Which state of matter has atoms that take the shape of the container they are put into, but
cannot be compressed very much? A. Liquid B. Solid C. Gas D. Plasma
6. How could you make the cornstarch and water mixture you made act more like a solid?
A. It cannot be done B. Add more water C. Add more heat D. Add more cornstarch 7 What is the most important thing to increase if you want a boat that floats a lot of weight?
A. increase its mass B. increase its density C. increase its height D. increase its surface area
8 When you add your boat to the water and add weight it causes the water to be_________? A. displaced B. dissolved C. made heavier D. less dense
9 What is the upward force pushing on your boat by the water? A. gravity B. density C. centrifugal force D. buoyant force
10 Why did the taller boats not float that much weight? A. high center of gravity B. high density C. high surface area D. they were Chabot strong
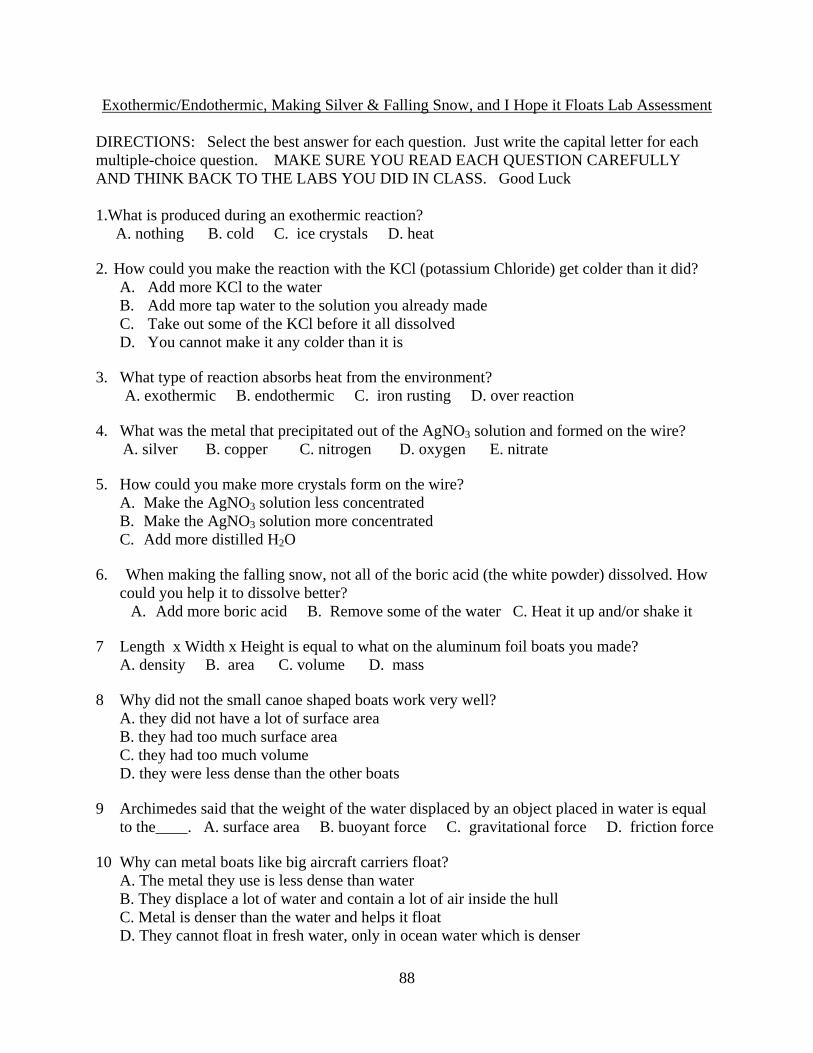
88
Exothermic/Endothermic, Making Silver & Falling Snow, and I Hope it Floats Lab Assessment
DIRECTIONS: Select the best answer for each question. Just write the capital letter for each multiple-choice question. MAKE SURE YOU READ EACH QUESTION CAREFULLY AND THINK BACK TO THE LABS YOU DID IN CLASS. Good Luck 1.What is produced during an exothermic reaction? A. nothing B. cold C. ice crystals D. heat 2. How could you make the reaction with the KCl (potassium Chloride) get colder than it did?
A. Add more KCl to the water B. Add more tap water to the solution you already made C. Take out some of the KCl before it all dissolved D. You cannot make it any colder than it is
3. What type of reaction absorbs heat from the environment?
A. exothermic B. endothermic C. iron rusting D. over reaction 4. What was the metal that precipitated out of the AgNO3 solution and formed on the wire?
A. silver B. copper C. nitrogen D. oxygen E. nitrate 5. How could you make more crystals form on the wire?
A. Make the AgNO3 solution less concentrated B. Make the AgNO3 solution more concentrated C. Add more distilled H2O
6. When making the falling snow, not all of the boric acid (the white powder) dissolved. How
could you help it to dissolve better? A. Add more boric acid B. Remove some of the water C. Heat it up and/or shake it
7 Length x Width x Height is equal to what on the aluminum foil boats you made?
A. density B. area C. volume D. mass
8 Why did not the small canoe shaped boats work very well? A. they did not have a lot of surface area B. they had too much surface area C. they had too much volume D. they were less dense than the other boats
9 Archimedes said that the weight of the water displaced by an object placed in water is equal to the____. A. surface area B. buoyant force C. gravitational force D. friction force
10 Why can metal boats like big aircraft carriers float? A. The metal they use is less dense than water B. They displace a lot of water and contain a lot of air inside the hull C. Metal is denser than the water and helps it float D. They cannot float in fresh water, only in ocean water which is denser

89
APPENDIX J
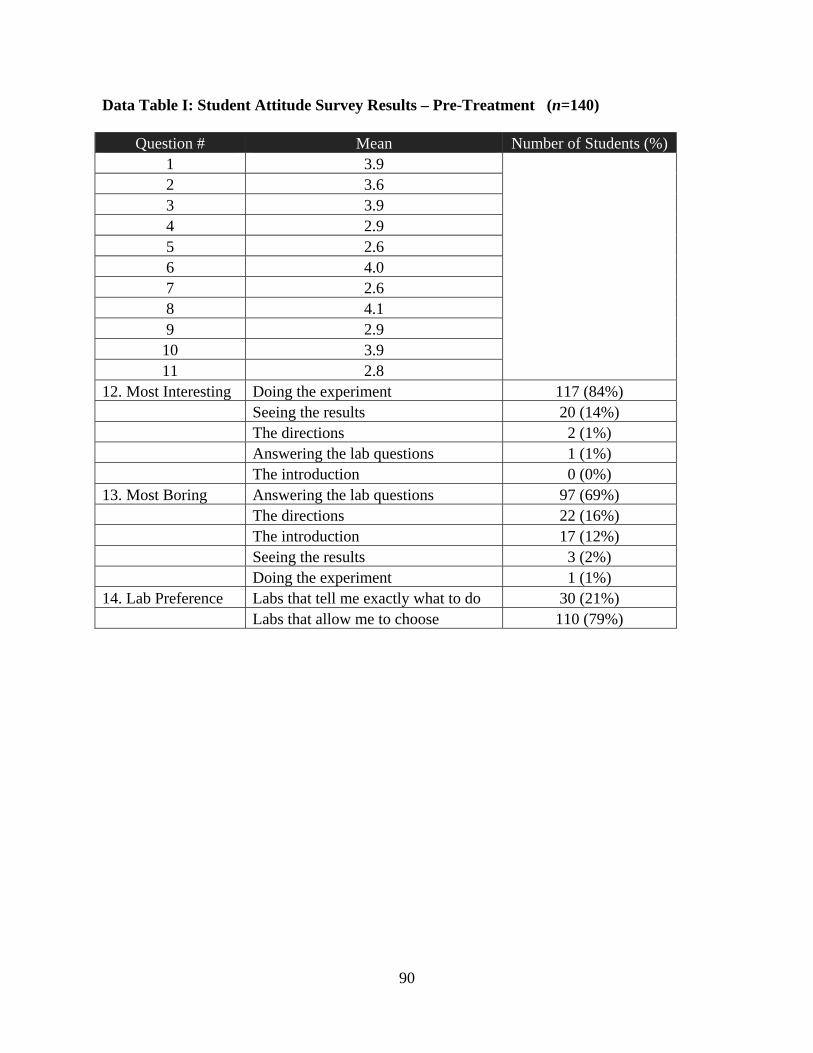
90
Data Table I: Student Attitude Survey Results – Pre-Treatment (n=140) (n=30)
Question # Mean Number of Students (%) 1 3.9
2 3.6 3 3.9 4 2.9 5 2.6 6 4.0 7 2.6 8 4.1 9 2.9 10 3.9 11 2.8
12. Most Interesting Doing the experiment 117 (84%) Seeing the results 20 (14%) The directions 2 (1%) Answering the lab questions 1 (1%) The introduction 0 (0%) 13. Most Boring Answering the lab questions 97 (69%)
The directions 22 (16%) The introduction 17 (12%) Seeing the results 3 (2%) Doing the experiment 1 (1%)
14. Lab Preference Labs that tell me exactly what to do 30 (21%) Labs that allow me to choose 110 (79%)
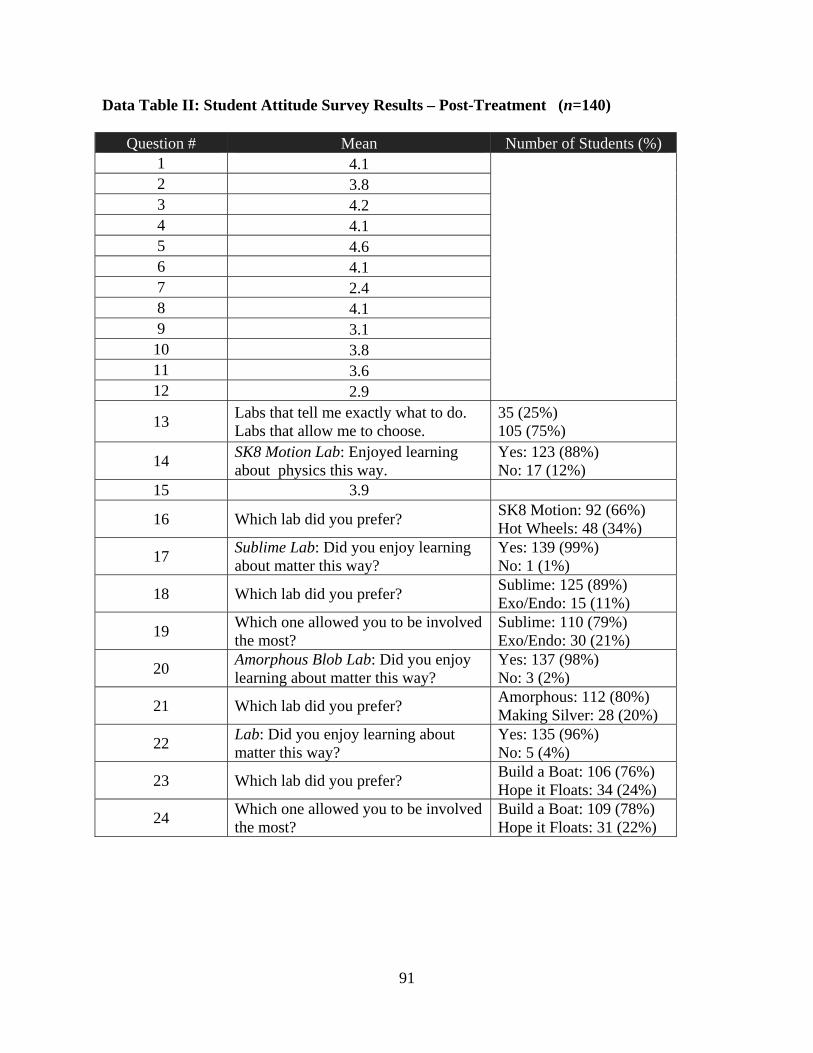
91
Data Table II: Student Attitude Survey Results – Post-Treatment (n=140) (n=30)
Question # Mean Number of Students (%) 1 4.1
2 3.8 3 4.2 4 4.1 5 4.6 6 4.1 7 2.4 8 4.1 9 3.1 10 3.8 11 3.6 12 2.9
13 Labs that tell me exactly what to do. Labs that allow me to choose.
35 (25%) 105 (75%)
14 SK8 Motion Lab: Enjoyed learning about physics this way.
Yes: 123 (88%) No: 17 (12%)
15 3.9
16 Which lab did you prefer? SK8 Motion: 92 (66%) Hot Wheels: 48 (34%)
17 Sublime Lab: Did you enjoy learning about matter this way?
Yes: 139 (99%) No: 1 (1%)
18 Which lab did you prefer? Sublime: 125 (89%) Exo/Endo: 15 (11%)
19 Which one allowed you to be involved the most?
Sublime: 110 (79%) Exo/Endo: 30 (21%)
20 Amorphous Blob Lab: Did you enjoy learning about matter this way?
Yes: 137 (98%) No: 3 (2%)
21 Which lab did you prefer? Amorphous: 112 (80%) Making Silver: 28 (20%)
22 Lab: Did you enjoy learning about matter this way?
Yes: 135 (96%) No: 5 (4%)
23 Which lab did you prefer? Build a Boat: 106 (76%) Hope it Floats: 34 (24%)
24 Which one allowed you to be involved the most?
Build a Boat: 109 (78%) Hope it Floats: 31 (22%)