Embed Size (px)
Citation preview

Using Information for Behavior Using Information for Behavior Support DecisionSupport Decision--MakingMaking
Taken from Rob Horner, Anne Todd, & Taken from Rob Horner, Anne Todd, & George George SugaiSugaiwww.swis.orgwww.swis.org

Big Messages about PBISBig Messages about PBIS
Traditional approaches to punishment and Traditional approaches to punishment and exclusion are ineffective when used alone.exclusion are ineffective when used alone.Behavior support needs to occur at the Behavior support needs to occur at the ““wholewhole--schoolschool”” levellevelTeaching is the most powerful behavior Teaching is the most powerful behavior support strategy availablesupport strategy availableOnOn--going use of information for decisiongoing use of information for decision--making is a key feature of successful schoolmaking is a key feature of successful school--wide discipline systemswide discipline systems..

Effective Behavior SupportEffective Behavior SupportEffective Behavior Support is a set of Effective Behavior Support is a set of strategies and systems to increase the capacity strategies and systems to increase the capacity of schools to (a) reduce school disruption, and of schools to (a) reduce school disruption, and (b) educate students with problem behaviors(b) educate students with problem behaviors
ResearchResearch--validated validated practicespracticesSupportive administrative Supportive administrative systemssystemsUse of Use of informationinformation for problem solvingfor problem solving

SYSTEMS
PRACTICES
INFORMATION
SupportingStaff Behavior
SupportingDecisionMaking
SupportingStudent Behavior
Effective Behavior Support

Why Collect Discipline Information?Why Collect Discipline Information?
Decision makingDecision makingProfessional AccountabilityProfessional AccountabilityDecisions made with data (information) are Decisions made with data (information) are more likely to be (a) implemented, and (b) more likely to be (a) implemented, and (b) effectiveeffective
Key features of data systems that Key features of data systems that work.work.
The data are accurateThe data are accurateThe data are very easy to collect (1% of staff The data are very easy to collect (1% of staff time)time)Data are used for decisionData are used for decision--makingmaking
The data must be available when decisions need to The data must be available when decisions need to be made (weekly?)be made (weekly?)Difference between data needs at a school building Difference between data needs at a school building versus data needs for a districtversus data needs for a districtThe people who collect the data must see the The people who collect the data must see the information used for decisioninformation used for decision--making.making.

What data to collect for decisionWhat data to collect for decision--making? making?
USE WHAT YOU HAVEUSE WHAT YOU HAVEOffice Discipline Referrals/DetentionsOffice Discipline Referrals/Detentions
Measure of overall environment. Referrals are affected Measure of overall environment. Referrals are affected by (a) student behavior, (b) staff behavior, (c) by (a) student behavior, (b) staff behavior, (c) administrative contextadministrative contextAn underAn under--estimate of what is really happeningestimate of what is really happeningOffice Referrals per Day per MonthOffice Referrals per Day per Month
AttendanceAttendanceSuspensions/ExpulsionsSuspensions/ExpulsionsVandalismVandalism

Office Discipline Referral Office Discipline Referral Processes/FormProcesses/Form
Coherent system in place to collect office Coherent system in place to collect office discipline referral datadiscipline referral data
Faculty and staff agree on categoriesFaculty and staff agree on categoriesFaculty and staff agree on processFaculty and staff agree on processOffice Discipline Referral Form includes needed Office Discipline Referral Form includes needed informationinformation
Name, date, timeName, date, timeStaffStaffProblem Behavior, maintaining functionProblem Behavior, maintaining functionLocationLocation

When Should Data be Collected?When Should Data be Collected?
ContinuouslyContinuouslyData collection should be an Data collection should be an embedded partembedded part of of the school cycle not something the school cycle not something ““extraextra””Data should be summarized prior to meetings Data should be summarized prior to meetings of decisionof decision--makers (e.g. makers (e.g. weeklyweekly))Data will be inaccurate and irrelevant unless Data will be inaccurate and irrelevant unless the people the people who collect and summarizewho collect and summarize it see it see the data used for decisionthe data used for decision--making. making.

Organizing Data for Organizing Data for ““InformationInformation””
Counts are good, but not always usefulCounts are good, but not always usefulTo compare across months use To compare across months use ““average office average office discipline referrals per day per monthdiscipline referrals per day per month””

0
10
20
30
40
50
60
70
Ref
erra
ls
Aug Sept Oct Nov Dec Jan Feb Mar Apr May Jun
School Month
Total Ref versus Ref/Day/MoNV High School

0
1
2
3
4
5 M
ean
Ref
erra
ls p
er D
ay
Aug Sept Oct Nov Dec Jan Feb Mar Apr May Jun
School Month
Total Ref versus Ref/Day/Mo

Using Data for OnUsing Data for On--Going Problem Going Problem SolvingSolving
Start with the decisionsStart with the decisions not the datanot the dataUse data in Use data in ““decision layersdecision layers””
IsIs there a problem? (overall rate of ODR)there a problem? (overall rate of ODR)Localize Localize the problem the problem
(location, problem behavior, students, time of day) (location, problem behavior, students, time of day)
Get specificGet specific
DonDon’’t drownt drown in the datain the dataItIt’’s s ““OKOK”” to be to be doing welldoing wellBe Be efficientefficient

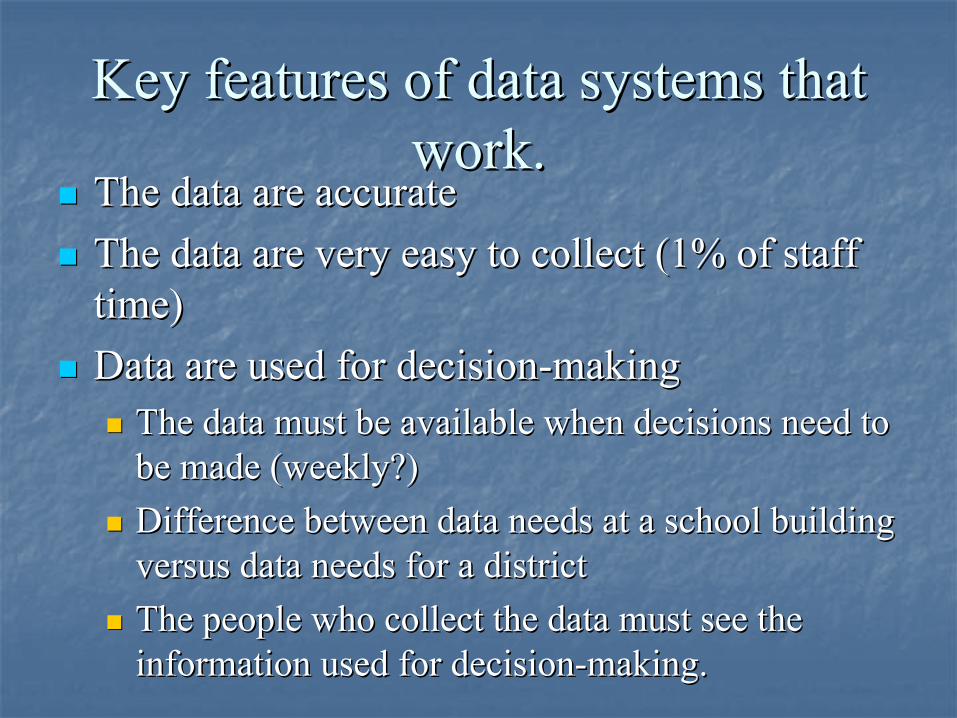
Is there a problem?Is there a problem?
Office Referrals per Day per MonthOffice Referrals per Day per MonthAttendanceAttendanceFaculty ReportsFaculty Reports

Interpreting Office Referral Data:Interpreting Office Referral Data:Is there a problem?Is there a problem?
Absolute Absolute levellevel (depending on size of school)(depending on size of school)Middle Schools (>5 per day)Middle Schools (>5 per day)Elementary Schools (>1.5Elementary Schools (>1.5--2 per day)2 per day)
TrendsTrendsPeaks before breaks?Peaks before breaks?Gradual increasing trend across year?Gradual increasing trend across year?
Compare levels to last yearCompare levels to last yearImprovement?Improvement?

0
0.5
1
1.5
2
Ave
Ref
erra
ls p
er D
ay
Sept Oct Nov Dec Jan Feb Mar Apr May Jun
School Months
Office Referrals per Day per MonthLast year

0
5
10
15
20
Ave
Ref
erra
ls p
er D
ay
Sept Oct Nov Dec Jan Feb Mar Apr May Jun
School Months
Office Referrals per Day per MonthLast year
0
5
10
15
20
Ave
Ref
erra
ls p
er D
ay
Sept Oct Nov Dec Jan Feb Mar Apr May Jun
School Months
Office Referrals per Day per MonthLast year

0
5
10
15
20
Ave
Ref
erra
ls p
er D
ay
Sept Oct Nov Dec Jan Feb Mar Apr May Jun
School Months
Office Referrals per Day per MonthThis Year

0
5
10
15
20
Ave
Ref
erra
ls p
er D
ay
Sept Oct Nov Dec Jan Feb Mar Apr May Jun
School Months
Office Referrals per Day per MonthLast Year and This Year

0
5
10
15
20
Ave
Ref
erra
ls p
er D
ay
Sept Oct Nov Dec Jan Feb Mar Apr May Jun
School Months
Office Referrals per Day per MonthLast Year and This Year

Is There a Problem? #1Is There a Problem? #1Maintain Maintain -- Modify Modify -- TerminateTerminate
0
5
10
15
20
Ave
Ref
erra
ls p
er D
ay
Sept Oct Nov Dec Jan Feb Mar Apr May
School Months
Office Referrals per Day per MonthThis Year

Is There a Problem? #2Is There a Problem? #2Maintain Maintain -- Modify Modify -- TerminateTerminate
0
5
10
15
20
Ave
Ref
erra
ls p
er D
ay
Sept Oct Nov Dec Jan Feb Mar Apr May Jun
School Months
Office Referrals per Day per MonthThis year (Middle)

Is There a Problem? #3Is There a Problem? #3Maintain Maintain -- Modify Modify -- TerminateTerminate
0
5
10
15
20
Ave
Ref
erra
ls p
er D
ay
Sept Oct Nov Dec Jan Feb Mar Apr May Jun
School Months
Office Referrals per Day per MonthLast Year and This Year

Is There a Problem? #4Is There a Problem? #4Maintain Maintain -- Modify Modify -- TerminateTerminate
0
5
10
15
20
Ave
Ref
erra
ls p
er D
ay
Sept Oct Nov Dec Jan Feb Mar Apr May Jun
School Months
Office Referrals per Day per MonthLast Year and This Year

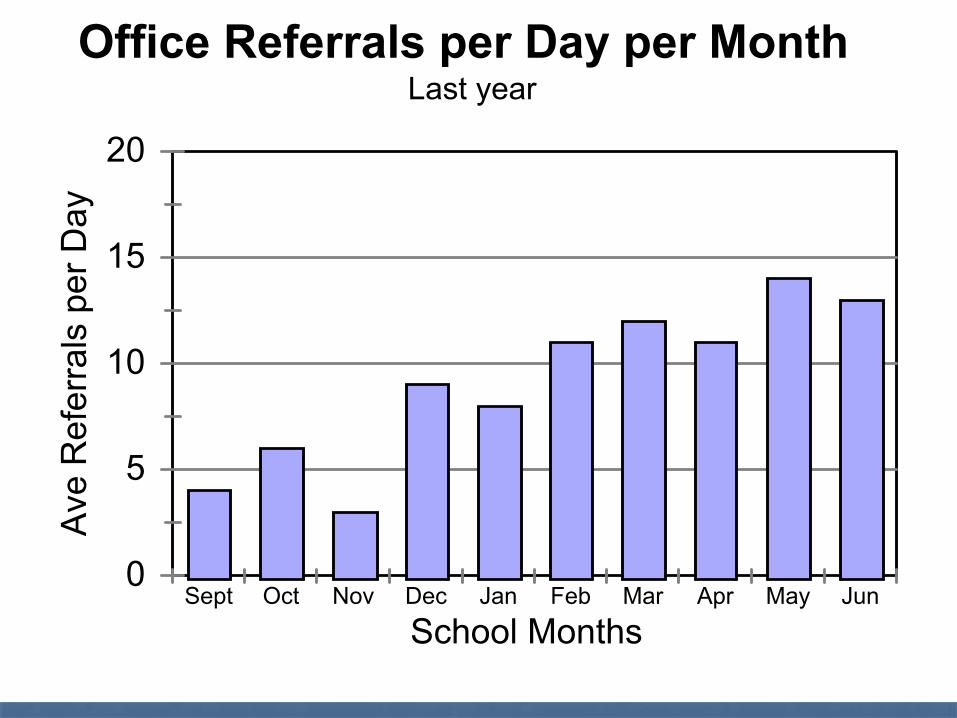
What systems are problematic?What systems are problematic?Referrals by Referrals by problem behaviorproblem behavior??
What problem behaviors are most common?What problem behaviors are most common?
Referrals by Referrals by locationlocation??Are there specific problem locations?Are there specific problem locations?
Referrals by Referrals by studentstudent??Are there many students receiving referrals or only Are there many students receiving referrals or only a small number of students with many referrals?a small number of students with many referrals?
Referrals by Referrals by time of daytime of day??Are there specific times when problems occur?Are there specific times when problems occur?

Referrals by Problem BehaviorReferrals by Problem Behavior
0
10
20
30
40
50
Num
ber o
f Ref
erra
ls
Lang Achol Arson Bomb Combs Defian Disrupt Dress Agg/fgt Theft Harass Prop D Skip Tardy Tobac Vand Weap
Types of Problem Behavior
Referrals per Prob Behavior

Referrals by Problem BehaviorReferrals by Problem Behavior
0
10
20
30
40
50
Num
ber o
f Ref
erra
ls
Lang Achol Arson Bomb Combs Defian Disrupt Dress Agg/fgt Theft Harass Prop D Skip Tardy Tobac Vand Weap
Types of Problem Behavior
Referrals per Prob Behavior

Referrals by Problem BehaviorReferrals by Problem Behavior
0
5
10
15
Num
ber o
f Ref
erra
ls
Lang Achol Arson Bomb Combs Defian Disrupt Dress Agg/fgt Theft Harass Prop D Skip Tardy Tobac Vand Weap
Types of Problem Behavior
Referrals per Prob Behavior

Referrals per LocationReferrals per Location
0
10
20
30
40
50
Num
ber o
f Offi
ce R
efer
rals
Bath R Bus A Bus Caf Class Comm Gym Hall Libr Play G Spec Other
School Locations
Referrals by Location

0
10
20
30
40
50
Num
ber o
f Offi
ce R
efer
rals
Bath R Bus A Bus Caf Class Comm Gym Hall Libr Play G Spec Other
School Locations
Referrals by Location

Referrals per StudentReferrals per Student
0
10
20
Num
ber o
f Ref
erra
ls p
er S
tude
nt
Students

Referrals per StudentReferrals per Student
0
10
20
Num
ber o
f Ref
erra
ls p
er S
tude
nt
Students
Students per Number of Referrals

Referrals by Time of DayReferrals by Time of Day
0
5
10
15
20
25
30
Num
ber o
f Ref
erra
ls
7:00 7:30 8:00 8:30 9:00 9:30 10:00 10:30 11:00 11:30 12:00 12:30 1:00 1:30 2:00 2:30 3:00 3:30
Time of Day
Referrals by Time of Day

Referrals by Time of DayReferrals by Time of Day
0
5
10
15
20
25
30
Num
ber o
f Ref
erra
ls
7:00 7:30 8:00 8:30 9:00 9:30 10:00 10:30 11:00 11:30 12:00 12:30 1:00 1:30 2:00 2:30 3:00 3:30
Time of Day
Referrals by Time of Day

Decision-making
• Is there a problem?• What areas/systems are involved?• Are there many students or a few involved?• What kinds of problem behaviors are
occurring?• When are these behaviors most likely?• What is the most effective use of our
resources to address this problem?

Designing SolutionsDesigning SolutionsIf If manymany students are making the same mistake students are making the same mistake it typically is the it typically is the systemsystem that needs to change that needs to change not the students.not the students.Teach, monitor and reward before relying on Teach, monitor and reward before relying on punishment.punishment.

Choices in Choices in ““other reportsother reports””1. 1. Custom ReportCustom Report
2. 2. Custom GraphCustom Graph
3. 3. Referrals by StaffReferrals by Staff
4. 4. Suspension/Expulsion ReportSuspension/Expulsion Report
5. 5. Ethnicity ReportsEthnicity Reports(we are going to explain in d(we are going to explain in depth) epth)
5.1 5.1 School Ethnicity ReportSchool Ethnicity Report
6. 6. Individual Student ReportIndividual Student Report
7. 7. Year End ReportYear End Report
8. 8. Student & Staff ListsStudent & Staff Lists

The first documents the proportion of students in The first documents the proportion of students in the school by ethnicity,the school by ethnicity,
The second breaks out % of referrals from The second breaks out % of referrals from different ethnic groups, different ethnic groups,
The third breaks out the % of students in an ethnic The third breaks out the % of students in an ethnic group who received a referral, group who received a referral,
The last is the % of all students who received The last is the % of all students who received referrals by ethnic group.referrals by ethnic group.
So... the reports document referrals and students. So... the reports document referrals and students.
The 4 Ethnicity reportsThe 4 Ethnicity reports

The first documents the proportion of The first documents the proportion of students in the school by ethnicity,students in the school by ethnicity,

The second breaks out % of The second breaks out % of all all referralsreferrals from different ethnic groupsfrom different ethnic groups

The third breaks out the % of The third breaks out the % of studentsstudents in in an ethnic group who received a referralan ethnic group who received a referral

The 4th is the % of all students who The 4th is the % of all students who received referrals by ethnic group.received referrals by ethnic group.

The key message is:The key message is:
It takes more than one report to It takes more than one report to determine overdetermine over--representationrepresentation
That is why all four are presented.That is why all four are presented.