Embed Size (px)
Citation preview

Using heavy atom rare gas matrix to control the reactivity of 4-methoxybenzaldehyde: A comparison with benzaldehydeNihal Kuş, Archna Sharma, Igor Reva, Leszek Lapinski, and Rui Fausto Citation: J. Chem. Phys. 136, 144509 (2012); doi: 10.1063/1.3701734 View online: http://dx.doi.org/10.1063/1.3701734 View Table of Contents: http://jcp.aip.org/resource/1/JCPSA6/v136/i14 Published by the American Institute of Physics. Additional information on J. Chem. Phys.Journal Homepage: http://jcp.aip.org/ Journal Information: http://jcp.aip.org/about/about_the_journal Top downloads: http://jcp.aip.org/features/most_downloaded Information for Authors: http://jcp.aip.org/authors

THE JOURNAL OF CHEMICAL PHYSICS 136, 144509 (2012)
Using heavy atom rare gas matrix to control the reactivityof 4-methoxybenzaldehyde: A comparison with benzaldehyde
Nihal Kus,1,2 Archna Sharma,1 Igor Reva,1 Leszek Lapinski,3 and Rui Fausto1,a)
1Department of Chemistry, University of Coimbra, 3004-535 Coimbra, Portugal2Department of Physics, Anadolu University, 26470 Eskisehir, Turkey3Institute of Physics, Polish Academy of Sciences, Warsaw, Poland
(Received 8 February 2012; accepted 22 March 2012; published online 13 April 2012)
Different patterns of photochemical behavior were observed for 4-methoxybenzaldehyde(p-anisaldehyde) isolated in xenon and in argon matrices. Monomers of the compound isolated insolid Xe decarbonylate upon middle ultraviolet irradiation, yielding methoxybenzene (anisole), andCO. On the other hand, p-anisaldehyde isolated in an Ar matrix and subjected to identical irradia-tion, predominantly isomerizes to the closed-ring isomeric ketene (4-methoxycyclohexa-2,4-dien-1-ylidene) methanone. Experimental detection of a closed-ring ketene photoproduct, generated from anaromatic aldehyde, constitutes a rare observation. The difference between the patterns of photochem-ical transformations of p-anisaldehyde isolated in argon and xenon environments can be attributedto the external heavy-atom effect, where xenon enhances the rate of intersystem crossing from thesinglet to the triplet manifold in which decarbonylation (via p-methoxybenzoyl radical) takes place.The parent compound, benzaldehyde, decarbonylates (to benzene + CO) when subjected to middleultraviolet irradiation in both argon and xenon matrices. This demonstrates the role of the methoxyp-anisaldehyde substituent in activation of the reaction channel leading to the formation of the ketenephotoproduct. © 2012 American Institute of Physics. [http://dx.doi.org/10.1063/1.3701734]
I. INTRODUCTION
Several observations have been reported where thechemical behavior of a compound isolated in a noble gascryogenic solid matrix varies substantially with the matrixgas. A relatively common situation is the alteration of therelative populations of the possible conformers of a givenmolecule due to stabilization of the more polar forms in morepolarizable matrices.1–8 Matrix-solute interactions may alsochange the relative heights of the barriers for conformationalinterconversions, hence modifying the ways of conforma-tional isomerization of an isolated species.5, 9 Interactionswith the matrix media have also been found to lead, forexample, to different tunneling decay rates of higher energyconformers into more stable forms in different matrices.10–15
The higher energy conformers could be successfully pro-duced by selective infrared excitation of the initially trappedlower energy forms existing in the gas phase.16–18 Aggre-gation may be influenced by the matrix media as well.19–22
Furthermore, the kinetics and efficiency of photochemicalprocesses involving matrix-isolated species have been foundto depend, in several cases, on the host matrix gas.23, 24
However, there are only few reported cases25–27 wherethe same molecule gives rise to different photoproducts,depending on the noble gas (Ar, Kr, or Xe) used as the matrixmedium. Of course, photogeneration of molecules involvingnoble gas atoms28, 29 constitutes a separate class of processes,significantly different from those considered in the presentwork. Laursen and Pimentel25, 26 have observed different pat-terns of fragmentation of both 1,1- and 1,2-dichloroethenes
a)Author to whom correspondence should be addressed. Electronic mail:[email protected].
in krypton and xenon matrices: in xenon, photolysis of1,1-dichloroethene (λ = 237 nm) and 1,2-dichloroethenes(λ = 239 nm) has been found to result in elimination of bothCl2 and HCl as well as isomerization, whereas only HClelimination and isomerization were observed in krypton. Ina more recent study,27 formamide (HCONH2) was found tobe transformed mainly into NH3 + CO in an argon matrixand predominantly into HNCO + H2 in a xenon matrix uponirradiation at λ = 193 nm. For both the dichloroethenes andformamide, the observed different photochemical behaviorin the different matrices was attributed to the prevalence of atriplet-surface chemistry in the xenon matrix, brought aboutby heavy-atom enhancement of intersystem crossing fromthe directly excited singlet state to a triplet surface.25–27
In the present article, another rare observation of dif-ferent photochemical behavior of a species isolated in ar-gon and xenon matrices is described. As it will be shownbelow, 4-methoxybenzaldehyde (p-anisaldehyde) isolated ina low-temperature xenon matrix decarbonylates upon mid-dle ultraviolet irradiation, yielding methoxybenzene (anisole)and CO, in a similar way to what is observed for its parentcompound, benzaldehyde, isolated in both argon and xenonmatrices (with production of benzene + CO). When iso-lated in solid argon and subjected to identical irradiationconditions, p-anisaldehyde predominantly isomerizes to itsclosed-ring isomeric ketene, (4-methoxycyclohexa-2,4-dien-1-ylidene) methanone.
II. EXPERIMENTAL AND COMPUTATIONAL METHODS
p-Anisaldehyde was purchased from Aldrich (99.5%).Benzaldehyde, anisole, and benzene were obtained from
0021-9606/2012/136(14)/144509/11/$30.00 © 2012 American Institute of Physics136, 144509-1

144509-2 Kus et al. J. Chem. Phys. 136, 144509 (2012)
Merck-Schuchardt (98%, >99%, and >99.5% purity, respec-tively). Before usage, the compounds were further purifiedby freeze-pump-thaw cycles, in order to remove any volatileimpurities. In the case of p-anisaldehyde, the cryogenic ma-trices were prepared by co-depositing the room-temperaturevapor of the compound coming out from a specially de-signed Knudsen cell30 together with a large excess of argon(N60, Air Liquide) or xenon (N48, Air Liquide) onto an op-tical CsI substrate, cooled to 15 K (Ar) or 30 K (Xe) by anAPD Cryogenics DE–202A closed-cycle refrigerator. Ben-zaldehyde, anisole, and benzene were pre-mixed separatelywith the matrix gas in a 3 L Pyrex reservoir (typical so-lute:solvent molar ratios ∼1:1000), and the room temperaturegaseous mixtures were deposited onto the cold substrate of thecryostat using the same cold substrate temperatures as for p-anisaldehyde. The infrared spectra of matrices were collectedwith 0.5 cm−1 resolution, using a Mattson (Infinity 60AR se-ries) FTIR or a Thermo Nicolet Nexus 6700 FTIR spectrom-eter, equipped with a DTGS detector and a KBr beam splitter.
Matrices were irradiated with UV light using either ahigh pressure Xe/Hg lamp fitted with long-pass cutoff filters(transmitting light with λ > 200, 234 nm) and an 8 cm wa-ter filter, or with the tunable frequency-doubled signal beamprovided by a Quanta-Ray MOPO-SL pulsed (10 ns) opticalparametric oscillator (FWHM ∼0.2 cm−1; repetition rate10 Hz, pulse energy ∼5 mJ) pumped with a Nd:YAG laser.The irradiation conditions (wavelengths and times of irradia-tion) were chosen for best observation of the photochemicalprocesses under investigation and as similar as possible in thevarious experiments.
Geometry optimizations and calculations of infraredspectra were carried out at the DFT(B3LYP)/6-311++G(d,p)level31–33 (with the unrestricted method for open shell sys-tems, e.g., the benzoyl and p-methoxybenzoyl radicals) us-ing the GAUSSIAN 03 program package.34 To correct forthe effects of basis set limitations, neglected part of electroncorrelation and anharmonicity effects, the DFT(B3LYP)/6-311++G(d,p) computed harmonic frequencies were scaleddown by the factor 0.978. Simulated infrared spectra wereproduced using Lorentzian functions centered at the cal-culated (scaled) wavenumbers having full widths at half-maximum equal to 2 cm−1 and integrated intensities underthe simulated bands equal to the calculated IR intensities. Ap-proximate descriptions of vibrational modes resulting fromcalculations were obtained using GAUSSVIEW (Version 5).35
III. RESULTS AND DISCUSSION
p-Anisaldehyde has two different conformers (O-transand O-cis; see Scheme 1), which are nearly equally popu-lated in the gas phase at room temperature, the O-trans con-former being only slightly more stable than the O-cis form(<1 kJ mol−1).36–38 In a recent investigation,38 we demon-strated that the population ratio of the O-trans and O-cisforms, trapped in either argon or xenon matrices, correspondsto the frozen gas-phase conformational equilibrium. We werealso able to modify the population ratio in the matrices byin situ UV irradiation. Upon irradiation, photostationary stateswere obtained, with the final ratio of conformers specific to
O H
OCH3
O H
OCH3
O-trans O-cis
O H
OCH3
O H
OCH3
O-trans O-cis
SCHEME 1. Conformers of p-anisaldehyde.
the wavelength of the applied UV light. The net directionof the observed O-trans → O-cis or O-cis → O-trans pho-toinduced population changes was found to be dependent onthe wavelength range of the applied UV radiation and on theinitial population ratio of the two conformers in the matrix.These observations were explained on the basis of the analysisof the potential energy profiles for conformational isomeriza-tion in the relevant electronic states of the molecule calculatedby the TD-DFT method.38
When irradiations with λ > 250 nm were performed,the sole process observed in matrix-isolated p-anisaldehydewas the conformational interconversion. However, upon ir-radiation at shorter wavelengths, phototransformation of thecompound into other species occurred concomitantly withthe conformational isomerization. UV-induced generation ofproducts, other than O-trans and O-cis conformers, was re-vealed by appearance of new bands in the spectra of the irra-diated matrices. The emerging infrared multiplet-like absorp-tion at ∼2140 cm−1 in these spectra was suggested38 to orig-inate from a ketene group (C=C=O) or carbon monoxide (orboth).39–41 Very interestingly, the attainment of the photosta-tionary states associated with the conformational isomeriza-tion was found to be very fast. The population ratio of theconformers was not changing during the UV-induced trans-formation of the compound into other species, though theabsolute amounts of both conformers were decreasing. Thisobservation opened the possibility of studying other photo-chemical processes without explicit consideration of the con-formational photoisomerization.
Figure 1(b) shows the difference spectrum obtained bysubtraction of the spectrum of p-anisaldehyde in a xenonmatrix (recorded before any irradiation, Figure 1(a)) fromthe spectrum recorded after UV irradiation (10 min withλ > 234 nm + 5 min with λ > 200 nm) of the matrix.
Identification of the photoproducts was straightforward:the spectrum emerging upon UV irradiation of p-anisaldehydein a xenon matrix matches that of a genuine sample of anisolein a xenon matrix (Figure 1(c); see also Table I). Togetherwith anisole, carbon monoxide is produced, giving rise to thestructured absorption in the 2145–2095 cm−1 region (see Fig-ure 1(b)). The multiplet structure of this band indicates thatphotogenerated CO molecules are interacting with the anisolemolecule formed in the same matrix cage. Due to this inter-action some anisole bands in the spectrum of the photolysedmatrix are also shifted by a few tenths of cm−1, in relation totheir positions in the spectrum of the isolated anisole.

144509-3 Kus et al. J. Chem. Phys. 136, 144509 (2012)
2000 1600 1200 800
0.0
0.2
0.4
2000 1600 1200 800
-0.1
0.0
2000 1600 1200 800
0.0
0.2
0.4
p-Anisaldehyde : Xe (c)
(b)
Abs
orba
nce
(a)A
bsor
banc
eAnisole : Xe
Wavenumber / cm −1
Abs
orba
nce
FIG. 1. (a) Spectrum of a genuine sample of anisole in a xenon matrix at30 K obtained in a separate experiment; (b) difference spectrum: the spec-trum recorded after UV irradiation (10 min with λ > 234 nm + 5 min withλ > 200 nm) of p-anisaldehyde in Xe matrix minus the spectrum of thesame sample recorded before any irradiation. Growing bands show upwards;(c) spectrum of p-anisaldehyde in a xenon matrix at 30 K (as deposited).
The observed decarbonylation of p-anisaldehyde in axenon matrix, leading to anisole + CO (see Scheme 2), couldindeed be expected to occur under the used experimental con-ditions, considering that photodecarbonylation is a commonprocess in aldehydes, both aliphatic and aromatic.23, 24, 42–50
In the spectrum of photolysed p-anisaldehyde isolatedin solid xenon, a few new low intensity bands not as-cribable to anisole were also observed. These appeared at1636, 1759/1756, 1578/1577, 1493/1491, 1448/1446, 1322,1139, 847, 840, 645, and 610 cm−1. We will discuss laterthe origin of the first band in this list. All the remainingbands can be ascribed to the p–methoxybenzoyl radical (seeTable S1, provided as supplementary material,51 andScheme 3), indicating that this species was also produced dur-ing the photolysis.
When subjected to identical experimental conditions,the p-anisaldehyde parent compound benzaldehyde wasalso found to decarbonylate, yielding benzene, and CO(Scheme 2). The difference spectrum obtained by subtract-ing the spectrum of benzaldehyde in a xenon matrix fromthe spectrum recorded after UV irradiation (180 min, λ
= 250 nm) is presented in Figure 2. This figure shows alsothe spectrum of the as-deposited Xe matrix of benzaldehyde(left panel, A), and the spectrum of a genuine sample ofbenzene isolated in xenon (left panel, C). The results un-equivocally demonstrate that benzene and CO are produced
HO
O-CH3 O-CH3
Xe
hν+ CO
HO
hνAr, Xe
+ CO
HO
O-CH3 O-CH3
O
HHhν
Ar
SCHEME 2. Main products of UV-induced transformations ofp-anisaldehyde and benzaldehyde isolated in Ar and Xe matrices.
upon UV irradiation of benzaldehyde in solid xenon (see alsoTable II).
Identical results were obtained for benzaldehyde isolatedin an argon matrix (see Figure 2, right panel, and Table II).This clearly shows that benzaldehyde photodecarbonylationoccurs also in solid argon environment.
Very interestingly, the vibrational signature of the ben-zoyl radical (Scheme 3) could also be observed in the spec-tra of the photolysed benzaldehyde matrices (e.g., bandsin the 1831–1810 cm−1 region and at 1137.6/1136.1 cm−1
in argon, and in the 1825–1805 cm−1 region and at1138.5/1133.4/1131.8 cm−1 in xenon; Figure S1 and TableS2 in the supplementary material). The IR bands due to ben-zoyl radical have been reliably identified by comparison withthe known spectrum of the species isolated in argon matrix.55
Comparison with the calculated spectrum of benzoyl radi-cal (see Table S3)51 leads to the same conclusion. Detec-tion of photogenerated benzoyl radical product is in line withthe observation of the p-methoxybenzoyl radical in the ex-periments with UV-irradiated p-anisaldehyde. The amount ofthe benzoyl radical photoproduced in the xenon matrix(Figure S1, bottom) was found to be significantly larger thanin the argon matrix (Figure S1, top). More effective genera-tion of benzoyl radical from benzaldehyde isolated in xenon
OH3C
OCH3
SCHEME 3. From left to right: benzvalene, fulvene, Dewar benzene, ben-zoyl radical, and O-cis and O-trans conformers of p-methoxybenzoyl radical.

144509-4 Kus et al. J. Chem. Phys. 136, 144509 (2012)
TABLE I. Observed IR spectra of anisole isolated in argon and xenon matrices and B3LYP/6-311++G(d,p) calculated wavenumbers (scaled by 0.978) andIR intensities.a
Observed b Calculated, B3LYP/6-311++G(d,p)
Argon matrix Xenon matrix Wavenumber IR intensity Approximate descriptionc
3115.1 3111.8 3134.2 5.6 νCHR
3103.8 3097.0 3124.5 8.6 νCHR
3082.6, 3076.8 3084.0 3117.2 20.6 νCHR
3044.5, 3041.3 3046.8, 3039.7 3101.5 11.5 νCHR
3032.0 3033.4, 3026.2 3094.0 1.5 νCHR
3017.6, 3016.2 3013.1, 3009.3 3063.6 21.9 νCH3 asym A′
2959.3, 2949.6 2948.5, 2940.9 2993.6 39.4 νCH3 asym A′′
2841.6 2831.0 2937.2 53.9 νCH3 sym1607.8, 1604.8, 1603.0, 1598.6 1605.2, 1602.1, 1600.1,1597.5 1605.8 74.4 νCCR
1593.0 1591.1 1588.3 22.4 νCCR
1505.0, 1501.3 1502.1, 1501.4, 1498.4 1492.9 84.9 δCHR, νOCR
1481.9, 1478.4, 1472.9 1474.1, 1468.9 1472.1 35.8 δCH3 asym A’1458.9, 1457.1 1455.7 1459.6 8.9 δCH3 asym A′′
1451.2 1454.1 1452.5 5.1 δCHR
1441.2 1437.9, 1436.8 1441.4 6.5 δCH3 sym1336.3 1335.2 1327.2 14.7 νCCR, δCHR
1305.6 1305.7 1305.1 18.9 νCCR, δCHR
1264.5, 1260.9, 1252.3, 1249.2 1262.3, 1257.6, 1251.9, 1249.8 1243.6 226.4 νOCR
1184.6 1183.8 1174.8 9.3 γ CH3 A′
1175.8 1172.3 1168.6 17.9 δCHR
1156.3, 1154.0 1158.7, 1155.8,1154.0, 1152.0 1152.5 3.6 δCHR
1129.1 1120.4 1141.6 0.6 γ CH3 A′′
1079.4 1079.2, 1077.9 1078.4 11.2 νCCR, δCHR
1056.0, 1049.2 1054.0, 1048.5 1041.6 54.8 νCO1026.0 1022.4 1017.6 3.8 δCCCR
995.9 995.5 987.0 1.5 δCCCR
971.0 969.6 949.3 0.1 γ CHR
n.o. 951.1 934.9 0.1 γ CHR
879.0 878.2, 876.3 864.8 6.5 γ CHR
818.3 n.o. 806.7 0.3 γ CHR
788.0 787.3, 785.7 779.8 16.7 δCHR
755.3, 753.6, 752.3 753.4, 752.2, 750.8 740.7 78.5 γ CHR
690.5 691.6, 690.3, 688.0 665.9 17.0 τCCR
n.o. 614.1 615.4 0.5 δCCCR
555.6 553.0 548.2 6.6 δCCCR, δCOC513.9 (?) 506.2 502.5 9.8 τCCR
n.o. n.o. 436.1 1.0 δCCOn.o. n.o. 410.6 0.0008 τCCR
n.i. n.i. 259.3 0.6 γ CO, τCH3
n.i. n.i. 250.2 2.6 δCOCn.i. n.i. 199.5 0.1 τCH3
n.i. n.i. 89.6 4.8 τOCR
aWavenumbers in cm−1; IR intensities in km mol−1.bBands in bold were observed in the spectra of the photolysed p-anisaldehyde matrices (in some cases with maxima a few tenths of cm−1 shifted relatively to the values for isolatedanisole due to interactions with the simultaneously formed CO).cApproximate description as shown by animated vibrations in GAUSSVIEW;35 ν, stretching; δ, in-plane bending; γ , out-of-plane rocking; τ , torsion; superscript R, ring; n.o., notobserved; n.i., not investigated.
matrices (than from the compound isolated in solid argon)points to the involvement of a triplet state in this photopro-cess. Traces of benzene valence isomers (benzvalene, ful-vene, and Dewar benzene; Scheme 3) could also be identi-fied in the UV-irradiated matrices of benzaldehyde (FigureS1; Table S2). These are secondary photoproducts resultingfrom the initially formed benzene, their formation under theused experimental conditions being well–documented in theliterature.56, 57
Contrarily to what was observed for p-anisaldehyde inxenon and for benzaldehyde in both xenon and argon matri-ces, UV irradiation of p-anisaldehyde isolated in argon didnot yield CO and anisole as main products. These two speciescould still be identified in the photolysed matrix, but thesephotoproducts are not abundant. There are two main pieces ofdata which clearly indicate that, in this case, decarbonylationis not the main observed photoprocess: (1) observation of anintense band at 1642 cm−1, as well as other less intense bands
144509-5K
usetal.
J.Chem
.Phys.136,144509
(2012)
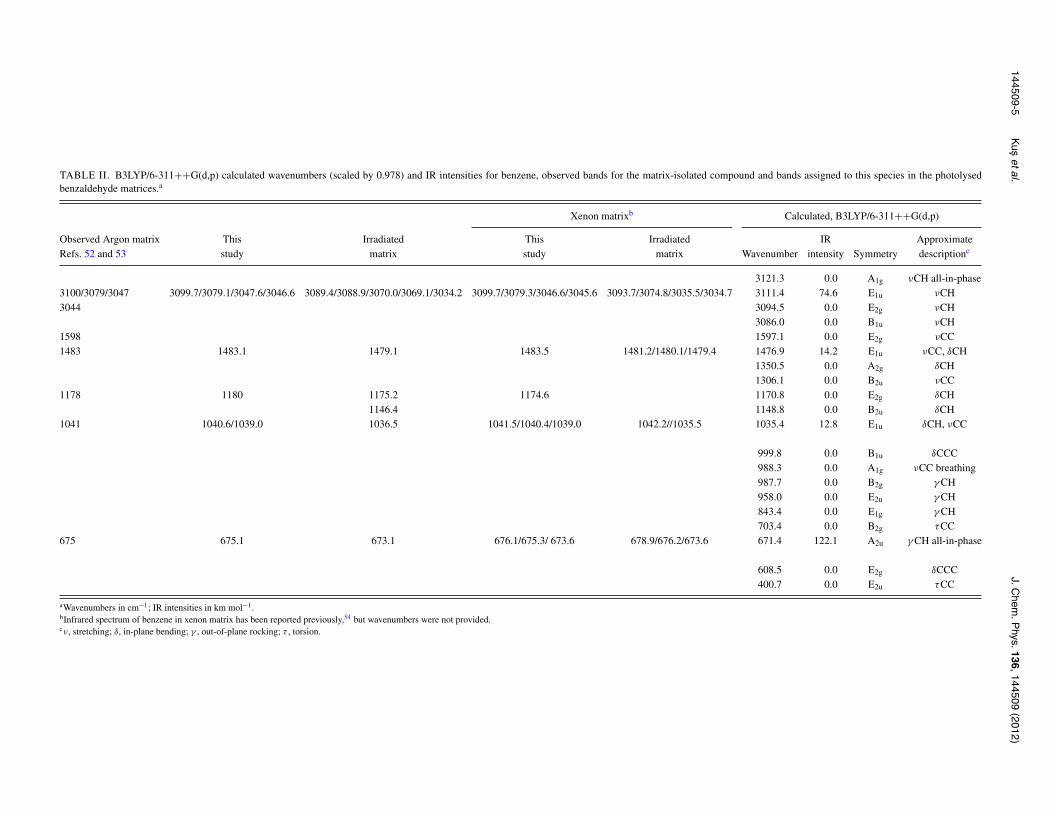
TABLE II. B3LYP/6-311++G(d,p) calculated wavenumbers (scaled by 0.978) and IR intensities for benzene, observed bands for the matrix-isolated compound and bands assigned to this species in the photolysedbenzaldehyde matrices.a
Xenon matrixb Calculated, B3LYP/6-311++G(d,p)
Observed Argon matrix This Irradiated This Irradiated IR ApproximateRefs. 52 and 53 study matrix study matrix Wavenumber intensity Symmetry descriptionc
3121.3 0.0 A1g νCH all-in-phase3100/3079/3047 3099.7/3079.1/3047.6/3046.6 3089.4/3088.9/3070.0/3069.1/3034.2 3099.7/3079.3/3046.6/3045.6 3093.7/3074.8/3035.5/3034.7 3111.4 74.6 E1u νCH3044 3094.5 0.0 E2g νCH
3086.0 0.0 B1u νCH1598 1597.1 0.0 E2g νCC1483 1483.1 1479.1 1483.5 1481.2/1480.1/1479.4 1476.9 14.2 E1u νCC, δCH
1350.5 0.0 A2g δCH1306.1 0.0 B2u νCC
1178 1180 1175.2 1174.6 1170.8 0.0 E2g δCH1146.4 1148.8 0.0 B2u δCH
1041 1040.6/1039.0 1036.5 1041.5/1040.4/1039.0 1042.2//1035.5 1035.4 12.8 E1u δCH, νCC
999.8 0.0 B1u δCCC988.3 0.0 A1g νCC breathing987.7 0.0 B2g γ CH958.0 0.0 E2u γ CH843.4 0.0 E1g γ CH703.4 0.0 B2g τCC
675 675.1 673.1 676.1/675.3/ 673.6 678.9/676.2/673.6 671.4 122.1 A2u γ CH all-in-phase
608.5 0.0 E2g δCCC400.7 0.0 E2u τCC
aWavenumbers in cm−1; IR intensities in km mol−1.bInfrared spectrum of benzene in xenon matrix has been reported previously,54 but wavenumbers were not provided.cν, stretching; δ, in-plane bending; γ , out-of-plane rocking; τ , torsion.

144509-6 Kus et al. J. Chem. Phys. 136, 144509 (2012)
2000 1600 1200 800
0.0
0.2
0.4
0.6
0.8
2000 1600 1200 800
-0.4
-0.2
0.0
0.2
2000 1600 1200 800
0.0
0.2
0.4
0.6
0.8
Benzaldehyde : Xe
Abs
orba
nce
(c)
(b)
(a)
(c)
(b)
(a)
Abs
orba
nce
Benzene : Xe
Wavenumber / cm −1
Abs
orba
nce
2000 1600 1200 800
0.0
0.2
0.4
0.6
2000 1600 1200 800-0.4
-0.2
0.0
0.2
2000 1600 1200 800
0.0
0.2
0.4
0.6
0.8
Benzaldehyde : Ar
Abs
orba
nce
Abs
orba
nce
Benzene : Ar
Wavenumber / cm −1
Abs
orba
nce
FIG. 2. Left panel: (a) Spectrum of benzaldehyde in a xenon matrix at 30 K (as deposited); (b) difference spectrum: the spectrum recorded after UV irradiation(180 min with λ = 250 nm) of benzaldehyde in Xe matrix minus the spectrum of the same sample recorded before any irradiation. Growing bands showupwards; (c) spectrum of a genuine sample of benzene in a xenon matrix at 30 K obtained in a separate experiment. Right panel: (a) spectrum of benzaldehydein an argon matrix at 15 K (as deposited); (b) difference spectrum: the spectrum recorded after UV irradiation (165 min with λ = 250 nm) of benzaldehyde inAr matrix minus the spectrum of the same sample recorded before any irradiation. Growing bands show upwards; (c) spectrum of a genuine sample of benzenein an argon matrix at 15 K obtained in a separate experiment.
at lower frequencies, e.g., 1598, 1475, 1301, 1274/1272, and655 cm−1, which do not have counterparts in the spectrumof anisole in an argon matrix; (2) the absorption in the 2140cm−1 region is by far too intense to be ascribed to CO(Figure 3).
From the observed decrease in absorbances of the bandsdue to p-anisaldehyde and increase of the intensity of thebands due to anisole (weighted by the corresponding calcu-lated intensities), one can estimate that the photoproducedanisole corresponds to only ca. 1/3 of the reactant consump-tion. On the other hand, if the absorption in the 2140 cm−1 re-gion was originated in CO, this would imply that eight timesmore reactant than the initially present in the matrix had beenconsumed. Perceptibly, the main contributor to the absorptionat ca. 2140 cm−1 must be other species, which should exhibitan intense band in this region. The obvious candidate for thisspecies is a ketene, since ketenes are well–known to give riseto very intense bands in this spectral range.39, 40, 58, 59
In principle, an open-ring ketene as well as a closed-ring ketene (Scheme 4) could be considered as putative mainphotoproducts of the photolysis of p-anisaldehyde in argon.However, the comparison of their calculated infrared spec-tra with the experimental data clearly reveals that only thecalculated spectrum of the closed-ring ketene (Scheme 2)fits the observations (Figure 3; see also Table III). As itcould be anticipated, estimation of the photochemically pro-duced amount of this ketene, based on the observed band ab-
sorbances (weighted by the corresponding calculated intensi-ties), indicated that it corresponds to about 2/3 of the reactantconsumption.
According to the calculations, the closed-ring ketene hastwo possible conformers (see Scheme 4). It is possible that thesecond conformer of the closed-ring ketene is also producedfrom p-anisaldehyde upon UV irradiation of this compound inargon matrices. However, the similarity of the infrared spectraof the two conformers (concerning their most intense bands)precluded a definitive conclusion on this point. On the otherhand, the open-ring ketene has a large number of possible iso-meric forms: it can adopt E as well as Z structures around thecentral double bond; for each of these, there are seven uniqueconformers, differing in the orientation of the CH=C=C=O,O–CH3 and CH=CH2 terminal fragments (see Figures S2 andS3, supplementary material).51 In some cases, the predictedinfrared spectra of the different forms of the open-ring ketenediffer somewhat from each other. However, in all cases thecalculations predicted a very characteristic intense band in the1575-1535 cm−1 range (due to the stretching vibration of thecentral C=C bond) which is not experimentally observed inthe spectrum of the irradiated Ar matrix of p-anisaldehyde(Figure 4; see also Table S4 for calculated infrared spectra ofopen-ring ketene isomers).
Once the band at 1640 cm−1 was identified as a spec-tral signature of the closed-ring ketene photoproduced fromp-anisaldehyde isolated in argon matrices (Figure 4), the

144509-7 Kus et al. J. Chem. Phys. 136, 144509 (2012)
2000 1600 1200 800
0.0
0.1
0.2
2000 1600 1200 800
-0.1
0.0
0.1
2000 1600 1200 800
0
100
300
400
p-Anisaldehyde : Ar (a)
(b)
(c)A
bsor
banc
eA
bsor
ban c
e"Ketene", Calc
Wavenumber / cm −1
Cal
c.IR
Inte
n sity
FIG. 3. (a) Spectrum of p-anisaldehyde in an argon matrix at 15 K (as de-posited); (b) difference spectrum: the spectrum recorded after UV irradiation(40 min with λ > 234 nm) of p-anisaldehyde in Ar matrix minus the spectrumof the same sample recorded before any irradiation. Growing bands show up-wards; (c) simulated infrared spectrum of the most stable conformer of theclosed-ring ketene isomer of p-anisaldehyde, (4-methoxycyclohexa-2,4-dien-1-ylidene)methanone (abbreviated in figure as “Ketene”).
small band observed at 1636 cm−1, in the spectra of the UV-irradiated compound isolated in solid xenon, could be alsotreated as an indication of the closed-ring ketene photoprod-uct. However, for p-anisaldehyde isolated in xenon matrices,the branching ratio of production of the closed-ring keteneand anisole + CO is only 1:10 (as estimated from band inten-sities). This is in profound contrast to what was observed for
C
OCH3
HH
O
C
OCH3
COC
OCH
HH
O
closed-ring open-ring
CH3
SCHEME 4. Selected structures of closed- and open-ring ketenes isomericof p-anisaldehyde. The closed-ring species, (4-methoxycyclohexa-2,4-dien-1-ylidene)methanone, may exist in two conformers, differing by internal ro-tation about the C–O(CH3) bond; in the electronic ground state, the less stableform has a calculated relative energy of 15.7 kJ mol–1 with respect to the moststable form (left most form in the figure). The open-ring ketene may exist inboth Z and E forms about the central bond, each isomer possessing severalconformers (see Figures S2 and S3, supplementary material).51
2300 2200 2100 1700 1600 1500
-0.05
0.00
0.05
0.10
2300 2200 2100 1700 1600 1500
0
100
200
2300 2200 2100 1700 1600 1500
0
100
200
Abs
orba
nce (a)
Infr
ared
Inte
nsity
(Sim
ulat
ed)
(b)
Wavenumber / cm −1
(c)
FIG. 4. (a) Difference spectrum showing changes induced by UV irradia-tion (40 min with λ > 234 nm) of p-anisaldehyde in an argon matrix (thesame spectrum as in Figure 3(b), growing bands show upwards); (b) simu-lated difference spectrum: most stable conformer of the closed-ring keteneisomer of p-anisaldehyde minus p–anisaldehyde (55% O–trans + 45%O-cis); (c) simulated difference spectrum: most stable conformer (E4 form;see Figure S2 in supplementary information)51 of the open-ring ketene iso-mer of p-anisaldehyde minus p–anisaldehyde (55% O–trans + 45% O-cis).
p-anisaldehyde isolated in solid argon, where this branchingratio was ca. 2:1.
In case of benzaldehyde, isolated in argon or xenon ma-trices, no experimental indications of generation of the cor-responding closed-ring ketene photoproducts were observed(Figure 5).
The complete mechanistic picture of the observed pho-toprocesses, leading to the full understanding of the differentresults obtained for the two aldehydes and the different be-havior of p-anisaldehyde in argon and xenon matrices, wouldrequire the use of ultrafast time-resolved techniques, whichare, however, still not easily applicable to processes occur-ring in solid cryomatrices and their use is beyond the scope ofthe present study. Nevertheless, from the obtained results andaccumulated information (available in the literature) on thephotochemistry of aldehydes in solution and in the gas phase(including results of time-resolved vibrational spectroscopy),a possible mechanism can be proposed which explains the ob-servations.
In the present study, irradiation of the matrices was car-ried out at energies which should lead to excitation of thetwo molecules predominantly to their S2 and S3 states. Forbenzaldehyde, the S2(π , π*) ← S0 and S3(π , π*) ← S0 tran-sitions (in the gas phase) were observed45, 60, 61 to give riseto absorption bands with maxima at 275 and 232 nm, re-spectively, (a weak structured band due to the S1(n,π*) ← S0

144509-8 Kus et al. J. Chem. Phys. 136, 144509 (2012)
TABLE III. B3LYP/6-311++G(d,p) calculated wavenumbers (scaled by 0.978) and IR intensities for the closed-ring ketene isomeric of p-anisaldehyde andobserved bands assigned to this species in the photolysed p-anisaldehyde argon matrix.a
Calculated, B3LYP/6-311++G(d,p) wavenumber IR intensity
Observed photolysed Argon matrix More stableb Less stableb More stable Less stable Approximate descriptionc
3133.9 3126.7 4.3 7.1 νCH=CH sym3129.2 3113.9 7.3 4.2 νCH3105.5 3101.9 2.8 1.8 νCH=CH asym3064.2 3057.8 23.0 28.5 νCH3 asym2992.3 2995.5 39.2 39.4 νCH3 asym2982.6 2987.9 20.3 16.8 νCH2 asym2936.9 2938.7 43.3 57.4 νCH3 sym2881.7 2882.0 51.5 51.2 νCH2 sym
2129.8, 2125.7, 2117.6, 2114.0 2136.1 2136.6 1325.0 1315.9 νC=C=O asym1641.8 1653.9 1662.4 164.2 119.0 νC=C asym1598.4 1587.6 1574.9 33.7 66.2 νC=C sym1475.5 1472.8 1469.7 17.2 14.8 δCH3 asym
1458.3 1456.7 1.0 10.8 δCH2
1456.2 1453.8 9.8 1.4 δCH3 asym1444.0 1443.0 6.5 3.1 δCH3 sym
1428.3 1424.9 1421.9 9.0 6.0 δCH=CH asym1316.2 1344.8 1340.0 35.2 14.0 νC=C=O sym1301.4(?) 1302.7 1289.6 2.4 3.0 wCH2, δCH1275.8 1278.4 1272.0 42.4 31.0 δCH, wCH2
1237.5 1235.6 1229.5 66.6 17.3 νC-C Ringd 1212.8 1207.0 136.5 122.4 νCO, νC-C Ring
1192.6 1189.2 16.0 30.5 twCH2
1175.8 1166.5 1153.7 96.1 78.0 γ CH3, νCO1145.0 1139.0 0.8 23.7 γ CH3
1133.5 1131.3 2.6 31.0 δCH=CH sym∼1026 1030.9 1025.1 6.4 37.0 νOC(H3), νC-C Ring∼1026 1010.3 979.7 24.1 25.3 νCC Ring, νOC(H3)
958.3 958.5 10.2 6.6 γ CH2
935.5 929.0 0.02 0.5 γ CH=CH asym906.0 907.9 7.7 8.4 νCC Ring, γ CH2
751.4 760.4 797.7 49.6 31.2 γ CH, τRing, νCO756.0 753.6 12.4 1.3 γ CH=CH sym716.9 723.0 0.5 5.0 γ CH
655.6 666.6 673.4 17.0 15.1 νC-C Ring661.4 644.9 6.9 3.0 δC=C=O624.6 637.0 8.7 16.7 τRing576.1 573.6 4.2 4.3 δRing511.3 510.0 14.9 16.5 γ C=C=O477.4 441.6 0.8 5.2 δCCO(CH3)405.2 398.2 9.1 10.4 τRing345.3 363.6 2.8 1.4 δRing277.6 302.8 0.1 2.2 τRing251.5 229.9 5.2 1.2 δCOC221.1 184.2 0.5 2.9 τCH3
202.2 150.9 0.8 2.9 τRing129.3 131.1 1.6 2.8 δCC=C122.1 69.3 6.4 6.2 τCO48.0 48.4 0.1 0.5 γ CC=C
aWavenumbers in cm−1; IR intensities in km mol−1.b“More stable” and “less stable” refer to the stabilities of the two conformers in the electronic ground state. The less stable form has the calculated relative energy of 15.7 kJ mol–1
with respect to the more stable form.cApproximate description as shown by animated vibrations in GAUSSVIEW;35 ν, stretching; δ, in-plane bending; γ , out-of-plane rocking; τ , torsion; tw, twisting; w, wagging; sym,symmetric; asym, asymmetric.dOverlapped by bands due to reactant.

144509-9 Kus et al. J. Chem. Phys. 136, 144509 (2012)
2000 1600 1200 800
2000 1600 1200 800
2000 1600 1200 800
2000 1600 1200 800
*
Benzaldehyde : Xe
Abs
orba
nce
*
Benzaldehyde : Ar
Abs
orba
nce
*
p-Anisaldehyde : Xe
Wavenumber / cm −1
Abs
orba
nce
Abs
orba
nce
(d)
(c)
(b)
(a)
p-Anisaldehyde : Ar
*
FIG. 5. Comparison of the infrared spectra of photoproducts obtained byUV-irradiation of benzaldehyde (a, b) and p-anisaldehyde (c, d) in xenon(a, c) and argon (b, d) matrices. The difference spectra shown in frames a,b, c, d correspond to the difference spectra shown in the middle frames ofFigure 2 (left panel), 2 (right panel), 1, and 3, respectively. The negativebands due to the reactants are truncated. The asterisks indicate bands dueto the C=O stretching vibration of the photoproduced radicals resulting fromthe H-atom abstraction from the aldehyde groups.
transition is observed within 290–379 nm, with absolute max-imum at 371 nm,62, 63 and the S4(π , π*) ← S0 band has itsmaximum at 195 nm).45 In the case of p-anisaldehyde, theavailable TD–DFT(B3LYP)/6-311++G(d,p) calculated verti-cal absorptions, leading to the first four excited singlet states,are ca. 330, 265, 260, and 230 nm, with oscillator strengthsof 0.0001, ∼0.340, ∼0.065, and 0.0001 (the values calcu-lated for O-trans and O-cis conformers are identical).39 Oncethe initially excited (S2 or S3) state is formed, it can eitherundergo intersystem crossing to the triplet manifold or iso-merize to the closed-ring ketene, by migration of the alde-hyde hydrogen to the ring carbon atom in the ortho position(Scheme 5). For benzaldehyde, the intersystem crossing isknown to be highly efficient42, 45, 64–69 and might occur withparticipation of the lowest excited singlet state after inter-nal conversion from the initially excited state, since the S1
state has been shown to possess a bifurcation on its poten-tial energy surface to the triplet manifold.42, 66, 67 In the tripletmanifold, cleavage of the aldehyde C–H bond can take place,leading to the observed benzoyl radical plus a hydrogen atom,which then may recombine with release of CO and formationof benzene. The latter process can be thought to be consid-erably favored in a solid matrix compared to the gas phase,because the mobility of the hydrogen atom is reduced in thiscase and recombination is facilitated. It is possible that de-carbonylation of benzaldehyde also occurs on the S1 surfacevia the open-ring ketene or an alternative intermediate result-ing from migration of the aldehyde hydrogen to the vicinalcarbon atom, as suggested to occur in the gas phase.42, 66, 67
However, the non-observation of these species in the presentstudy suggests that for benzaldehyde the pathway involvingthe crossing to the triplet manifold is strongly dominant inthe photolysis of the compound in both studied matrices. Itis also worth mentioning that formation of phenyl and formylradicals, by the cleavage of the C–C exocyclic bond, does notseem to take place for the matrix-isolated compound. Suchprocess has been reported to occur under other experimental
S2, S3
S1
S0
hν
O H
R
IC
T
ISC
R= H (Xe, Ar)R= OCH3 (Xe)
R= OCH3 (Ar)
C
O
R
HH
C-H aldehydecleavage
CO
R
R
+ H
-CO
O H
R
SCHEME 5. Photochemical reaction pathways for matrix-isolated p-anisaldehyde and benzaldehyde. IC, internal conversion; ISC, intersystem crossing;R = H or OCH3; Sn (n = 0, 1, 2, 3) lowest energy singlet states; T, generic triplet state.

144509-10 Kus et al. J. Chem. Phys. 136, 144509 (2012)
conditions,45, 70 but for benzaldehyde isolated in low-temperature matrices and excited with UV light no spectro-scopic evidence71, 72 of the presence of either phenyl or formylradicals was found.
According to the experimental observations, in the caseof p-anisaldehyde the presence of the methoxyl group at thepara position results in the reduction of the efficiency of theintersystem crossing to the triplet manifold and gain of rel-ative importance of the ketene formation channel. In an ar-gon matrix, this latter channel becomes the preferred one. Onthe other hand the external heavy atom effect due to the hostmatrix atoms facilitates the intersystem crossing in a xenonmatrix, and decarbonylation appears as the preferred path-way in this medium also in the case of p-anisaldehyde. Inthis regard, the observed different photochemical behavior ofp-anisaldehyde in argon and xenon matrices resembles verymuch that of formamide.27
It shall also be noticed that, though the experimental ob-servation of the closed-ring ketene photoproduct type con-stitutes a rare observation in case of aromatic aldehydes,it has already been reported previously for matrix-isolated1-nitro-substituted benzaldehyde and naphthaldehyde,73–75
which suggests that the presence of σ -electron-attractor sub-stituents in the aromatic ring may facilitate photogenerationof this species. Very interestingly, the formation of the ketenefollows closely the previously reported phototransformationof acrolein (that is the smallest chemical system bearing aC=CH–CHO fragment) into methylketene.50
IV. CONCLUSIONS
The experiments carried out within the present workdemonstrated that monomeric benzaldehyde isolated in Aror Xe matrices and excited with UV light undergoes de-carbonylation, leading to formation of benzene + CO. Forp-anisaldehyde isolated in Xe matrices, photoinduced de-carbonylation process (producing anisole + CO) domi-nates also strongly. However, the photochemical behavior ofp-anisaldehyde isolated in solid argon is quite different. Inthis latter case, the main UV-induced process is the pho-toisomerization of p-anisaldehyde to the closed-ring ketenespecies (4-methoxycyclohexa-2,4-dien-1-ylidene)methanone.The different photochemical transformations observed forp-anisaldehyde isolated in solid Ar and Xe environmentscan be explained by the external heavy-atom effect. Prox-imity of heavy Xe atoms should promote intersystem cross-ing in p-anisaldehyde molecules, hence facilitating popula-tion of the manifold of the triplet states. The methoxyl sub-stituent, present in the structure of p-anisaldehyde, shouldhave the opposite effect; it should reduce the efficiency ofintersystem crossing. Most probably, this is why decarbony-lation is not effective for p-anisaldehyde isolated in argonmatrices.
In both observed channels of phototransformations (de-carbonylation and isomerization to the ketene structure) of thestudied aromatic aldehydes (benzaldehyde and anisaldehyde)one event is common. This concerns the cleavage of the C−Hbond in the aldehyde group. Neither ketene nor CO can beformed without breaking this C−H bond. Formation of ben-
zene, anisole, or the closed-ring ketene products requires thatthe detached hydrogen atom attaches back to the molecule, atone of the carbon atoms of the ring. In addition, the experi-ments carried out within the present work also indicated that,under the used experimental conditions, decarbonylation oc-curs via the radicals (p-methoxybenzoyl or benzoyl radical)produced by photodissociation of the C–H aldehyde bonds ofthe studied aldehydes. This process seems then to be similar tothe Norrish type I, C−H bond cleavage in formaldehyde andacetaldehyde and also to the α-C–C bond cleavage observedfor acetone and other aliphatic ketones.76, 77
ACKNOWLEDGMENTS
This investigation has been partially supported byPortuguese “Fundação para a Ciência e a Tecnologia”(FCT: Projects PTDC/QUI/71293/2006, PTDC/QUI-QUI/111789/2009, PTDC/QUI-QUI/118078/2010, and Grant No.SFRH/BPD/31840/2006).
1C. Cacela, M. Leonor, T. S. Duarte, and R. Fausto, Vib. Spectrosc. 26, 113(2001).
2I. D. Reva, S. V. Ilieva, and R. Fausto, Phys. Chem. Chem. Phys. 3, 4235(2001).
3I. D. Reva, S. G. Stepanian, L. Adamowicz, and R. Fausto, Chem. Phys.Lett. 374, 631 (2003).
4A. Gómez-Zavaglia and R. Fausto, J. Mol. Struct. 689, 199 (2004).5A. Kaczor, T. M. V. D. Pinho e Melo, M. I. Soares, and R. Fausto, J. Phys.Chem. A 110, 6531 (2006).
6H. M. Jensen, P. Klaeboe, V. Aleksa, C. J. Nielsen, and G. A. Guirgis, ActaChem. Scand. 52, 578 (1998).
7P. Klaeboe, C. J. Nielsen, V. Aleksa, A. Gruodis, G. A. Guirgis, Y. E.Nashed, and J. R. Durig, J. Mol. Struct. 567–568, 167 (2001).
8O. Schrems and W. A. P. Luck, J. Mol. Struct. 80, 477 (1982).9A. Gómez-Zavaglia and R. Fausto, Phys. Chem. Chem. Phys. 5, 52 (2003).
10P. M. Agrawal, D. L. Thompson, and L. M. Raff, J. Chem. Phys. 102, 7000(1995).
11L. Khriachtchev, J. Lundell, E. Isoniemi, and M. Räsänen, J. Chem. Phys.113, 4265 (2000).
12M. Pettersson, J. Lundell, L. Khriachtchev, and M. Räsänen, J. Am. Chem.Soc. 119, 11715 (1997).
13M. Pettersson, E. M. S. Maçôas, L. Khriachtchev, J. Lundell, R. Fausto,and M. Räsänen, J. Chem. Phys. 117, 9095 (2002).
14E. M. S. Maçôas, L. Khriachtchev, M. Pettersson, J. Lundell, R. Fausto,and M. Räsänen, Vibrat. Spectrosc. 34, 73 (2004).
15E. M. S. Maçôas, L. Khriachtchev, M. Pettersson, R. Fausto, and M.Räsänen, J. Chem. Phys. 121, 1331 (2004).
16E. M. S. Maçôas, L. Khriachtchev, M. Pettersson, J. Joselius, R. Fausto,and M. Räsänen, J. Chem. Phys. 119, 11765 (2003).
17A. Sharma, I. Reva, and R. Fausto, J. Am. Chem. Soc. 131, 8752 (2009).18L. Lapinski, M. J. Nowak, I. Reva, H. Rostkowska, and R. Fausto, Phys.
Chem. Chem. Phys. 12, 9615 (2010).19A. Gómez-Zavaglia, I. D. Reva, and R. Fausto, Phys. Chem. Chem. Phys.
5, 41 (2003).20A. Borba, A. Gómez-Zavaglia, and R. Fausto, J. Mol. Struct. 794, 196
(2006).21S. Lopes, A. V. Domanskaya, R. Fausto, M. Räsänen, and L. Khriachtchev,
J. Chem. Phys. 133, 144507 (2010).22G. A. Ozin, S. A. Mitchell, D. F. McIntosh, S. M. Mattar, and J. Garcia-
Prieto, J. Phys. Chem. 87, 4651 (1983).23B. M. Giuliano, I. D. Reva, and R. Fausto, J. Phys. Chem. A 114, 2506
(2010).24N. Kus, I. Reva, and R. Fausto, J. Phys. Chem. A 114, 12427
(2010).25S. L. Laursen and G. C. Pimentel, J. Phys. Chem. 93, 2328 (1989).26S. L. Laursen and G. C. Pimentel, J. Phys. Chem. 94, 8175 (1990).27J. Lundell, M. Krajewska, and M. Räsänen, J. Phys. Chem. A 102, 6643
(1998).

144509-11 Kus et al. J. Chem. Phys. 136, 144509 (2012)
28G. Maier and C. Lautz, Eur. J. Org. Chem. 769 (1998).29See also R. Fausto and A. Gómez-Zavaglia, “Light induced reactions
in cryogenic matrices,” in “Specialistic Reports in Photochemistry” (Ed.Angelo Albini), Royal Society of Chemistry, Vol. 37 (2009), Chap. 3,pp.72–99; idem, Vol. 38 (2010), Chap. 2, pp. 37–66; idem, Vol. 39 (2011),Chap. 1, pp. 1–27, and references therein.
30I. D. Reva, S. Stepanian, L. Adamowicz, and R. Fausto, J. Phys. Chem. A105, 4773 (2001).
31A. D. Becke, Phys. Rev. A 38, 3098 (1988).32C. T. Lee, W. T. Yang, and R. G. Parr, Phys. Rev. B 37, 785 (1988).33S. H. Vosko, L. Wilk, and M. Nusair, Can. J. Phys. 58, 1200 (1980).34M. J. Frisch, G. W. Trucks, H. B. Schlegel et al., GAUSSIAN 03, Revision
C.02, Gaussian, Inc., Wallingford, CT, 2004.35R. Dennington, T. Keith, and J. Millam, GAUSSVIEW (Version 5),
Semichem, Inc., Shawnee Mission KS, 2009.36S. Melandri, A. Maris, P. G. Favero, L. Favero, W. Caminati, and R. Meyer,
J. Mol. Spectrosc. 185, 374 (1997).37R. K. Bohn, M. S. Farag, C. M. Ott, J. Radhakrishnan, S. A. Sorenson, and
N. S. True, J. Mol. Struct. 268, 107 (1992).38N. Kus, A. Sharma, I. D. Reva, L. Lapinski, and R. Fausto, J. Phys. Chem.
A 114, 7716 (2010).39N. Kus, S. Breda, I. D. Reva, E. Tasal, C. Ogretir, and R. Fausto, Pho-
tochem. Photobiol. 83, 1237 (2007); erratum: 83, 1541 (2007).40S. Breda, I. Reva, L. Lapinski, and R. Fausto, Phys. Chem. Chem. Phys. 6,
929 (2004).41H. Dubost and L. A. Marguin, Chem. Phys. Lett. 17, 269 (1972).42S. T. Park, J. S. Feenstra, and A. H. Zewail, J. Chem. Phys. 124, 174707
(2006).43A. Horowitz, C. J. Kershner, and J. G. Calvert, J. Phys. Chem. 86, 3094
(1982).44A. Horowitz and J. G. Calvert, J. Phys. Chem. 86, 3105 (1982).45A. Bagchi, Y.-H. Huang, Z. F. Xu, P. Raghunath, Y. T. Lee, C.-K. Ni, M. C.
Lin, and Y.-P. Lee, Chem. Asian J. 6, 2961 (2011).46P. A. Leighton and F. E. Blacet, J. Am. Chem. Soc. 54, 3165 (1932).47F. E. Blacet and R. Crane, J. Am. Chem. Soc. 76, 5337 (1954).48T. W. Davis and M. Burton, J. Chem. Phys. 7, 1075 (1939).49W. M. Garrison and M. Burton, J. Chem. Phys. 10, 730 (1942).50G. T. Fujimoto, M. E. Umstead, and M. C. Lin, J. Chem. Phys. 82, 3042
(1985).51See supplementary material at http://dx.doi.org/10.1063/1.3701734 for this
article: Figure S1, with fragments of difference spectra comparing the pho-toproducts generated upon irradiation of benzaldehyde isolated in xenonand argon matrices; Figures S2 and S3, with the B3LYP/6-311++G(d,p)calculated optimized structures, relative energies, and νC = C wavenumber(for central ethylenic bond) of the conformers of E and Z open-ring ketene
isomeric of p-anisaldehyde; Tables S1 and S3 with vibrational data forp-methoxybenzoyl and benzoyl radicals; Table S2 with observed bands ofbenzene valence isomers and benzoyl radical in the spectra of photolysedbenzaldehyde matrices; Table S4, with B3LYP/6-311++G(d,p) calculatedwavenumbers and IR intensities for the different calculated forms of theopen-ring ketene isomeric of p-anisaldehyde.
52K. G. Brown and W. P. Person, Spectrochim. Acta Part A 34, 117 (1978).53H. S. Kim and K. Kim, Spectrosc. Lett. 29, 667 (1996).54V. I. Feldman, F. F. Sukhov, E. A. Logacheva, A. Yu. Orlov, I. V. Tyulpina,
and D. A. Tyurin, Chem. Phys. Lett. 437, 207 (2007).55A. Mardyukov and W. Sander, Eur. J. Org. Chem. 15, 2904 (2010).56D. E. Johnstone and J. R. Sodeau, J. Phys. Chem. 95, 165 (1991).57J. L. Laboy and B. S. Ault, J. Photochem. Photobiol., A 74, 99 (1993).58S. Breda, I. D. Reva, L. Lapinski, L. Frija, M. L. Cristiano, and R. Fausto,
J. Phys. Chem. A 110, 6415 (2006).59I. D. Reva, M. J. Nowak, L. Lapinski, and R. Fausto, Chem. Phys. Lett.
429, 382 (2006).60D. G. Leopold, R. J. Hemley, V. Vaida, and J. L. Roebber, J. Chem. Phys.
75, 4758 (1981).61C. R. Silva and J. P. Reilly, J. Phys. Chem. 100, 17111 (1996).62H. Abe, S. Kamei, N. Mikami, and M. Ito, Chem. Phys. Lett. 109, 217
(1984).63J. Smolarek, R. Zwarich, and L. Goodman, J. Mol. Spectrosc. 43, 416
(1972).64U. Brühlmann and J. R. Huber, Chem. Phys. Lett. 66, 353 (1979).65T. Itoh, Chem. Phys. Lett. 151, 166 (1988).66D. Shorokhov, S. T. Park, and A. H. Zewail, ChemPhysChem 6, 2228
(2005).67R. Srinivasan, J. S. Feenstra, S. T. Park, S. Xu, and A. H. Zewail, Science
307, 558 (2005).68I. Özkan and L. Goodman, Chem. Phys. Lett. 64, 32 (1979).69H. Murai and K. Obi, J. Phys. Chem. 79, 2446 (1975).70L. Zhu and T. J. Cronin, Chem. Phys. Lett. 217, 227 (2000).71A. V. Marenich and J. E. Boggs, J. Phys. Chem. A 107, 2343 (2003).72J. Spanget-Larsen, M. Gil, A. Gorski, D. M. Blake, J. Waluk, and J. G.
Radziszewski, J. Am. Chem. Soc. 123, 11253 (2001).73S. Laimgruber, T. Schmierer, P. Gilch, K. Kiewisch, and J. Neugebauer,
Phys. Chem. Chem. Phys. 10, 3872 (2008).74S. Kuberski and J. Gebicki, J. Mol. Struct. 275, 105 (1992).75A. S. Dvornikov, C. M. Taylor, Y. C. Liang, and P. M. Rentzepis, J. Pho-
tochem. Photobiol., A 112, 39 (1998).76E. W.-G. Diau, C. Kötting, and A. H. Zewail, ChemPhysChem 2, 273
(2001).77C. M. Hadad, J. H. B. Foresman, and K. B. Wiberg, J. Phys. Chem. 97,
4293 (1993).