Embed Size (px)
Citation preview
1
Using Graph Analysis and Fraud Detection in the Fintech Industry
Stanka Dalekova Yavor I. Ivanov Dobroslav Hristov@PlugIntoPaysafe
3
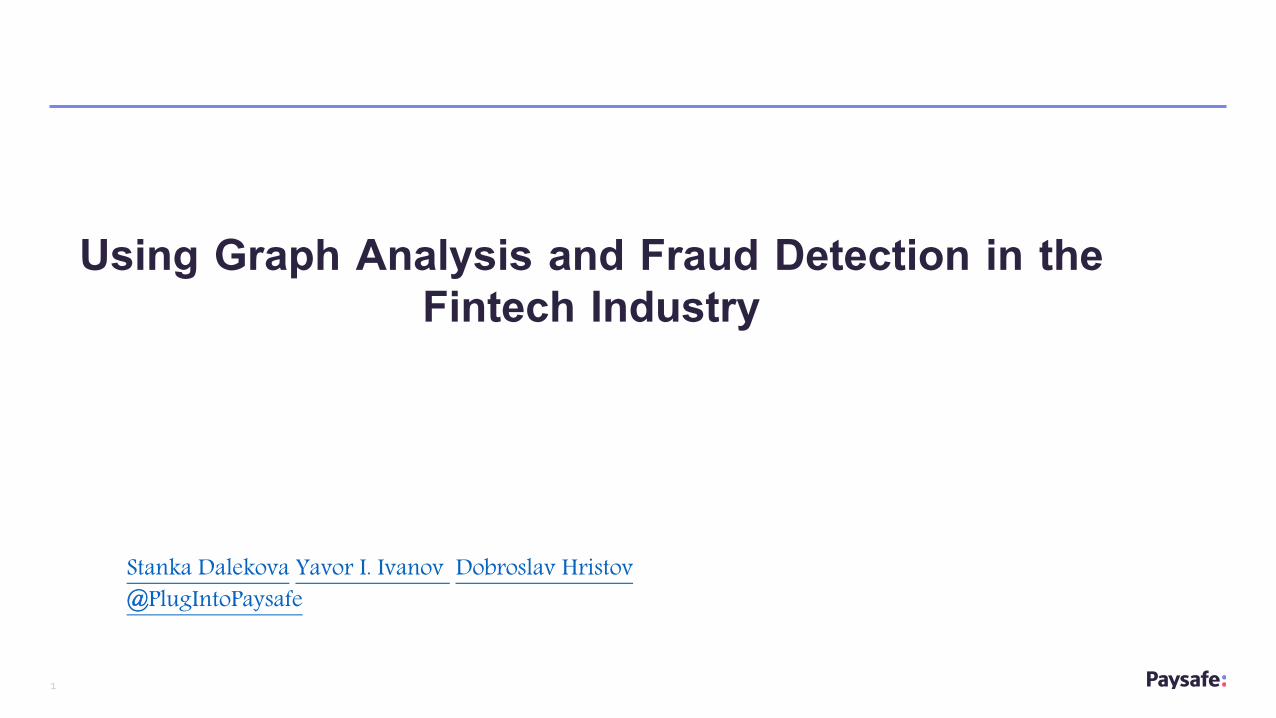
Who are Paysafe?• Paysafe is leading specialized payments player in the world. We do the hard stuff better than our competition• Global transactional volume of $85bn in 2018.
• Real-time Payments• Two e-wallet services
NetellerSkrill
4
• ~ 500 000 payments per day
• Fines on any fraud payment
• Balance between fraud protection and negative customer experience
• Fraudsters bury their patterns in lots of data.
Use Case – Fast Fraud Analytics
5
To PROCESS or NOT to PROCESS?
or or
Online Fraud Screening
6
• Fraud Benchmark Report by Cybersouce from 2016– 83 % of North Americans review 29% of the orders manually,
– Fraud analysts can give insights about fraud patterns and customer behavior
– After manual review, rule engines can be updated
– Manual Review are costly and time-consuming
– Decreasing customer experience by delaying the payment
• Fraud prevention industry benchmark by Kount.com from 2018 – 93 percent of merchants perform manual reviews
– nearly 30 percent have a manual review rate between 1 and 5 percent
– 16 percent review between 5 and 10 percent
– 20 percent review more than one-in-ten of their orders.
Manual Review Metrics
9
Data is our golden eggs, how to make it meaningful?
10
A: The payments in Paysafe are actually a
GRAPH!
Breakthrough
Q: A better way to analyze connected data?
Graph Databases are invented to solve the performance problems of connected data.
12
• Study on mathematical structures used to model pairwise relations between objects
• 250+ years of history - the paper written by Leonhard Euler on the Seven Bridges ofKönigsberg and published in 1736 is regarded as the first paper in the history of graph theory
• Graphs are used to model many types of relations and process
• Graphs solve many real-life problems - in computer science, social sciences, biology, etc.
• Hundreds of graph algorithms – strongly connected components, paths algorithms, nearestneighbor, page rank, edge weight algorithms, etc.
Graph Theory
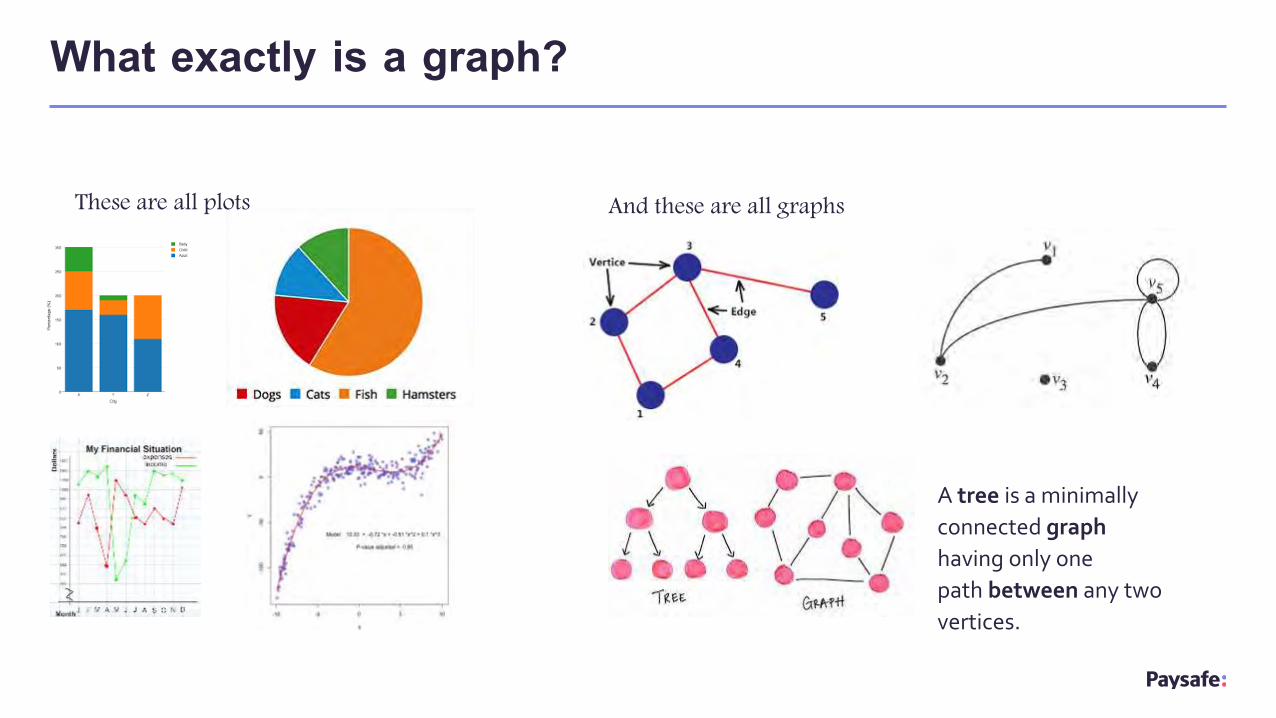
A tree is a minimally
connected graph
having only one
path between any two
vertices.
And these are all graphs
What exactly is a graph?
These are all plots
14
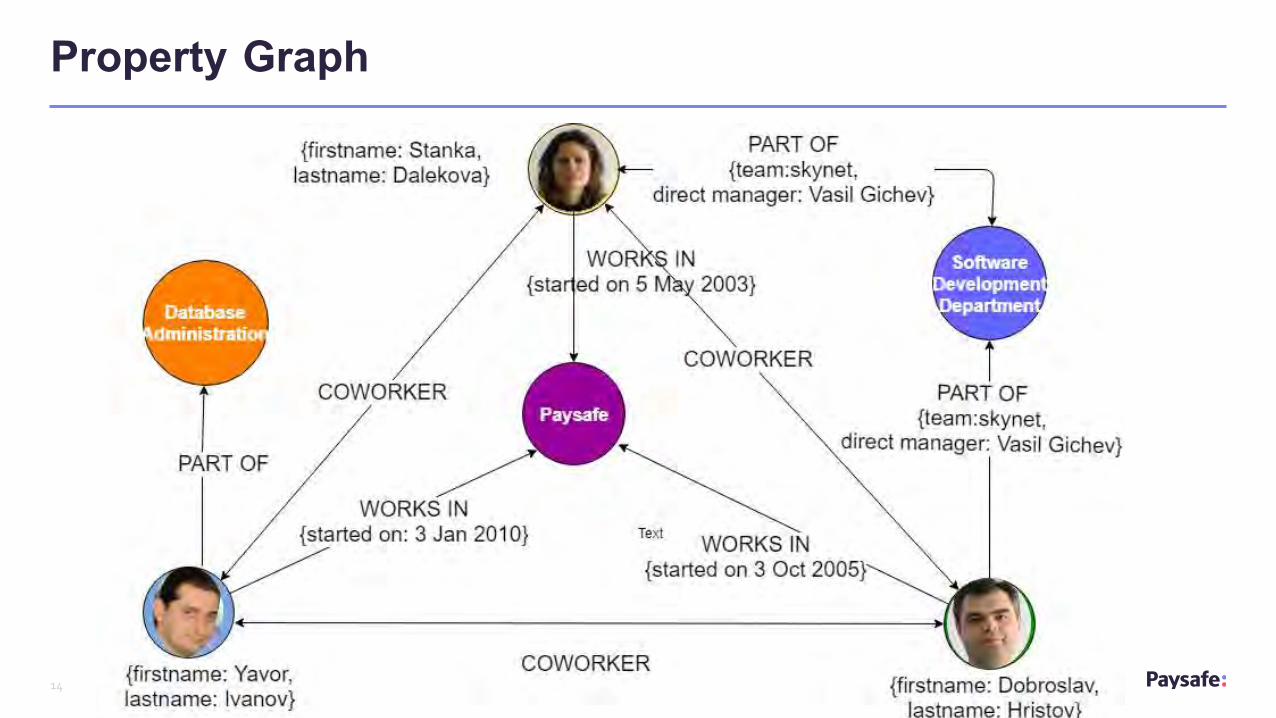
Property Graph
15
Graph databases store data in terms of• Entities (nodes or vertices)• Relationships between entities (edges or arrows)
A better way to explore connected data.
Graph Database
16
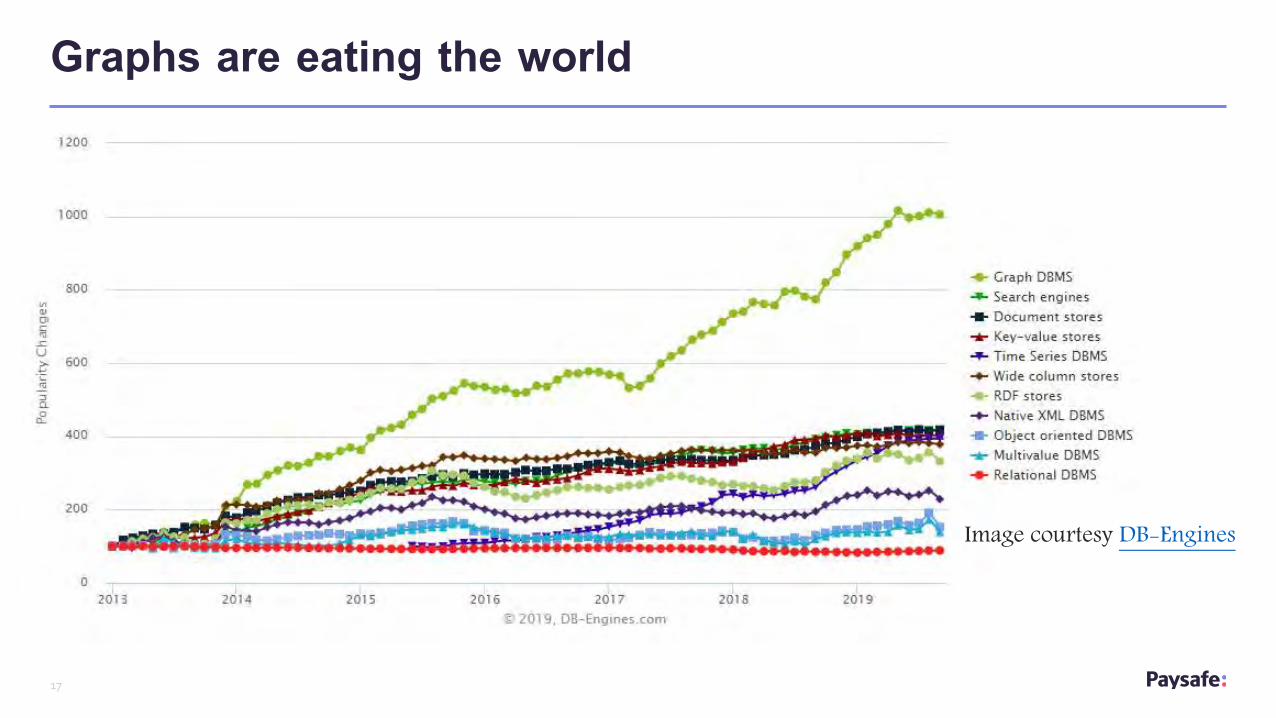
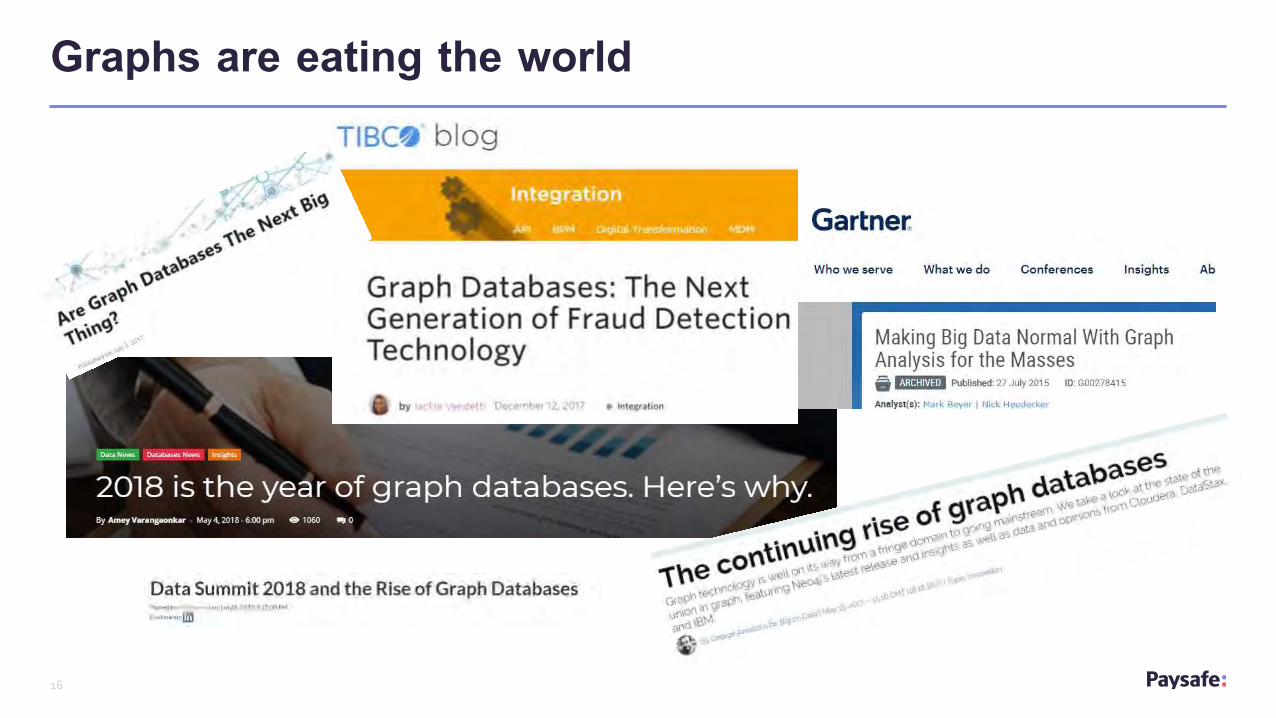
Graphs are eating the world
19
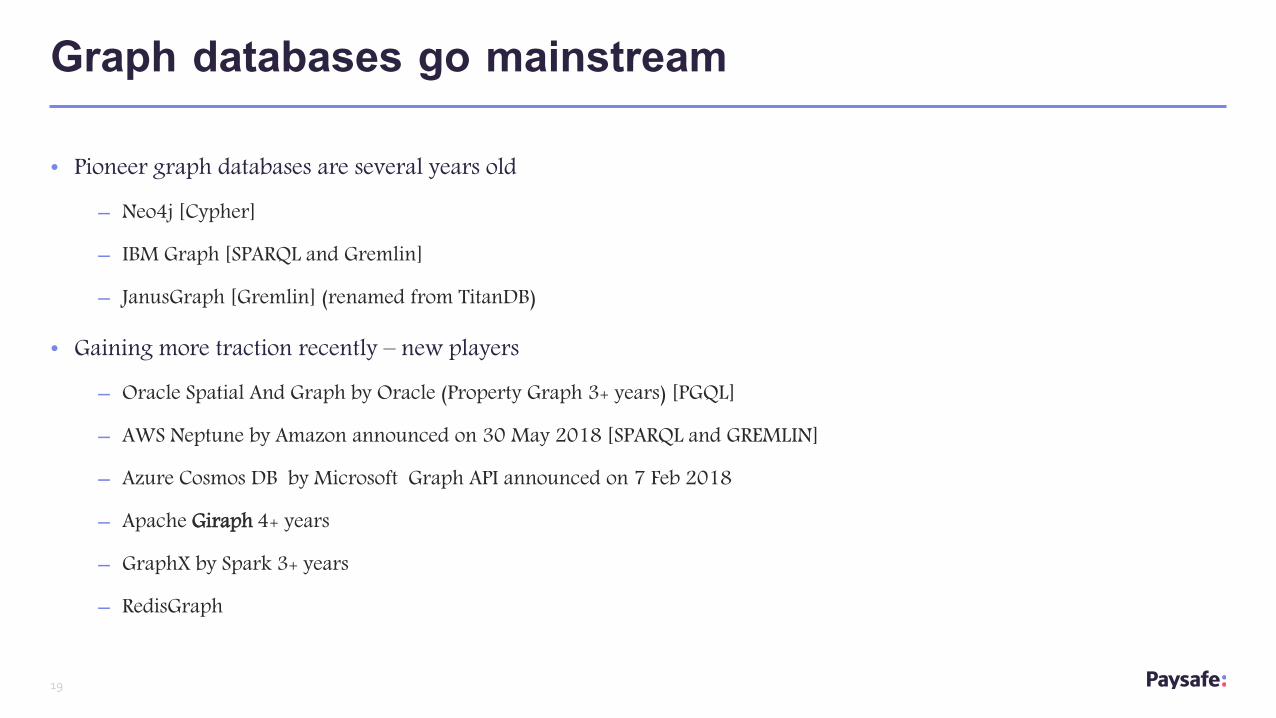
• Pioneer graph databases are several years old– Neo4j [Cypher]
– IBM Graph [SPARQL and Gremlin]
– JanusGraph [Gremlin] (renamed from TitanDB)
• Gaining more traction recently – new players– Oracle Spatial And Graph by Oracle (Property Graph 3+ years) [PGQL]
– AWS Neptune by Amazon announced on 30 May 2018 [SPARQL and GREMLIN]
– Azure Cosmos DB by Microsoft Graph API announced on 7 Feb 2018
– Apache Giraph 4+ years
– GraphX by Spark 3+ years
– RedisGraph
Graph databases go mainstream
22
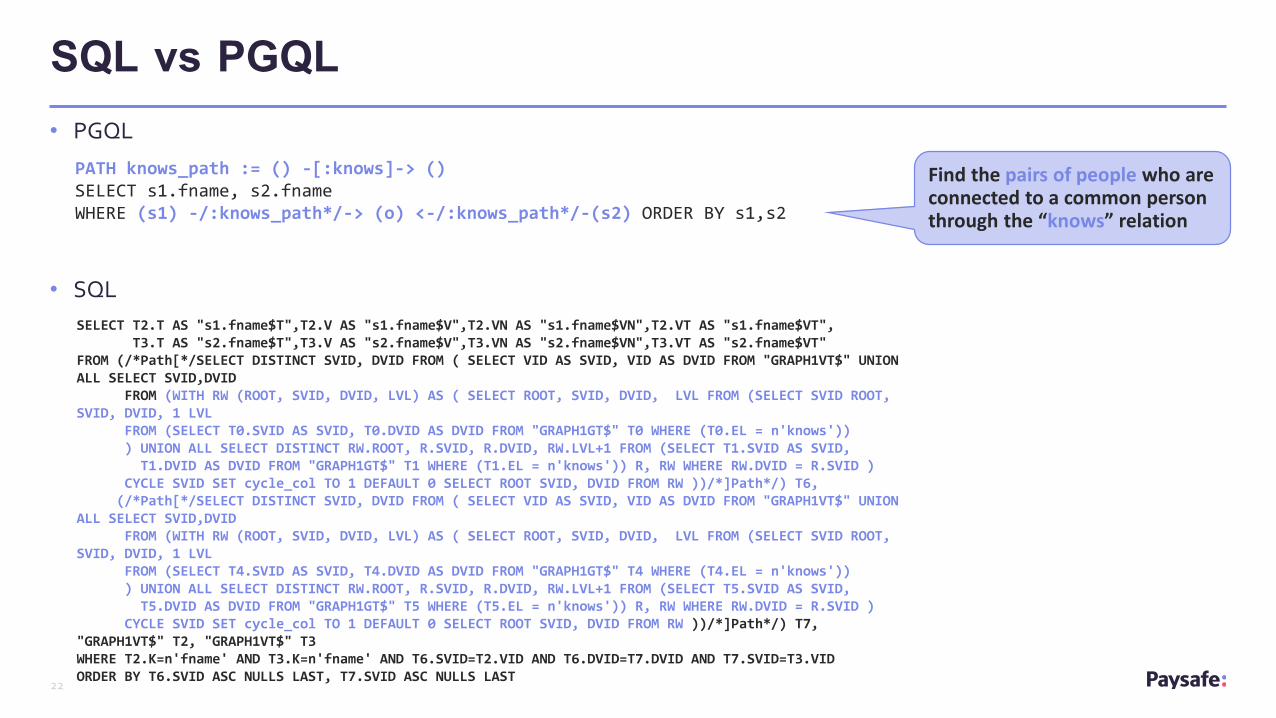
SQL vs PGQL
SELECT T2.T AS "s1.fname$T",T2.V AS "s1.fname$V",T2.VN AS "s1.fname$VN",T2.VT AS "s1.fname$VT",T3.T AS "s2.fname$T",T3.V AS "s2.fname$V",T3.VN AS "s2.fname$VN",T3.VT AS "s2.fname$VT"
FROM (/*Path[*/SELECT DISTINCT SVID, DVID FROM ( SELECT VID AS SVID, VID AS DVID FROM "GRAPH1VT$" UNION ALL SELECT SVID,DVID
FROM (WITH RW (ROOT, SVID, DVID, LVL) AS ( SELECT ROOT, SVID, DVID, LVL FROM (SELECT SVID ROOT, SVID, DVID, 1 LVL
FROM (SELECT T0.SVID AS SVID, T0.DVID AS DVID FROM "GRAPH1GT$" T0 WHERE (T0.EL = n'knows'))) UNION ALL SELECT DISTINCT RW.ROOT, R.SVID, R.DVID, RW.LVL+1 FROM (SELECT T1.SVID AS SVID,T1.DVID AS DVID FROM "GRAPH1GT$" T1 WHERE (T1.EL = n'knows')) R, RW WHERE RW.DVID = R.SVID )
CYCLE SVID SET cycle_col TO 1 DEFAULT 0 SELECT ROOT SVID, DVID FROM RW ))/*]Path*/) T6,(/*Path[*/SELECT DISTINCT SVID, DVID FROM ( SELECT VID AS SVID, VID AS DVID FROM "GRAPH1VT$" UNION
ALL SELECT SVID,DVIDFROM (WITH RW (ROOT, SVID, DVID, LVL) AS ( SELECT ROOT, SVID, DVID, LVL FROM (SELECT SVID ROOT,
SVID, DVID, 1 LVLFROM (SELECT T4.SVID AS SVID, T4.DVID AS DVID FROM "GRAPH1GT$" T4 WHERE (T4.EL = n'knows'))) UNION ALL SELECT DISTINCT RW.ROOT, R.SVID, R.DVID, RW.LVL+1 FROM (SELECT T5.SVID AS SVID,T5.DVID AS DVID FROM "GRAPH1GT$" T5 WHERE (T5.EL = n'knows')) R, RW WHERE RW.DVID = R.SVID )
CYCLE SVID SET cycle_col TO 1 DEFAULT 0 SELECT ROOT SVID, DVID FROM RW ))/*]Path*/) T7,"GRAPH1VT$" T2, "GRAPH1VT$" T3 WHERE T2.K=n'fname' AND T3.K=n'fname' AND T6.SVID=T2.VID AND T6.DVID=T7.DVID AND T7.SVID=T3.VID ORDER BY T6.SVID ASC NULLS LAST, T7.SVID ASC NULLS LAST
PATH knows_path := () -[:knows]-> () SELECT s1.fname, s2.fname WHERE (s1) -/:knows_path*/-> (o) <-/:knows_path*/-(s2) ORDER BY s1,s2
• PGQL
• SQL
Find the pairs of people who are connected to a common person through the “knows” relation
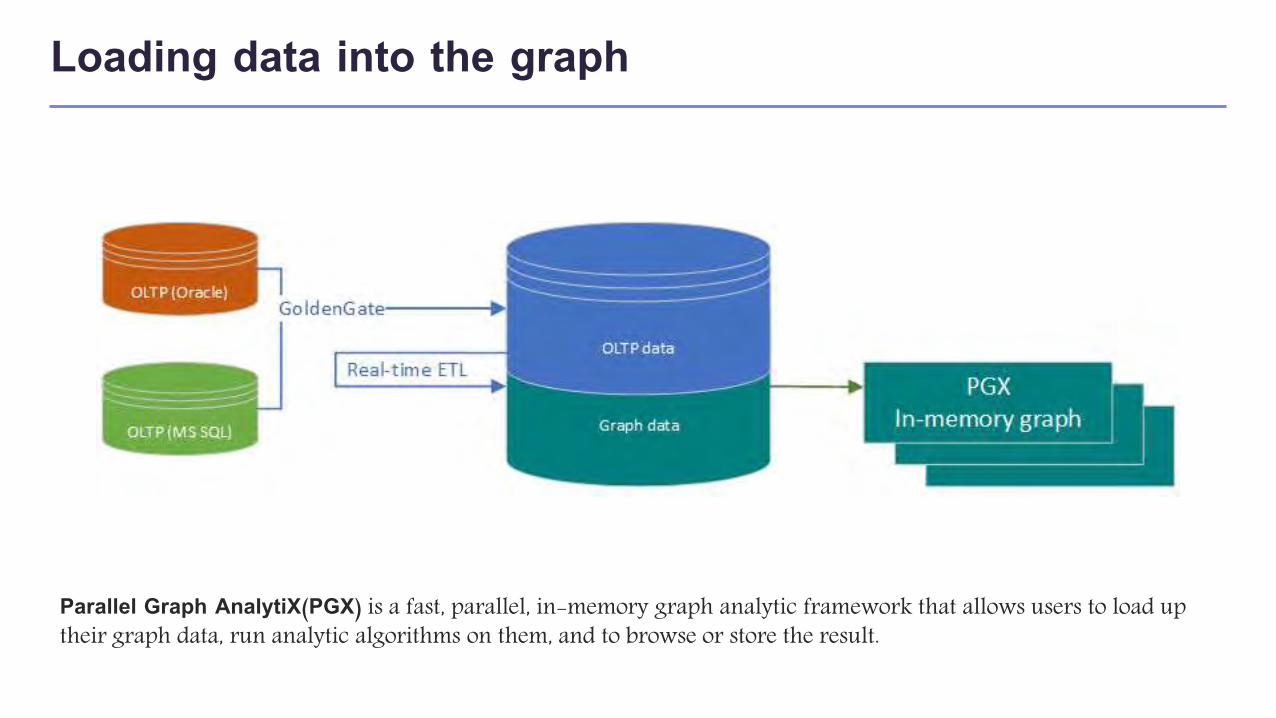
Loading data into the graph
Parallel Graph AnalytiX(PGX) is a fast, parallel, in-memory graph analytic framework that allows users to load up their graph data, run analytic algorithms on them, and to browse or store the result.
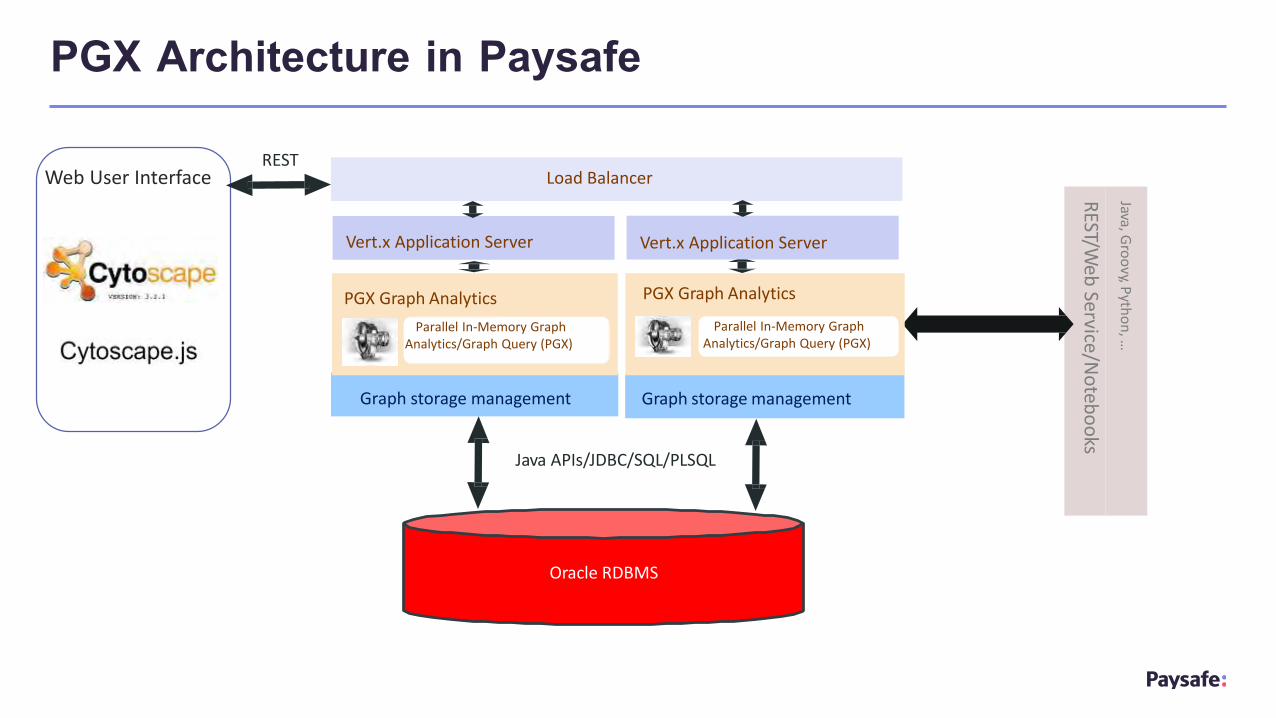
PGX Architecture in Paysafe
Graph storage management
PGX Graph Analytics
Java,Gro
ovy,P
ytho
n,…
REST/W
ebService/N
oteb
oo
ks
Java APIs
Java APIs/JDBC/SQL/PLSQL
Parallel In-Memory GraphAnalytics/Graph Query (PGX)
Oracle RDBMS
Parallel In-Memory GraphAnalytics/Graph Query (PGX)
PGX Graph Analytics
Vert.x Application Server
RESTWeb User Interface Load Balancer
Vert.x Application Server
Graph storage management
• PGX loads the whole graph and the properties needed for the analysis to be loaded into main memory
• Compressed sparse row (CSR) format, a data structure which has minimal memory footprint while providing very fast read access.
• More info on graph memory consumption can be found here– On heap memory only string properties
– Off heap memory everything else – graph topology(edges and vertices) and properties
• Asynchronous Java API
Hardware requirements & sizing
27
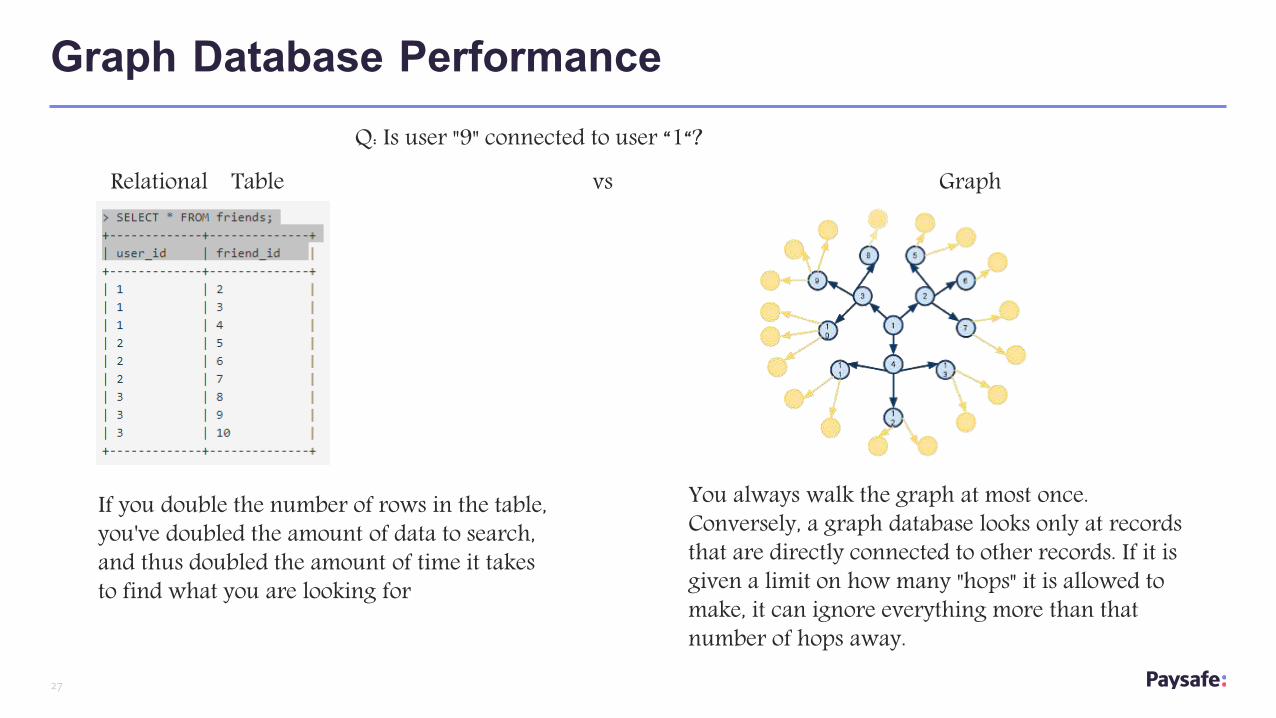
Graph Database Performance
Relational Table vs GraphQ: Is user "9" connected to user “1“?
If you double the number of rows in the table, you've doubled the amount of data to search, and thus doubled the amount of time it takes to find what you are looking for
You always walk the graph at most once.Conversely, a graph database looks only at records that are directly connected to other records. If it is given a limit on how many "hops" it is allowed to make, it can ignore everything more than that number of hops away.
28
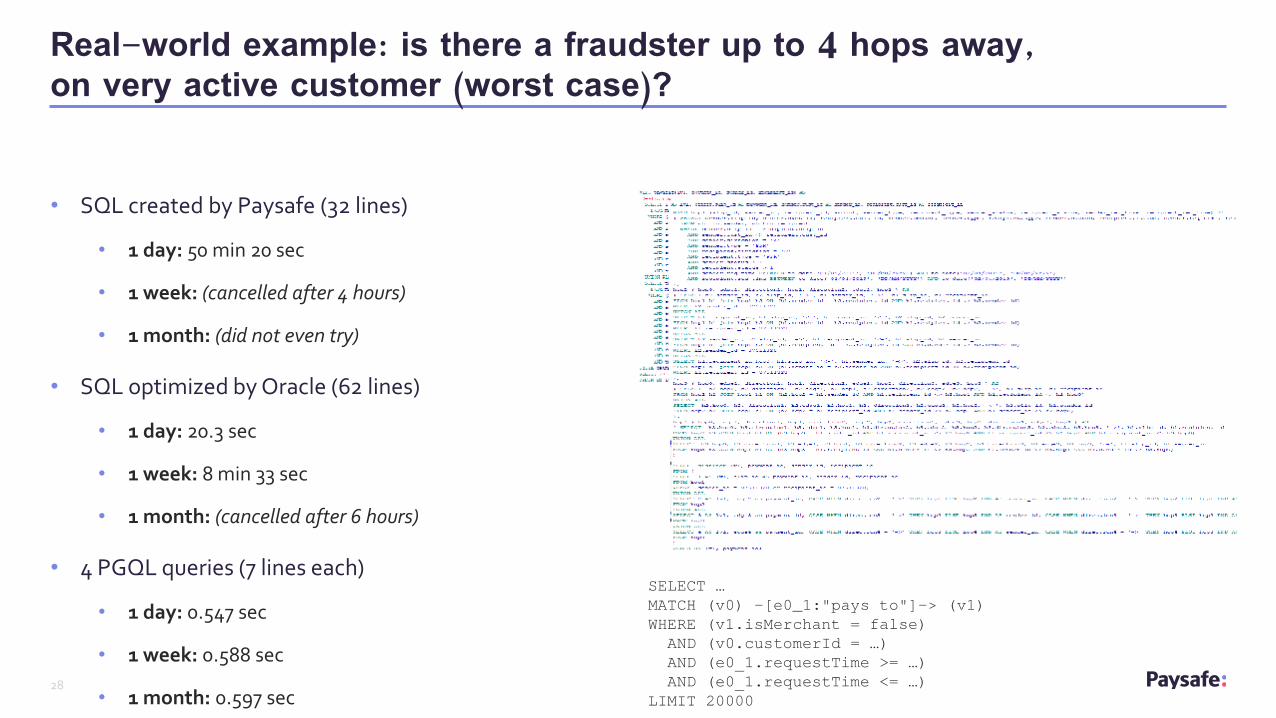
• SQL created by Paysafe (32 lines)
• 1 day: 50 min 20 sec
• 1 week: (cancelled after 4 hours)
• 1 month: (did not even try)
• SQL optimized by Oracle (62 lines)
• 1 day: 20.3 sec
• 1 week: 8 min 33 sec
• 1 month: (cancelled after 6 hours)
• 4 PGQL queries (7 lines each)
• 1 day: 0.547 sec
• 1 week: 0.588 sec
• 1 month: 0.597 sec
Real-world example: is there a fraudster up to 4 hops away, on very active customer (worst case)?
SELECT …
MATCH (v0) -[e0_1:"pays to"]-> (v1)
WHERE (v1.isMerchant = false)
AND (v0.customerId = …)
AND (e0_1.requestTime >= …)
AND (e0_1.requestTime <= …)
LIMIT 20000
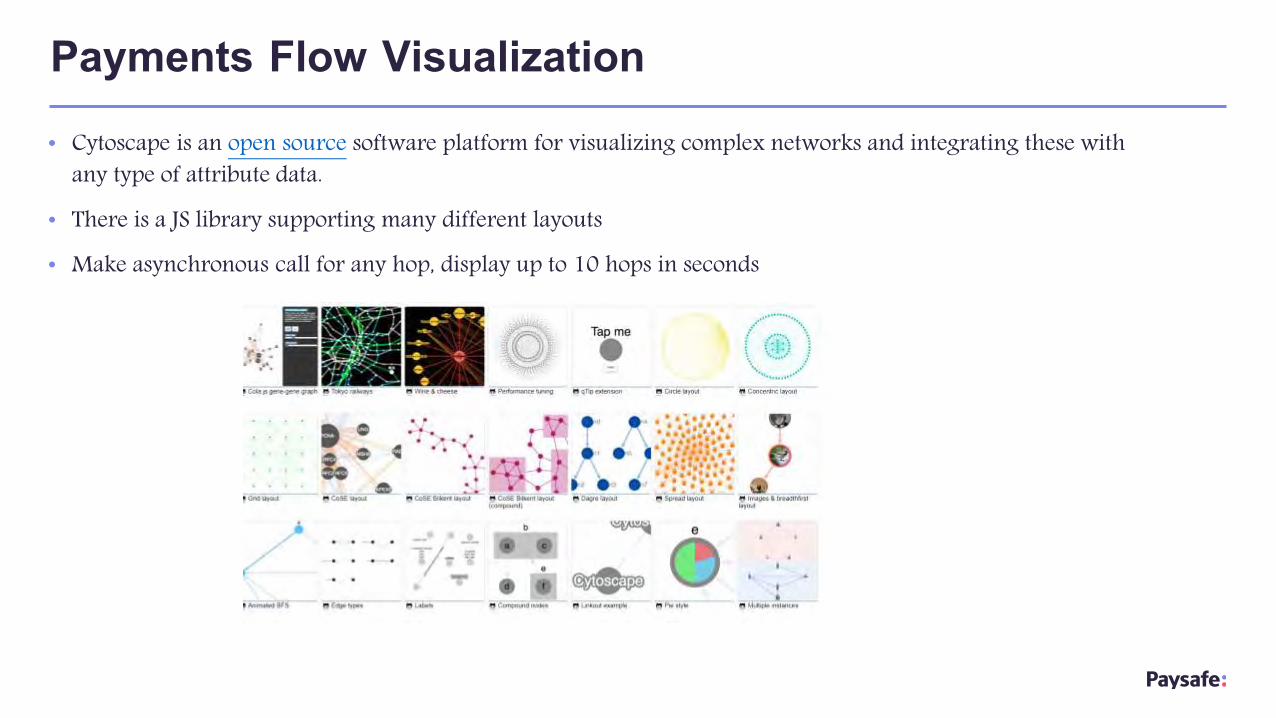
Payments Flow Visualization• Cytoscape is an open source software platform for visualizing complex networks and integrating these with
any type of attribute data.• There is a JS library supporting many different layouts• Make asynchronous call for any hop, display up to 10 hops in seconds
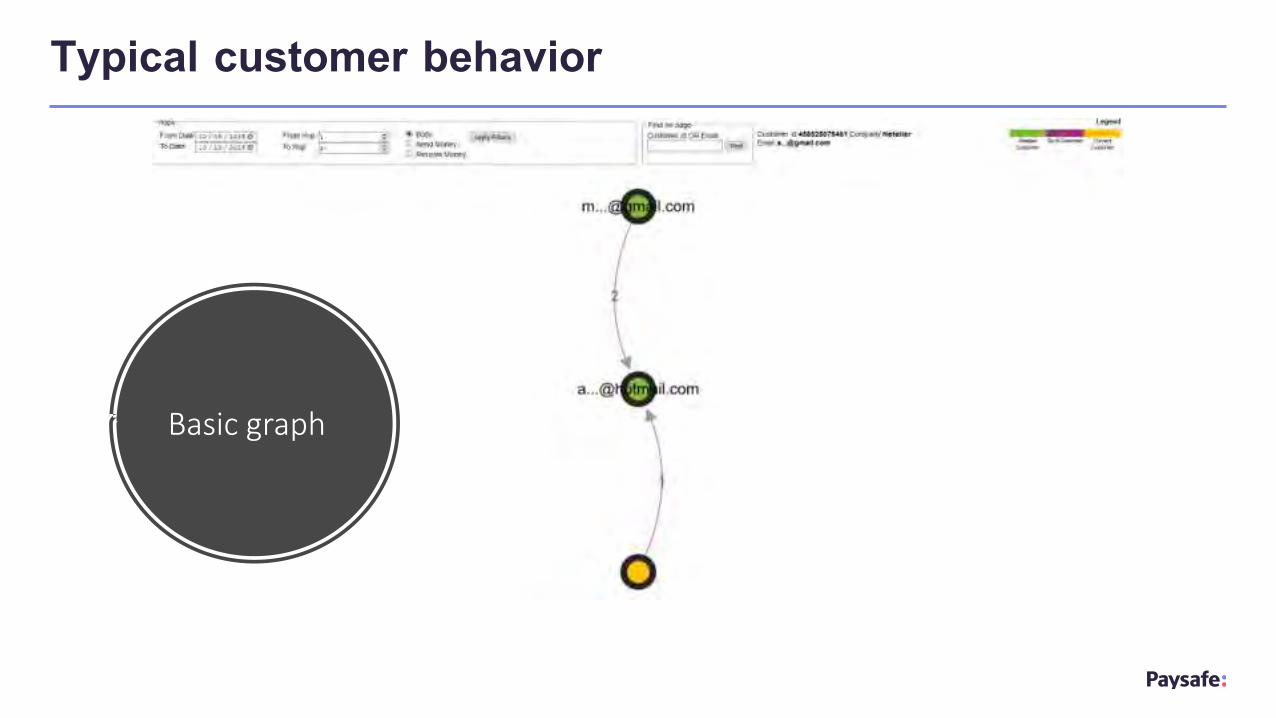
Typical customer behavior
Basic graph
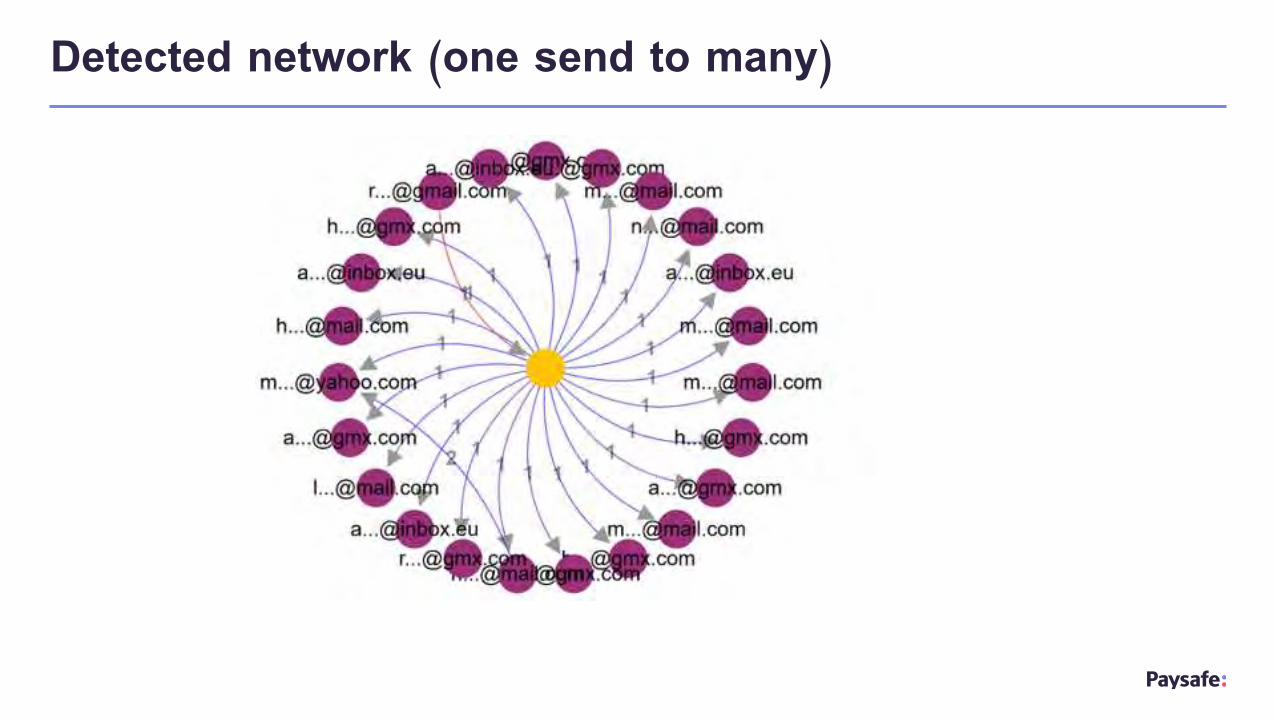
Detected network (one send to many)
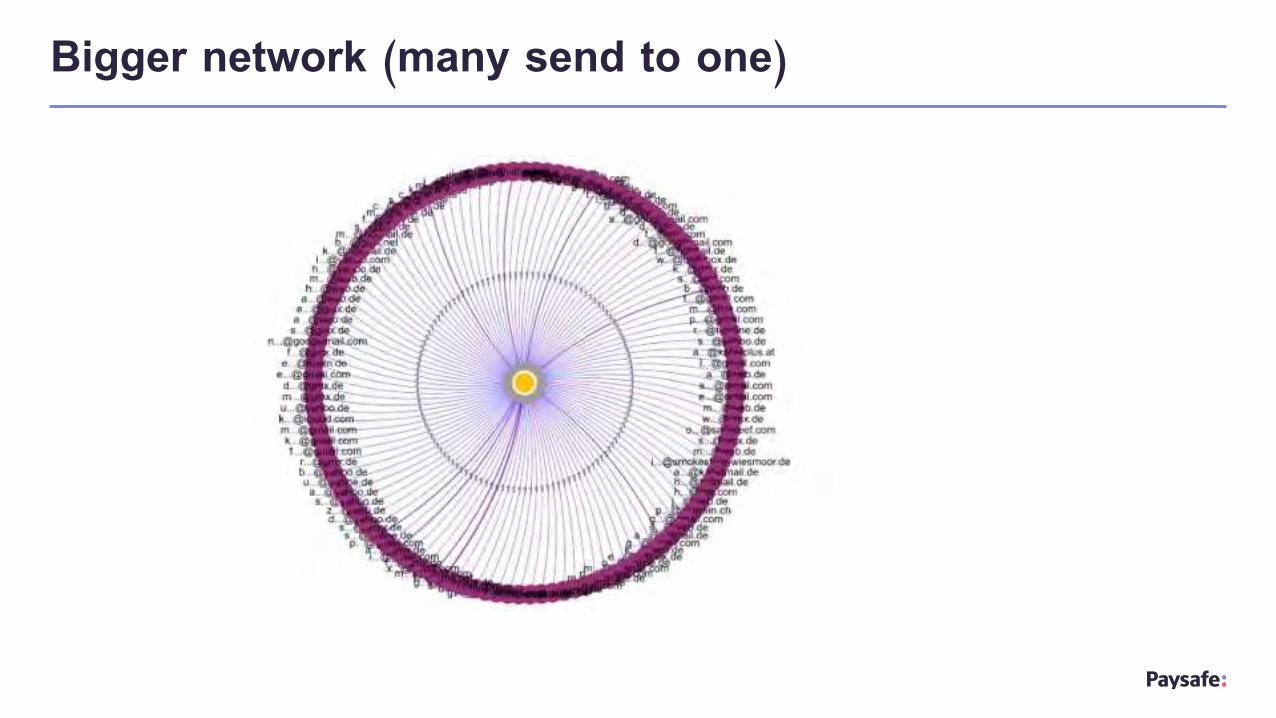
Bigger network (many send to one)
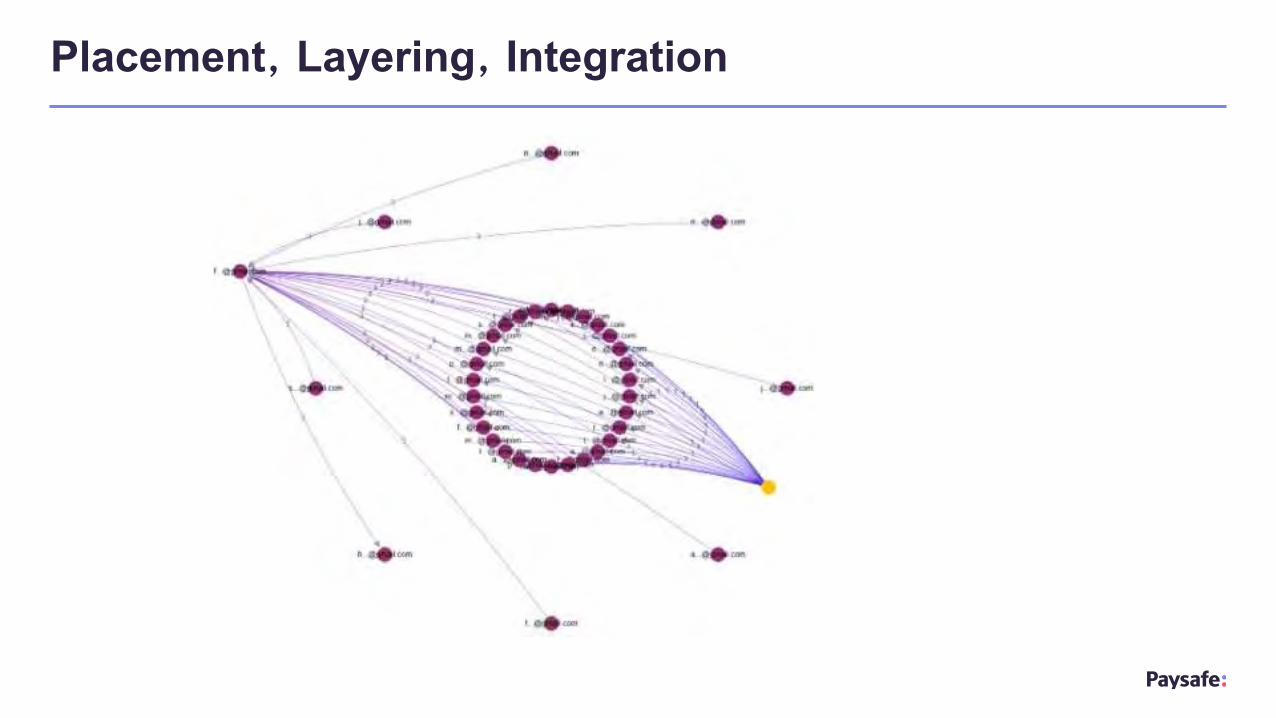
Placement, Layering, Integration
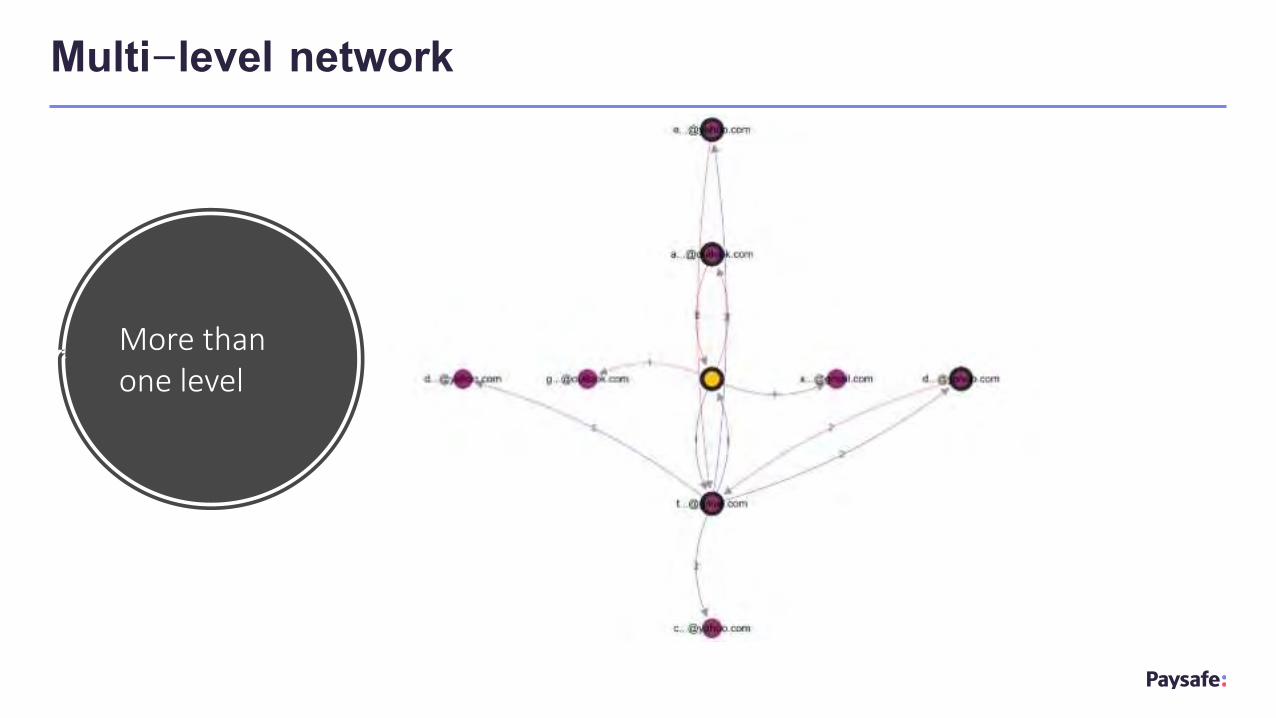
Multi-level network
More than one level
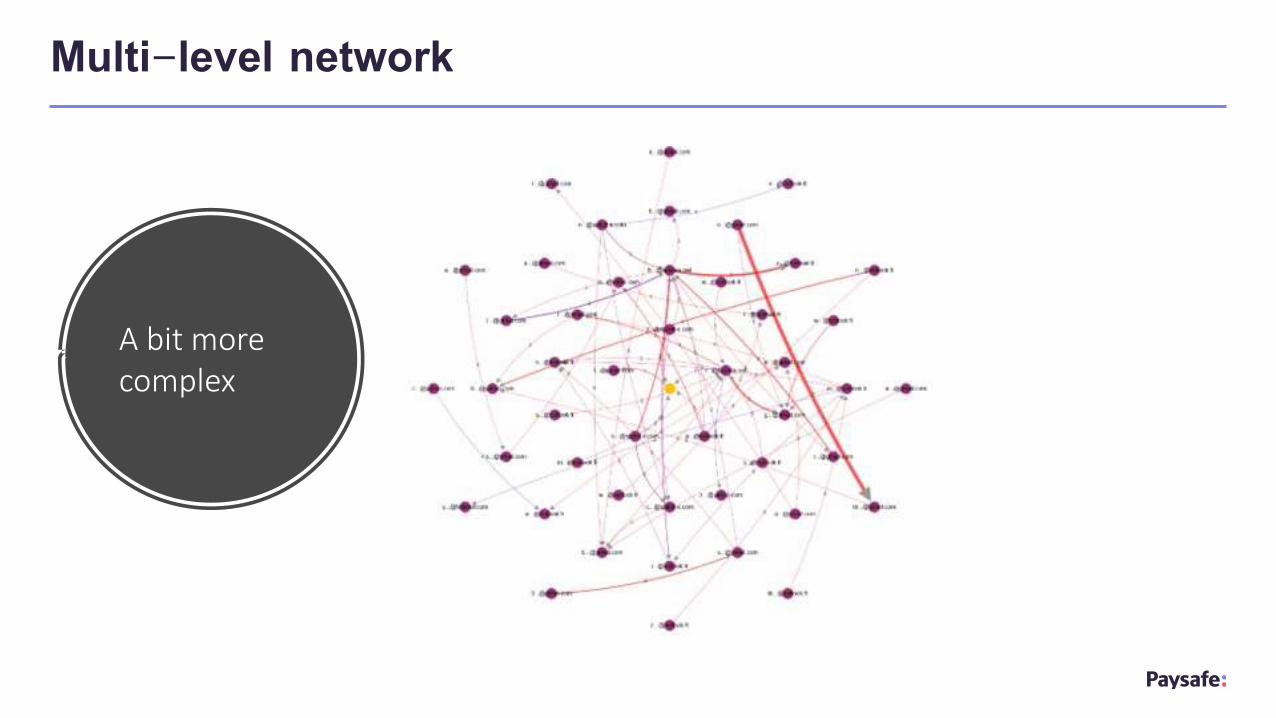
Multi-level network
A bit more complex
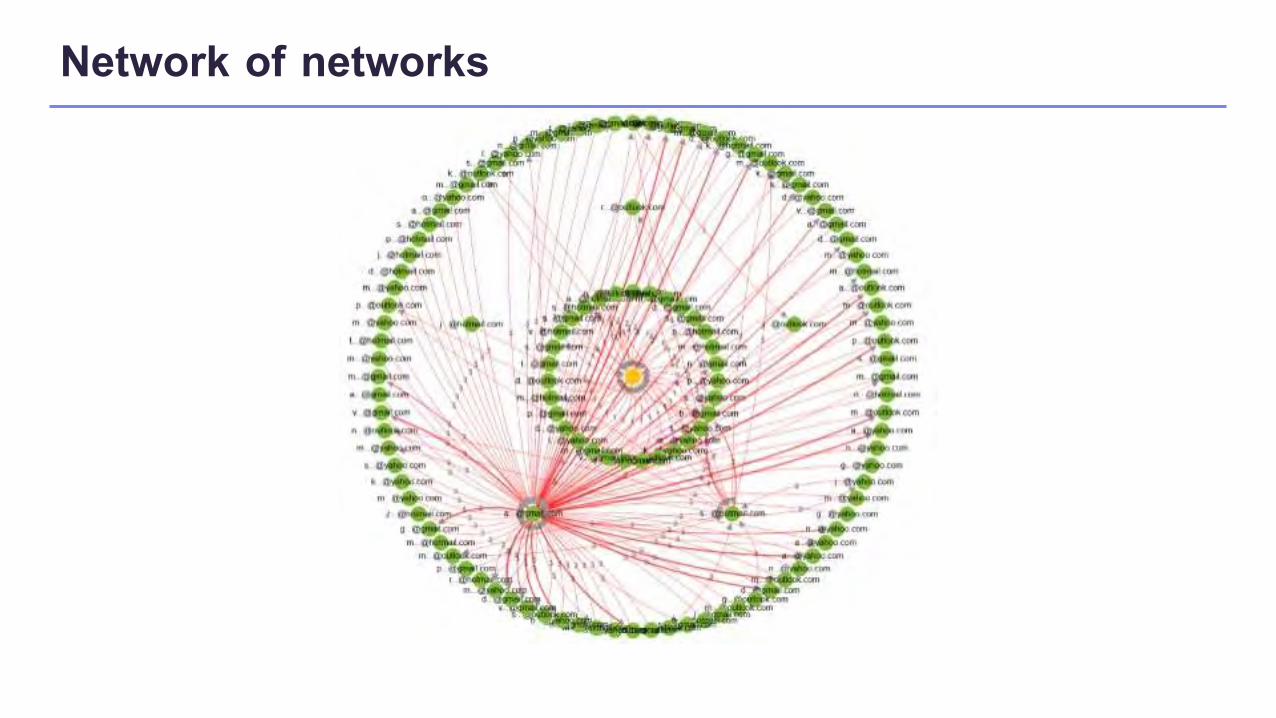
Network of networks
• Page rank
• Community detection
• Strongly connected components
• More built-in algorithms available
• Custom-defined algorithms with Green Marl
Graph Analytics
44
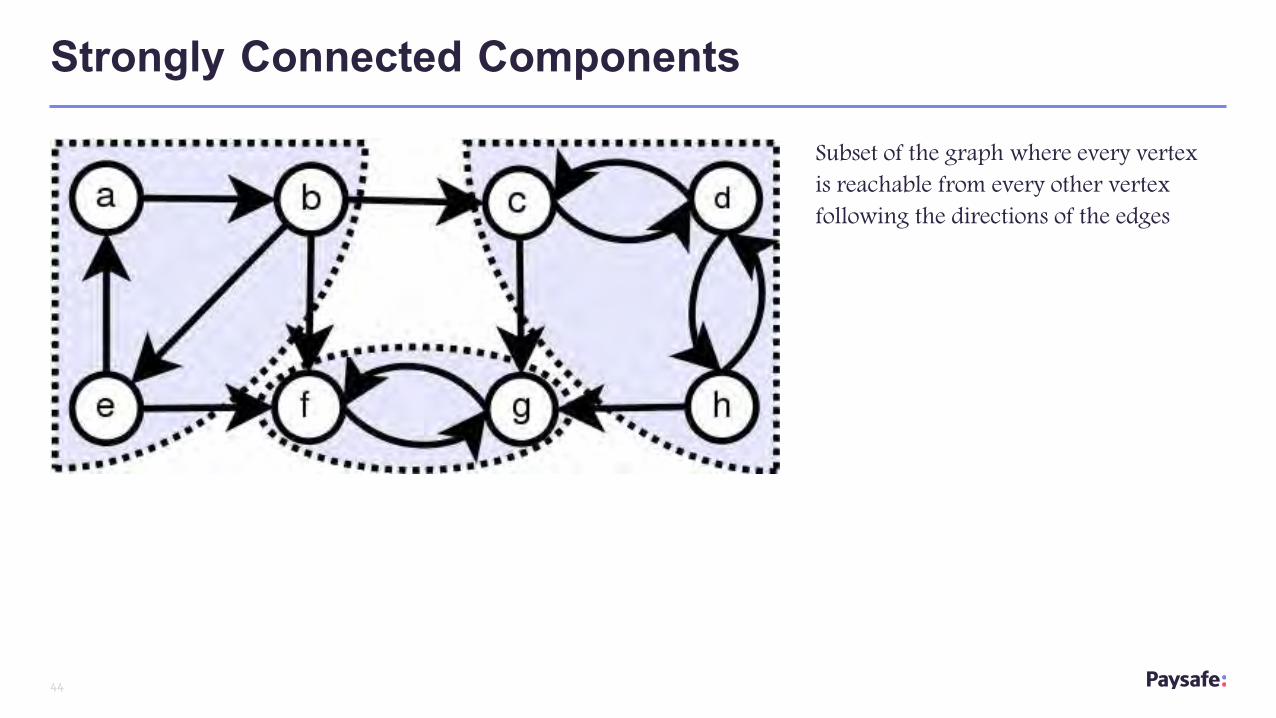
Subset of the graph where every vertex is reachable from every other vertex following the directions of the edges
Strongly Connected Components
45
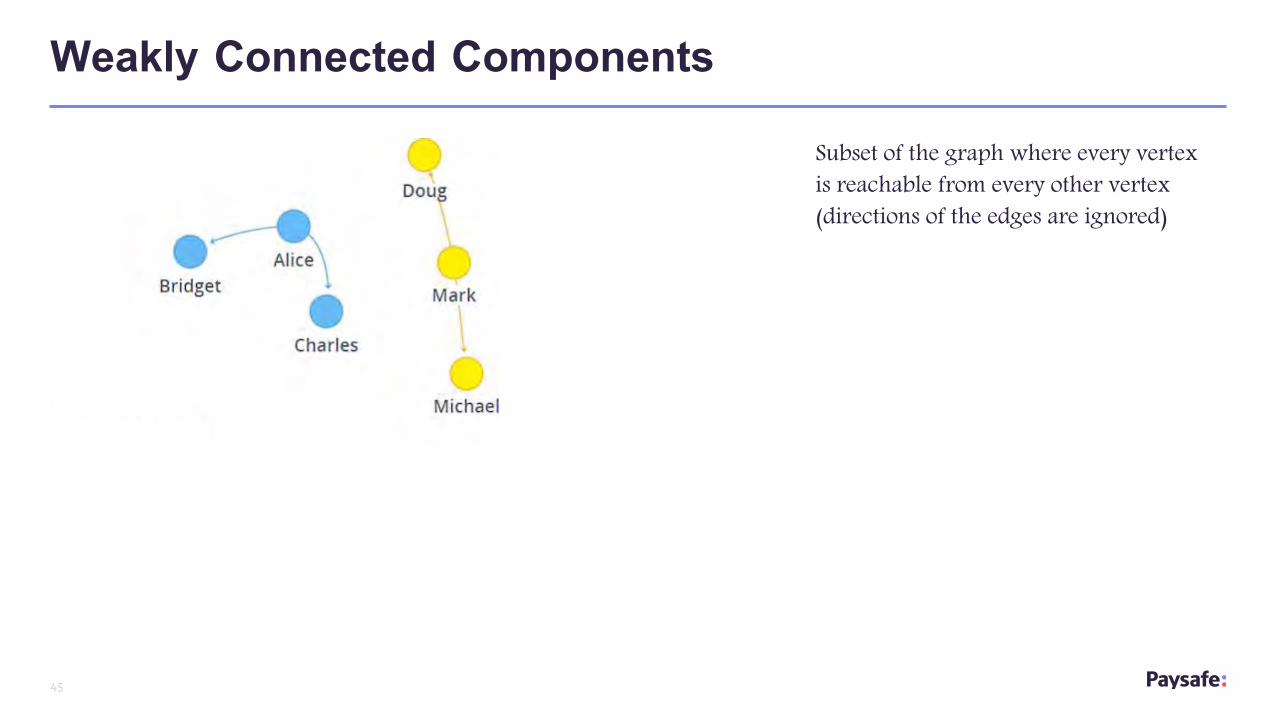
Subset of the graph where every vertex is reachable from every other vertex (directions of the edges are ignored)
Weakly Connected Components
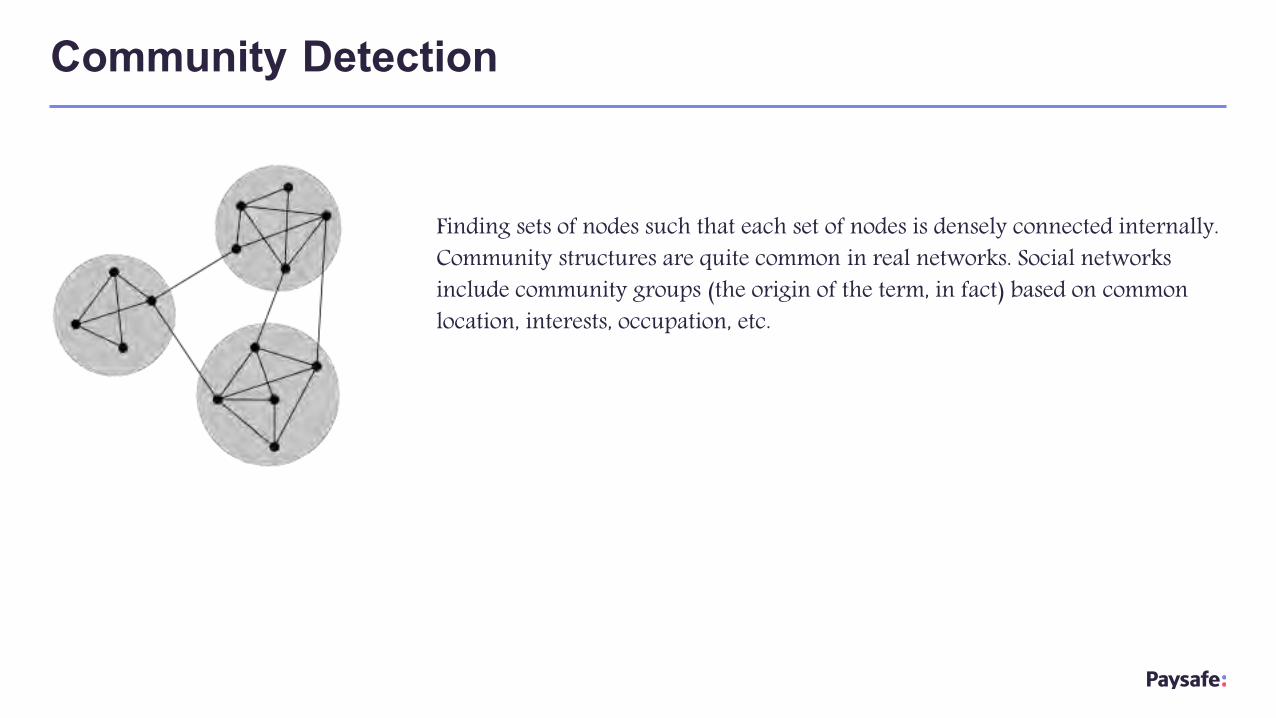
Finding sets of nodes such that each set of nodes is densely connected internally. Community structures are quite common in real networks. Social networks include community groups (the origin of the term, in fact) based on common location, interests, occupation, etc.
Community Detection
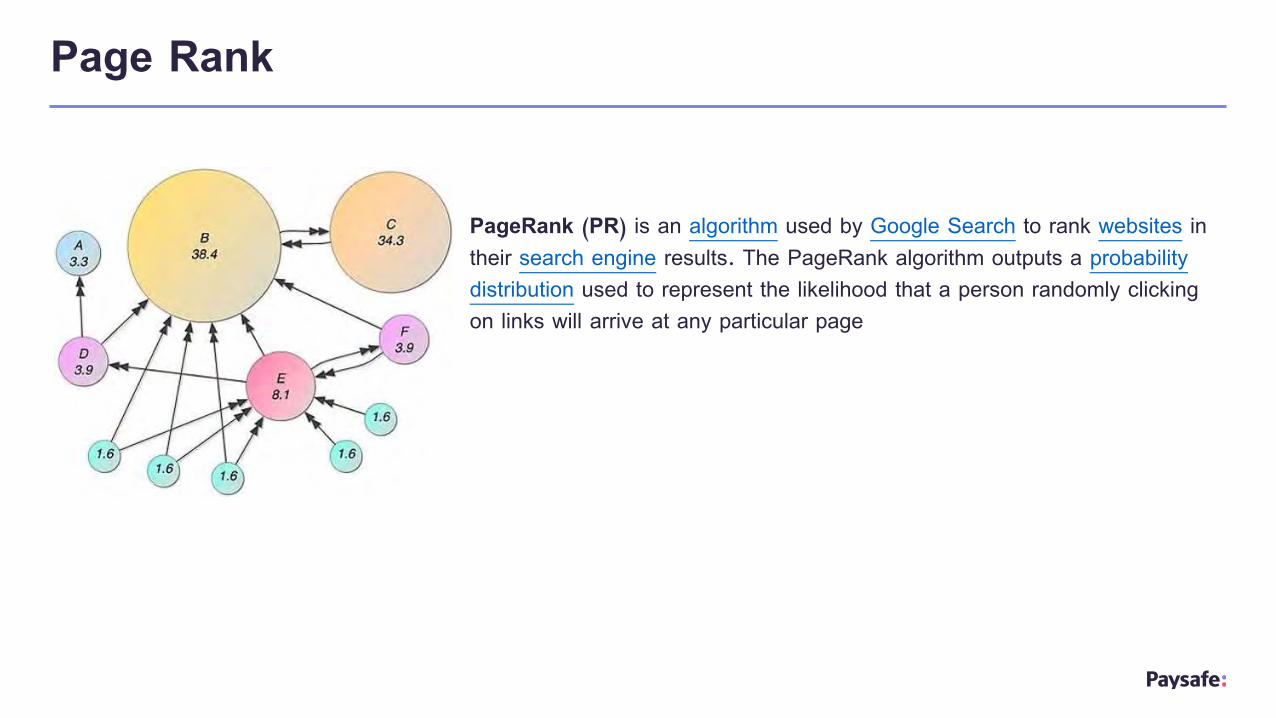
PageRank (PR) is an algorithm used by Google Search to rank websites in their search engine results. The PageRank algorithm outputs a probability distribution used to represent the likelihood that a person randomly clicking on links will arrive at any particular page
Page Rank
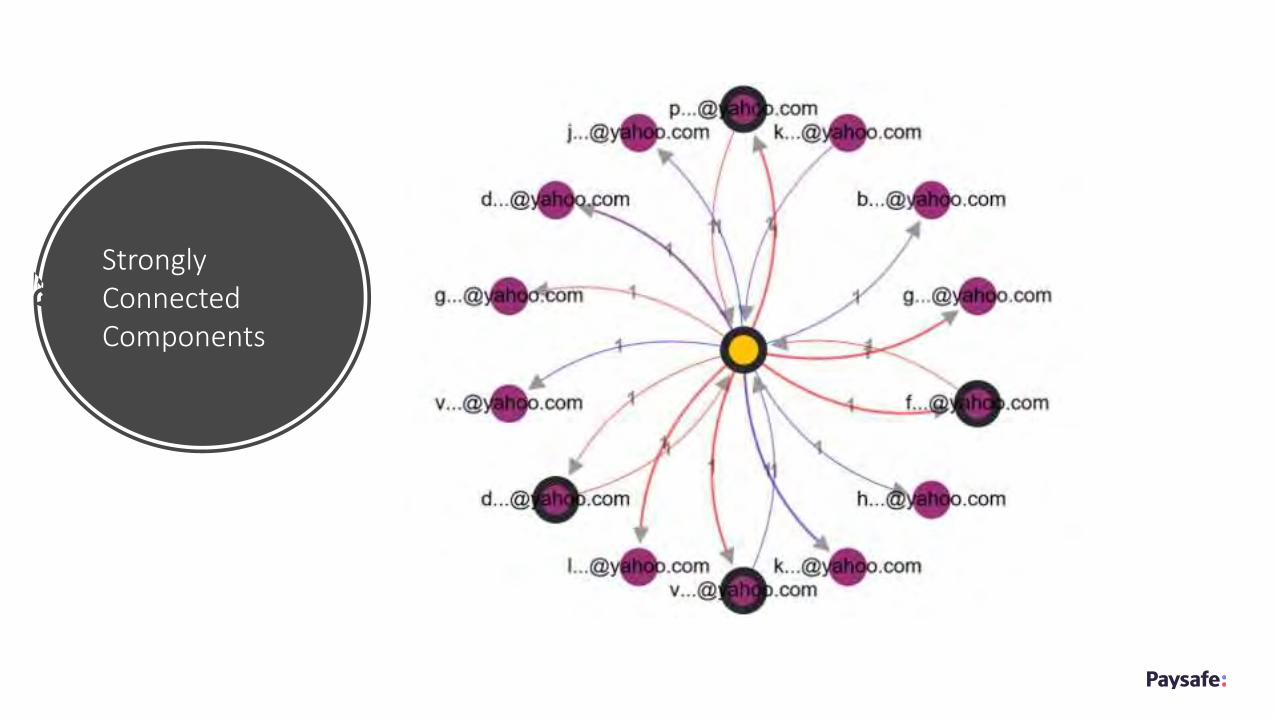
Strongly Connected Components
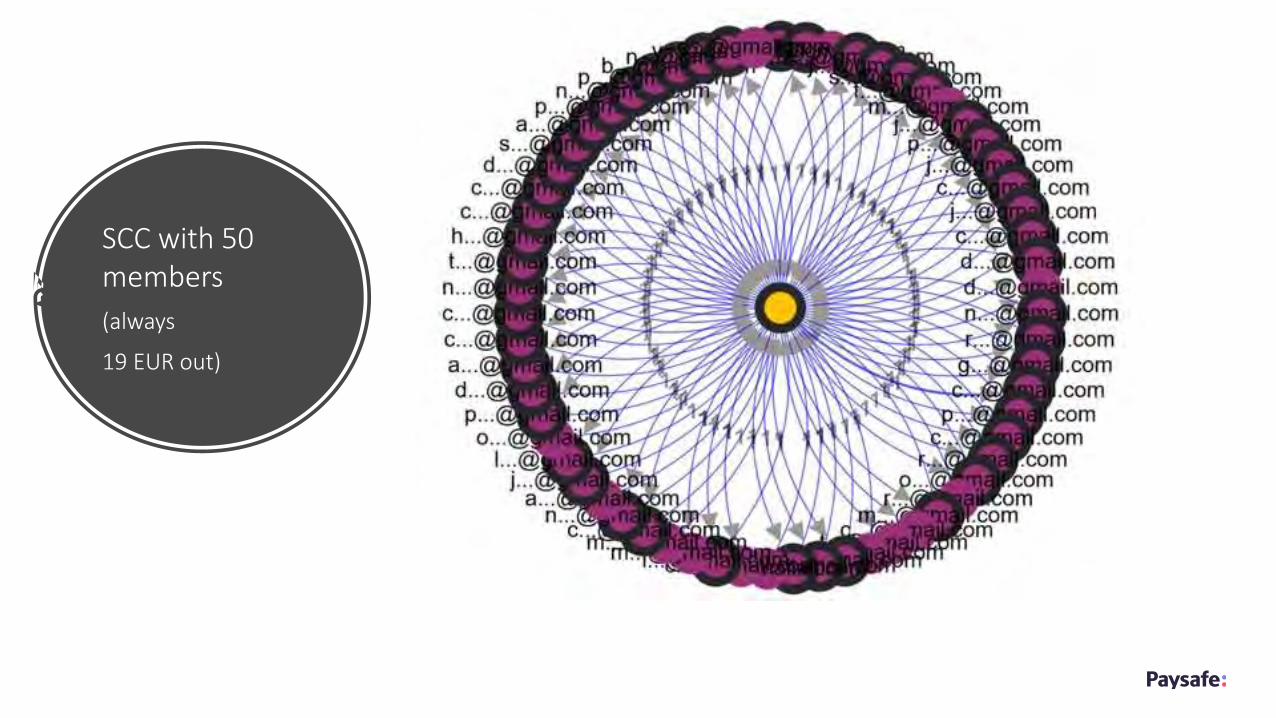
SCC with 50 members
(always
19 EUR out)
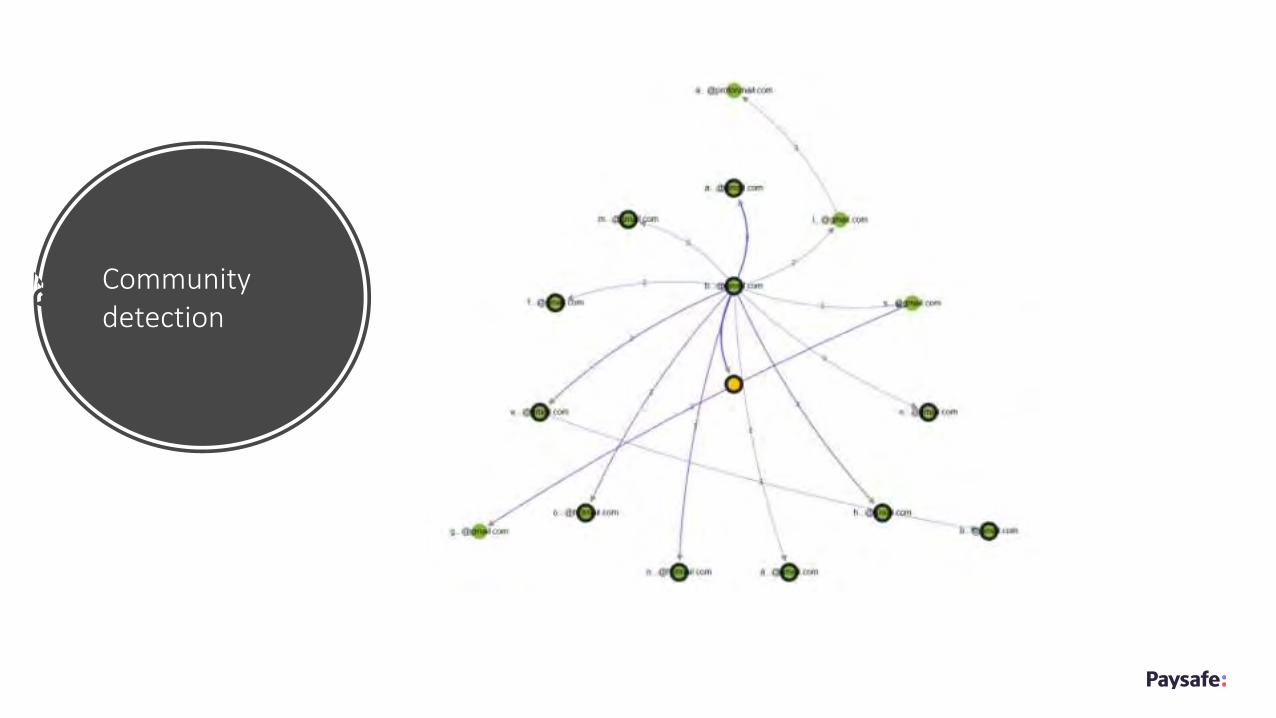
Community detection
The right tool for the right job
• Payments are in the graph
• Deposits and Withdrawals are in the RDBMS
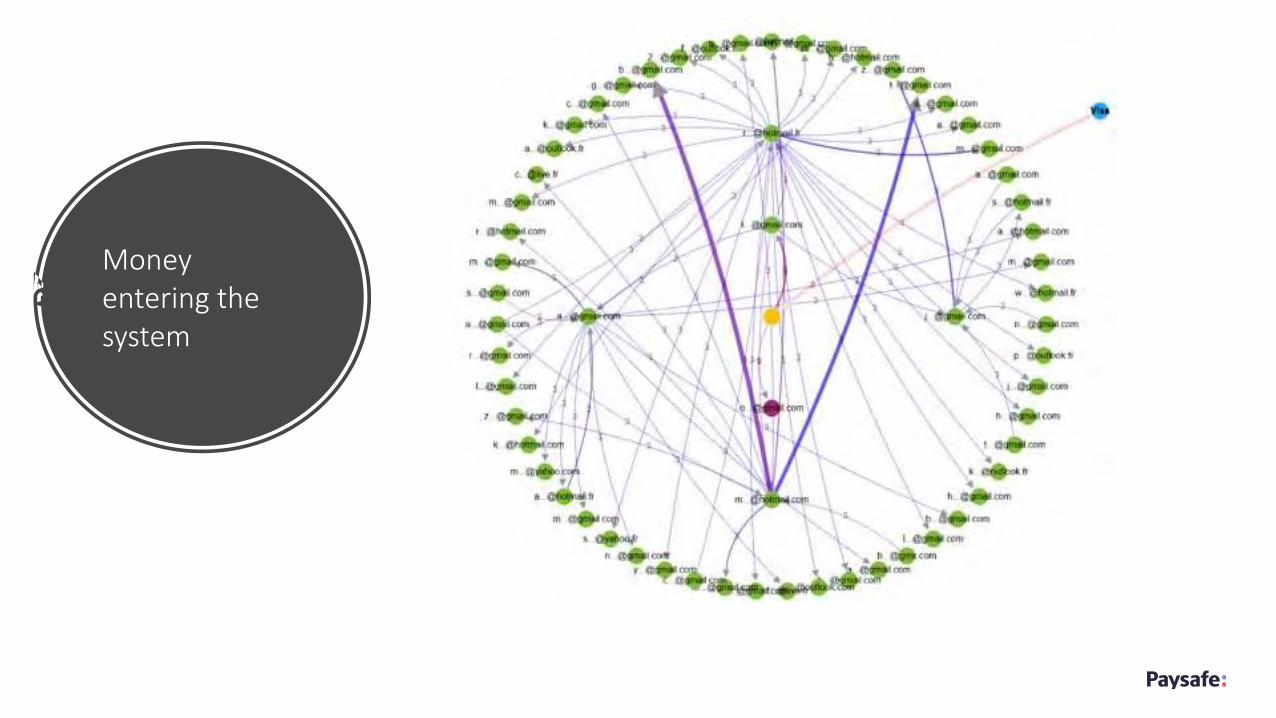
Money entering the system
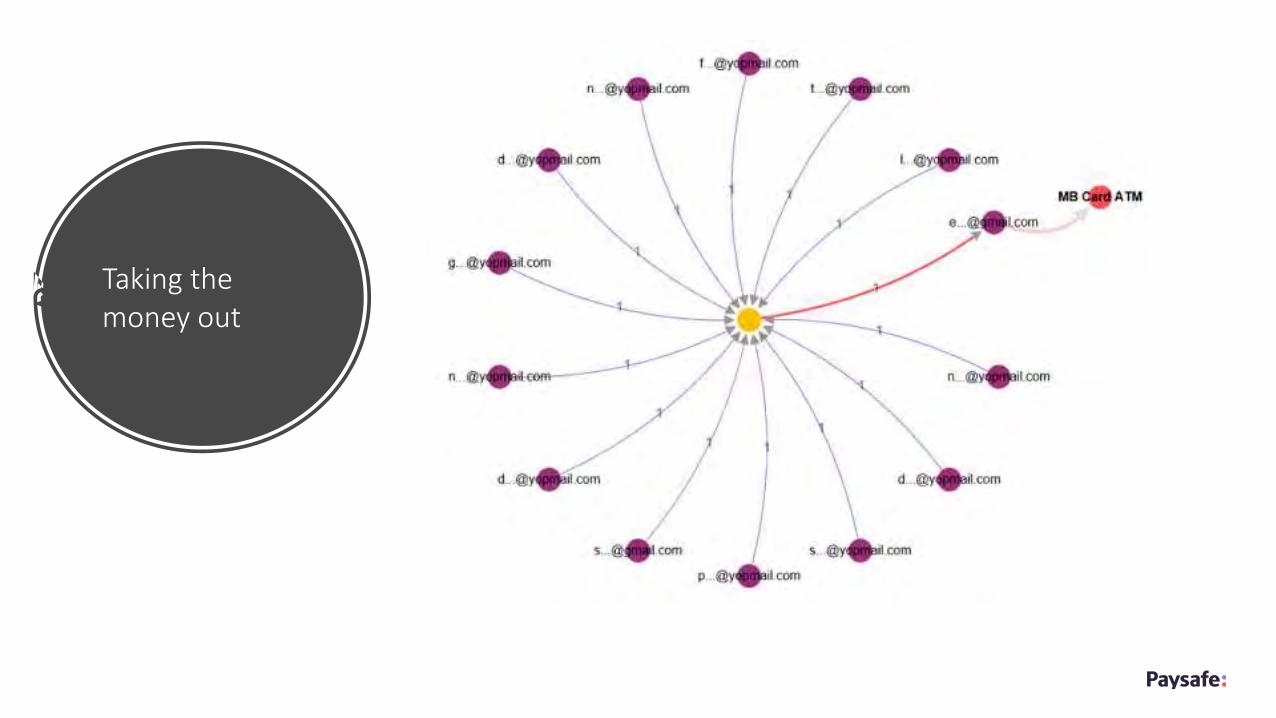
Taking the money out
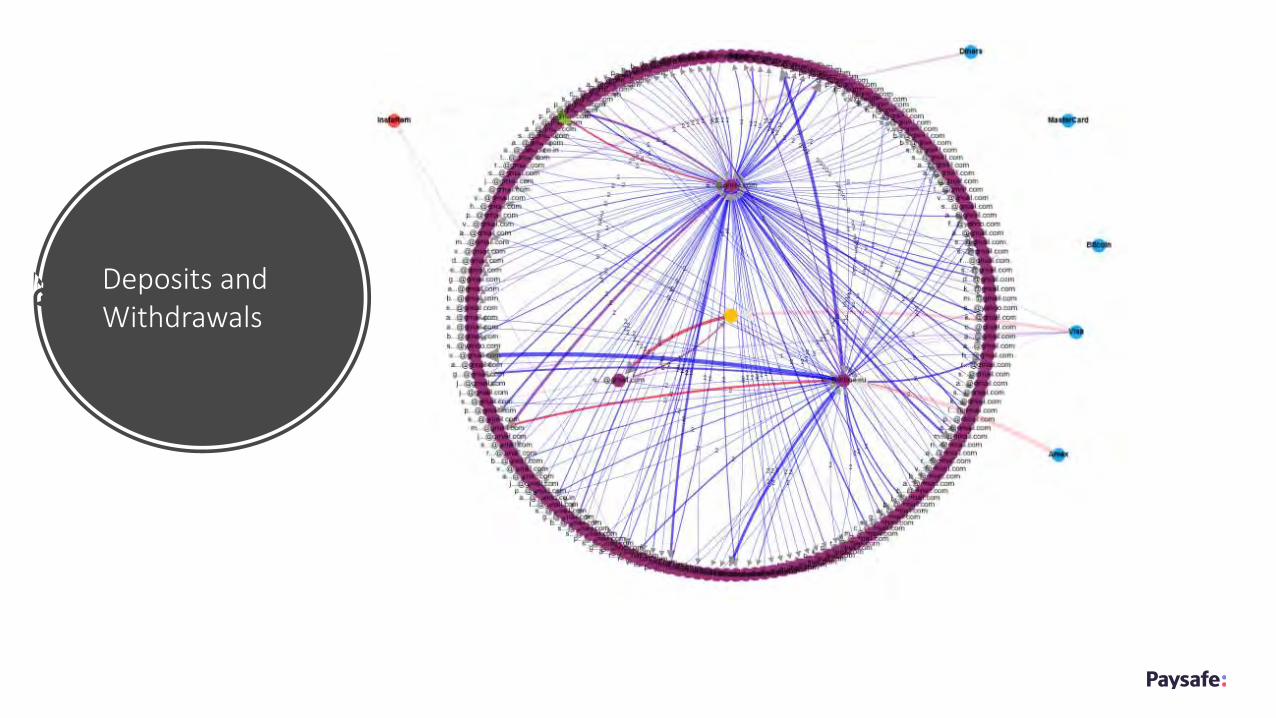
Deposits and Withdrawals
56
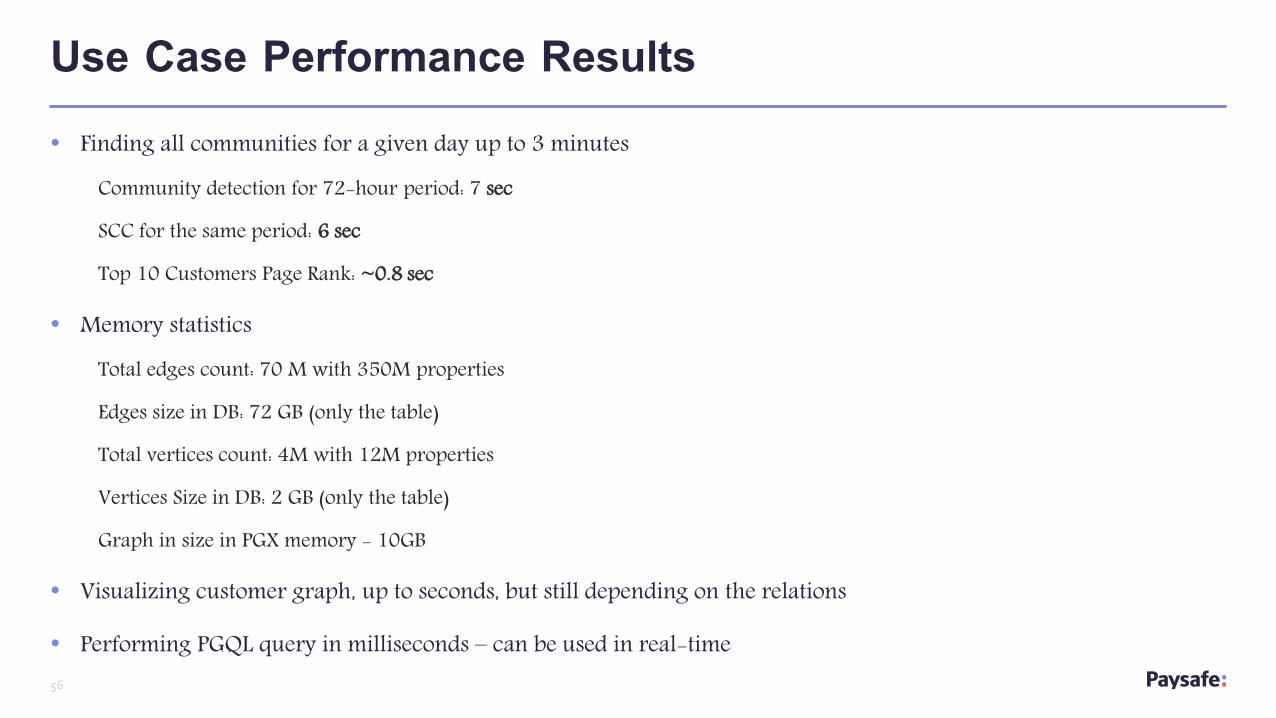
• Finding all communities for a given day up to 3 minutesCommunity detection for 72-hour period: 7 sec
SCC for the same period: 6 sec
Top 10 Customers Page Rank: ~0.8 sec
• Memory statisticsTotal edges count: 70 M with 350M properties
Edges size in DB: 72 GB (only the table)
Total vertices count: 4M with 12M properties
Vertices Size in DB: 2 GB (only the table)
Graph in size in PGX memory - 10GB
• Visualizing customer graph, up to seconds, but still depending on the relations
• Performing PGQL query in milliseconds – can be used in real-time
Use Case Performance Results
63
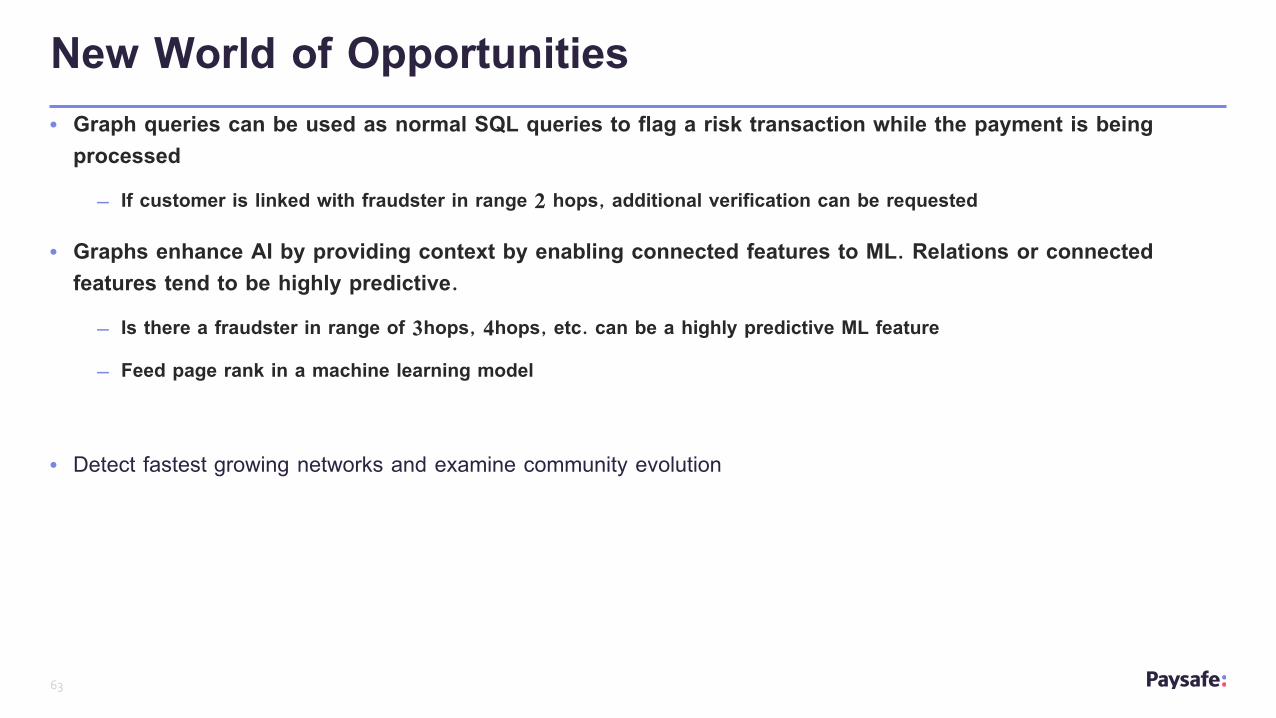
• Graph queries can be used as normal SQL queries to flag a risk transaction while the payment is being processed– If customer is linked with fraudster in range 2 hops, additional verification can be requested
• Graphs enhance AI by providing context by enabling connected features to ML. Relations or connected features tend to be highly predictive.– Is there a fraudster in range of 3hops, 4hops, etc. can be a highly predictive ML feature– Feed page rank in a machine learning model
• Detect fastest growing networks and examine community evolution
New World of Opportunities
64
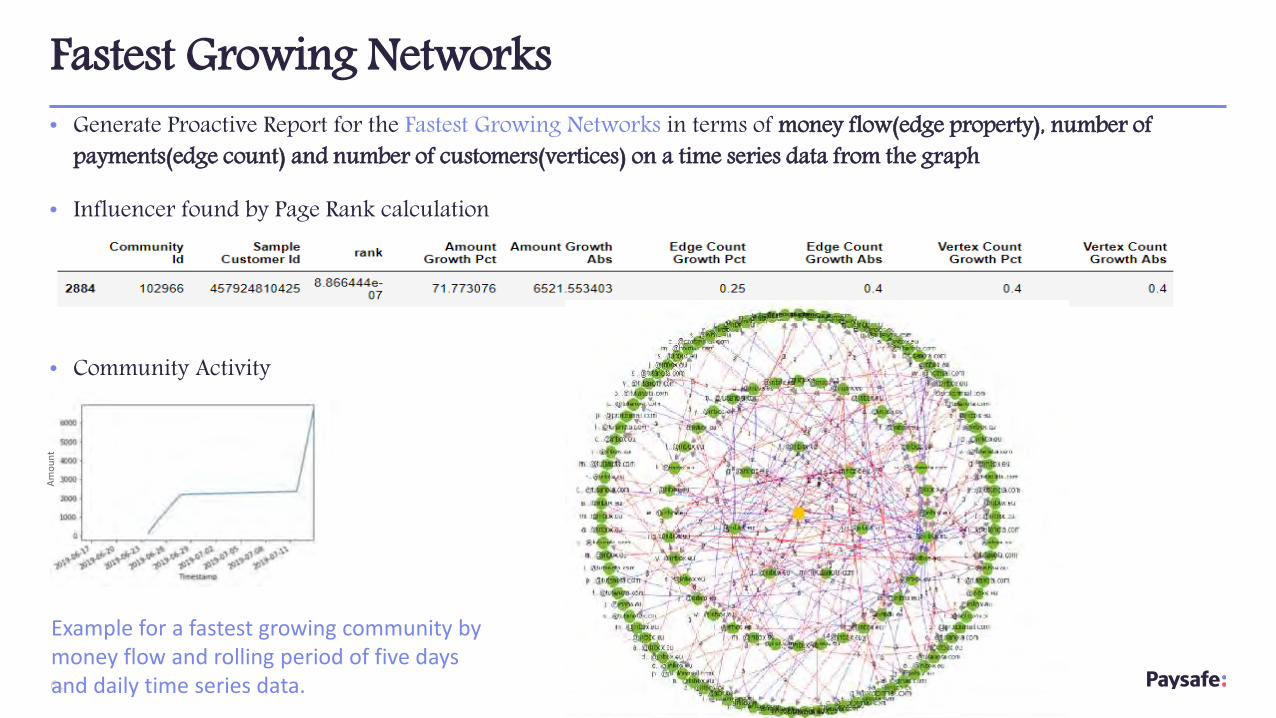
• Generate Proactive Report for the Fastest Growing Networks in terms of money flow(edge property), number of payments(edge count) and number of customers(vertices) on a time series data from the graph
• Influencer found by Page Rank calculation
• Community Activity
Fastest Growing Networks
Example for a fastest growing community by money flow and rolling period of five days and daily time series data.
Am
ou
nt
Graphs are REALLY powerful
Image courtesy www.networkworld.com
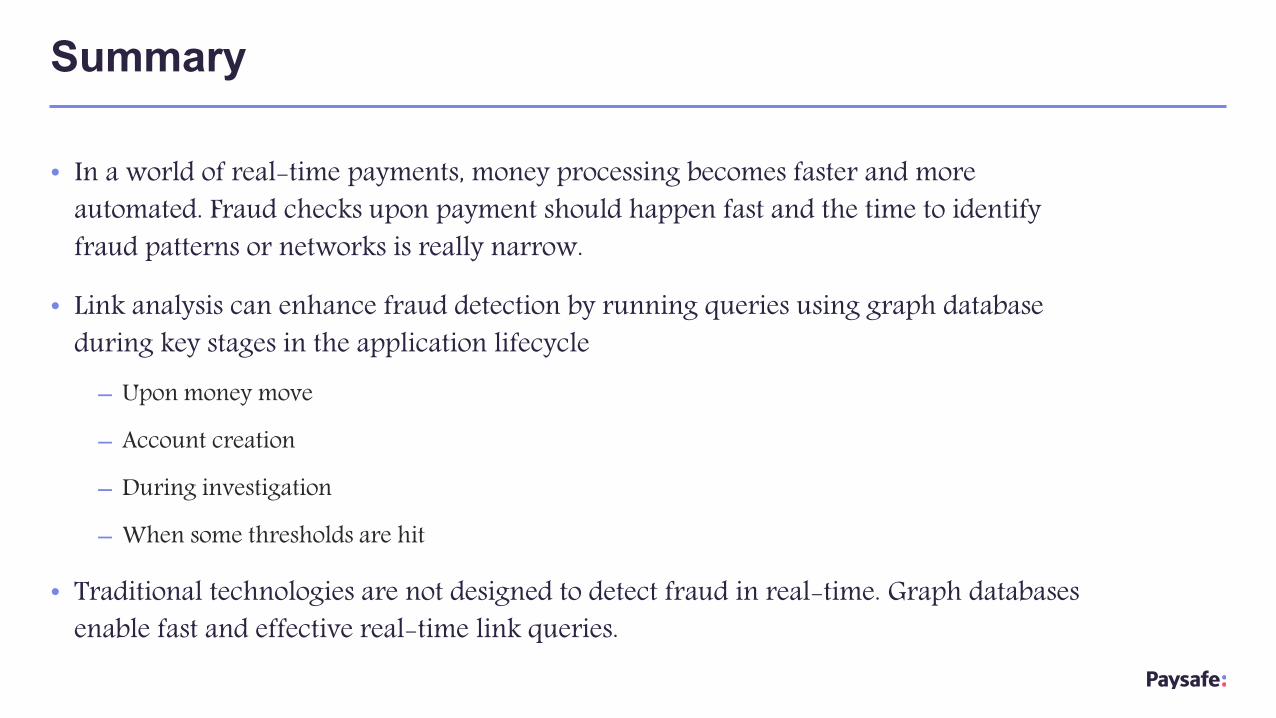
• In a world of real-time payments, money processing becomes faster and more automated. Fraud checks upon payment should happen fast and the time to identify fraud patterns or networks is really narrow.
• Link analysis can enhance fraud detection by running queries using graph database during key stages in the application lifecycle– Upon money move– Account creation– During investigation– When some thresholds are hit
• Traditional technologies are not designed to detect fraud in real-time. Graph databases enable fast and effective real-time link queries.
Summary
• Graphs are useful for real-time decision making on connected data
• Powerful data analytics
• Go step further with machine learning models
• You can do so much AI with Graph
Takeaways
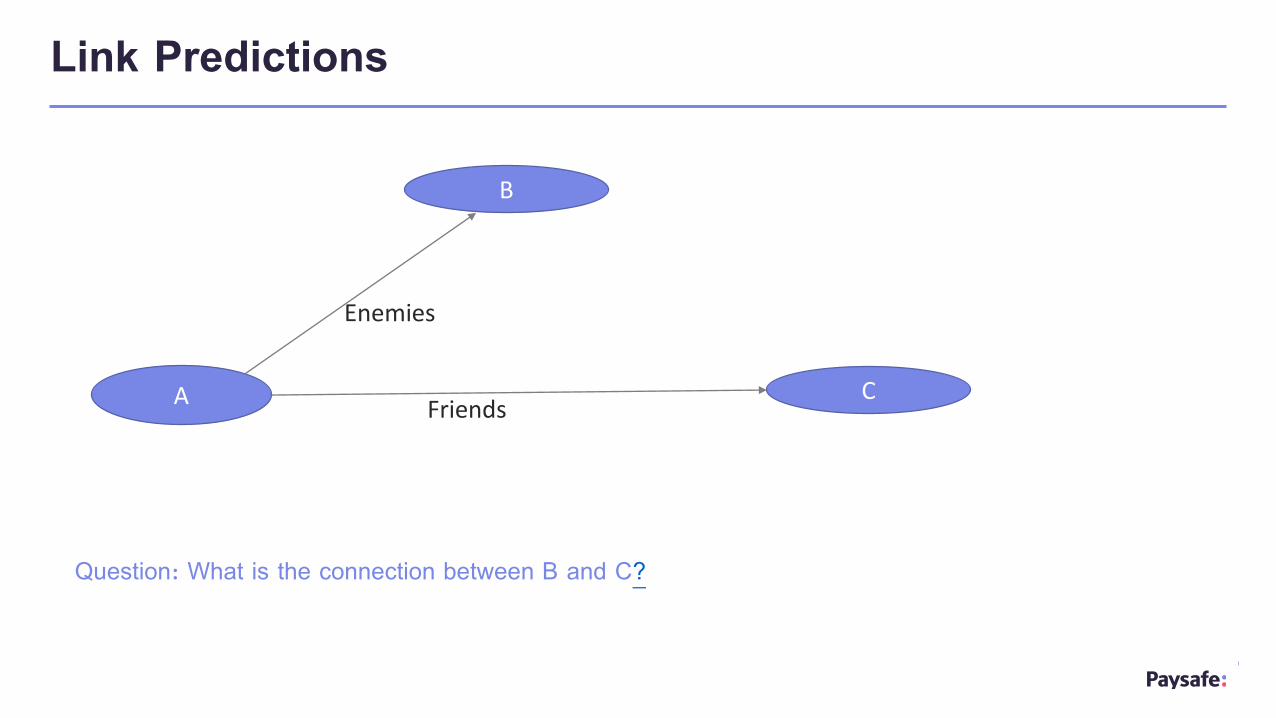
Link Predictions
A
B
C
Enemies
Friends
Question: What is the connection between B and C?

Link Predictions
A
B
C
Enemies
Friends
Question: What is the connection between B and C?
ResourcesO’Reilly’s Graph Databases: New Opportunities for Connected DataO’Reilly’s Graph Algorithms BookGraph Databases: The Next Generation of Fraud Detection TechnologyCypher – graph query languageOracle Property Graph Query LanguageLink PredictionGraph Theory with Applications
Very interesting talk:How Graph Technology Is Changing Artificial Intelligence and Machine Learning